
— WMP and other imports accelerate, cow-less lab-protein analogs become ‘extenders,’
— Class I sales keep declining, fresh Italian cheese production down, inflation drives CPGs to reduce unit-sizes,
— RNG-driven dairy construction accelerates concentrated growth in cheese-heavy Central U.S.
By Sherry Bunting, Farmshine June 30, 2023
EAST EARL, Pa. — Current milk futures and dairy commodity markets have turned sharply lower and signal a rocky road ahead for farm level milk prices. Because of the lag times built into federal milk pricing, the most recent steep losses in spot cheese markets will hit the Class III price and create more Class I mover losses via the ‘average of’ method to hit milk checks in July, August and September.
Factors driving this include: declining Class I sales and fresh Italian cheese production, inflation-driven unit-size shrinkage, two months of reduced dairy exports and five months of increased dairy imports, and the advertising of cow-less lab-protein analogs as ‘extenders’ for food processing.
The May Milk Production Report confirmed that the Central U.S. is, indeed, “awash in milk.” Part two of this series will zoom into the geographic shifts in the concentration of milk growth, driven largely by Renewable Natural Gas digester projects for the California RNG gold rush. Much of the new dairy construction in the cheese-heavy Central U.S. is focused on manure to energy, not necessarily on milk and cheese to consumers.
The Production Report was released after the futures closed on June 21. In the next four trading sessions from June 22 through 27, Class III contracts for July through September lost $1.50 per cwt, on top of previous losses of more than $2.
By June 28, the expiring June Class III milk futures contract was at $14.92, and at $14.91 in the June USDA announced.
The ‘market’ has simply ignored USDA’s May 30 announcement that the government will bring in a ‘game changer’ to purchase 47 million pounds of cheese for food banks and schools as block and barrel cheese plunged to $1.31 and $1.39 per pound, respectively, by Tues., June 27.
USDA confirmed last week that the first round of its bid solicitations for the first phase of the 47 million pound cheese purchase won’t open until October. Bids and deliveries will come in stages from fourth quarter 2023 through mid-2024.
This means cheap milk will make cheap cheese, which could get even cheaper if inventories build in anticipation of selling that cheese at a tidy profit into the seasonal demand increases that begin in October, along with these announced government cheese purchases. (Who needs a make-allowance raise with this game in town?)
For the past several weeks, USDA Dairy Market News has been reporting spot loads of milk in the Central U.S. selling as much as $11 per cwt below the Class III price. DMN also reports milk from the Central U.S. growth region is moving farther to find a home. We are also hearing from readers about substantial milk being dumped in the Midwest, while a few independent dairies in Minnesota, one milking over 1000 cows, have been told by their creamery that their milk is not needed after schools close.
May milk production, nationwide, was up only 0.6% from a year ago. The 24 major monthly states were up by 0.8%. Milk cow numbers did not grow from April to May and are running just 13,000 head above year ago. This modest increase comes on the heels of no net gain in milk production for 2022.
All year, the monthly USDA World Ag Supply and Demand Estimates (WASDE) kept increasing the 2023 U.S. milk production forecasts, based on what it said are ‘more milk cows and less output per cow.’ The most recent WASDE walked that production forecast back a bit, but still expects U.S. dairies will milk an average of 9.415 million cows in 2023.
Then, somehow, the May Production Report pegged the number of milk cows on farms at 9.424 million head, even after the loss of 18,000 milk cows in a fire in west Texas in April. This is how tight the figuring has become on what we are told today is a surplus of milk and a lackluster demand.
The idea of a milk surplus that is big enough to drive these current price losses does not line up with USDA’s Jan. 1 cattle inventory report. So, in May, the WASDE began to walk it back, noting higher feed costs, reduced milk margins and higher beef cattle prices will slow the flow of milk.
Where are the cattle coming from? The Jan. 2023 inventory showed milk cow numbers were virtually unchanged from Jan. 2022 at 9.4 million head. The number of dairy heifers over 500 pounds was down 2% at 4.337 million head — the lowest number since 2006. Within that heifer number, expected calvings from Jan. 1, 2023 to Jan. 1, 2024 were also 2% lower than for Jan. 2022 to Jan. 2023. The next semi-annual cattle inventory report will be released in three weeks on July 21.
The Report’s smaller dairy replacement inventory is believable given the fact that offerings have been selling $300 to $500 per head above year ago levels, and the few weekly dairy cattle auctions throughout the U.S. have seen offerings down 30% below year ago… until June, when prices came under pressure on a suddenly increased offering at auctions over the past two weeks.
Meanwhile, dairy cow slaughter rates are also increasing, according to USDA, especially in the Midwest and Southwest, up 31 and 47% above year ago, respectively.
While the WASDE has forecast per-cow output to fall by 55 pounds per cow per month in 2023, the May Production Report pegged an 11-pound per-cow per month increase.
This means, it took just 13,000 more cows nationwide, and just 11 more pounds of milk output per cow per month to flip the switch to sharply lower milk prices based on – suddenly — too much milk? (Geographic concentration of milk growth plays into this equation, and we’ll discuss that in Part Two.)
In Part One, we look at the other supply and demand factors that are having a direct impact on where farm level milk prices are headed. These factors fill in the gaps left by the perplexing and contradictory sets of USDA dairy data.
I. Fresh fluid milk sales and fresh Italian cheese production both declined, pushing more available spring-flush milk into storable products.
Fluid milk sales January through April were down 2.8% from a year ago, and as bottlers slowed school packaging ahead of summer recess, the June 5th Dairy Products Report showed April production of fresh (made to order) Italian cheeses also declined 2.6% vs. year ago.
Meanwhile, butter production was down 4.9% while nonfat dry milk production increased just 1.9%, and skim milk powder production was down 22.4%. This put more of the available ‘spring flush’ milk into production of American cheese, up 2.3% vs. year ago in April, and the accompanying dry whey and whey protein concentrate production up 1.7 and 7.2%, respectively.
Record volumes of dry whey and cheese have been coming to the daily CME spot auction, driving down the spot prices that drive the National Dairy Product Sales Report prices that are then used in federal class and component pricing formulas.
II. Inflation pressures consumer demand, but inventories are not burdensome.
The May Cold Storage Report released on June 23 was a head-scratcher. Despite the ramped up American cheese production in the Dairy Products Report, the Cold Storage Report showed both the total amount of cheese in inventory, and the amount of American cheese in inventory, are both actually down 1% from a year ago at the end of May, while butter inventory was up 14% against last year’s higher-price-driving short supply.
Meanwhile, producers in the Midwest are being told that milk co-ops and buyers are facing cheese sales declines and that there’s not enough capacity to process all the milk now being produced in the region, with the existing capacity also experiencing labor and transport disruptions.
Dairy demand has stagnated, the analysts say, after months of high inflation. The May dairy consumer price index (CPI) was more bearish than the overall CPI. Dairy CPI was up 4.6%, with cheese up 3.6%, ice cream up 8% and other dairy products up 9.3% while whole milk decreased 3.4% and other non-whole milk increased 0.6%.
Inflationary pressure is driving some consumer packaged goods companies (CPGs) to trim unit-sizes for an appearance of stable consumer pricing. For example, we see unit-size shrinkage in cheese packages and slices. Not all American cheese slices today are 8 ounces, some are 6. Such moves effectively ration demand.
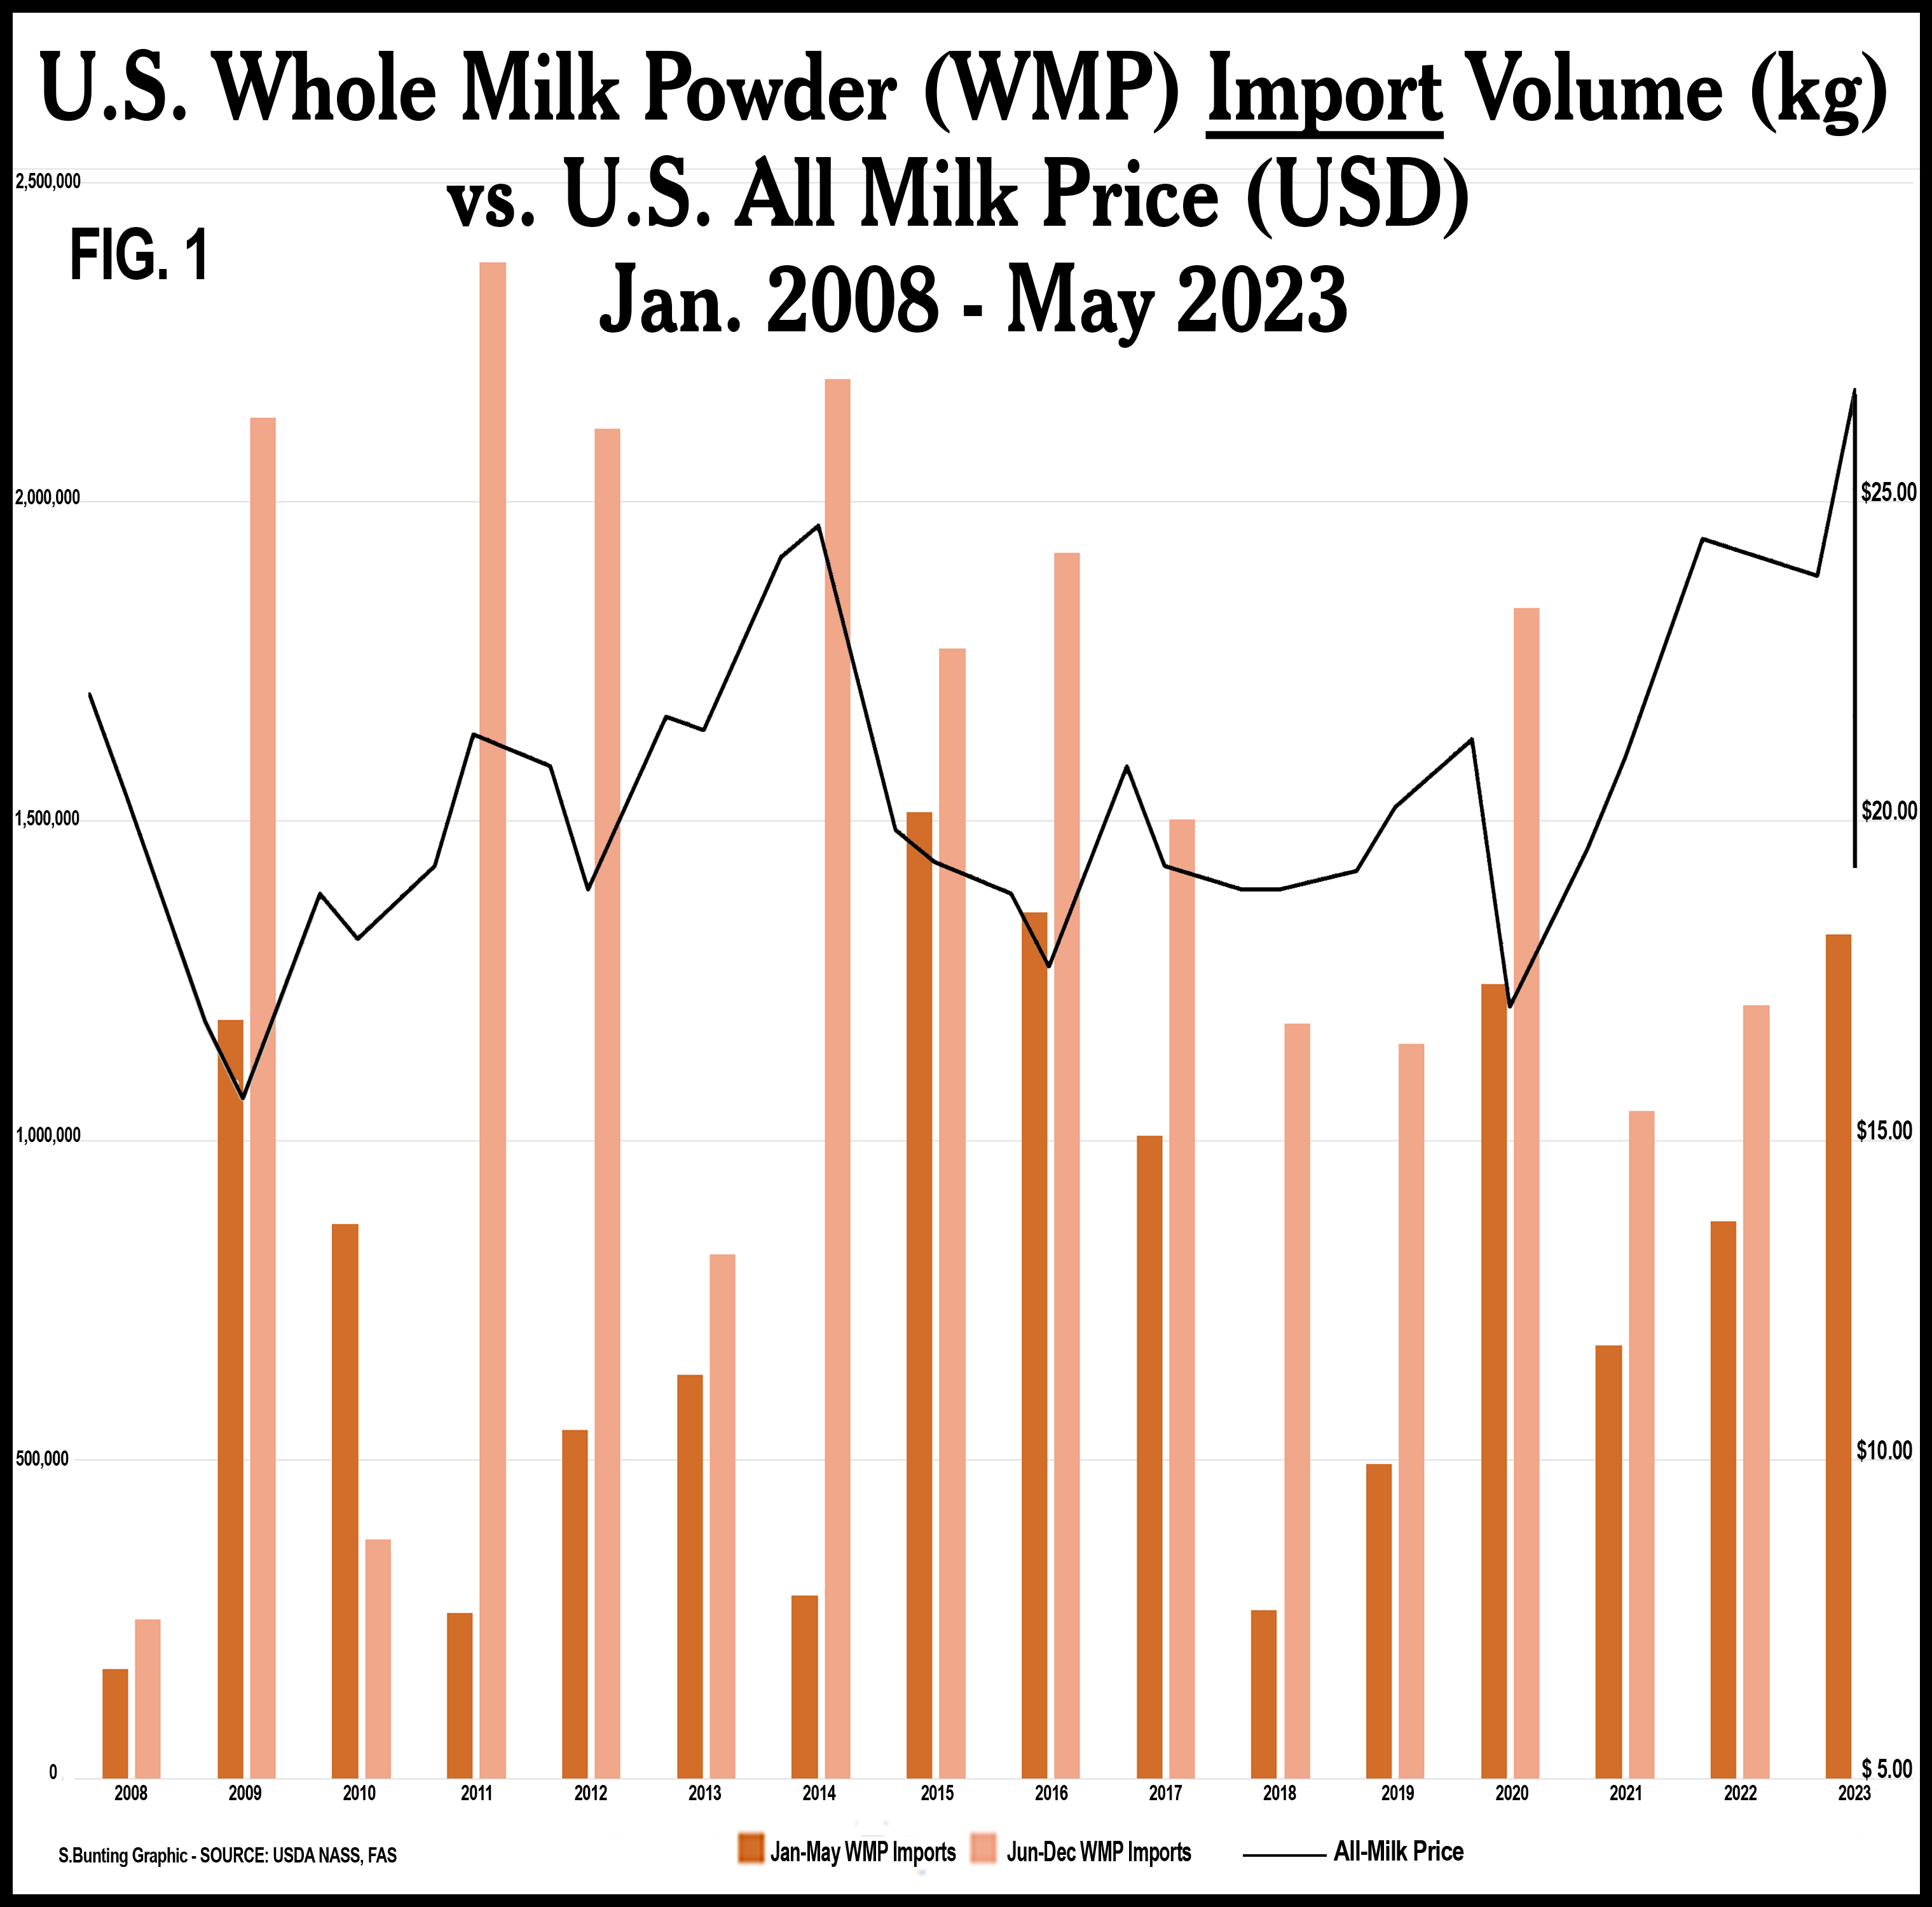
III. The stunner is dairy imports, up 9.2% with Whole Milk Powder imports up 51% year-to-date.
Looking at import volumes vs. All Milk prices, the pattern is clear (Fig.1). From 2008 to today, whenever there is a period of high farm milk prices, Whole Milk Powder (WMP) imports increase, and farm milk prices fall.
WMP is basically farm milk from another country, in bulk dried form, not a specialized product. It can be used in processing virtually any dairy product, containing all of the milk components — both fat and skim solids.
From December 2022 through April 2023, the U.S. imported the highest percentage of dairy production equivalent since 2016. And there is more milk equivalent comparison today than in 2016. The National Milk Producers Federation’s monthly market report confirmed this.
Then May imports worsened this trend.
Digging into the June 12 USDA Foreign Ag Service (FAS) Import Circular, the U.S. imported 80% more non-cheese dairy products from January through May vs. year ago. At the same time, cheese imports were down 3.3%. Combined, the total cheese and non-cheese imports were up 9.2% vs. year ago.
But the stunner in the data is the U.S. imported 51% more WMP in the January through May 2023 period vs. year ago.
It’s no wonder that the USDA Dairy Market News reported on June 15 that, “Dry whole milk processing (in the U.S.) is limited, despite hearty milk volumes.”
The report went on to say that even as seasonal milk output recedes “market contacts suggest dry WMP market tones may remain steady (at the current lower price levels) due to lighter demand.”
Not surprising, given the U.S. imported more WMP in May (550,000 kg) than for any month since April of 2020. WMP was imported at a record-setting pace during the pandemic while milk was being dumped in the U.S. and production-base-programs were tightened on U.S. dairy farms by milk cooperatives and buyers.
As the cumulative 2023 WMP imports accelerated in May, milk prices are set to take the sharp turn lower.
The year-to-date imports of butter, butterfat and butter oil are also well above year ago as part of that 80% increase in non-cheese imports January through May 2023 vs. year ago.
The June WASDE raised dairy import forecasts, yet again, especially on a fat basis, and it again lowered dairy export forecasts. The Report sees butter and nonfat dry milk (Class IV) continuing to sell stronger on better demand, while demand and prices for cheese and whey (Class III) are further reduced.
This combination reduced the WASDE forecast for the 2023 All Milk price to $19.95, down 55 cents from the May forecast. Part of this is the Class IV over III divergence that is substantially lowering the Class I fluid milk price under the ‘average of’ method, which took more than $1.00 off the advance Class I price mover for July, announced last week at $17.32. It would have been $18.34 using the previous ‘higher of’ method.
IV. Lab-created dairy protein analogs are advertised to processors as ‘extenders.’
Another emerging factor is the lab-created dairy protein analogs, which are the excrement of microorganisms that have been bioengineered with bovine DNA. These proteins are advertised in dairy food and manufacturing magazines as carbon-footprint-lowering, interchangeable ‘extenders’ for production of cheese, ice cream and other dairy foods.
The companies that are ramping up this fermentation-vat-lab-protein are doing limited consumer marketing. Mainly, they pursue a B2B model (business to business, not business to consumer) and try to capitalize on ESG scoring benefits based on who-knows-what-calculations that large processors are seeking as they navigate the investment, credit, and retail shelf-space ESG decisions up and down the supply chain.
No one knows how much lab-dairy-protein is being used at this time — or in what brands of dairy products — because these proteins do not have to be labeled, and they are not part of any dairy market or production report.
The Bioengineered Food Disclosure Law was passed by Congress in July 2016, and USDA established the national mandatory standard for disclosing foods that are, or may be, bioengineered in December of 2018. This Standard was implemented on Jan. 1, 2020 with mandatory compliance for all food manufacturers by Jan. 1, 2022.
According to USDA, the Standard defines bioengineered foods as “those that contain detectable genetic material that has been modified through certain lab techniques and cannot be created through conventional breeding or found in nature.”
The lab-dairy-protein-analogs are the harvested excrement of fermentation-vat-grown bioengineered yeast, fungi and bacteria, so BE labeling is not required due to the ‘detectable genetic material’ loophole. The modified genetic material is in the microorganisms, not their excrement.
-30-

Pingback: Part Two: What drove rockier road for 2023 milk prices? Manure. Imports. Concentration. | Ag Moos
Pingback: Editorial: What was really behind ‘rockier road’ this summer? USDA revisions show fewer cows, less milk June-August | Ag Moos
Pingback: Feb. 16, 2024 Milk Market Moos in Farmshine: SHRINKFLATING DAIRY — steep loss of dairy farms, down 40%, and much, much more | Ag Moos