
By Sherry Bunting, Farmshine, October 27, 2023
EAST EARL, Pa. — In the June 30 and July 7 editions of Farmshine, we covered the milk market conditions behind the drama that sent farm-level milk prices spiraling lower. The two-part “rockier road for milk prices” series explored factors and asked questions about a situation that was not making sense.
Farmshine readers will recall that we questioned dubious math on the huge milk price losses in farm milk checks – far beyond the predictions for modest declines – in the April through August period.
We questioned the accuracy of government milk production reports and the USDA’s World Ag Supply and Demand Estimates that kept telling us there would be more milk cows on farms and that milk production would continue higher for the year because of… more cows.
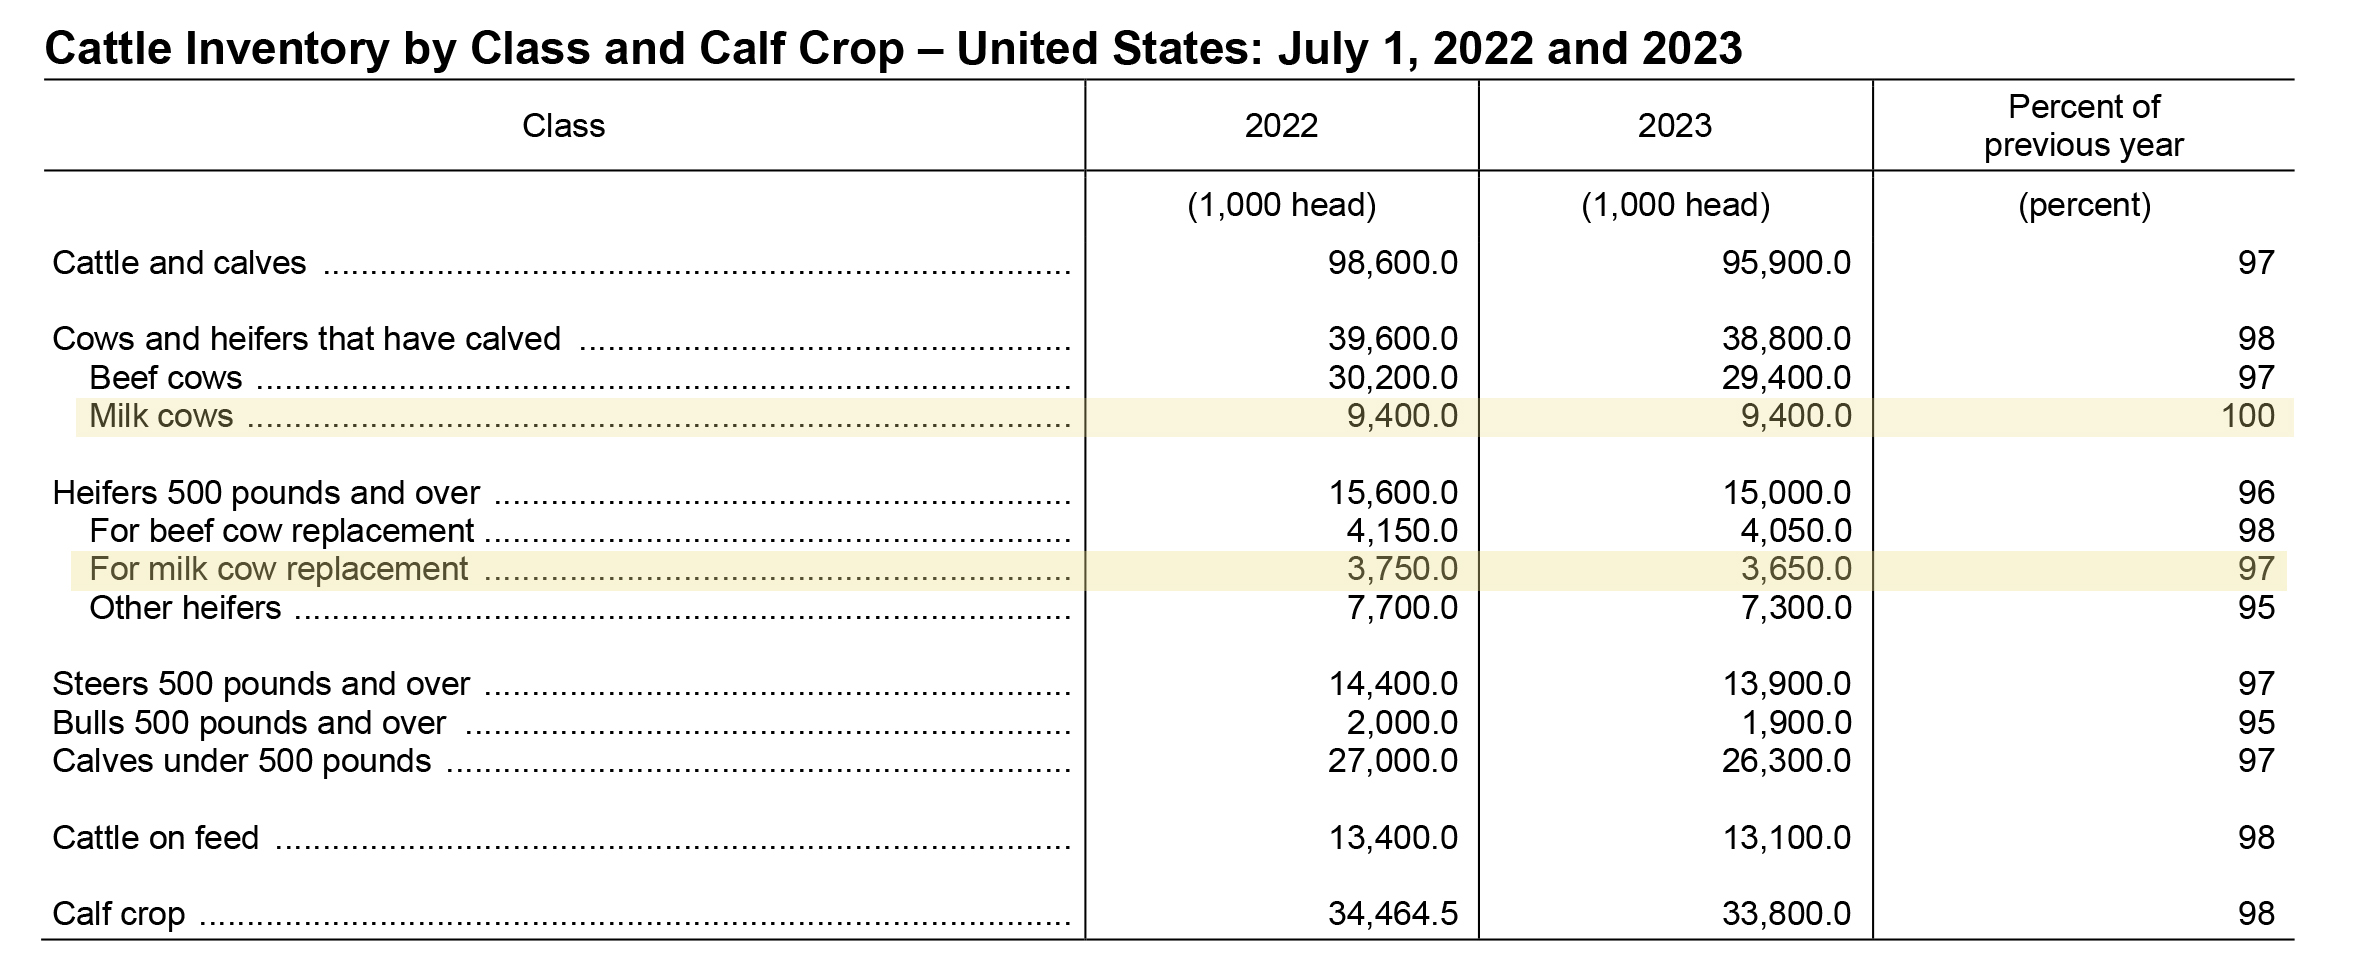
We doubted this was possible given the semiannual cattle inventory reports over the past year showing static to shrinking milk cow numbers and major shrinkage in the number of dairy heifer replacements (down 2% in Jan. 1 inventory, down 3% in mid-year inventory, a drop of over 100,000 head!). We have reported the escalating dairy replacement cattle prices setting multi-year record highs that are bearing these inventory numbers out.
We asked: Where are all these cattle coming from?
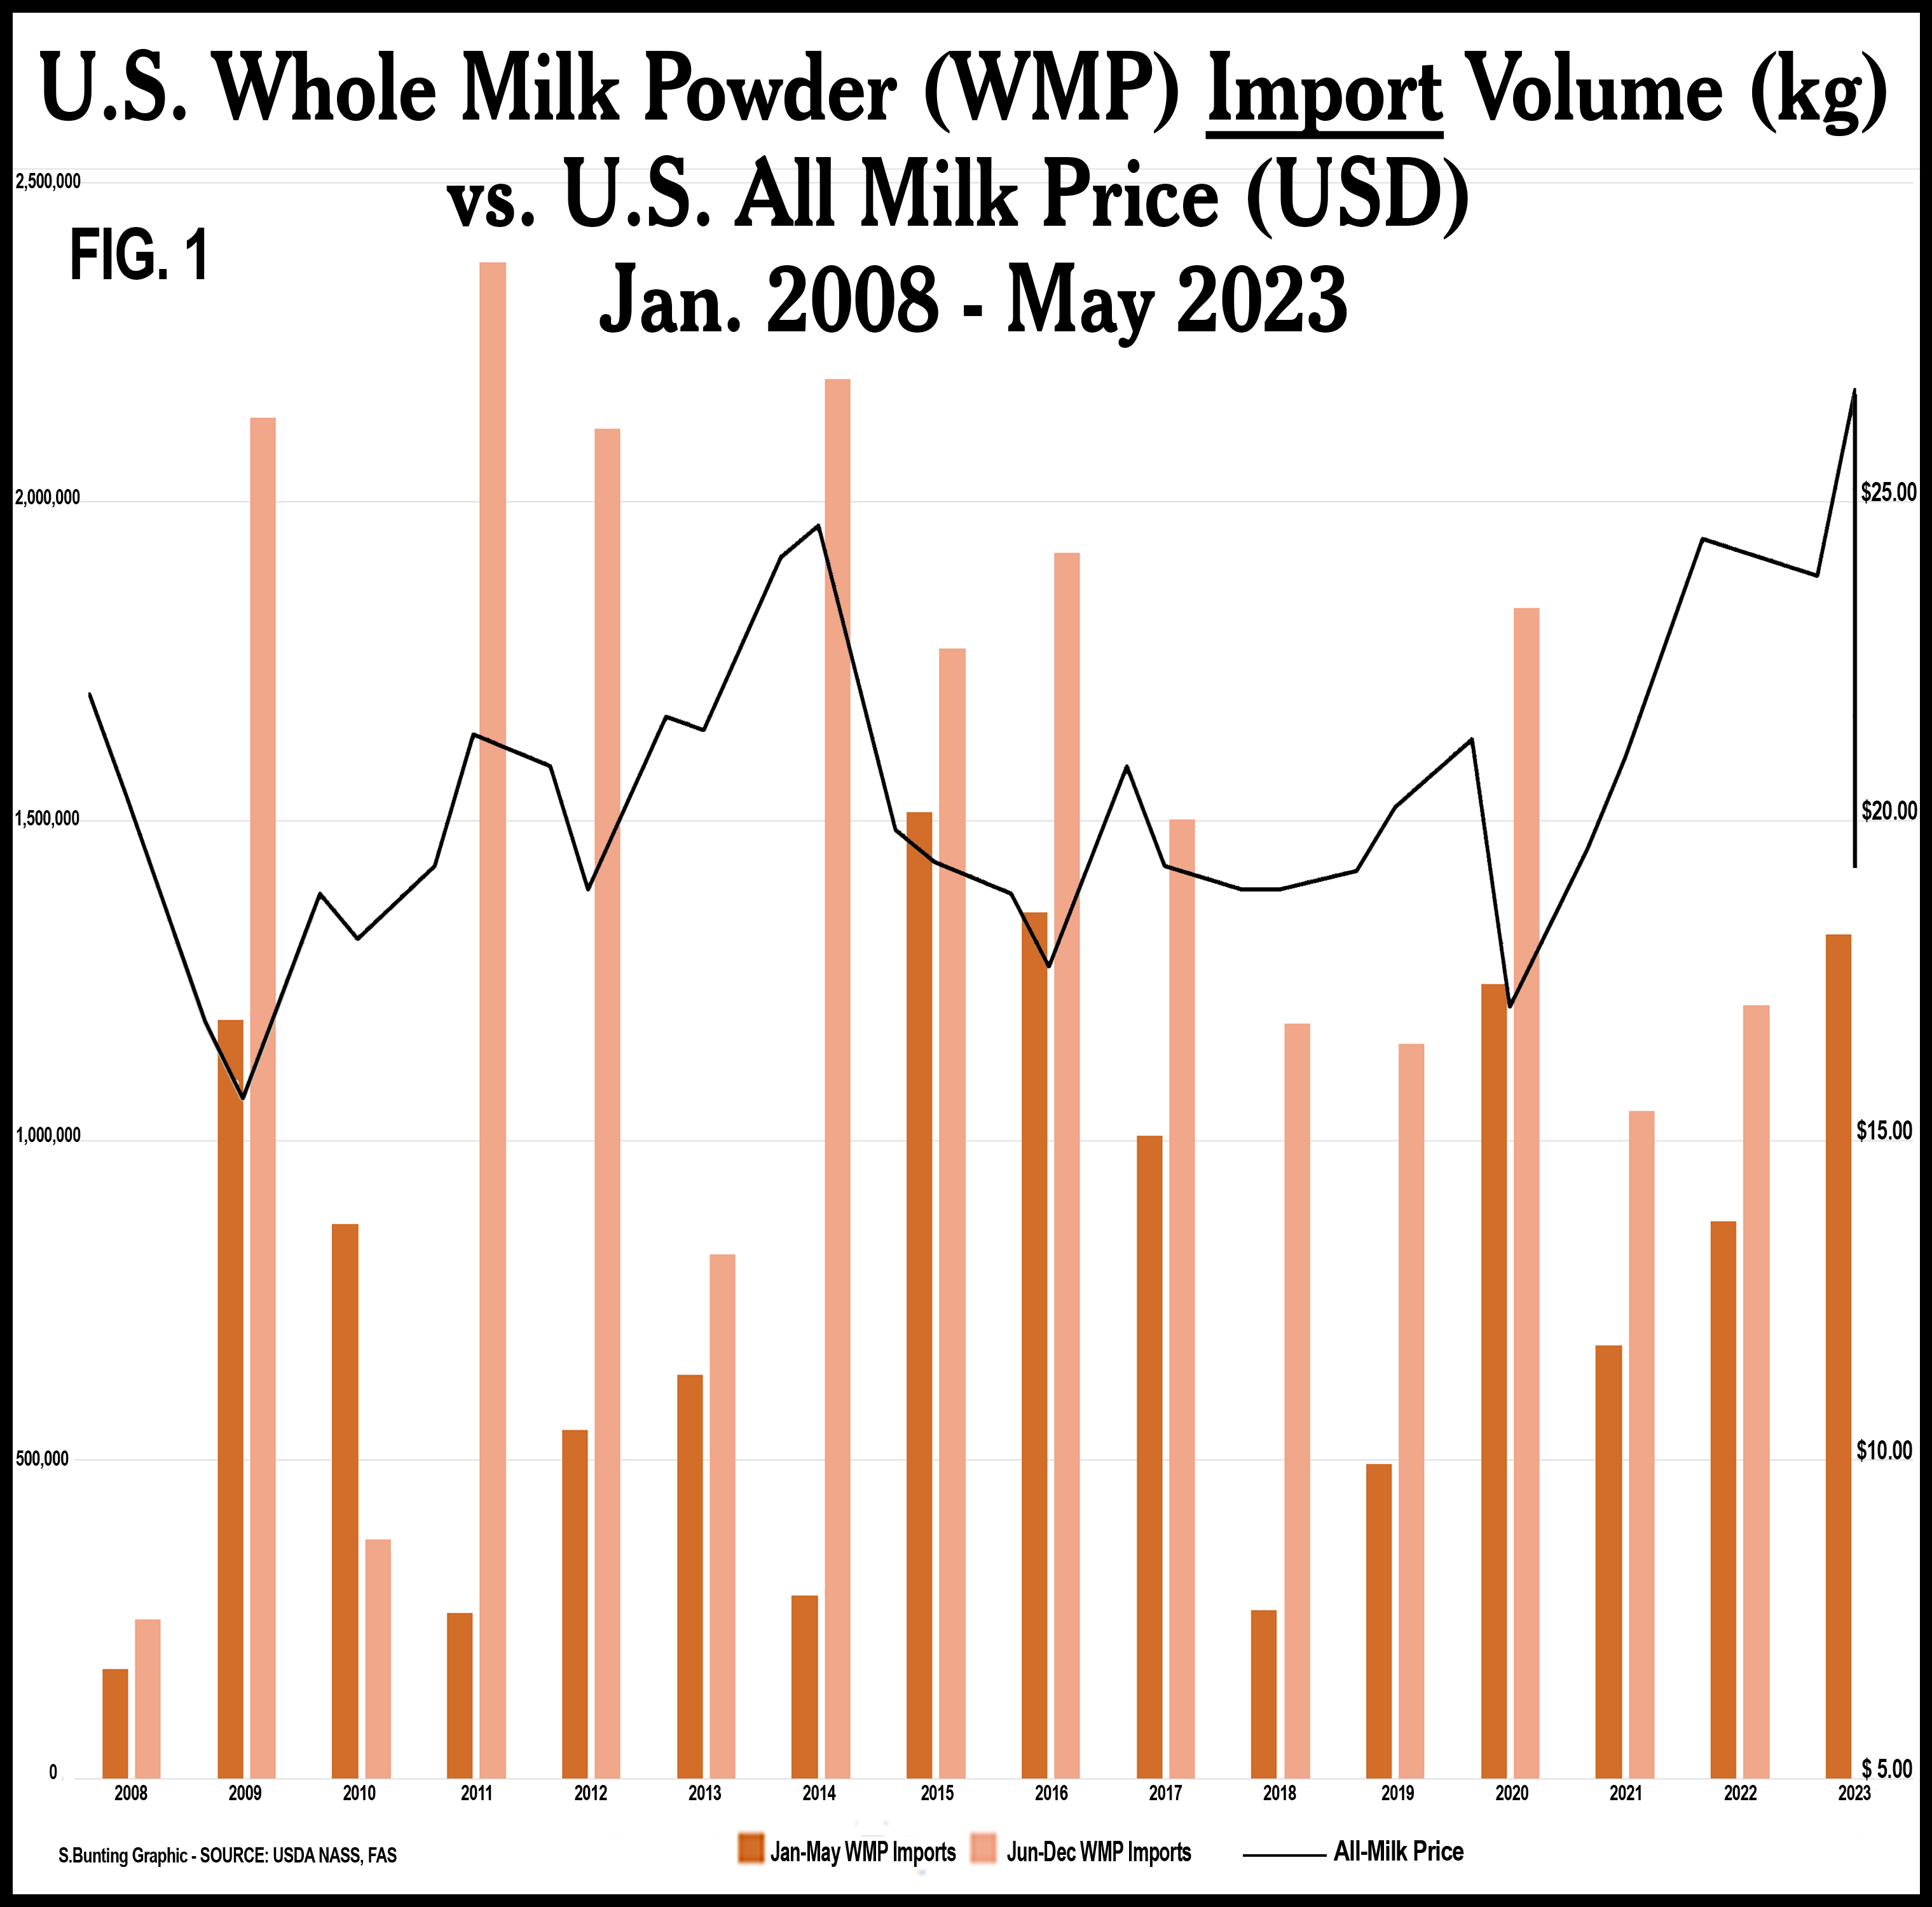
The June and July two-part series also indicated the 51% increase in the volume of Whole Milk Powder (WMP) imports coming into the U.S. compared with a year earlier in the January through May period — the highest volume for that 5-month period since 2016. (WMP is basically dehydrated milk for use in making any product or reconstitution.)

We also consulted Calvin Covington for his read of the situation. He reported to us that his calculations showed a 15% cumulative increase in total milk solids imported January through April, and that this extra volume was equal to 63% of the year over year increase in ending stocks on a total solids basis.
Well, what do you know! On Thursday, October 19, USDA issued its monthly milk production report for September. The report also went back and revised downward the previously reported totals for milk production and cow numbers for April through August.
Lo, and behold, in June and July while markets crashed, U.S. farms milked 13,000 and 34,000, respectively, fewer cows than a year ago. The September Milk Production report has now gone back to shave around 0.1% off of several months of previously reported milk production, and it has revised milk cow numbers lower than previously reported as follows: The May revision added 1000 head vs. prior report, the June revision shaved 4000 head off the prior report, July’s revision shaved 11,000 head, and August 14,000 head.

How convenient that while the Milwaukee Sentinel and area news stations were reporting five weeks of milk dumping in the sewers during June and July, and USDA Dairy Market News was reporting six to eight weeks of spot milk loads selling at $10 to $11 under the abysmal Class III price as it hit multi-year lows, the USDA reports had been telling us we were milking more cows than a year earlier, and those cows were making more milk.
Prices had plunged by more than 37%, and no one was talking about the scale-back of mozzarella cheese production and the ramp up of whole milk powder imports.
Sure, they were talking about the softening of dairy exports, and maybe that’s the point. The industry had to get the U.S. price levels below global levels in a hurry to honor the global goals set by the national dairy checkoff under previous USDEC president Tom Vilsack to keep growing exports on a Net-Zero pathway to get to 20% of milk production on a solids basis.
We wrote with concern in June and July about how even those prior numbers did not make sense at those previously incorrect levels, how a tiny change such as milking 7000 more cows in May vs. year ago and a little more milk per cow through the period could result in prices falling this hard in June and July. We have even more questions as even those small supply-margin factors have now been edited by USDA to be lower than previously reported for the April through August period.
Cow numbers have always been a driver for milk prices. Now we know there was an average of 21,000 fewer cows milked in the June-July period. And, by July, there were actually 34,000 fewer cows on U.S. farms vs. year ago.
For the Q-3 July through September period, the revisions show an average of 33,000 fewer cows nationwide compared with the third-quarter of 2022. Maybe this will also be revised lower in the future — as it includes the number of milk cows on U.S. farms in September that is now said to be 9.37 million as a preliminary figure.
In the space of six months, U.S. total milk production has gone from running 1% above year ago in Q-1 to nearly 1% (0.7%) below year ago in Q-3. But within that difference lies a revision that begs big questions about what was really going on while prices were plunging.
According to the tables in the September milk production report, the reality of the situation in June and July — while milk prices hit rock bottom and milk was being dumped and sold for $10 to $11 under class — we were already milking 13,000 fewer cows in June compared with a year ago and a whopping 34,000 fewer cows in July vs. year ago, according to these revised numbers. Now, in September, we’re milking 36,000 fewer cows in the U.S. vs. year ago.
In fact, these revised reports show that milk cow numbers have fallen by 74,000 head from the March 2023 high-tide – an unrevised and supposed 9.444 million head — to the August revised number of 9.376 million head and the September preliminary 9.37 million.
Think about this for a moment. We had unprecedented sets of proposals for milk pricing formula changes flowing into USDA in April and May with USDA announcing in June that a hearing of 21 proposals in five categories of formula changes would begin August 23rd.
While this was staging, we saw milk pricing drama unfold.
How useful this drama was for processors during the first eight weeks of the USDA Federal Milk Marketing Order hearing that has now been postponed due to “scheduling conflicts” to pick up where it left off on Nov. 27.
How convenient it was for processor representatives to be able to point to dumped milk, below-class spot milk prices and negative premiums as justification for their proposals to increase make allowances while attempting to block farm-friendly formula changes — all in the name of investments needed in capacity to handle “so much more milk!”
(A year earlier, Leprino CEO Mike Durkin warned Congress in a June 2022 Farm Bill hearing that, “The costs in the formula dramatically understate today’s cost of manufacturing and have resulted in distortions to the dairy manufacturing sector, which have constrained capacity to process producer milk,” he said, calling the situation “extremely urgent” and warning that immediate steps needed to be taken to “ensure adequate processing capacity remains.”)
Fast forward to the first eight weeks of the USDA FMMO hearing in Carmel, Indiana in August, September and October. We listened as large global processing representatives (especially Leprino) pontificated about how the make allowances are set too low, saying USDA is setting the milk prices too high. They pointed to all of the drama this summer as proof that farmers are suffering because processors can’t afford to invest or retain capacity to handle “all this extra milk.”
Now here we are, September milk production nationwide is down 0.2% from a year ago, product inventories are tight to adequate, prices have improved… but along the way the industry managed to shake out hundreds of dairy farms — large and small — that have liquidated during the steep downhill slide this summer that so few were prepared for, as no one had a clue it would be this bad given the tight number of milk cows and replacements steadily reported in inventory.
What was really behind the dairy cliff we just experienced, where even USDA Dairy Market News recently reported a significant number of herds milking 200 cows or less have recently liquidated in the Upper Midwest?
With record WMP imports, a pull-back in fresh Italian cheese production, and other elements behind the scenes… was the fall-out of a so-called milk surplus manufactured to prove a point? (Remember, Leprino’s Durkin warned that if make allowances aren’t raised, sufficient processing capacity may not remain. And take note that other Leprino representatives warned during the USDA FMMO hearing last month that they may not invest in U.S. processing capacity in the future, if make allowances are not raised and FMMO minimum prices lowered.)
Or was the fall-out this summer manufactured to fulfill the dairy checkoff’s goals for exports? You see, we are told there was excess product in Europe and New Zealand, and our overseas sales were softening, but still well above 2020 and about even with 2021. The industry is driven to get the deals to secure more global market each and every year, even if the means to those ends are detrimental to how we serve our domestic market in the future.
Given the pullback in mozzarella production during this “rockier road for milk prices”, we have to wonder about the testimony of Leprino representatives in the FMMO hearings. They have been doing the loudest complaining.
Leprino is also a major strategic partner with DMI and the organizations under that umbrella: USDEC, Innovation Center for U.S. Dairy, Net Zero Initiative, and on and on.
They want FMMO milk prices lowered, they said, so they can pay premiums again (?), and they believe you, the farmers, should help pay for their sustainability pledges within the make allowance formulas as a cost of doing business.
They likely want to free up capital out of the FMMO pricing levels to pay for Scope 3 emissions insets from RNG-project dairies to compete with other industries that can buy those renewable clean fuel credits as offsets.
They likely want to use your milk money to pay for concentrated manure-driven expansion in the Net Zero wheel-of-fortune pathway that has been constructed with your checkoff money.
They want FMMO make allowances high enough to cash flow plant capacity investments based on byproduct whey, while they make mozzarella cheese that is not surveyed, is not price-reported, and is not included in the end product pricing formulas for dairy farm milk checks.
-30-
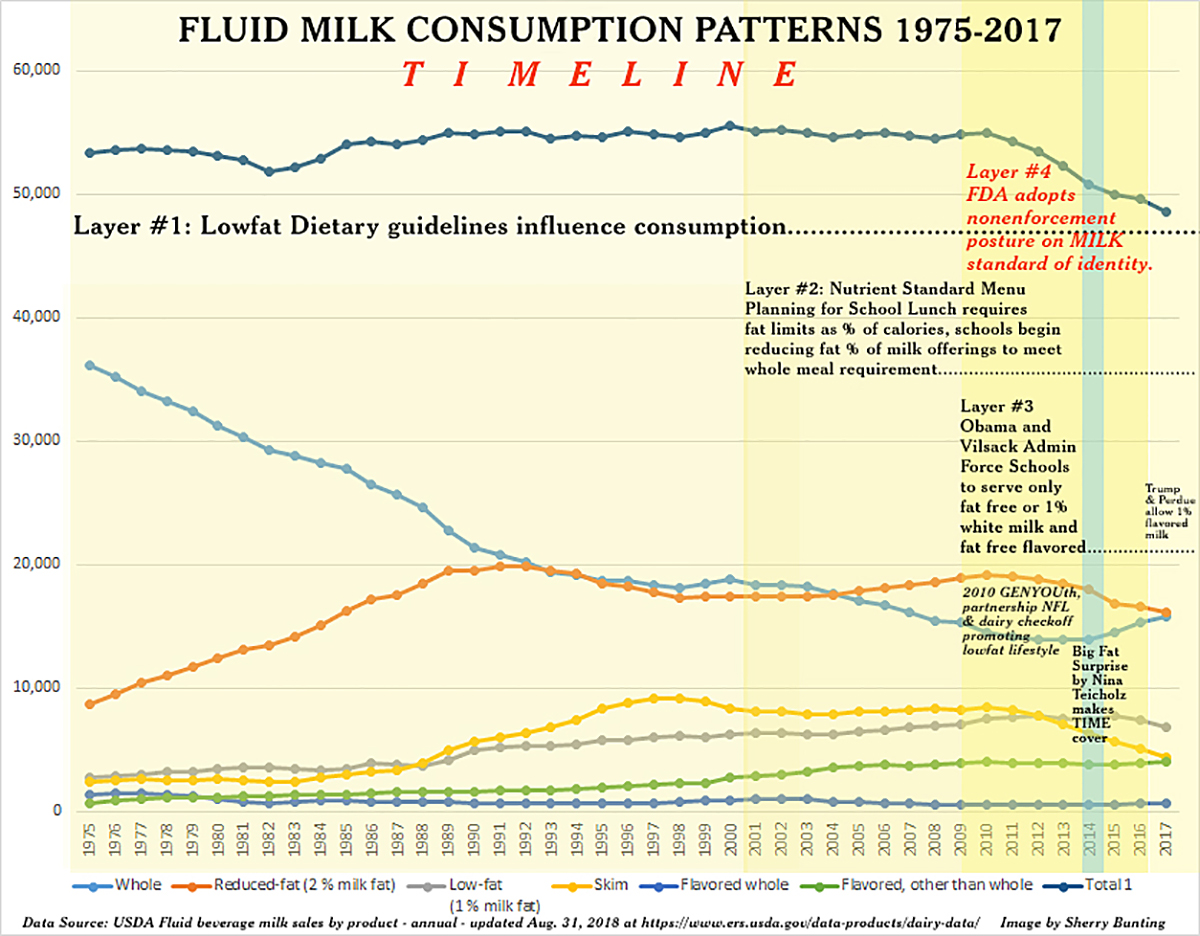 That is, until we hit 2009-10, when the third and fourth layers (see Chart 1 above) were added to the lowfat-push — that consequently pulled total fluid milk sales into the bucket at the same time that exports began their rapid ascent.

 ALBANY, N.Y. — “Cycles don’t exist in a supply-managed system,” said Canadian dairy farmer Nick Thurler. He sits on the Dairy Farmers of Ontario (DFO) board and operates a dairy farm of 500 registered Holsteins with his brother and their sons.
 Thurler was a presenter at the Dairy Summit organized by Agri-Mark in Albany, New York on August 13. The summit gathered 350 people, half of them dairy farmers, and many of the producers in attendance being on various U.S. milk cooperative boards.
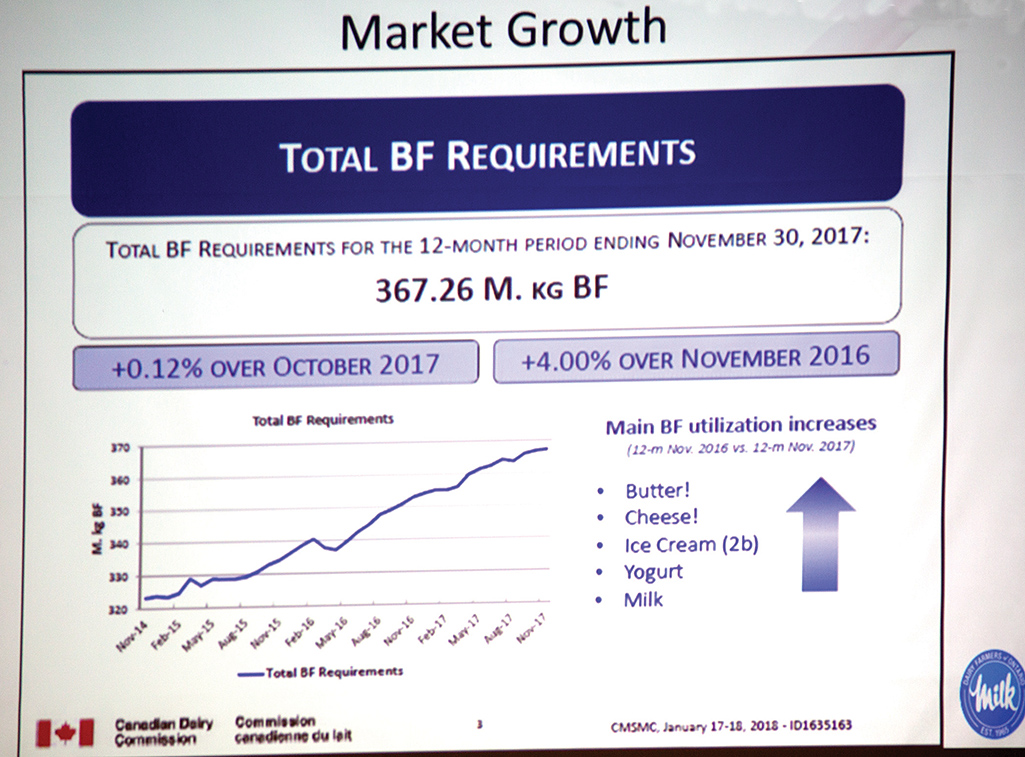 A government entity audits the processor stocks, which weighs into the market needs.
 Dairy epicenter of trade friction between leaders