
NOTE: In the first part of this three-part series, we’ll look at some of the factors contributing to the huge divergence between Class III and IV at the root of current losses in milk income, especially for risk-managers who were caught off guard with no good tools to manage the misalignment and especially the de-pooling. In the next two parts, we’ll look at some of the advice for managing basis risk in CME-based tools and revenue insurance.
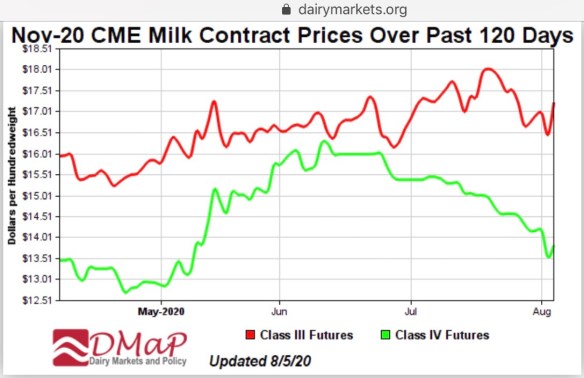
This graph at dairymarkets.org shows the divergence between Class III and IV milk futures at the root of deep discounts in All-Milk prices as compared with Class III.
By Sherry Bunting, Farmshine, Friday, August 7, 2020
BROWNSTOWN, Pa. — Dairy producers find themselves in uncharted territory, where a mixed bag of market factors, pricing structures, class price misalignments, Federal Milk Marketing Order (FMMO) provisions, product-in / product-out flows via imports and exports vs. inventory, as well as the government’s thumbprint on the scales in a pandemic shutdown of the economy and the dairy product purchases that followed. All have affected Class III and Class IV milk prices quite differently, creating deep discounts in blended farm milk prices vs. Class III.
“We’re seeing milk class wars,” said economist Dan Basse of AgResource Company, a domestic and international agricultural research firm located in Chicago, during a PDPW Dairy Signal webinar recently. Basse opined that the current four-class FMMO system is old and outdated with pitfalls creating new volatility issues for producers in the form of the $7 to $10 spread between Class III and Class IV in June / July.
He noted, as have others in the past, that a simpler pricing system with one manufacturing milk price and one fluid milk price is something that “dairy farmers could live within.”
Under the current four-class system, and the new way of calculating the Class I Mover via averaging, dairy farmers now find themselves “living on the edge, not knowing what the PPD (Producer Price Differential) will be,” said Basse.
“A $7.00 per hundredweight discount is a lot of capital, a lot of income and a lot of margin to lose with no way to hedge for it, no way to protect it, when the losses are not being made up at home (as reflected in) the PPD,” Basse related.
Previous Farmshine articles over the past few weeks have explained some of the FMMO factors reflected in the negative PPDs everyone is focused on because they are so large. While June’s PPD was primarily affected by lag-time, the next several months of negative PPDs are likely to occur based on the legislated change to the Class I Mover calculation in the last Farm Bill.
The significance of the PPD is that it indicates to the producer the value of the milk in FMMO-available pool dollars as compared to the announced Class III price. The PPD is how the FMMO pool revenue is balanced.
Normally, component values are paid by class, and the extra is divided by hundredweights in the pool to calculate a PPD reflected as the difference (usually positive) between the FMMO uniform price and the Class III price, according to Dr. Mark Stephenson, University of Wisconsin dairy economist in a recent PDPW Dairy Signal.
When higher-value Class III milk is de-pooled in this scenario, the dollars don’t stretch, so the pool has to be balanced by dividing the loss (negative PPD). Even in the southern FMMOs based on fat/skim the same shortfall occurs and shows up as milk being worth less than Class III, instead of more.
The problem faced right now is the Class III price does not represent the broader industry, and there are no straightforward tools for managing this type of risk, especially when the higher-value Class III milk is de-pooled or replaced with a lower class.
“It’s a terrible situation on the hedging side, with three material sources of the problem,” notes Bill Curley of Blimling and Associates in a Farmshine interview this week.
While he describes ways to manage some of these sources in building a risk management price or margin, such as using a mix of Class III and IV and other strategies that reflect a producer’s milk market blend of classes, “there’s no hedge for de-pooling,” he relates.
In fact, Stephenson illustrates this for the Upper Midwest FMMO 30, showing a difference of $7 between the level of negative PPD for July without de-pooling and the level of negative PPD with de-pooling.
While July de-pooling figures won’t be known until mid-August, the June de-pooling in the Northeast wasn’t as bad as in California, as an example. In California, so much milk is already sold outside the pool, that it is easy to replace virtually all of the Class III milk with lower-value Class IV in this divergent classified price scenario.
In the Upper Midwest, only so much de-pooling can occur due to qualifying criteria, so utilization that may normally be 75% Class III, was 50% in June. They don’t have enough Class IV to simply replace Class III and stay qualified on the Order.
Curley and others explain that this situation could leave producers unprotected, especially since they can’t control any of the sources of misalignment between their All-Milk price and Class III. The only factor they can control is whether or not to drop the hedges, which then leaves them unprotected for market risk at a volatile time in the midst of a pandemic as virus rates are reportedly re-surging.
Meanwhile, this week began with risk working its way back into markets as three consecutive days of steep losses in CME cheese and butter prices pushed both Class III and IV milk futures lower, but still with a $4 to $7 gap between them in the next few months.
For its part in balancing broader industry demand, USDA announced a third round of food box purchases for September and October, which will again include cheese, but this time will include more from Class II (sour cream, yogurt, cream cheese) as well as some butter from Class IV. All told, the government will have spent about $1 billion in three phases of dairy purchases for the Farmers to Families Food Box program.
Stephenson reminds producers of the silver lining in this cloud.
“Remember what the pandemic economy looked like just a little over two months ago,” he said. “It was absolutely devastating. Cheese was at $1.00/lb, and milk dumping was unprecedented.
“Now, as we look at things, it’s going to be better than we expected then,” he said showing the All-Milk price for 2020 is now forecast to come in at just under $18 for the year, but that many farms will net $20 per hundredweight for the year via the combination of Dairy Margin Coverage (DMC) and Coronavirus Food Assistance Program (CFAP) payments.
He estimates 2020 DMC payments at the $9.50 coverage level should net 66 cents across annual production for the year while CFAP payments have produced, so far, an impact equal to $1.55 per hundredweight across annual production.
For many producers, however, it won’t feel like $20. It might not even feel like $18.
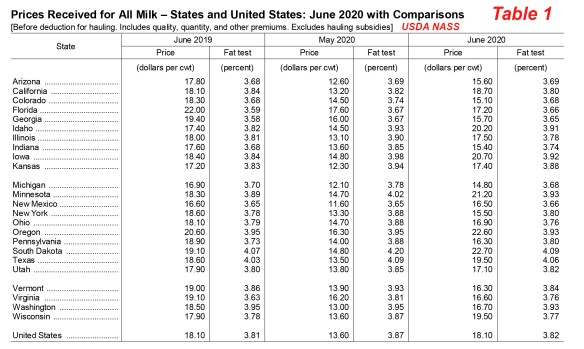
USDA NASS reported June All-Milk prices last Friday, July 31. The range from high to low is $8, nearly double the normal range. At $18.10, the U.S. average All-Milk price did push the Dairy Margin Coverage milk margin above the highest payout level at $9.99.
Take June milk checks for example. USDA announced Friday, July 31 that the June U.S. All-Milk price was $18.10. That’s almost $3 below the Class III price of $21.04 for June, something we just don’t see.
Worse, USDA’s own report showed an $8.00 per hundredweight spread between the lowest All-Milk price reported at $14.80 for Michigan and the highest reported at $22.70 for South Dakota. This unprecedented spread is almost double the normal range from top to bottom. (Table 1)
Also unprecedented is the Pennsylvania All-Milk price reported by USDA for June at $16.30. That’s a whopping $1.80 below the U.S. All-Milk price when normally the state’s All-Milk price is 30 to 60 cents above the U.S. average.
The same thing can be said for Southeast fluid markets and other regions where a mixed products, classes and de-pooling of higher-value milk left coffers lacking for producer payment in the pool, and results varied in how co-ops and handlers compensated producers outside the pool.
Dairy producers participating in the June milk check survey announced in Farmshine a few weeks ago, have reported gross pay prices that averaged fully $2 below the respective USDA All-Milk prices calculated for their state or region. Net prices, after deductions, averaged $4 below, and the same wide $8 spread from top to bottom averages was seen in this data from over 150 producers across six of the 11 Federal Orders. (Table 2)
This all creates an additional wrinkle in terms of the impact on the DMC margin, which was announced this week at $9.99 for June – 49 cents over the highest coverage level of $9.50 in the DMC program. This margin does not reflect anything close to reality on most farms in June and potentially July.
Large, unexpected and unprotected revenue gap
Normally the All Milk price is higher than Class III, and the cost of managing risk when the market moves higher is then covered by the performance of the cash price, or milk check, instead of the hedge, forward contract or revenue insurance. The inverse relationship in June and July between blend prices and Class III price, left a large, unexpected and unprotected revenue gap.
For its part, USDA AMS Dairy Programs defines the All Milk price in an email response recently as “a measurement of what plants paid the non-members and cooperatives for milk delivered to the plant before deduction for hauling, and this includes quality, quantity and other premiums and is at test. The NASS price should include the amount paid for the ‘not pooled milk.’”
USDA’s response to our query further confirmed that, “The Class III money still exists in the marketplace. It is just that manufacturing handlers are not required to share that money through the regulated pool.”
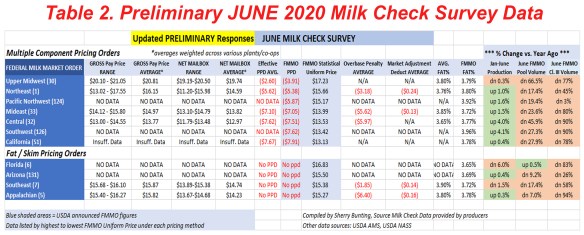
By the looks of the milk check data from many areas (Table 2), most of this value was not shared back to producers, with a few notable exceptions. However, economists project the situation for July milk will be worse in this regard.
The factors depressing June and July FMMO uniform prices, USDA All-Milk prices and producer mailbox milk check prices are three-fold: the 6 to 8-week lag-time in advance-pricing of the Class I Mover, the new method of averaging to calculate the Class I Mover, and de-pooling of the higher-value Class III milk. All three factors are rooted in the $7 to $10 divergence between Class III and IV in June and July.
The part of the equation attributed to the new Class I Mover calculation is perhaps most discouraging because this is not money producers will eventually see. On the other hand, the lost value from the advance-pricing lag-time is eventually “caught up” in future milk checks. Most of the discount to come in July farm-level prices and negative PPDs in future months vs. Class III will be from the divergent factors that are not reconciled later.
Demand drivers differ for Class III vs. IV
Driving Class III $7 to $10 above Class IV was the abrupt turnaround in the cheese market, fed by strong retail demand, the resupply of foodservice channels, a significant May rebound in exports of cheese and whey, significant declines in cheese imports in the March through June period, and new government purchases of cheese for immediate distribution under CFAP.
On the flipside, Class IV value weakened at the same time as butter and powder did not have as many competing demand drivers. Additionally, butter stocks were overhanging the market, despite butter being the dairy product that saw the very highest increase in retail demand during the March through June Coronavirus shutdown period with retail butter sales up 46% over year ago.
Butter and powder production in the U.S. are mainly through co-op owned and managed facilities, while cheese production is a mix of co-op, private and mixed plant ownership.
When co-ops petitioned USDA for a temporary Class I floor hearing, most of the pushback came from the Midwest, and there were calls instead for government direct payments and cheese purchases for distribution to bring down what had been a growing cheese inventory. A stabilizer, or “snubber” on the Class I Mover calculation would have helped avoid much of this unrecouped discount on All-Milk price compared with Class III that affected most of the country.
While cheese moved to retail, foodservice, government purchases and export, butter was mainly relying on the surge in retail sales. Butter and milk powder were not draws in government CFAP purchases.
Overall, however, CFAP has not been the biggest driver in the cheese rally, according to Stephenson, although it added another demand driver to the Class III mix.
He notes that while the government CFAP purchases included a lot of cheese, those purchases accounted for 10% of the cheese price rally in June and July. The rest was fueled by retail demand staying strong and restaurants reopening and refilling supply chains, along with strong demand for other dairy products at retail, such as fluid milk. Producers were also pulling back to avoid overbase penalties. These factors combined to reduce cheese production in May and June, while demand drivers reduced inventory vs. demand.
Other dairy products also saw higher retail demand and were included to some degree in the USDA’s CFAP purchases, but without the same level of visible pull for the trade.
Import/export and inventory equation differs for Class III vs. IV
In taking a closer look at imports and exports relative to inventory to gauge differences between the product mix for Class III vs. Class IV, there are some key differences on both sides of that equation.
Exports of cheese in May were up 8%, and whey exports up 16% over year ago, according to U.S. Dairy Export Council.
Meanwhile butter and butterfat exports were down 7% in May, and down 21% below year ago year-to-date.
Powder exports did break records up 24% for May on skim milk powder. Whole milk powder exports were up 83% in May and 44% year-to-date.
On the import side of the equation, cheese imports were down 13% in the March through June period vs. year ago, according to USDA’s Dairy Import License Circular.
Non-cheese imports, on the other hand, were up 37% above year ago at the same time.
One factor hanging over Class IV markets is the butter inventory — up 11% over year ago — despite significant draw-down month-to-month and retail sales volume being almost 50% higher than a year ago throughout the Covid period.
While U.S. dairy imports are dwarfed in volume by U.S. exports, overall, it is notable that the 37% increase in non-cheese imports included 17% more butter and butter substitute imported compared with a year ago during the March through June period and up 28% year-to-date. Furthermore, whole milk powder imports were up by 25% in the March through June period.
Looking ahead
In a dairy market outlook recently, both Stephenson and professor emeritus Bob Cropp said these wide swings that are creating deep discounts are expected to begin moving toward more normal pricing relationships after August, with Class III and IV prices both forecast to be in the $16s by the end of the year, and in the $16s and $17s for 2021.
Already this week, CME cheese has slipped below the $2 mark, pushing August Class III futures under the $20 mark and September into the mid-to-high $16s. Spot butter tumbled to $1.50/lb, pushing Class IV futures down into the low $13s — keeping the divergence between Class III and IV in place.
Experts encourage producers to be thinking more holistically about the milk markets in planning risk management and not to look at Class III as the leading indicator of which direction the market will take.
This makes any discussion of “margin” based on a Class III milk price irrelevant to the reality under the present conditions. In short, risk management tools did what they were designed to do, but new challenges on the cash price, or milk check side, will change how producers implement and use these tools, or blends of tools, in the future.
“Class III might be a wonderful market for cheese, but it’s not reflecting the entire dairy industry. Risk managers are losing margin on contracts that were meant to protect them from market risk,” says Basse.
“We normally trade at an All-Milk premium to the CME Class III. Today, that has changed dramatically,” he adds. “We are at a significant discount to the CME. We just don’t see these discounts relative to the CME. It is unprecedented.”
-30-
