Grassroots efforts continue seeking solution to Class I formula change losses

While the buck is being passed, dairy producers are talking with lawmakers about the unintended consequences from the Class I mover change Congress enacted in the 2018 Farm Bill.

This illustrates the Class I mover formula since May 2019. Prior to that, the ‘higher of’ Class III or Class IV advance skim pricing factors was plugged into the first item under step 1 without the +74-cent adjuster to automatically be used as the Base Class I Skim Milk Price in the rest of the formula. Image Source: USDA

By Sherry Bunting, Farmshine, May 2021

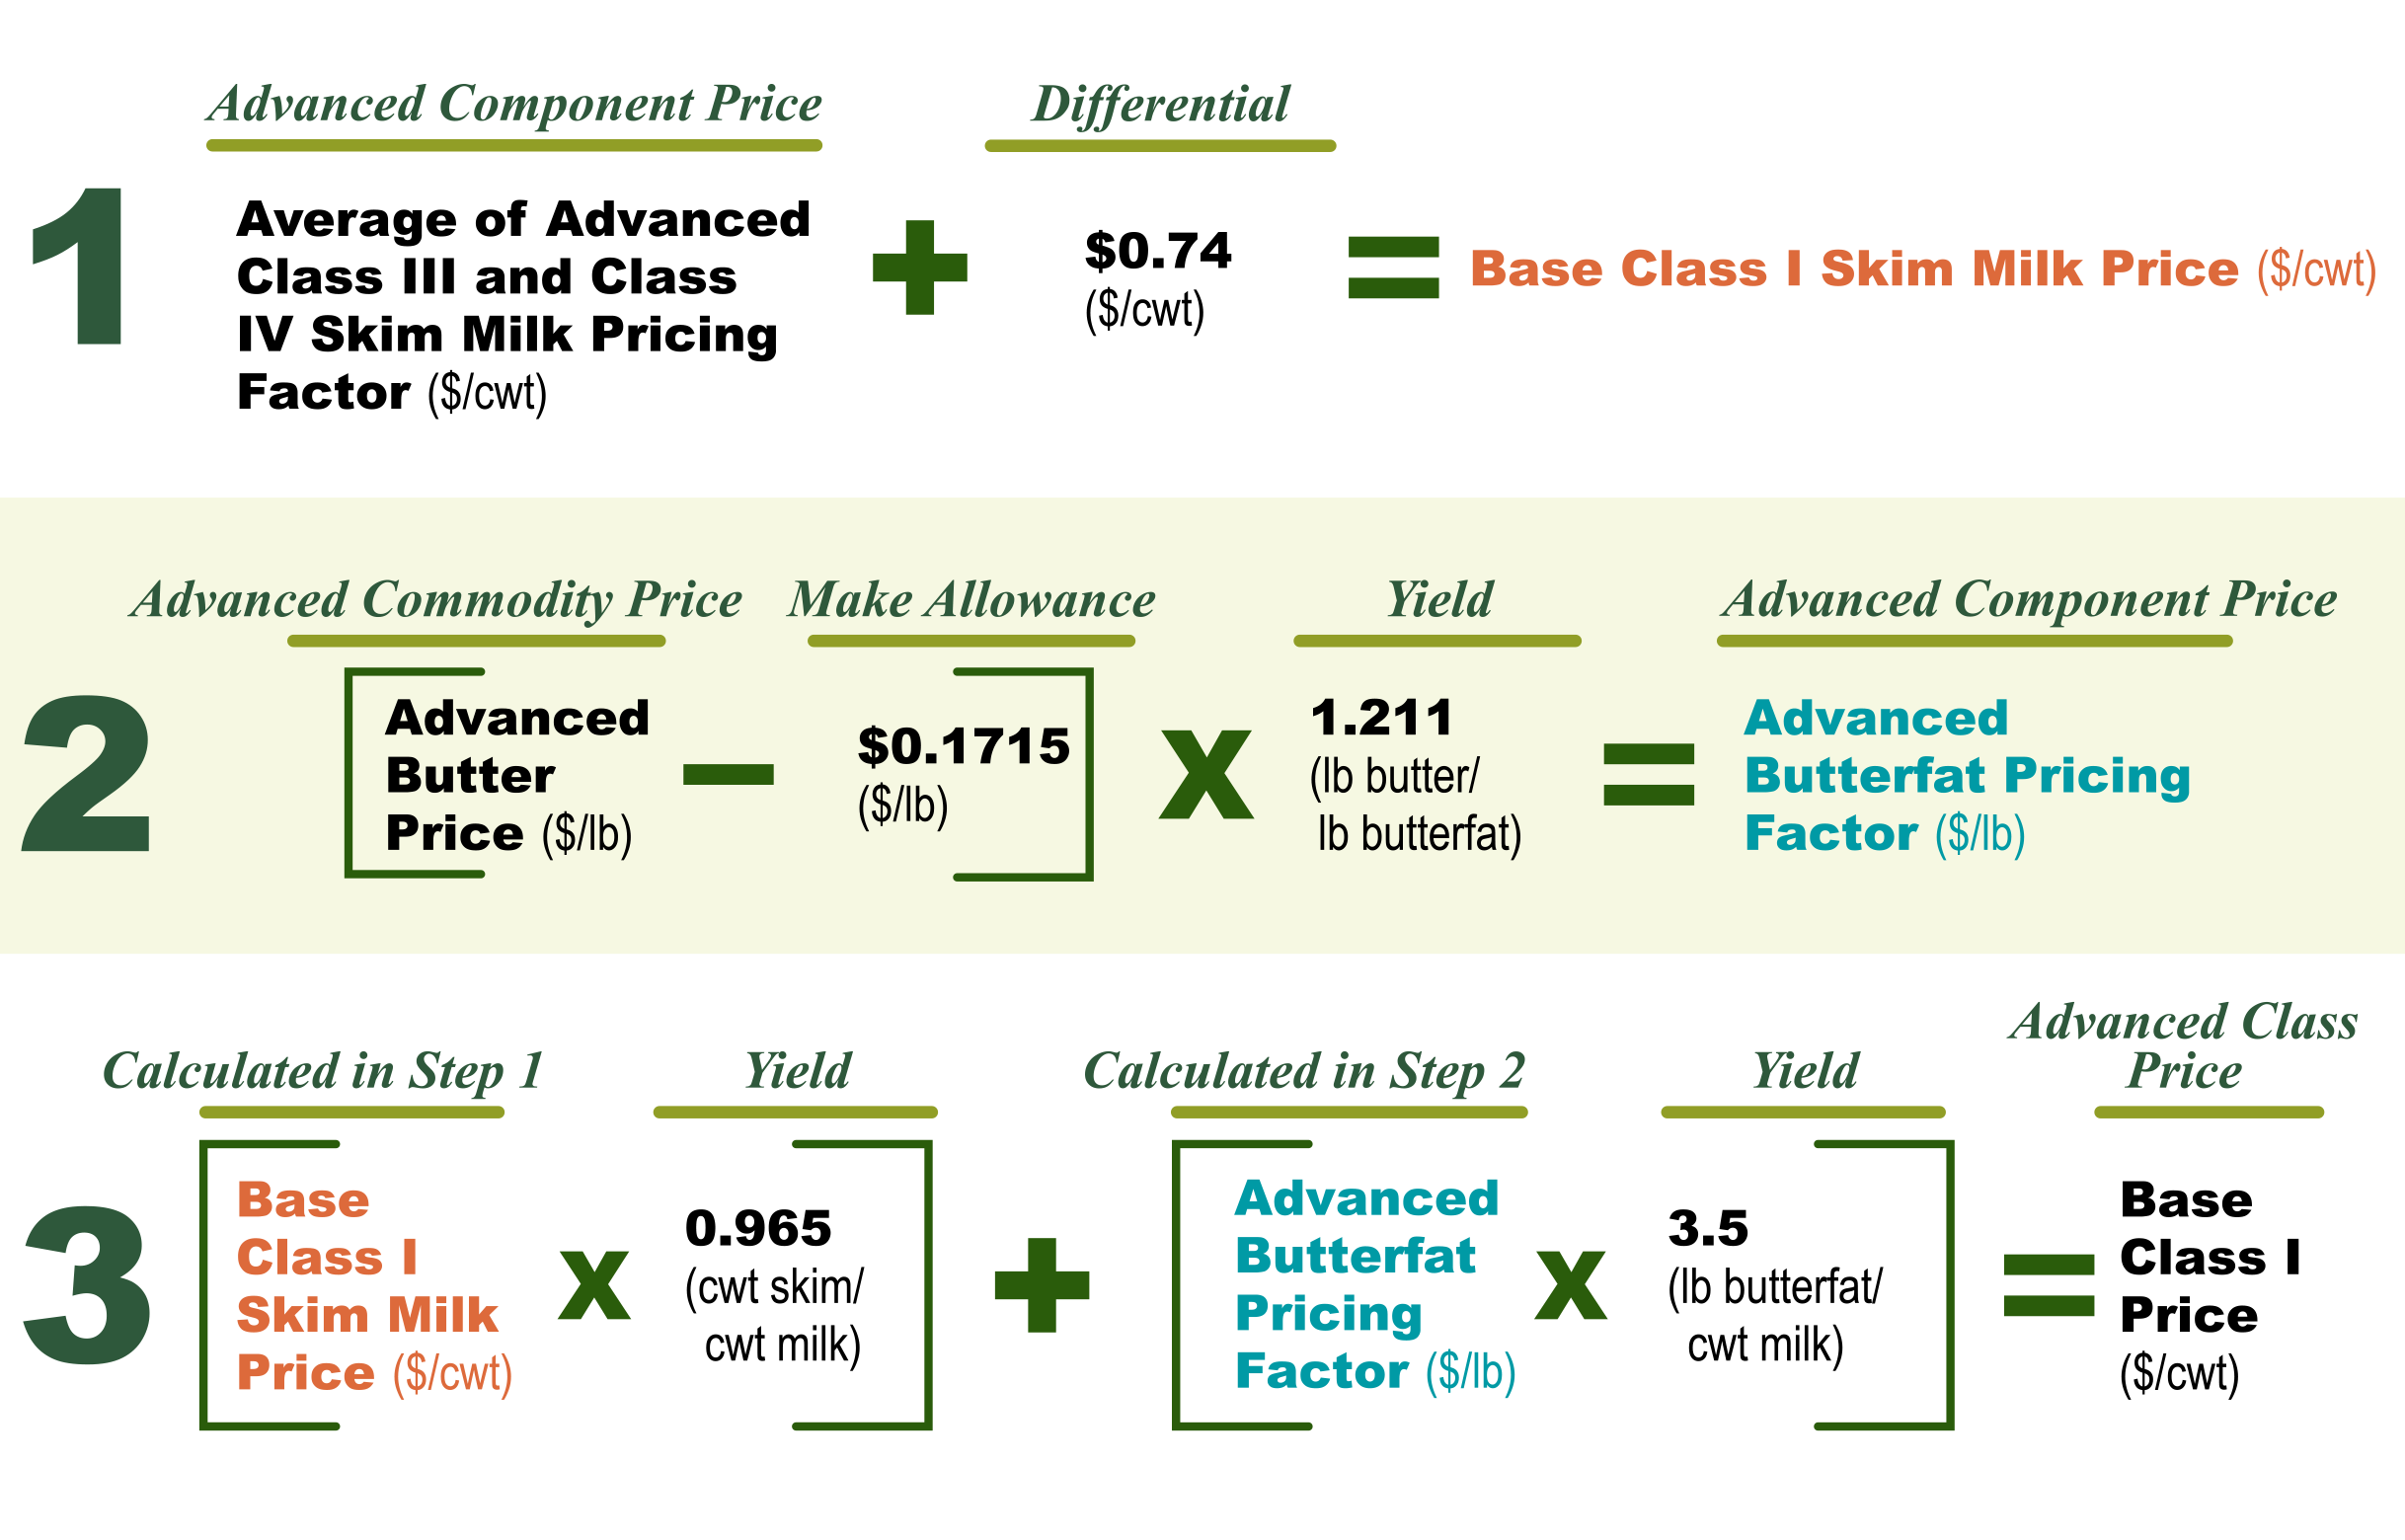
WASHINGTON, D.C. — The Class I ‘mover’ is the subject of much discussion — two years after the averaging method plus 74 cents replaced the ‘higher of’ method to determine the base producer price of Class I beverage milk in May 2019.

A letter drafted by Senator Kirsten Gillibrand of New York is gathering signatures from Senators and will be sent to Ag Secretary Tom Vilsack regarding financial assistance to cover direct and indirect losses borne by dairy farmers due to the formula change exacerbated by the pandemic.

“By allocating more direct payments through CFAP, USDA could take action to reduce the strain that dairy farmers are facing. Specifically, the agency should continue issuing payments to dairy farmers under CFAP, or through any further assistance programs that USDA conceives, including the Pandemic Assistance for Producers initiative, for the first six months of 2021 and make these payments retroactive to January 1st,” the Senator’s letter states.

The American Dairy Coalition is urging producers to contact their Senators about signing onto the letter by end of day Monday, May 17. Senators should contact Dominic Sanchez at Senator Gillibrand’s office by email at Dominic_Sanchez@gillibrand.senate.gov

A transparent USDA hearing process was used 20 years ago to originally set the ‘higher of’ as the method when USDA rejected proposals for averaging Class III and IV due to depooling and negative differentials. However, in the 2018 Farm Bill, the Class I mover was changed from ‘higher of’ to an averaging method legislatively without hearings, without comment, without the producer referendum — without vetting.

Dairy groups are working to raise awareness among key lawmakers and USDA about the 24-month net loss of over $750 million in the Class I mover price from May 2019 through April 2021. In addition, these losses impacted orderly marketing and other factors, contributing to net losses exceeding $3 billion nationwide from inverted class price relationships that produced negative PPDs and led to depooling. In addition, dairy farmers had risk management losses when their milk was devalued, but they paid for risk management that failed because it was aligned with a “market value” they did not receive.

Sen. Gillibrand’s letter highlights the concern about the unintended consequences of the Class I formula change to averaging and away from ‘higher of’.

In the Northeast FMMO 1, for example, the Class I change, alone, accounted for a net loss of over $160 million in Class I devaluation over 24 months, and there were broader impacts of basis losses from reduced and negative producer price differentials (PPD) and depooling.

Northeast producer blend price losses are estimated to be $1.10/cwt, net, from May 2019 through April 2021. (Calculations are being done for other FMMO regions so stay tuned.)

Similar loss estimations can be made for broader impacts across the U.S., depending upon how cheese plants determined pay prices for farmers when the FMMO uniform blend prices were suppressed by $1 to $10 across 7 of the 11 FMMOs that report producer price differentials. These PPDs were severely negative from October through December 2019 and from June 2020 through April 2021.

These formula-related losses are expected to continue through most of 2021 due to current market factors affecting how the class pricing formulas, with the change to Class I, relate to each other and how this impacts depooling.

Producers from the Southeast U.S. also began circulating a letter to Secretary Vilsack this week highlighting the steep losses in the three Southeast FMMOs and seeking direct payments through Coronavirus stimulus funds.

The Southeast letter asserts that milk producers in FMMO 5, 6, and 7 (Appalachian, Florida and Southeast) disproportionately bore 21% ($155 million) of the lost revenue directly attributable to the Class I mover change, because the 21% of Class I value loss fell on dairy farmers shipping just 5.5% of total milk pooled across all orders in the U.S.

Southeast producer blend price losses are pegged at $1.25/cwt.

The Southeast letter states that the loss was not shared equitably among all dairy farmers, due to depooling, which the letter indicates made it possible for dairy farmers marketing milk to cheese plants (Class III) to receive the shortfall.

However, many producers whose milk was depooled from FMMOs did not receive that shortfall from milk buyers, unless they had milk contracts based directly on cheese prices. Many manufacturing class handlers use the FMMO blend price as the benchmark for paying producers outside of pooling.

Several industry sources observe that this change turned out to be a big benefit to processors at great expense to producers. The problem surfaced under market conditions before the pandemic and was made worse by market conditions since the pandemic.

Even National Milk Producers Federation (NMPF) has admitted as much, stating that the International Dairy Foods Association (IDFA) wanted this change in the first place. NMPF indicates they went along with it after studying some historical trends thinking the 74-cent adjuster to the average would produce a result that was “revenue-neutral” for dairy farmers.

It was anything but ‘revenue-neutral’ for dairy farmers, even before the pandemic. The pandemic impact simply magnified the severity of loss.

Proposals continue surfacing since NMPF announced its intention to seek a USDA emergency hearing with a proposal to tweak the adjuster to the average every two years.

Minnesota Milk Producers, Wisconsin Dairy Business Association, Edge Cooperative and the Nebraska State Dairy Association joined together with a concept to change the Class I mover to a Class III-Plus that would be based on Class III announced prices instead of advance prices.

FarmFirst Cooperative based in Madison, Wisconsin, announced it would put forward a proposal to return to the ‘higher of’ calculation — if USDA holds a hearing. However, to-date, no official FMMO hearing requests have been received by USDA.

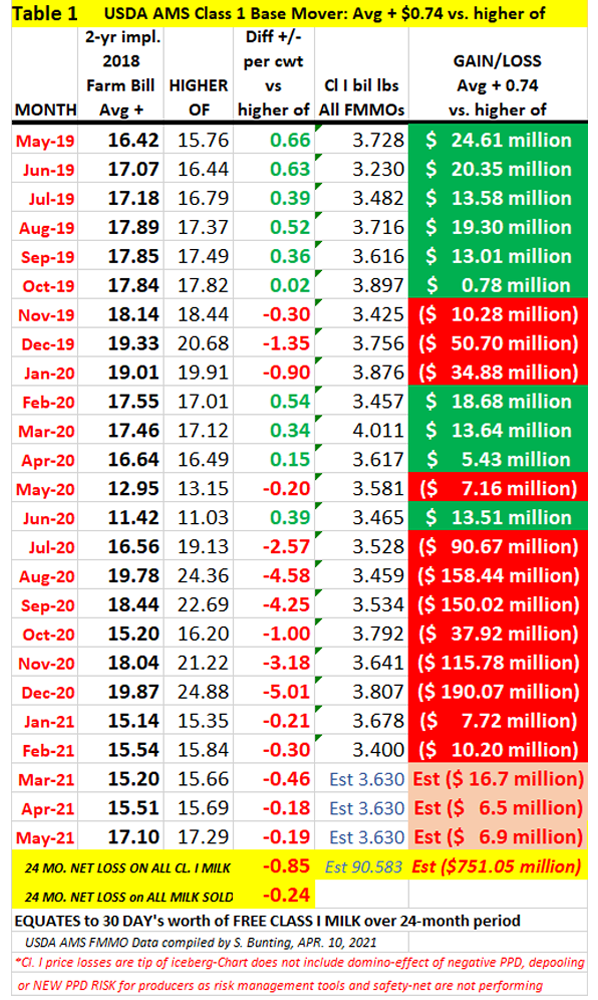
The first few months of the new Class I mover formula in 2019 were net-positive to the Class I price, but this dissolved by July, almost a year before the pandemic, when the gap between the rising Class III price and the averaging method for the Class I mover narrowed because the spread between Class III and IV widened.

Government food box dairy purchases through the pandemic included more Class III products (cheese) than Class IV (butter/powder) or Class II (soft products that are priced by Class IV).

But food boxes included plenty of Class I (fluid milk). Trouble is, fluid milk is not ‘market valued’ except for the value of its components in manufacturing. Fluid milk is discounted as a ‘loss-leader’ by large supermarkets, especially those that process milk.

Another factor that contributed to the wide spread between Class III and IV pricing has been the difference in product inventory as a factor of production, exports and imports.

In 2020, butter inventory reached a 20-year high, while cheese inventory declined. Butter production increased, especially in the first half of 2020, to exceed the record-breaking production of 2018, making less cream available for cheese production. Meanwhile, cheese exports rose 16% while butter exports declined 5%.

On the flip side, cheese imports declined 10% while butter imports were the second largest on record, up 15% over the previous year for the first 7 months of 2020. The U.S. ended 2020 with butter imports 6% above 2019.

The Class I formula change made FMMOs even more vulnerable to massive depooling against this volatile and divergent backdrop of Class III vs. IV. As averaging reduced Class I pricing, and the Class III milk was depooled, the net result was blend prices that reflected a larger portion of the much lower Class IV (and II). Dairy farmers have been educated to produce milk with higher component levels of fat and protein as a method to improve profitability, but negative PPDs snub this value at the farm level.

Looking through USDA Federal Milk Marketing Order statistical bulletins, this reporter calculates over 70 billion pounds of milk were depooled across all FMMOs from July 2019 through March 2021 due to inverted class pricing.

PPDs reflect the difference between the Class III market value of components minus the blend price of all classes in the pool. When PPDs are negative, it reflects insufficient pool funds to pay that value).

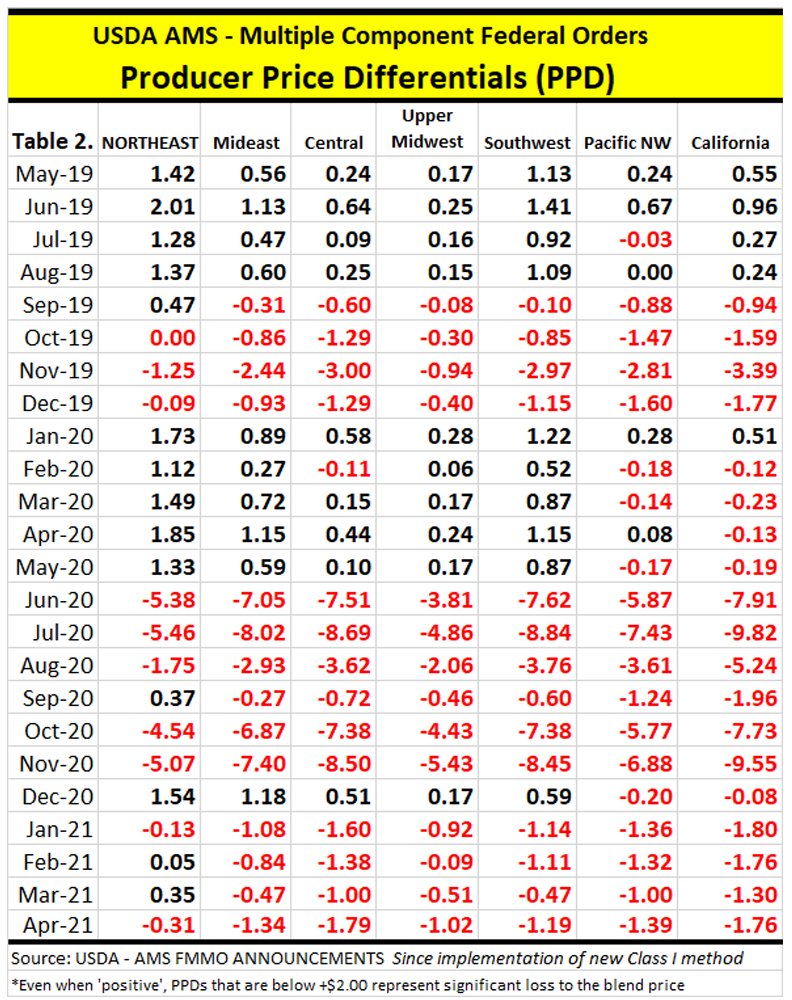
The depooling of Class III milk and the negative PPDs (above) began on the West Coast in July 2019. By September through December 2019, all multiple component FMMOs had negative PPDs, that became more negative as volumes of depooled milk were noted in the central part of the country, moving east.

The four skim/fat pricing FMMOs in the Southeast and Arizona were quite negatively affected by lower Class I minimums in the fall of 2019 and for many of the months thereafter. Topsy-turvy All-Milk and Mailbox Milk prices reported by USDA are further proof of shrinking basis in producer milk checks affecting the performance of purchased risk management tools. Even those USDA-reported All-Milk and Mailbox prices do not tell the whole story because USDA states that “the value is in the marketplace” even if it is not equitably shared with producers.

In essence, the Class I mover change was made to give large global companies buying large volumes of milk a means of ‘hedging’ their risk through forward-contracting on the futures markets. But this ‘benefit’ has resulted in taking real money out of dairy farm milk checks and has made it difficult, in some cases impossible, for producers to manage their risk with tools they purchase in the marketplace and through USDA.

Interestingly, the nation’s largest Class I fluid milk company — Dean Foods — filed for bankruptcy sale and reorganization in November 2019 in the midst of the first appearance of negative PPDs and depooling pre-pandemic.

By January 2020, PPDs turned positive but narrow in comparison to prior history, so that’s still a loss. Then, in February, a month before the Coronavirus shutdown, negative PPDs and depooling again showed up in the Central, Pacific and California FMMOs.

By June 2020 — in the midst of the Covid-19 pandemic and one month after the bankruptcy sale of most of the Dean Foods Class I fluid milk plants to DFA — severely negative PPDs of -$1 to -$10, exacerbated by depooling, were prevalent across all FMMOs, most every month from June 2020 through the present.

Even in the Northeast FMMO, where statistics show positive PPDs in some months when other FMMOs were negative, the basis loss to Northeast producers is real because even the positive PPDs in FMMO 1 over the past 24 months are $1 or more below where they were just two years earlier.

As reported in Farmshine last week, Secretary Vilsack says it’s “complicated” and the industry is “divided” so no “significant” changes can be made “quickly.”

NMPF says it intends to request an FMMO hearing of its proposal to adjust the adjuster to improve equitable treatment of producers.

IDFA is publicly silent.

Other groups are floating a proposal that, if officially proposed in an emergency hearing, would turn the deal into a full and lengthy FMMO hearing.

During a Hoards Dairy Livestream session May 5 with Erin Taylor from USDA AMS Dairy Division, a little more was learned about how USDA handles ‘emergency’ FMMO hearings. Taylor said proposals can be put forward with arguments as part of the package, explaining the emergency to make a case for why the USDA should move quickly. USDA then typically responds and gives the industry a 30 day notice if a hearing is granted, but the statute only requires 15 days, and 3 days at a minimum — depending on the emergency conditions.

Like other FMMO hearings, testimony is taken, and if USDA agrees with the proposal based on the evidence, the department could do a recommended decision, receive public comment and then publish a final decision and conduct the producer vote. Or, the Secretary can do a tentative final decision for immediate producer vote while taking testimony concurrently. In such a scenario, USDA would come back and consider that testimony, and if a change to the tentative final decision is made — based on testimony and comment — then a second producer vote would be conducted.

Generally speaking, according to Taylor, a move to use a tentative final decision cuts about 4 to 5 months out of the hearing process, but this is not done without proponents showing good cause and when there is no opposition to the proposal.

And the Congress? They made the change from ‘higher of’ to ‘average-plus’ at the request of IDFA with agreement by NMPF in the last Farm Bill.

Many members of Congress don’t know what they did. Others are “blowing it off” as “pandemic-related,” when in reality the issues began in 2019.

Lawmakers are also being told the 2018 ‘average-plus’ deal was an historic agreement between “producers” (NMPF) and “processors” (IDFA), when in reality the grassroots in either of those categories had no opportunity to be heard, to testify, to comment, and producers were denied a referendum on the change. In addition, there was little industrywide discussion.

National and state dairy organizations have been collaborating on weekly calls facilitated by American Dairy Coalition to thoughtfully approach a solution from both the short- and long-term perspectives.

While most would agree hearings on long-term FMMO reforms are needed, the short-term fix for the unvetted Class I formula change by Congress could be undone with legislation reverting to the previous formula, or through an expedited FMMO hearing as the flaws of the new formula have been revealed in both the pre- and post-pandemic markets by this average-plus change that was not vetted.

Grassroots efforts seek to raise awareness in Congress to move something forward legislatively.

While the Congress has always said it does not want to set precedent for making milk price formula changes outside of the vetting process of an FMMO hearing, and while the Congress rebuffed numerous requests for a national FMMO hearing in every Farm Bill since 2008, the Congress did go ahead and set that formula-changing precedent in 2018 by passing language in the Farm Bill to change the method for determining the Class I mover from the ‘higher of’ Class III or IV to ‘average-plus’… and here we are.

Producers can point this out when talking with lawmakers, to let them know that the current situation is unsustainable. Producers can explain to their legislators how this impacted them, to help them understand there is more to this story than “it’s the pandemic and you’ll be fine.”

If nothing is done, several industry observers see dairy farm exits rising at a faster rate in the coming year.

In short, the Class I mover change in the 2018 Farm Bill:

— was not vetted through a transparent hearing process,

— disrupted orderly marketing,

— undermined Federal Order purpose,

— created NET losses for producers of $751 million in Class I value (May 2019 through April 2021), and contributed to a net loss of over $3 billion in negative PPDs and depooling,

— created additional losses for producers in the failure of risk management tools not designed for inverted pricing, and

— undermined performance of the DMC safety net due to basis loss.

While the American Dairy Coalition continues to facilitate grassroots producer discussion and seeks a seat at the table for producers with NMPF and IDFA, ADC has also sent an email to dairy producers and organizations with a letter they can provide to lawmakers.

The most important thing is for lawmakers to understand how the pricing change, and the domino effect of negative PPDs and depooling have affected their already struggling dairy farm constituents over the past two years.

To locate the Senators and Representatives for your state, visit https://www.govtrack.us/congress/members

Proposals, hearing requests, grassroots outreach to lawmakers as Class I ‘mover’ debate heats up

By Sherry Bunting, Farmshine, April 30, 2021

WASHINGTON, D.C. — National Milk Producers Federation (NMPF) announced Friday, Apr. 23 a Class I mover reform proposal and intention to request a USDA Federal Milk Marketing Order (FMMO) hearing that would be limited to proposed changes to the Class I mover, after which USDA would have 30 days to issue an action plan that would determine whether the department would act on an emergency basis.

According to NMPF, their proposal would “modify the current Class I mover, which adds $0.74/cwt to the monthly average of Classes III and IV, by adjusting this amount every two years based on conditions over the prior 24 months, with the current mover remaining the floor.”

This adjuster change, if done today for the next two years, would pencil out above the current 74 cents (estimated $1.63).

The NMPF action comes after eight weeks of discussion by grassroots dairy producers and state and national dairy organizations seeking a seat at the table to address lost income and risk management disruptions influenced in part by the Class I mover change that was passed by Congress in the 2018 Farm Bill and implemented by USDA in May 2019.

While NMPF and IDFA have reportedly had conversations on the issue, IDFA has not yet publicly-announced a position.

On Tuesday (April 27), another proposal — called Class III Plus – was announced by a collaboration of state dairy groups in the Midwest. This proposal would also end Class I advance pricing factors.

Seasoned dairy policy analysts and economists suggest more proposals may be forthcoming.

USDA “will do the things it knows it can do to impact the (milk income) concern by providing better market opportunities, new market opportunities,” said U.S. Agriculture Secretary Tom Vilsack answer questions from North American Ag Journalists Monday, calling FMMO reform a “tough issue.”

On the specifics, though, the Secretary said simply that USDA would look to the industry “to work with them on the changes that need to take place.

“It’s a very very complicated issue, and not one that should be easily characterized. Anyone that tries to do that doesn’t understand the complexity of that particular topic. It’s very complex,” Vilsack explained. 

He acknowledged that conversations are occurring within the dairy industry, but said: “Those conversations need to mature a bit more before anybody makes a decision that there’s going to be a significant change.”

However, in contrast to the Secretary’s observations, a “significant change” has already been made across all FMMO’s, legislatively, and it was done without hearings, without comment, without a producer referendum, without much conversation and without the knowledge of many dairy producers.

So here we are. The buck is being passed as the ball is being volleyed between industry, legislative and administrative. The volley started when NMPF and IDFA proposed the mover change in 2017-18. Congress then passed it, thereby replacing the mover that had been set by administrative hearing process 20 years ago, when USDA chose the higher of instead of an averaging method and documented disorderly marketing, negative differentials and depooling, back then.

Now, the volley is open again for what looks to be a toss from legislative to industry to administrative hearing requests.

For its part, NMPF states that the current mover was “intended to be revenue neutral while facilitating increased price risk management by fluid milk bottlers. The new Class I mover contributed to disorderly marketing conditions last year during the height of the pandemic and cost dairy farmers over $725 million in lost income.” 

Analysis by various industry experts, including Farm Bureau’s Market Intel, peg the broader net farm losses at $3 billion when the change influenced a domino-effect of negative producer price differentials (PPDs) and massive depooling.

In the three fat/skim pricing FMMOs of the Southeast U.S. where PPDs are not shown, Calvin Covington calculates dairy farmers in FMMO 5, 6 and 7 collectively had net loss of $1/cwt off the blend price for 23 months due to the mover change from higher of to average-plus.

NMPF’s proposal is described as helping “recoup the lost revenue and ensure that neither farmers nor processors are disproportionately harmed by future significant price disruptions.”

A Penn State Ag Law Center webinar already planned on FMMOs this week, turned into a hot topic. Brook Duer, staff attorney for the center and moderator asked webinar guest Dr. Andrew Novakovic, Cornell professor emeritus about the specifics of the NMPF proposal.

“This proposal would recalculate the adjuster every two years, except the adjuster can never be less than 74 cents,” Novakovic said. “They are not talking about changing the ‘average of’ back to the ‘higher of.’”

In weekly producer conference calls facilitated by American Dairy Coalition after a letter was sent to NMPF and IDFA signed by hundreds of dairy farmers and organizations, a return to the higher of was identified as a short-term option while long-term proposals are vetted. American Dairy Coalition, and the grassroots groups who have been part of the conversation since February, sent emails with talking points, urging producers to contact key lawmakers and talk to them about the situation.

Proponents of a return to the higher of point out it was already vetted by USDA hearings, whereas the current average plus 74 cents was not.

“As the COVID-19 experience has shown, market stresses can shift the mover in ways that affect dairy farmers much more than processors. This was not the intent of the Class I mover formula negotiated within the industry,” noted Randy Mooney, chairman of NMPF’s Board of Directors in a press release. “The current mover was explicitly developed to be a revenue-neutral solution to the concerns of fluid milk processors about hedging their price risk.

“Dairy farmers were pleased with the previous method of determining Class I prices and had no need to change it, but we tried to accommodate the concerns of fluid processors for better risk management,” Mooney stated further. 

“Unfortunately, the severe imbalances we’ve seen in the past year plainly show that a modified approach is necessary. We will urge USDA to adopt our plan to restore equity and create more orderly marketing conditions.”

Modifying the adjuster every two years is backward-looking for forward-adjustments. 

The current mover is already challenged by timing between Class I advance-pricing and Class II, III, IV announced prices as well as the higher protein production on farms in a system that prices protein in manufacturing classes but prices fat and skim solids in the fluid class.

In the Class III Plus proposal jointly announced by Wisconsin Dairy Business Association, Edge Dairy Farmer Cooperative, Minnesota Milk Producers Association and Nebraska State Dairy Association, advance pricing of Class I would also be ended.

The mover would be linked to the Class III announced skim price, not the advance skim pricing factor. The proposal includes an adjuster that would be revised annually in September by USDA for the forthcoming calendar year. It would equal the average of the monthly differences between the higher of Class III and IV skim milk prices, and the Class III skim milk price during the prior 26 months. 

This adjuster would be floored at 36 cents just for the 2021-25 period “to facilitate faster convergence toward revenue-neutrality after COVID-19,” according to the announcement.

For its part, NMPF states that, “The significant gaps between Class III and IV prices that developed during the pandemic exposed dairy farmers to losses that were not experienced by processors, showing the need for a formula that better accounts for disorderly market conditions.”

To be sure, all FMMOs also saw gaps and inversion for three to six months in the pre-pandemic summer and fall of 2019.

When asked about the FMMO purpose and the ‘mover’ being set at the higher of to move milk to Class I use, Novakovic said USDA would have to look at the actual effect of the ‘average of’ on that purpose.

“Do we see any problem getting milk into Class I markets? Are they complaining there is not enough milk going to Class I?” he asks. “Probably the opposite direction is more true.”

Moving milk to Class I may be more of a discussion for the high fluid utilization areas of the Southeast, where producers end up indirectly ‘paying’ to bring milk in during deficient times of the year. This can be costly when there are price gaps and inversions as documented in the fall months of both 2019 and 2020.

When asked what recourse dairy producers may have in this, Novakovic indicated that lobbying the legislature is “theoretically possible” but that a legislative change is not likely apart from the next Farm Bill, which is three years away.

He also speculated that if someone put forward a proposal to return to the higher of for the next two years — and referred to the reasons given by USDA in its 2000 hearing decision – it’s “not inconceivable” that USDA could say they like what they had better than what Congress made them do, and perhaps like it better than changing adjusters or other ‘new’ proposals that would require a more lengthy hearing process if the industry is divided.

Novakovic was also asked how the Class III Plus proposal from the Midwest would affect Pennsylvania, given the state’s mostly Class I and IV utilization.

He responded to say Pennsylvania is part of FMMOs that include Class III (Northeast Order 1 and Mideast Order 33). He did not see any particular effect for the Northeast markets.

“Class IV would still be Class IV and II will be driven by IV values, and III would be unaffected, so the only question is what you would see happening with Class I,” said Novakovic. “The only way I see this proposal being viewed as a surprise is on the occasions when IV is higher than III, and that has occurred with some frequency in the past.”

The Northeast FMMO has seen a decline in Class III percentage relative to increase in Class IV and II over time. Class I sales also declined precipitously over the past decade but stabilized in 2019 and 2020 with rising sales of whole and 2% milk.

Novakovic confirmed that part of the problem in pricing Class I is the lack of beverage milk market indicators to do so.

As mentioned previously in Farmshine, Class I is required to participate in FMMO pooling, other classes are voluntary. Class I also has regulation at some state levels. On the other hand, in most states, beverage milk is used as a loss-leader in supermarkets, especially as large processing retailers dramatically cut the gallon price to compete for shoppers.

Under these factors, there is no way to gauge a ‘market value’ for Class I beverage milk apart from piggy-backing the other classes that value milk’s components in the manufacture of cheddar, butter, nonfat dry milk and dry whey.

The issue at hand is how to do that, now, in hindsight, after a significant surgical change was quietly made, and failed, and in the future within the context of FMMO reform.

-30-

Covington: Class I change cost producers ‘real money’

Lack of vetting cited as impacts of negative PPDs continue

By Sherry Bunting, republished from Farmshine, April 16, 2021

EAST EARL, Pa. — Federal Milk Marketing Orders have been the subject of discussion at many intervals in Farm Bill history. The last time a major reform occurred was in the 1996 Farm Bill, which became effective in 2000 after going through a four-year period of administrative hearings, widespread opportunity for industry and public comment, a thorough vetting.

Back then, the USDA AMS Dairy Division cited concerns about negative differentials (today we call them PPDs) and massive depooling in 1995-98.

Using the ‘higher of’ Class III or IV advance pricing factors for the skim portion of the Class I ‘mover’ formula was decided to be the way to help mitigate this negative situation and fulfill the purpose of the Federal Orders.

Fast forward to the 2018 Farm Bill: A new Class I pricing method was implemented in May 2019 using the average of Class III and IV advance pricing factors (plus 74 cents) — instead of the ‘higher of’ — as the starting point for the Class I ‘mover’ calculation. This was inserted into the 2018 Farm Bill without hearings, without public comment, with very little industry discussion, and no vetting process

The change was not stress-tested, and producers did not have a seat at the table when National Milk Producers Federation (NMPF) and International Dairy Foods Association (IDFA) agreed to ask Congress to legislatively make this change.

During 23 months of implementation, the result has been disastrous for dairy farmers, and the Farm Bill language calls for the opportunity to amend after the first two years of implementation. We are at that two-year mark right now, and discussions are rippling forward.

For example, a letter to NMPF and IDFA, organized by American Dairy Coalition (ADC) and signed by hundreds of producers and associations, points out the concerns and seeks a seat at the table for an immediate solution. It also identifies the hearing process as allowing inclusive participation.

In a phone conference call Monday (April 12), after months of discussion, the broad coalition of producers involved in the letter from coast to coast agreed. They are looking for an immediate temporary fix by going back to the vetted method — the ‘higher of’ — at least until a vetted decision can be made for the long-term. On Tuesday (April 13), the ADC board reportedly also took a formal position after listening to farmers from different regions across the U.S. to support an immediate temporary return to the ‘higher of’ while continuing to listen and participate in efforts to reach a vetted, viable solution for the dairy industry.

While the Class I change in the 2018 Farm Bill is one aspect contributing to the severely negative PPDs and massive depooling of milk leaving shorfalls in Federal Order revenue sharing in three months of 2019, seven months of 2020 and continuing in 2021, it is an important factor and the only factor that is the result of a change made legislatively without hearings.

Add to this the predominance of cheese in the government purchase programs throughout the pandemic, and the result has been a huge range in all-milk prices across the country and neighbor to neighbor of $8 to $10 from top to bottom.

Add to this the negative PPDs and depooling creating poor performance of risk management tools and the DMC safety net that dairy farmers pay premiums for. These tools were not designed to function in the inverted pricing situation over 13 of the last 23 months that has led to a NET loss of nearly $750 million in Class I value and over $3 billion in FMMO losses to producers via negative PPDs and depooling.

Calvin Covington has a unique combination of experience and insight into the problem. He was CEO of American Jersey Cattle Association when component pricing was developed and used in the last major reform of Federal Orders. He also spent many years after that as the CEO of a milk cooperative in the fluid milk markets of the Southeast. Retired today, he continues writing dairy market columns and consulting.

In a Farmshine interview last Friday, Covington shed some light on the Class I pricing change, negative PPDs (Table 2) and depooling.

“What I tell producers in the Southeast: If you took last year, for example, take the three Southeast Federal Orders (5, 6 and 7), this lowered the blend price about $1.00 per hundredweight. That’s real money,” said Covington. “That’s a dollar right out of producers’ pockets.”

That $1 blend price loss he is referring to is the NET loss across all pounds of milk in the Florida, Southeast and Appalachian FMMOs across the 23-month history of the new Class I pricing change.

In fact, similar losses were sustained in other Federal Orders as well. Table 1 shows how the Class I change, alone, affected Class I price over the past 23 months, for a net loss of 86 cents per hundredweight on all Class I milk pounds nationwide.

Difference in Class I ‘mover’ under old vetted and new unvetted Class I pricing method, gain/loss per hundredweight and total x volume of Class I milk (before PPDs, depooling impact added).

In fact, similar losses were sustained in other Federal Orders as well. Table 1 shows how the Class I change, alone, affected Class I price May 2019 through April 2021, for a net loss of 86 cents per hundredweight on all Class I milk pounds nationwide.

At 28% utilization, this translates to 23 cents per hundredweight across all milk pounds before depooling is factored in. Results vary between FMMOs depending on utilization and depooling. Either way, this net loss means the months where the new method provided any positive impact on the blend price were weighed against the many months where the impact was negative.

Covington and others point to the government cheese purchases as a primary reason for the “big divergence” between Class III and IV. He figures the government purchases during the pandemic represented the equivalent of 1.65% of all milk production in the U.S., and 70% of it, he says, was cheese.

When the divergence in Class III and IV advance pricing factors is larger than $1.48, the impact becomes progressively more negative on the Class I base price, or ‘mover,’ which then impacts the blend price. In the seven multiple component pricing Orders, this contributes to negative PPDs (producer price differentials) by lowering the blend price relative to Class III. If Class IV is already that much lower than Class III, and now the new Class I method averages-in that lower Class IV value, the Uniform Price (blend) minus Class III price becomes a negative number.

Table 2 shows the producer price differentials (PPD) for all 7 multiple component pricing Federal Orders during the 2-year implementation of the new “averaging” Class I pricing method from May 2019 to March 2021. PPD values are normally positive. According to the Northeast Market Administrator: “When the total
value of producer components exceeds the pool’s classified value, the result is a negative PPD since money out of the pool at producer component values plus the PPD must equal money in the pool’s classified value (pool revenue).

When we have basically 10 months of consecutive negative relationships, then Class III handlers have an easy decision: depool the milk to keep that higher price. Class III handlers are accustomed to receiving a check from the FMMO pool. They voluntarily participate in FMMOs to share in the Class I differential. But writing a check to the pool when Class III is higher? That’s a different story.

So, if Class IV represents largely exported, or clearing, product of nonfat dry milk on the skim side of the Class I averaging equation under this new averaging method, why not just make the Class III advance pricing factor the base skim price for the ‘mover’ formula?
“We’ve got to remember that we have had it the other way around, though not this extreme,” says Covington. (continued)

“In the last half of 2013 and into 2014, we had Class IV higher than Class III.”

Covington makes this observation: “With the kind of volatility we are in now… Exports can be going up or down, who knows. There is the possibility this could happen again (IV over III), and also the possibility if the bottom falls out on the powder exports while cheese is strong (III over IV).”

Either way you flip the what-ifs and wherefores, the point is clear: The USDA AMS Dairy Division vetted the ‘higher of’ to be the way to help assure the Federal Orders function for their primary intended purpose: 1) assuring an adequate supply of milk for Class I fluid use, and 2) orderly marketing.

“I am stubborn on the issue. I admit that right up front,” says Covington. “There is a reason we have the higher of. The Dairy Division did a real good job of explaining this (in 2000). The purpose of the Federal Orders is to get milk to fluid use to make sure consumers have an adequate supply. The ‘higher of’ accomplishes that. Now we are getting away from the purpose.”

So, things have changed, right? People are drinking less milk and eating more cheese than in 2000 when major FMMO reform last took place. That matters if all we are looking at is the revenue sharing function of the Federal Orders — the pouring of revenue from the Class I glass into the receipts of Class II, III and IV handlers.

Covington takes a deeper view into the more basic purpose of the Federal Orders that vets these things in hearings, usually, to play out the scenarios.

“Any time there’s less incentive to move milk to fluid use — and that happens when Class III price gets closer to the blend or Class I price, or like last year Class III was higher than the blend or Class I price — why should the milk move if it is going to receive less money?” he explains. “Likewise, if processors need that milk and go into an area of Class III, they pay a larger give-up number to get that milk (to Class I).”

In short, says Covington, the new ‘average + 74 cents’ method for determining the advance base skim price for the Class I mover “presents the opportunity for this to happen.” In other words, it presents the opportunity for the Federal Orders to become dysfunctional and not fulfill their identified purpose.

Going back to the 2000 decision during Federal Order Reform, the USDA AMS Dairy Division, in their own words, explained why the ‘higher of’ would be used.

Citing this about the situation in 1995-98, the AMS decision stated: “Recent increased volatility in the manufactured product markets has resulted in more instances in which the effective Class I differential has been negative, especially in markets with low minimum Class I differentials. In the past when price inversions have occurred, the industry has contended with them by taking a loss on the milk that had to be pooled because of commitments to the Class I market, and by choosing not to pool large volumes of milk that normally would have been associated with Federal milk order pools. When the effective Class I differential is negative, it places fluid milk processors and dairy farmers or cooperatives who service the Class I market at a competitive disadvantage relative to those who service the manufacturing milk market. Milk used in Class I in Federal order markets must be pooled, but milk for manufacturing is pooled voluntarily and will not be pooled if the returns from manufacturing exceed the blend price of the marketwide pool.”

The USDA AMS vetted decision in 2000 goes on to explain how the situation then was “inequitable … where milk for manufacturing is pooled only when associating it with a marketwide pool increases returns.”

AMS Dairy Division also wrote in the 2000 decision about how the class price inversions were made worse (1995-98) by depooling and cited the tens of billions of pounds of milk involved. The 2000 decision to use the ‘higher of’ was explained in a way that holds relevance for the 2019-21 situation.

USDA AMS stated in 2000: “Because handlers compete for the same milk for different uses, Class I prices should exceed Class III and Class IV prices to assure an adequate supply of milk for fluid use. Federal milk orders traditionally have viewed fluid use as having a higher value than manufacturing use. (This) Class I price mover reflects this philosophy by using the higher of the Class III or Class IV price for computing the Class I price. In some markets the use of a simple or even weighted average of the various manufacturing values may inhibit the ability of Class I handlers to procure milk supplies in competition with those plants that make the higher-valued of the manufactured products. Use of the higher of the Class III or Class IV price will make it more difficult to draw milk away from Class I uses for manufacturing.”

In essence, the new Class I pricing method has shown over the past 23 months that not only is the potential there for FMMOs to be in disarray, there is proof that it is happening.

Covington and others point to the hearing process — the normal vetting process for proposed FMMO changes. In this current situation, Congress made the decision to do what NMPF and IDFA asked, without hearings. Dairy farmers did not have a seat at the table. There was little industry discussion, and other organizations were assured that producers would be “held harmless” because the history showed the new method would be “revenue neutral.”

It became law without vetting, hearing, or comment, and has not been revenue neutral.

Covington is among those who strongly favor the hearing process and was concerned in 2018 that it was not being used to vet this Class I pricing method change.

“IThe administrative hearing avenue lets everyone have a seat at the table, to hear every side, put forth every possibility,” he says. “But this wasn’t done. It went through Congress. It was done quick. A hearing process gives time to study the outcome of a proposal. The things we are talking about now would have come out, and people would have said, ‘oh, we better think twice.’”

Not getting as much attention is what this change has done to risk management tools purchased by dairy farmers, which extension educators, consultants, government, everyone, have been urging producers to adopt.

The irony is that the change from ‘higher of’ to ‘average + 74 cents’ was done because NMPF and IDFA convinced Congress it was necessary so that milk buyers could manage their risk through forward contracting and hedging on the futures markets. But the result for dairy farmers — milk producers — is that their risk management has had a huge monkey wrench thrown into it and no good tools to address a new kind of risk in their blend price equation.

“Look what it did to risk management for dairy farmers,” Covington observes. “There is basically 25% of the milk sold in Class I. That’s 47 billion pounds last year. How much of that even participates in risk management? Is it 1%, 5%, 10%? My guess is a small amount. We need to look at the cost vs. benefit. Maybe some used it, but look at what it has done to dairy farmers and the incentive to move milk to Class I. What’s the trade-off?

“How many things are done to look at one small segment at risk of everyone else?” he asks. “It lowered the Class I price. That’s obvious. How much of that was passed on through at retail? When we look at retail, we get the highest retail milk price in Kansas City and the lowest in Wichita, and they are both in the same Federal Order. So, you can’t make rhyme or reason to it.”

Talking through some of the elements of how Class I sales to retail work, with most milk being sold private label, Covington’s involvement and experience is valued.

“It seems like the industry loses focus. We look at the newest thing out there, or the newest group, and forget about the majority. Most of the milk sold in this country is white milk in gallon jugs sold private label,” he observes.

Covington suggests that future Federal Order reform will come, and that even though the methodology of end-product pricing is sound, some of the factors going into it are at a point where evaluation is beneficial.

He weighs the difference between whether changes in Federal Orders are made through an administrative hearing process or through Congress, or a combination of the two, and suggests that the hearing process be included because it is how proposals are vetted.

“A good example is what is happening right now where the issue was not thoroughly heard and analyzed, and it happened so fast,” Covington relates. “How many people in Congress really knew what they did? If it can happen with something like this, what else can it happen to?” -30-

Time is short for short-term fix of failed Class I pricing change

FMMOs in disarray

By Sherry Bunting, Farmshine, April 2, 2021

The efforts continue in hopes of addressing and rectifying the hundreds of millions of dollars in Class I value losses to dairy producers (net) over the last 23 months — due to the new Class I pricing method. But the window for a short-term fix is closing fast.

While the overall problem of severely negative PPDs has multiple reasons and resulted in well over $3 billion in milk payment shortfalls across 11 Federal Milk Marketing Orders (FMMOs), the loss attributed solely to the change in Class I pricing method is pegged at $732.8 million, NET, from May 2019 through April 2021, and looks to continue through most of 2021.

That is, unless a change is made – quickly – before the May Class I price is announced in a few weeks.

Farmshine readers are aware that dairy producers from across the U.S., along with many state dairy associations and the American Dairy Coalition, came together in early March to compose a letter to NMPF and IDFA, addressing the impact of massive depooling in relation to large negative PPDs for dairy farmers across the U.S. The letter specifically identifies the change in how the Class I base price is calculated, which NMPF and IDFA put forward, Congress passed in the 2018 Farm Bill, and USDA implemented in May 2019.

Specifically, the Farm Bill language states that the new Class III / IV averaging method + 74 cents – instead of the previous “higher of” method – was to be implemented in 2-year periods. This suggests we are now at the point in time where it can be amended to tweak the formula before the next 2-year period of implementation begins.

Recall that this change was legislated without hearings, was implemented without a regulatory comment period, and was put through with very little discussion under the auspices of giving processors a way to “manage risk” even as the result has grossly interfered with producer risk management tools.

Considering that this policy has been a complete failure under the stress test of a major event, Congress and USDA should be on notice to fix it before the next 2-year period commences. But time is short.

Producers — through this letter and other efforts — are asking NMPF and IDFA to put their proposals on the table officially for how to remedy this failed change before the next 2-year implementation period begins in just a few weeks.

Discussions among producers and organizations have ensued for weeks now — talking about averaging vs. higher of. In fact, those with greatest firsthand knowledge of the purpose and workings of FMMOs state that the higher of method fulfilled the lawful purpose of the FMMOs, the averaging method does not.

Put simply, the FMMOs are in disarray during this time of market stress that pushed Class III and IV widely apart. A $2 to $10 spread between Class III and IV – along with the new “averaging” method for Class I – have together disrupted the function and purpose of the FMMOs.

NMPF and IDFA told the U.S. Congress that producers would be “held harmless” by the change when it passed in the 2018 Farm Bill. But, in fact, producers have lost hundreds of millions, if not billions, of dollars in value out of their milk checks over 23 months. The averaging method was never “stress-tested.”

NMPF leaders have reportedly referenced the idea of adding $1.63 to the simple average, instead of 74 cents, but this reporter has not seen the proposal put forward as an official ‘ask’ of the USDA Secretary to be part of the next 2-year implementation that begins shortly. Probably NMPF and IDFA will have to agree on this as the Class I pricing change was their agreement in the first place at the time it was passed in the 2018 Farm Bill.

Dairy producers cannot afford to see the drive for a solution stall out until the next Farm Bill. They cannot afford to roll into the next 2-year implementation using the current average + 74 cents formula. Meanwhile, dairy farmers can contact their milk buyers or cooperatives and ask their leaders to encourage NMPF and IDFA leadership to bring the discussion forward for implementation of a short-term solution beginning with the May 2021 Class I price. If this doesn’t happen, producers will be stuck with a failed pricing policy for at least two more years.

A feature in the March 5 edition of Farmshine discussed the letter, the background, and included a copy of the letter, itself.

The deadline for dairy producers and/or their state, regional and national organizations to sign has been extended again until Mon., April 5, 2021. Visit this link to view and sign electronically through the automated short form.

In the letter, dairy producers ask NMPF and IDFA to work with them for a solution that is a fairer distribution of dairy dollars in the long term, but also want to support a short-term fix, now.

Time is running out for this to happen. Dairy farmers do not have two to three more years to wait for the 2023 Farm Bill as the formula losses add financial burden to their already distressed economic situation. They can’t afford to lose hundreds of millions, if not billions, over the next two years as has been their net loss over the past two years. Look for an update next week.

Check out this primer on understanding milk prices basics and PPD.

Hot topic: Understanding milk pricing basics and PPD

Gratitude to Blimling and Associates for this flow chart illustrating the complexity of USDA milk pricing

By Sherry Bunting, Farmshine, March 26, 2021

I challenge anyone to find a pricing system on anything in the universe as complicated as the pricing of a hundred pounds of milk (See Fig. 1).

The Federal Milk Marketing Order (FMMO) system goes back to the 1930s Ag Marketing Law.  In 2000, changes were made to use end-product pricing formulas for four base commodities – Cheese (block and barrel Cheddar average), Butter, Nonfat dry milk (NDFM) and Dry Whey.

Today, these four commodities trade daily on the spot cash market at the Chicago Mercantile Exchange (CME), where less than 1% of volume, closer to 2% on butter, is sold. Since 2018, this 10-minute daily spot auction is done completely as an electronic auction.

The CME spot market sets the pace for actual sales reported weekly to USDA by around 100 processors. From these weekly-reported prices, a weighted average for each of the four commodities is calculated by USDA. The weighted averages are used in formulas that account for yield and deduct specific “make allowances” (See Table 1) to then calculate Class and Component prices.

But first, these weighted price averages for just the first two weeks of each month are plugged into a multi-step formula to determine an Advanced Skim Pricing Factor for Class III (cheese/whey) and Class IV (butter, NFDM). The adjusted butter price is also used to calculate the Advanced Butterfat Pricing Factor.

Effective May 2019 — as a result of a change agreed to by National Milk Producers Federation and International Dairy Foods Association and then passed by Congress in the 2018 Farm Bill — the 2-week Class III and IV Advanced Skim Pricing Factors are averaged together, plus 74 cents to calculate the Base Skim Price.

Prior to May 2019, the Base Skim Price was simply the “higher of” either the Class III or the Class IV Advanced Skim Pricing Factor.

(Author’s Note #1: The previous ‘higher of’ method was the way the FMMOs could make sure Class I always brought the highest price to fulfill the purpose of the Federal Orders – assuring fresh milk supplies – and to keep other handlers invested in pooling their milk. We can’t lose sight of the fact that the fluid milk sales (Class I) have no market transparency as to their value – at all. In some states there are loss-leader laws or minimum pricing provisions, but in most states, Class I fluid milk sales are treated as a base commodity by large retailers like Walmart and Kroger. They loss-lead the retail consumer price of fluid milk to extreme low levels, even as low as $1 per gallon, to win shoppers. They do this because supermarket data show fresh fluid milk is in over 94% of consumer shopping carts! Because it is treated as a loss-leader in some states, and regulated with minimum pricing in other states, it’s impossible to know the real market value of Class I fluid milk apart from the value of its components in making other products.)

Next, the Base Skim Price is multiplied by a yield factor of 0.965 and the Advanced Butterfat Pricing Factor is multiplied by a yield factor of 3.5 and then added together to become the Base Class I Price. This price, known as the Class I ‘mover,’ is announced before the 23rd of each month but is used in the following month.

The various location differentials throughout the 11 FMMOs are next added to this Base Class I Price.

Whew! Now back to those weekly-reported commodity prices, yield factors and make allowances… Announced around the 5th of the next month, the other class prices are a function of the component values based on average weekly prices for the four commodities for four weeks: Component Value = Yield x (Commodity Price – Make Allowance).

In Multiple Component Pricing FMMOs like the Northeast (FMMO 1) and Mideast (FMMO 33), a Statistical Uniform Price (SUP) is calculated from these Class and Component prices according to how the milk in the FMMO was utilized. The SUP is announced around the 11th of the next month before settlement checks are paid for the previous month’s milk.

(Author’s Note#2: Another wrinkle… did you know that an uptrending cheese and butter price can leave producers with a lower protein price? It happened in March 2021. Every end-product — butter, cheddar, nonfat dry milk and dry whey — was higher in March than February, and Class III, IV and II pricing were also higher, but the uptrending butterfat portion of the cheese price creates a ‘snubbing’ effect on the ability of protein to rise within the skim portion. Yes, it’s complicated, and the answer from USDA is a story of its own in the future.)

The FMMO SUPs are based on a 3.5% Butterfat test, but the FMMOs also report for information purposes a uniform price based on the average actual fat test. Your price will differ in your milk check based on your fat, protein, and other factors. In general, producing protein and butterfat above the statistical level nets a higher price, under normal conditions. Lately this has not held out because of negative PPDs.

What are PPDs? Along with the SUP, the FMMO calculates a Producer Price Differential (PPD). This shows how money remaining in the producer settlement fund is divided across the qualified hundredweights of milk, after all components are paid. Sometimes this is a negative number, meaning there was not enough money in the producer settlement fund to pay all of the actual component value after the location differentials on Class I were paid. A negative PPD represents spreading the shortfall across qualified milk in the pool. Severely negative PPDs represent unpaid component value.

The PPD is calculated by subtracting the Class III price from the average of all classes together: PPD = SUP – Class III. In the Northeast and Mideast FMMOs, this PPD has typically been a positive number but has been shrinking in recent years and has been negative for 13 of the past 23 months.

Negative PPDs happen for any or all of four main reasons:

1) When a rapid rise in commodity price(s) is not captured in the 2-week Advanced Pricing Factors.

2) When Class II and IV are far below Class III.

3) When Class I price falls below Class III because of the new averaging method when the spread between III and IV is greater than $1.48/cwt. Half of the months from May 2019 through December 2020 had a lower Class I Base price under the new method, representing a net loss of over $700 million on Class I pounds across all FMMOs. (See Table 2)

4) When handlers de-pool Class III milk because it is higher — to avoid paying into the pool.

Only Class I handlers are required to pool all of their milk. Other handlers can choose what non-Class I milk to pool or not pool based on what is financially advantageous. De-pooling is more likely when multiple months have negative PPDs because of wait times to re-qualify milk for the pool. Some FMMO pool-qualifying requirements are more stringent than others, and the rules have been loosening in recent years because handlers say they need more flexibility to meet fluctuating fluid milk needs.

Occasionally, when cooperatives or plants de-pool Class III milk, some will pass the higher value they withheld from the pool directly to their own producers. In most cases, however, this did not happen in 2020. Additionally, the severity of negative PPDs across FMMOs varied and this created a wide range of milk check pricing of $8 to $10 from top to bottom, when normally this range is $2 to $3, maybe $4. USDA relates that the value is still in the marketplace, so even when the PPD goes negative, some of that value is attributed to the All Milk price used in Dairy Margin Coverage margins because the value is in the market even if it is not in the “pool.”

In addition, for Pennsylvania dairy producers, all Class I milk from Pennsylvania farms that is bottled in Pennsylvania and sold in Pennsylvania stores receives the Pa. Milk Marketing Board (PMMB) over-order premium, which currently stands at $1.00/cwt. Processors can reduce this obligation by selling and sourcing milk from in and out of state as well as other methods.

Cooperatives are producers under the Pennsylvania law, so they collectively receive this premium also, where applicable, and have the ability to disburse the premium to members as they see fit.

Every farm’s mailbox price is further affected by premiums, such as quality bonuses, and deductions, such as trucking cost and marketing fees, which all vary across cooperatives and milk buyers.

This ‘primer’ just scratches the surface of current milk pricing issues. A related topic affecting many producers since May 2019 is how the new Class I pricing method, and the negative PPDs and depooling that can result when Class III and IV are so divergent, affect the way price risk management tools work, creating additional losses in many cases.

(Author’s Note #3: This article has been updated since it was previously published in R&J Dairy Consulting’s customer newsletter.)

-30-

New Cl. I milk price formula puts $403 mil. in processor pockets since May 2019, $436 mil. ‘pulled’ from ‘pools’ in May-Oct 2020 period

By Sherry Bunting, Farmshine, October 9, 2020

BROWNSTOWN, Pa. — The bottom line is the Federal Milk Marketing Orders are not functioning as farm-level pricing can be easily manipulated.

Negative PPDs continue to persist, and all indications are this could be the case through yearend. Several stories in Farmshine since May have covered the Producer Price Differential (PPD) situation and what it means to producer milk checks.

Now, even the American Farm Bureau Federation (AFBF) is on record evaluating the fallout from the new way of calculating the Class I advance base price as implemented May 2019 after passage of the change was made part of the 2018 Farm Bill.

In terms of the money subtracted from Federal Milk Marketing Order (FMMO) pools, Farmshine first reported the $1.48 billion in FMMO revenue gap across 7 of the 11 FMMOs that are multiple component pricing orders. The article and above chart were published in the September 18 edition. September losses will be reflected in FMMO reports in mid-October, and so far PPDs for September milk are mixed, some positive and some negative, but all are well below what would be the case under the old Class I pricing method.

This week, AFBF dairy economist John Newton pegged the cumulative loss to Class I value, alone, at $2.00 per hundredweight or $403 million to-date, across all FMMOs just on Class I milk — money unpaid to farmers that stayed in processor pockets. That figure is about 28% of the $1.48 billion component loss figure shown in FMMO negative balance and it correlates to Class I utilization being roughly 28% of total U.S. milk volume.

The Farm Bureau summary also shows the concentrated loss of $436 million in Class I value for May through October 2020. (Interesting coincidence: DFA is today the largest Class I milk bottler with the May 2020 acquisition of 44 of Dean Foods’ 57 milk bottling plants at a bankruptcy auction price of $433 million.)

“Due to the rapid rise in Class III prices and a modest increase in Class IV prices, the spread between the two was $6.83 per hundredweight in July, $10.96 per hundredweight in August, $10.30 per hundredweight in September and (will be) $3.56 per hundredweight in October,” writes Newton this week in the Farm Bureau analysis.

“As a direct result of no longer including the higher-of in the milk price formula, the Class I milk price never fully captured the rally in Class III milk prices. Instead, the new Class I milk price was as much as $4.57 per hundredweight below the higher-of formula price in August and $4.26 lower in September,” he continues. 

“As identified in Figure 2 (above), had the higher-of formula still been in place, the Class I mover would have exceeded $24 per hundredweight in August,” states Newton.

Newton cites a Class I minimum example for the Southeast, stating that these losses are “before Class I location adjustments are added. In South Florida, for example, with the $6 per hundredweight location adjustment, the Class I milk price would have been more than $30 per hundredweight in August 2020.”

Newton notes that from May 2020 to October 2020, the average difference between the old and new Class I milk price formulas was $2.04 per hundredweight in favor of the beverage milk processor. This means that the regulated minimum prices fluid milk processors had to pay dairy farmers from May through October 2020 were an average of $2.04 lower than what they would have been if the higher-of was still in place.

Going back to May 2019 when the new Class I formula was implemented, Newton notes that the Class I milk price was 62 cents per hundredweight lower on average for the past 19 months compared with the pre-farm bill higher-of formula. (Fig. 3 above)

When looking just at the 12 months pre-Covid from May 2019 to May 2020, the new Class I calculation added 9 cents per hundredweight to Class I pooled volume.

Newton writes that the Class I volume, alone, saw a $32 million benefit in the new Class I pricing in the first 12 months May 2019 through April 2020. Post-Covid, the new Class I pricing method is reflected as a $436 million loss May to October 2020, so the cumulative loss is estimated at $403 million over 19 months of implementation.

This analysis, says Newton, was based on actual Class I pool volume as determined pre-Covid, and does not account for the impact on all milk in and out of the pool for which producers were paid at or near FMMO blend price, before deductions.

The bottom line in looking at the Farm Bureau analysis, along with our own past four months of analysis, the new way of calculating Class I – per the 2018 Farm Bill – would be a relatively benign factor in a ho-hum market if dairy product and component values were at least somewhat accurately reflected across multiple manufacturing classes.

On the other hand, it works poorly in a lopsided market where markets are disrupted, huge government purchases occur on some products and not others, and where huge imports of some products (butter) and not others (cheese) impact accumulating inventory differently for the different milk classes.

While magnified in a severe market disruption like Covid-19 has created, the dairy “market” complex has had lopsided markets in the past and will again in the future at some level. The fact that this pricing change was made without a national hearing and without a dairy producer vote and without an FMMO administrative hearing is concerning.

Some members of Congress have stated that National Milk Producers Federation (NMPF) and International Dairy Foods Association (IDFA) — together — agreed on and requested this Class I pricing change and that Farm Bureau took a non-position, making the change a “no-brainer” for Congress to include in the Farm Bill. 

Farm Bureau had done analysis before the change was implemented showing the average over time was neutral. But neutral over time does not reflect month to month cash flow impacts and messed up risk management tools when markets diverge.

What we see in this so-called “neutral” change is the capacity for processors to manipulate the transfer of market value by playing one class against others and essentially removing ‘market value’ from producer milk checks.

Congress needs to hear the story of how dairy farms are impacted in their cash flow and use of risk management tools when a minimum of $1.48 billion in component value is simply sucked out of milk checks over a 4-month period. 

Yes, CFAP payments help dairy farmers. But government payments lead dairy even farther away from establishing market value to become more reliant on government payments that, quite frankly, come with more and more strings attached.

Remember, USDA Dairy Programs responded in a Farmshine interview in August to explain that the value missing from pools is “still in the marketplace” even if it doesn’t show up in the FMMO blend prices.

Specifically, USDA stated in that August 3 email that, “The blend price (SUP) is a weighted average of the uses of milk that was pooled for the marketing period (month). If some ‘higher value’ use milk is not in the ‘pool’ then the weighted average price will be lower. It is important to note that the Class III money still exists in the marketplace. It is just that manufacturing handlers are not required to share that money through the regulated pool. 

From the looks of milk checks shared in Farmshine’s Market Moos survey in June and July — and looking at the All-Milk prices reported by USDA through August — this ‘money that still exists in the marketplace’ has been largely unshared with producers.

The Class I pricing change was made, according to NMPF / IDFA to so that Class I processors could manage their price risk with forward contracting.

However, CME market brokers and analysts who were questioned about the use of forward contracting by Class I milk bottlers say that few, if any, are doing it. Part of the NMPF / IDFA push for this change was their statements that Class I bottlers would use risk management to stabilize their milk costs if the higher-of method was abandoned in favor of “averaging”.

In fact, some analysts we spoke with report there’s no incentive – even with the new formula – for processors to forward contract a perishable, quick-turnaround product like gallon jug milk. It doesn’t sit in a warehouse like cheese or butter or powder.

… Unless it is shelf-stable ultrafiltered milk — like Coca Cola’s Fairlife products. Coca Cola purchased the remaining shares of Fairlife from the Select Milk Producers cooperative on Jan. 3, 2020 — just 9 months after the new Class I pricing method was implemented.

The industry said this Class I pricing change was needed so that fluid milk processors could stabilize prices and in turn be positioned to invest in fluid milk processing and innovation, which would help dairy producers in the end by providing more Class I markets.

But what happened? Just 6 months after the new Class I pricing method was implemented, the largest fluid milk bottler, Dean Foods, filed for bankruptcy protection and sale in November 2019 with DFA waiting in the wings to buy. Then, 3 months after that, Borden filed bankruptcy and ended up selling to a consortium headed by former Dean CEO Gregg Engles.

Farm Bureau’s analysis this week estimates the impact on dairy farmer revenue from a purely Class I perspective. It does not quantify the full extent of component value removed from FMMOs in the process. Thus, the $403 million cumulative loss impact declared by Farm Bureau represents about 28% of the total loss – which is equivalent to the current nationwide Class I utilization.

This is a Class I pricing calculation change, but its impact on FMMO blend prices and farm-level mailbox prices is pervasive.

In addition, it is important to be aware in this discussion of loss impacts that there is absolutely zero method of calculating the market value of fresh fluid milk. It is not possible to determine what fresh fluid milk is worth because it is:

1)      Regulated by federal and state milk marketing orders and boards,

2)      Used as a loss-leader by supermarkets selling it far below its cost – especially the largest milk bottling retailers like Walmart and Kroger, and

3)      Federal government restrictions on the fat level of milk children are “allowed” to consume at school or daycare.

In short, the federal government controls fluid milk through USDA in lockstep with NMPF / IDFA — and don’t forget, DMI. Dairy checkoff figures prominently in this equation with the same heavyweights at the same table — pushing fat-free, low-fat, ultrafiltered, shelf-stable products, even 50/50 plant-based blends. 

Even DMI CEO Tom Gallagher is on record stating that the white gallon isn’t the future because even if children can have whole milk “innovation” is needed and admitting that his job is to “get processors to do stuff with your milk”. 

For processors to “do stuff with your milk”, they have to be promised a bigger margin. This could explain why the forward-looking focus of farmer-funded checkoff efforts is on innovation (processing partner margin), not on promoting and educating consumers about fresh fluid milk. And, it might explain why this new Class I formula was needed to average the only so-called market value left in the so-called dairy market.

CFAP payments are salve on some wounds, but the larger issue is still clear: Dairy producers need a voice — apart from the organizations that claim to represent them.

-30-

Negative PPDs cost dairy farmers $1.48 billion in UNPAID component value for June-Aug milk, Sept. figures will be announced soon

By Sherry Bunting, published Sept. 14, 2020 in Farmshine

BROWNSTOWN, Pa. — The negative Producer Price Differentials (PPDs) persisted in final payments for August milk received by dairy farmers in mid-Sept., according to uniform prices announced by USDA Federal Milk Marketing Orders September 11 and 12.

This pushed uniform prices lower in some Federal Orders, while others were higher. (See chart above).

The bottom line is a cumulative loss impact of $1.48 billion in UNPAID market value of milk components across the seven Multiple Component Pricing Federal Milk Marketing Orders (FMMOs) — not to mention unquantified losses in the 4 fat/skim pricing FMMOs — after three months of significantly negative PPDs for June, July and August milk as paid in July, August and September 2020.

Losses incurred by the four Fat/Skim Pricing Orders, but are not easily quantified on the FMMO pool balance sheet and were most pronounced in June for those FMMOs.

More losses will be added for September milk, paid in October, and the CME futures indicate loss impacts could continue through yearend.

This unpaid component market value — represented by negative PPDs (the difference between the uniform price and the announced Class III price) — has cost dairy producers using risk management tools even more as such tools utilize primarily the Class III price as a market indicator. When the Class III price rallies, but the milk check doesn’t mirror that, a producer can be left without the higher price in the milk check and without the coverage through the risk management at the same time.

This would be like having a fire and having the adjuster look at a neighbor’s intact house to determine no claim, instead of looking at the house that burned. When the market says ‘no fire here’ but the house burned down just the same, it’s a double-whammy.

Remember, fluid milk does not have a ‘market’ because the Class I price is both regulated at varying degrees by state and federal marketing orders, and at the same time, fluid milk is used as a loss-leader by the nation’s largest supermarkets. Thus, it is impossible to determine the “market value” of fluid milk.

Add to this the restriction of fat content in schools and other institutional feeding by the federal government, and market value of fluid milk – especially whole milk – is further impinged by non-market factors.

This means the value of the components in fluid milk can only be assigned by the value of dairy products made with milk. When that market rallied on Class III, while plummeting on Class IV, the “market” value was pulled instead of pooled.

Several factors are creating the problem.

First, Covid-19 caused disruption in markets that are now heavier on the retail side and lighter on the foodservice side. The industry is adjusting to this.

Second, a ‘band aid’ approach to milk pricing reform in the 2018 Farm Bill changed the Class I relationship to an uptrending manufacturing class market by using an averaging method instead of the “higher of” Class III or IV. This is just one reason a national hearing on milk pricing with report to Congress is long overdue.

Third, the spread between Class III and IV milk futures persists, so even when Class I and Class III were close in price for August, Class IV and II were so far behind that negative PPDs and de-pooling occurred. Current levels show a $4 to $5 spread for September and October and $2 to $3 for November and December.

Fourth, government purchases and import-export factors are affecting storage of Class III and IV products differently, which in turn affects the markets differently.

As mentioned previously in Farmshine, the most recent USDA Cold Storage Report showed butter stocks at the end of July were up 3% compared with June and 13% above year ago. On the other hand, total natural cheese stocks were 2% less than June and up only 2% from a year ago.

On the import side, the difference between cheese and butter is stark. Cheese imports are down 10% below year ago, but the U.S. imported 14% more butter and butterfat in the first seven months of 2020 compared with a year ago.

Is it any wonder butter stocks are accumulating in cold storage to levels 13% above year ago at the end of July — putting a big damper on butter prices and therefore Class IV?

Butter demand is up. Butter imports are up. But the PRICE of butter is at the lowest level since 2013.

Analysts suggest that butter and butterfat imports are higher because U.S. consumer demand for butterfat is higher. But that reasoning doesn’t make sense because the Class IV price and butterfat value is depressed because of “burdensome inventory of butter” in cold storage, holding back butter prices and amplifying the Class III and IV divergence that is at the root of the negative PPDs.

Again, a national hearing on milk pricing is long overdue. Even the risk management tools touted by USDA do not perform as expected due to inverted and divergent price relationships and reduced ability to transfer market value.

On October 5, 2020, American Farm Bureau published its analysis which evaluated a similar loss impact. Read the AFBF analysis here

-30-

Deep discounts on All-Milk prices bring new risk management challenges

NOTE: In the first part of this three-part series, we’ll look at some of the factors contributing to the huge divergence between Class III and IV at the root of current losses in milk income, especially for risk-managers who were caught off guard with no good tools to manage the misalignment and especially the de-pooling. In the next two parts, we’ll look at some of the advice for managing basis risk in CME-based tools and revenue insurance.

IMG-9043

This graph at dairymarkets.org shows the divergence between Class III and IV milk futures at the root of deep discounts in All-Milk prices as compared with Class III.

By Sherry Bunting, Farmshine, Friday, August 7, 2020

BROWNSTOWN, Pa. — Dairy producers find themselves in uncharted territory, where a mixed bag of market factors, pricing structures, class price misalignments, Federal Milk Marketing Order (FMMO) provisions, product-in / product-out flows via imports and exports vs. inventory, as well as the government’s thumbprint on the scales in a pandemic shutdown of the economy and the dairy product purchases that followed. All have affected Class III and Class IV milk prices quite differently, creating deep discounts in blended farm milk prices vs. Class III.

“We’re seeing milk class wars,” said economist Dan Basse of AgResource Company, a domestic and international agricultural research firm located in Chicago, during a PDPW Dairy Signal webinar recently. Basse opined that the current four-class FMMO system is old and outdated with pitfalls creating new volatility issues for producers in the form of the $7 to $10 spread between Class III and Class IV in June / July.

He noted, as have others in the past, that a simpler pricing system with one manufacturing milk price and one fluid milk price is something that “dairy farmers could live within.”

Under the current four-class system, and the new way of calculating the Class I Mover via averaging, dairy farmers now find themselves “living on the edge, not knowing what the PPD (Producer Price Differential) will be,” said Basse.

“A $7.00 per hundredweight discount is a lot of capital, a lot of income and a lot of margin to lose with no way to hedge for it, no way to protect it, when the losses are not being made up at home (as reflected in) the PPD,” Basse related.

Previous Farmshine articles over the past few weeks have explained some of the FMMO factors reflected in the negative PPDs everyone is focused on because they are so large. While June’s PPD was primarily affected by lag-time, the next several months of negative PPDs are likely to occur based on the legislated change to the Class I Mover calculation in the last Farm Bill.

The significance of the PPD is that it indicates to the producer the value of the milk in FMMO-available pool dollars as compared to the announced Class III price. The PPD is how the FMMO pool revenue is balanced.

Normally, component values are paid by class, and the extra is divided by hundredweights in the pool to calculate a PPD reflected as the difference (usually positive) between the FMMO uniform price and the Class III price, according to Dr. Mark Stephenson, University of Wisconsin dairy economist in a recent PDPW Dairy Signal.

When higher-value Class III milk is de-pooled in this scenario, the dollars don’t stretch, so the pool has to be balanced by dividing the loss (negative PPD). Even in the southern FMMOs based on fat/skim the same shortfall occurs and shows up as milk being worth less than Class III, instead of more.

The problem faced right now is the Class III price does not represent the broader industry, and there are no straightforward tools for managing this type of risk, especially when the higher-value Class III milk is de-pooled or replaced with a lower class.

“It’s a terrible situation on the hedging side, with three material sources of the problem,” notes Bill Curley of Blimling and Associates in a Farmshine interview this week.

While he describes ways to manage some of these sources in building a risk management price or margin, such as using a mix of Class III and IV and other strategies that reflect a producer’s milk market blend of classes, “there’s no hedge for de-pooling,” he relates.

In fact, Stephenson illustrates this for the Upper Midwest FMMO 30, showing a difference of $7 between the level of negative PPD for July without de-pooling and the level of negative PPD with de-pooling.

While July de-pooling figures won’t be known until mid-August, the June de-pooling in the Northeast wasn’t as bad as in California, as an example. In California, so much milk is already sold outside the pool, that it is easy to replace virtually all of the Class III milk with lower-value Class IV in this divergent classified price scenario.

In the Upper Midwest, only so much de-pooling can occur due to qualifying criteria, so utilization that may normally be 75% Class III, was 50% in June. They don’t have enough Class IV to simply replace Class III and stay qualified on the Order.

Curley and others explain that this situation could leave producers unprotected, especially since they can’t control any of the sources of misalignment between their All-Milk price and Class III. The only factor they can control is whether or not to drop the hedges, which then leaves them unprotected for market risk at a volatile time in the midst of a pandemic as virus rates are reportedly re-surging.

Meanwhile, this week began with risk working its way back into markets as three consecutive days of steep losses in CME cheese and butter prices pushed both Class III and IV milk futures lower, but still with a $4 to $7 gap between them in the next few months.

For its part in balancing broader industry demand, USDA announced a third round of food box purchases for September and October, which will again include cheese, but this time will include more from Class II (sour cream, yogurt, cream cheese) as well as some butter from Class IV. All told, the government will have spent about $1 billion in three phases of dairy purchases for the Farmers to Families Food Box program.

Stephenson reminds producers of the silver lining in this cloud.

“Remember what the pandemic economy looked like just a little over two months ago,” he said. “It was absolutely devastating. Cheese was at $1.00/lb, and milk dumping was unprecedented.

“Now, as we look at things, it’s going to be better than we expected then,” he said showing the All-Milk price for 2020 is now forecast to come in at just under $18 for the year, but that many farms will net $20 per hundredweight for the year via the combination of Dairy Margin Coverage (DMC) and Coronavirus Food Assistance Program (CFAP) payments.

He estimates 2020 DMC payments at the $9.50 coverage level should net 66 cents across annual production for the year while CFAP payments have produced, so far, an impact equal to $1.55 per hundredweight across annual production.

For many producers, however, it won’t feel like $20. It might not even feel like $18.

Agricultural Prices 07/31/2020

USDA NASS reported June All-Milk prices last Friday, July 31. The range from high to low is $8, nearly double the normal range. At $18.10, the U.S. average All-Milk price did push the Dairy Margin Coverage milk margin above the highest payout level at $9.99.

Take June milk checks for example. USDA announced Friday, July 31 that the June U.S. All-Milk price was $18.10. That’s almost $3 below the Class III price of $21.04 for June, something we just don’t see.

Worse, USDA’s own report showed an $8.00 per hundredweight spread between the lowest All-Milk price reported at $14.80 for Michigan and the highest reported at $22.70 for South Dakota. This unprecedented spread is almost double the normal range from top to bottom. (Table 1)

Also unprecedented is the Pennsylvania All-Milk price reported by USDA for June at $16.30. That’s a whopping $1.80 below the U.S. All-Milk price when normally the state’s All-Milk price is 30 to 60 cents above the U.S. average.

The same thing can be said for Southeast fluid markets and other regions where a mixed products, classes and de-pooling of higher-value milk left coffers lacking for producer payment in the pool, and results varied in how co-ops and handlers  compensated producers outside the pool.

Dairy producers participating in the June milk check survey announced in Farmshine a few weeks ago, have reported gross pay prices that averaged fully $2 below the respective USDA All-Milk prices calculated for their state or region. Net prices, after deductions, averaged $4 below, and the same wide $8 spread from top to bottom averages was seen in this data from over 150 producers across six of the 11 Federal Orders. (Table 2)

This all creates an additional wrinkle in terms of the impact on the DMC margin, which was announced this week at $9.99 for June – 49 cents over the highest coverage level of $9.50 in the DMC program. This margin does not reflect anything close to reality on most farms in June and potentially July.

Large, unexpected and unprotected revenue gap

Normally the All Milk price is higher than Class III, and the cost of managing risk when the market moves higher is then covered by the performance of the cash price, or milk check, instead of the hedge, forward contract or revenue insurance. The inverse relationship in June and July between blend prices and Class III price, left a large, unexpected and unprotected revenue gap.

For its part, USDA AMS Dairy Programs defines the All Milk price in an email response recently as “a measurement of what plants paid the non-members and cooperatives for milk delivered to the plant before deduction for hauling, and this includes quality, quantity and other premiums and is at test. The NASS price should include the amount paid for the ‘not pooled milk.’”

USDA’s response to our query further confirmed that, “The Class III money still exists in the marketplace. It is just that manufacturing handlers are not required to share that money through the regulated pool.”

MilkCheckSurvey080320

By the looks of the milk check data from many areas (Table 2), most of this value was not shared back to producers, with a few notable exceptions. However, economists project the situation for July milk will be worse in this regard.

The factors depressing June and July FMMO uniform prices, USDA All-Milk prices and producer mailbox milk check prices are three-fold: the 6 to 8-week lag-time in advance-pricing of the Class I Mover, the new method of averaging to calculate the Class I Mover, and de-pooling of the higher-value Class III milk. All three factors are rooted in the $7 to $10 divergence between Class III and IV in June and July.

The part of the equation attributed to the new Class I Mover calculation is perhaps most discouraging because this is not money producers will eventually see. On the other hand, the lost value from the advance-pricing lag-time is eventually “caught up” in future milk checks. Most of the discount to come in July farm-level prices and negative PPDs in future months vs. Class III will be from the divergent factors that are not reconciled later.

Demand drivers differ for Class III vs. IV

Driving Class III $7 to $10 above Class IV was the abrupt turnaround in the cheese market, fed by strong retail demand, the resupply of foodservice channels, a significant May rebound in exports of cheese and whey, significant declines in cheese imports in the March through June period, and new government purchases of cheese for immediate distribution under CFAP.

On the flipside, Class IV value weakened at the same time as butter and powder did not have as many competing demand drivers. Additionally, butter stocks were overhanging the market, despite butter being the dairy product that saw the very highest increase in retail demand during the March through June Coronavirus shutdown period with retail butter sales up 46% over year ago.

Butter and powder production in the U.S. are mainly through co-op owned and managed facilities, while cheese production is a mix of co-op, private and mixed plant ownership.

When co-ops petitioned USDA for a temporary Class I floor hearing, most of the pushback came from the Midwest, and there were calls instead for government direct payments and cheese purchases for distribution to bring down what had been a growing cheese inventory. A stabilizer, or “snubber” on the Class I Mover calculation would have helped avoid much of this unrecouped discount on All-Milk price compared with Class III that affected most of the country.

While cheese moved to retail, foodservice, government purchases and export, butter was mainly relying on the surge in retail sales. Butter and milk powder were not draws in government CFAP purchases.

Overall, however, CFAP has not been the biggest driver in the cheese rally, according to Stephenson, although it added another demand driver to the Class III mix.

He notes that while the government CFAP purchases included a lot of cheese, those purchases accounted for 10% of the cheese price rally in June and July. The rest was fueled by retail demand staying strong and restaurants reopening and refilling supply chains, along with strong demand for other dairy products at retail, such as fluid milk. Producers were also pulling back to avoid overbase penalties. These factors combined to reduce cheese production in May and June, while demand drivers reduced inventory vs. demand.

Other dairy products also saw higher retail demand and were included to some degree in the USDA’s CFAP purchases, but without the same level of visible pull for the trade.

Import/export and inventory equation differs for Class III vs. IV

In taking a closer look at imports and exports relative to inventory to gauge differences between the product mix for Class III vs. Class IV, there are some key differences on both sides of that equation.

Exports of cheese in May were up 8%, and whey exports up 16% over year ago, according to U.S. Dairy Export Council.

Meanwhile butter and butterfat exports were down 7% in May, and down 21% below year ago year-to-date.

Powder exports did break records up 24% for May on skim milk powder. Whole milk powder exports were up 83% in May and 44% year-to-date.

On the import side of the equation, cheese imports were down 13% in the March through June period vs. year ago, according to USDA’s Dairy Import License Circular.

Non-cheese imports, on the other hand, were up 37% above year ago at the same time.

One factor hanging over Class IV markets is the butter inventory — up 11% over year ago — despite significant draw-down month-to-month and retail sales volume being almost 50% higher than a year ago throughout the Covid period.

While U.S. dairy imports are dwarfed in volume by U.S. exports, overall, it is notable that the 37% increase in non-cheese imports included 17% more butter and butter substitute imported compared with a year ago during the March through June period and up 28% year-to-date. Furthermore, whole milk powder imports were up by 25% in the March through June period.

Looking ahead

In a dairy market outlook recently, both Stephenson and professor emeritus Bob Cropp said these wide swings that are creating deep discounts are expected to begin moving toward more normal pricing relationships after August, with Class III and IV prices both forecast to be in the $16s by the end of the year, and in the $16s and $17s for 2021.

Already this week, CME cheese has slipped below the $2 mark, pushing August Class III futures under the $20 mark and September into the mid-to-high $16s. Spot butter tumbled to $1.50/lb, pushing Class IV futures down into the low $13s — keeping the divergence between Class III and IV in place.

Experts encourage producers to be thinking more holistically about the milk markets in planning risk management and not to look at Class III as the leading indicator of which direction the market will take.

This makes any discussion of “margin” based on a Class III milk price irrelevant to the reality under the present conditions. In short, risk management tools did what they were designed to do, but new challenges on the cash price, or milk check side, will change how producers implement and use these tools, or blends of tools, in the future.

“Class III might be a wonderful market for cheese, but it’s not reflecting the entire dairy industry. Risk managers are losing margin on contracts that were meant to protect them from market risk,” says Basse.

“We normally trade at an All-Milk premium to the CME Class III. Today, that has changed dramatically,” he adds. “We are at a significant discount to the CME. We just don’t see these discounts relative to the CME. It is unprecedented.”

-30-

Farmers send June milk check data and preliminary review is revealing

MilkCheckSurvey072920

UPDATED! By Sherry Bunting, Updated from the article in July 24 Farmshine print edition

BROWNSTOWN, Pa. — June milk check reports are pouring in after Farmshine’s previous article about negative Producer Price Differentials (PPD) included a request for milk check data from readers. Along with the data, we are receiving many comments.

One producer notes the PPD had typically averaged a positive $1.50 in his area of the Northeast, but for June, it was a negative $5.38, a loss he pegged at $15,000 for the month for his farm.

Another producer in the Mideast area noted a loss of over $60,000 in component value, which would not be covered in the way expected by the Dairy Revenue Protection (DRP) policy he had purchased. The negative PPD loss represents “basis risk”, whereas tools like DRP, forward contracting, even DMC, mitigate “market and margin risk.”

The “markets” did their thing. Demand went up, cheese prices went up, Class III milk contracts gained, but the de-pooling in most Federal Milk Marketing Orders (FMMOs) ate up most of the doubled protein value and other component value gains for farms across most of the country, as reflected in a steeply negative “basis”. There’s really no risk management tool for that, and we’ve received correspondence indicating that producers who opted to manage risk, had losses where they thought they would have coverage.

It’s difficult to make sense of it all, especially when FMMO Market Administrators explain all the workings of PPDs in terms of advance pricing, sudden commodity increases that are complicated by advance pricing of Class I, pooling and de-pooling of milk when Class I milk value is lower than the blend price. But these explanations leave out the fact that Congress changed the way the Class I Mover is calculated at the request of NMPF and IDFA in the 2018 Farm Bill, without holding a milk pricing hearing that so many have requested.

This is a big concern going forward. The spreads between the higher Class III price over the Class I Mover are $9.62 for June and $7.75 (estimated) for July.

From July, forward, the lagtime is less of a factor. However, the new way vs. the old way of calculating Class I is a much bigger factor in predicted negative PPDs because as Class III has been rising, Class IV has been falling, widening the divergence.

The final math equation for the Class I Mover is the same as it was: Class I Mover = (Base Skim Milk Price x 0.965) + Butterfat Price x 3.5). What changed in May 2019 is the way the Base Skim Milk Price is determined before it is placed in that calculation. It used to be simply the higher of the two Advance Pricing Factors — Class III or Class IV — that was plugged into that equation as the “Base Skim Milk Price. Now the two Advance Pricing Factors are added together, divided by 2, and 74 cents is added to that to produce the Base Skim Milk Price for the final equation above.

Under the previous way, using the “higher of,” the August Class I Mover would have been $24.36 — $4.58 higher than the $19.78 Class I Mover announced on July 22 for August. Also, under the previous method, July’s Class I Mover would have been $19.13 — $2.57 higher than the announced July Class I Mover at $16.56.

These new concerns in FMMO pricing bring new variables into how producers manage risk, so the market value that did not make it into milk checks or risk management tools cannot be blamed completely on Covid-19 pandemic disruptions. A convergence of factors have created a situation where the mechanics of risk management like Dairy Margin Coverage (DMC) and Dairy Revenue Protection (DRP) — as well as forward contracting — may not work as intended for all producers in all regions in a time of disrupted markets and extreme risk, with fairly recent changes to certain milk pricing formulas.

This market disruption, and the fallout in negative PPDs, should signal to USDA and the Congress that a National Hearing on Milk Pricing is overdue. Piecemeal changes have consequences. The de-pooling exacerbates the situation. In June, de-pooling contributed to removing hundreds of millions of dollars of value from milk checks across all Federal Orders. As one producer asked, who gets that money? The answer: It depends.

First, if the end-product “market” value found was paid to the plant or cooperative or handler, and if the handler consequently de-pooled the milk and didn’t pass that value back to the farms voluntarily or contractually, then we know who has the money. If the “market” did not pay what we see in the USDA end-product pricing or on the CME spot market and futures markets, then it’s not real money.

Given the wide range in milk check data with most of the nation coming in around $5 to $7 lower than the Upper Midwest — and a $4 range in FMMO uniform prices to begin with — it’s obvious the “market” is paying. But the calculations are not passing through to milk checks, except in the Upper Midwest Order 30 where 50% of pooled milk receipts were utilized as Class III milk, even though Class III volume reductions suggest significant de-pooling occurred.

Let’s look at preliminary data from Farmshine readers around the country (Table 2 above).

So far, over 150 Farmshine readers from six of the 11 FMMOs have provided milk check data. Since only a couple responses were received from California, we did not do any math for FMMO 51 yet, until we receive more data. At this writing, we have not received any milk check data from Orders 6 (Florida), 126 (Texas and New Mexico), 124 (Arizona) and 131 (Oregon and Washington).

What is evident in the preliminary review is the significant gap between the highest and lowest gross and net prices paid.

For each of the six FMMOs — where we had enough data to do some math — we see the difference of $7 between the FMMO with the highest average gross price paid (before deductions) of $20.81 in the Upper Midwest (FMMO 30) and the lowest average gross price paid of $13.77 in the Central Order (FMMO 32). When looking at the range of price data, the spread is $8 between some check data as low as $13.02 gross pay price in Pennsylvania to $21.05 in Minnesota.

The other FMMO average data fall into place $4 to $6 below the Upper Midwest with gross pay price averaging between $14.97 and $16.15 before deductions.

On the net mailbox price (after deductions), the difference is almost $7 between the highest mailbox average of $19.74 for FMMO 30 and the lowest average of $12.97 for FMMO 32. Average net mailbox price for FMMOs 1, 33, 5, and 7 trail FMMO 30 by a difference of $5 to $6. (See Table 2.)

Respondents for each of the FMMOs so far are a mix of mostly co-op members, but also some independent shippers, and a range of cooperatives — national and regional — are represented in the data.

In the Upper Midwest FMMO 30 for June, where PPD was least negative and Class III milk utilization was the highest (50%), the Uniform price already reflected the smallest negative PPD in the $3s compared to negative $5s and $7s everywhere else. At the same time, reports indicate the cheese plants and co-ops in that region even shared some of that smaller loss, knocking it back into the negative $2’s.

While large penalties for overbase milk still remain part of the pricing equation, it was not a major factor for most producers in June, perhaps because producers are reducing production as well as dumping, donating or utilizing overbase milk differently to avoid these penalties. This process is continuing into July. In the Northeast and Midatlantic region, reports of milk dumping were confirmed in July. Mostly this was due to producers wanting to avoid overbase penalties, but at least one report involved temporary “plant equipment issues”.

Of the milk check data shared with Farmshine, most showed producers were shipping 93 to 99% of their base for June. But some data includes producers seeing significant assessments on small amounts of overbase milk by both smaller regional cooperatives and larger national footprint cooperatives — except in the Upper Midwest. Also, in pockets of the Southeast, check data show some penalties were waived as a base / overbase blend was shown on checks, but then in another spot, the stub reported “revenues available to pay” a better price. In those instances, it appears the overbase penalty was eliminated and market adjustments reduced, which added 30 to 50 cents to what the location blend would have been.

Elsewhere, producers overbase deductions ranged $1.50 to $6.40.

Another variable was “market adjustments”. No “covid” deductions were seen in June check data, however, many had “market adjustments” deducted to the tune of 13 to 24 cents. In a few cases, the “market adjustment” was described in an earlier letter stating that the “covid” deduction for co-op costs incurred in April and May was being spread out evenly over several months forward.

The averages for the Northeast and Mideast FMMOs belie the wide range in prices. For Pennsylvania, alone, the range in gross pay prices before deductions was more than $4.00/cwt.  Even after adjusting for butterfat, the range was $3.50. The lowest net mailbox prices submitted by anyone in any FMMO came from Pennsylvania producers, with instances as low as $11.20/cwt mailbox for June. Overbase penalties and market adjustment deductions contributed to these lower nets.

In Pennsylvania, the Pa. Milk Marketing Board (PMMB) over-order premium (OOP) was set large for June, but was a small factor on most milk checks. It does appear that the western half of the state in Order 33 received at least some OOP benefit to make up for taking a more significant beating from negative PPDs.

Very few producer milk checks showed numbers other than zero in the PMMB OOP line item. However for Pennsylvania producers shipping directly to some Pennsylvania bottlers in the Mideast order, the benefit was $1.25 to $2.00/cwt listed as a line item and serving to simply pull them up closer to where the Northeast blend price sat. Remember, negative PPDs in the Mideast Order, which includes western Pa., were in the $7s. Negative PPDs in the Northeast Order, which includes eastern Pa., were in the $5s.

Meanwhile, out-of-state bottlers buying Pennsylvania milk and selling into the Pennsylvania minimum retail price market passed on about 10% of this floor-setting OOP in June at about 30 to 50 cents.

June’s PMMB OOP was over $4 per cwt because $3.68 was added to the normal $1 to make the difference between the USDA Class I Mover and a temporary $15 Class I floor. The PMMB used the OOP to temporarily accomplish this, but then became an island as USDA did not follow suit. The USDA had canceled a hearing requested by cooperatives petitioning it do the same nationally.

Looking at the milk check data we have received, it is obvious that USDA would have done well to have followed PMMB’s lead — as they were petitioned to do in April — to set a temporary Class I Mover floor at $15 through August.

At the time that the PMMB took its action, USDA AMS Dairy Programs had indicated in correspondence shared with Farmshine that a date was set to meet with petitioners to hear evidence for a national temporary Class I floor.

But, when word got out, certain dairy economists, such as at the University of Minnesota, along with Minnesota Milk Producers and other entities, including Walmart, protested that this idea of a temporary Class I Mover floor would “decouple” Class I milk and be unfair to the Upper Midwest where Class I utilization is low. Mainly, they complained that a move to stabilize Class I would “disrupt” milk markets and affect the Dairy Margin Coverage.

Well, folks, that disruption happened anyway — in reverse.

What we have seen, in the absence of a Class I floor, is total disruption and instability due to the inherent lagtime in Class I pricing reflecting market trends, and additional severity because of how the Class I Mover calculation was changed by Congress, with no hearing at all, just placed in the 2018 Farm Bill at the direction of National Milk Producers Federation (NMPF) and International Dairy Foods Association (IDFA).

The so-called “markets” have not worked for any of the FMMO’s dairy producers except for the Upper Midwest where the complaints over flooring the Class I Mover arose.

The change in the calculation of the Class I Mover in the 2018 Farm Bill was implemented one year ago in May 2019. By using an average instead of the “higher of” to determine a base value for components or fat/skim, the Class I Mover no longer moves in concert with the highest value of components or fat/skim.

This is a problem because there is no way to assess market value on Class I in an of itself. Class I beverage milk is a designated loss-leader by the 800-lb retailer-processor gorillas like Walmart and Kroger. Also, in a couple states, the retail milk price is regulated to some degree.

Class I’s new “averaging” method is contributing to the removal of hundreds of millions of dollars from Federal Order pools through de-pooling.

It’s hard to predict what “reality” or “alternate reality” the USDA NASS All Milk price and Dairy Margin Coverage milk margin will reflect when they are announced on July 31.

This is a serious problem, given the widening divergence between Classes III and IV on the futures markets. This divergence is a warning that the current four-class system should be re-evaluated. When two manufacturing classes for stored products can be averaged to produce the basis of value for fresh products and beverages, it’s easy to see how large entities in the marketplace can make decisions that affect imports, storage, supply and demand to move one side of an “averaging” equation and create lopsided returns outside of FMMO pools. If milk moved to its highest value use and components were valued on multiple cross-class markets, a stable Class I base could be established as one piece of an overall value mix with less incentive to de-pool lopsided value.

For example, the July Class III contract stood at $24.41 on the futures markets as of July 27 — now $10.76 higher than the Class IV contract at $13.65. August Class III stands at $22.11, $8.39 higher than the Class IV contract at $13.72. September Class III, at $20.49, is $6.34 higher than the $14.15 Class IV contract. October Class III, at $18.90, is $4.51 higher than Class IV at $14.39. November Class III, at $17.53, is $2.95 higher than Class IV at $14.58. The gap narrows for December, but as of July 27, the difference between the two classes is still more than the $1.48 ‘magic number’ with December Class III at $16.60, $1.81 higher than Class IV at $14.79.

Creating even more value loss in every FMMO in June — whether priced by multiple components or fat/skim — is the amount of Class III milk that was de-pooled. Total volume pooled across all Federal Orders was 9.5 billion pounds in June, down 36% from a year ago and down 28% from May (May 2020 was down 13% from year ago).

While June milk production was reported on July 21 at 0.5% above year ago, milk dumpage in June was down considerably in terms of what showed up on FMMO pools. We know farms are dumping and diverting to avoid overbase penalties, but the pooled “other use” milk, including dumpage and animal feed, was down by 44% compared with a year ago in June. The only Federal Order to have more “other use” milk in June than in May was the Appalachian Order 5, and Central Order 32.

Table1_YTD_MilkDumped(Bunting)r
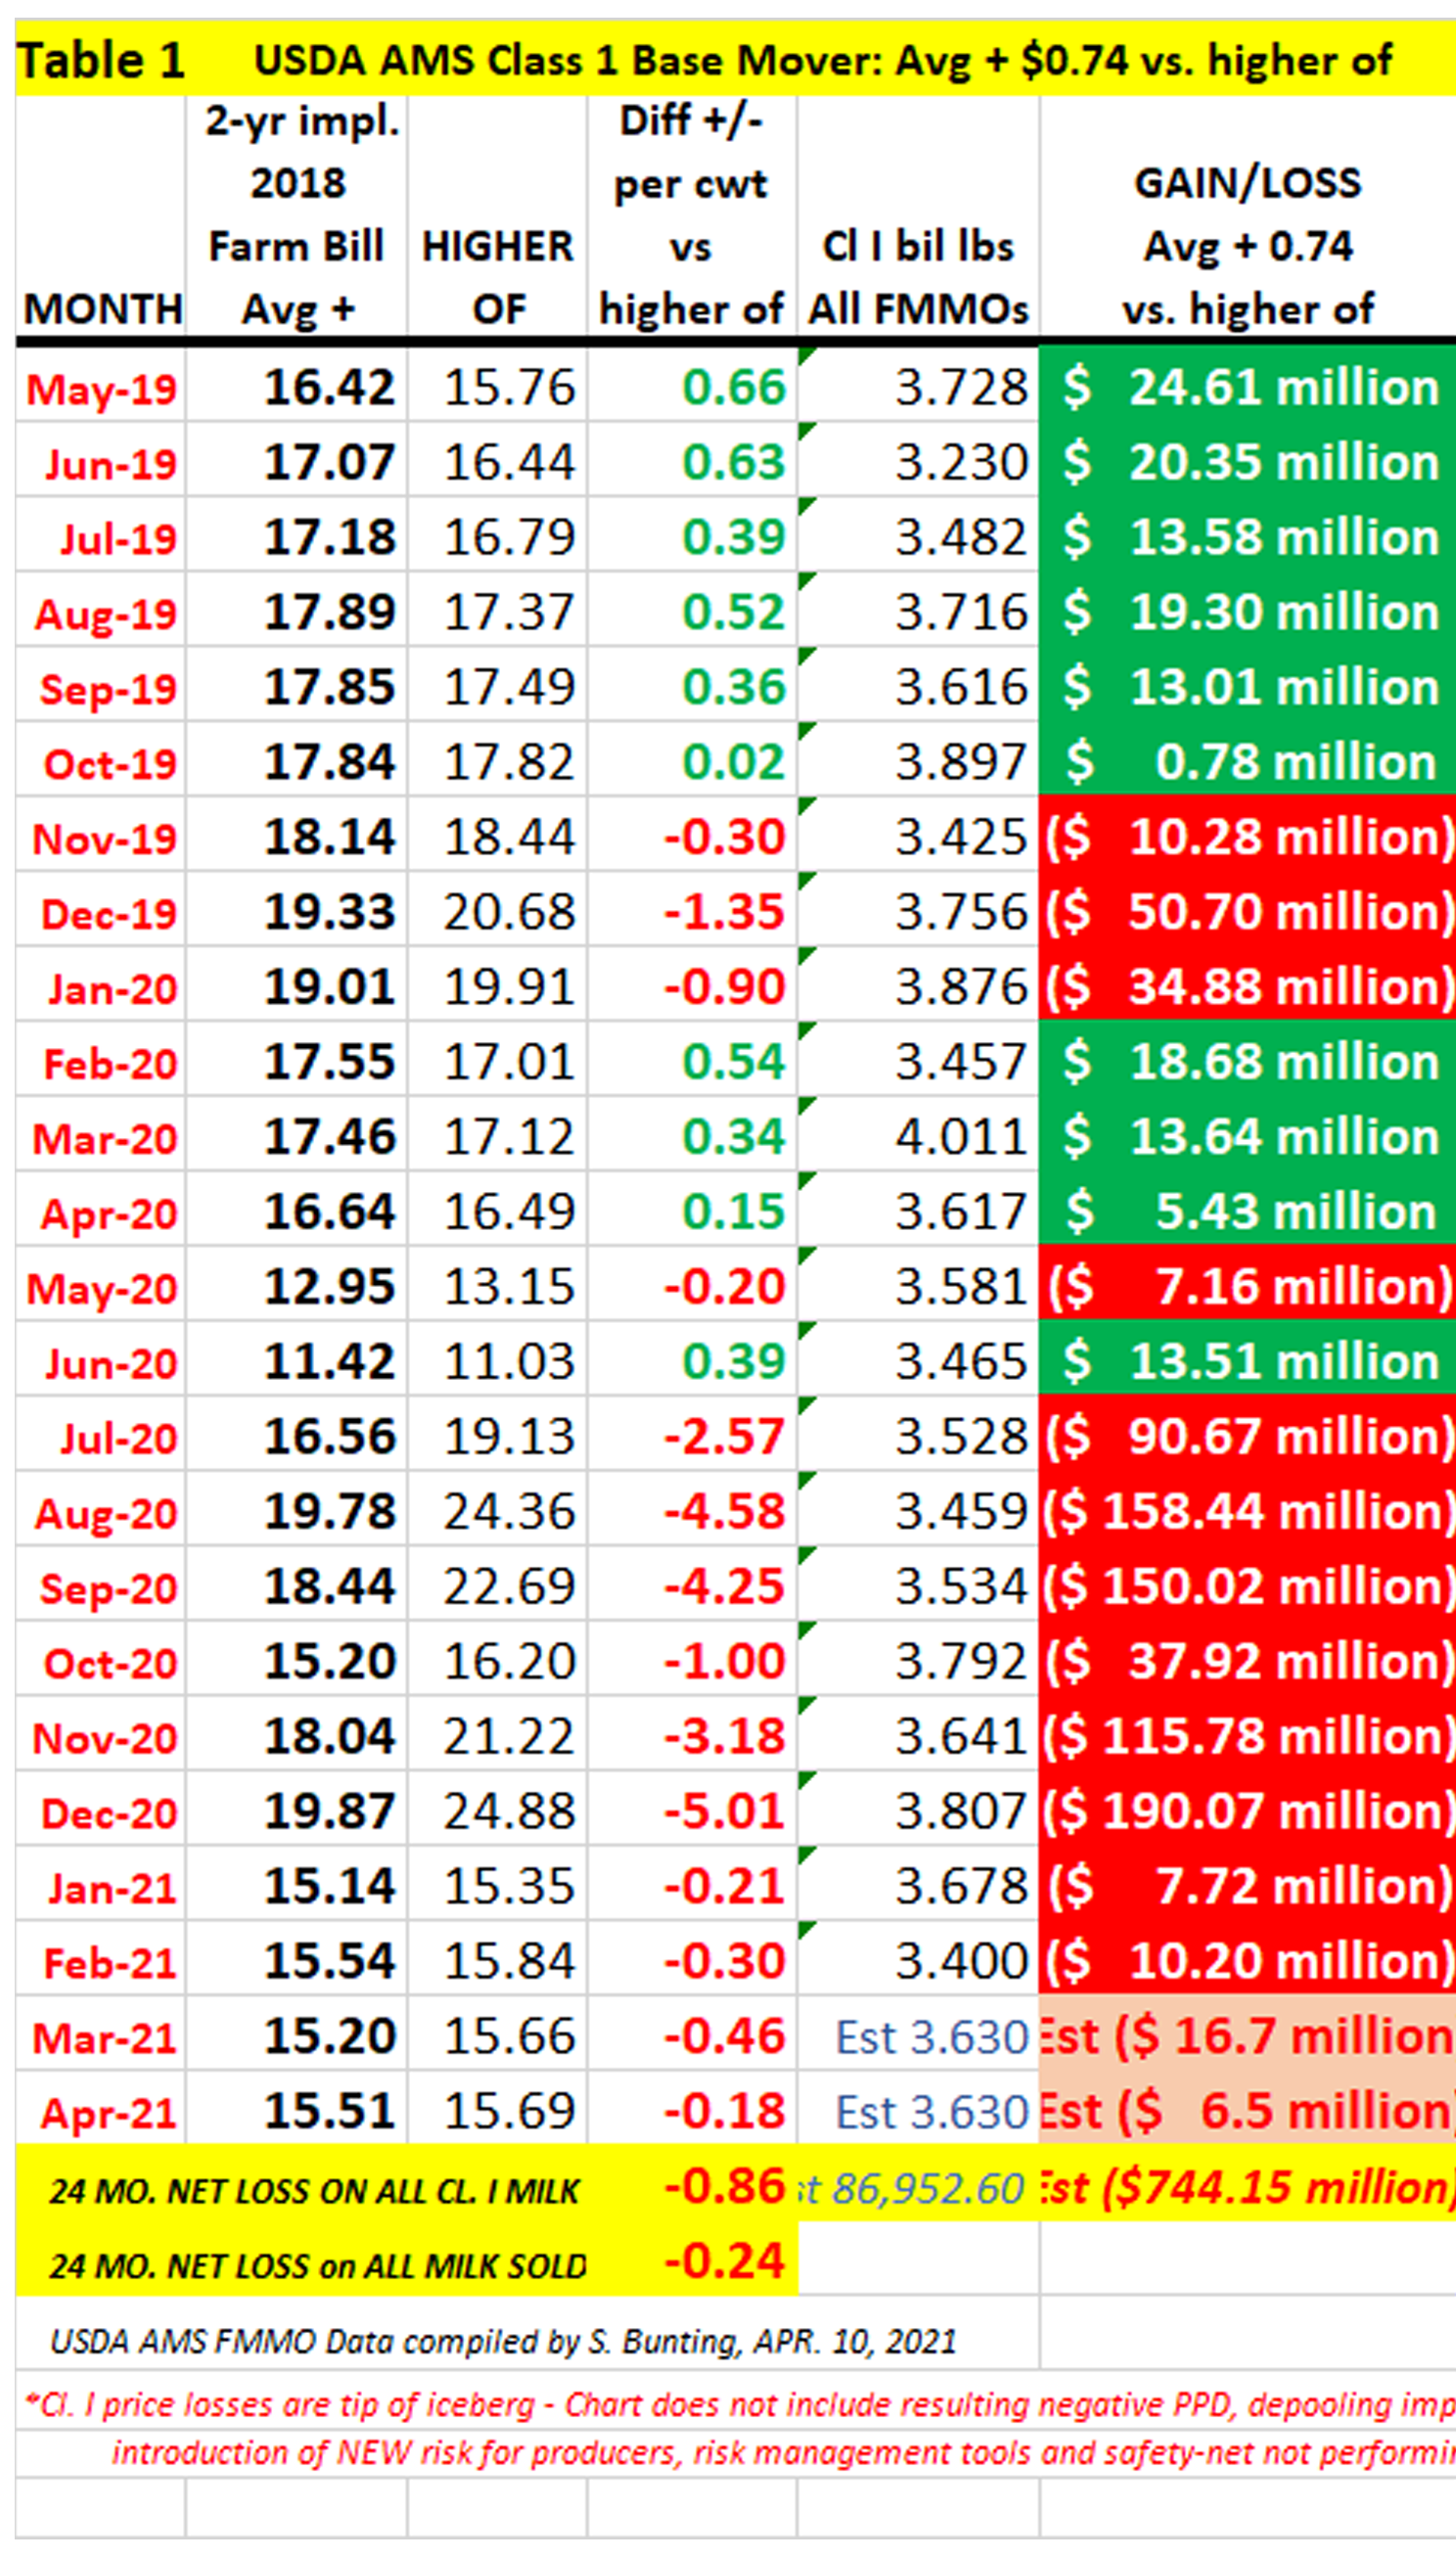
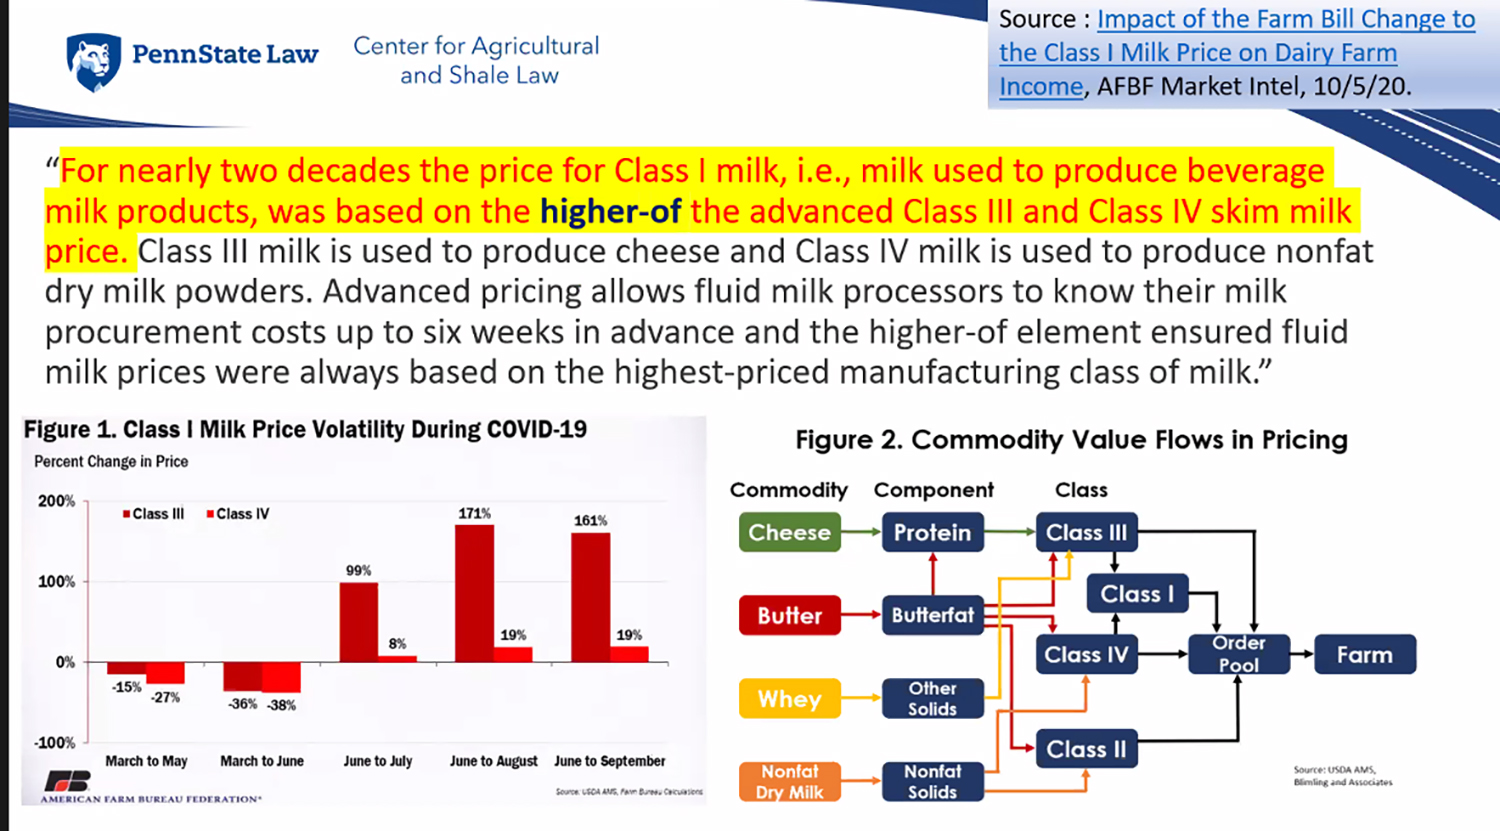
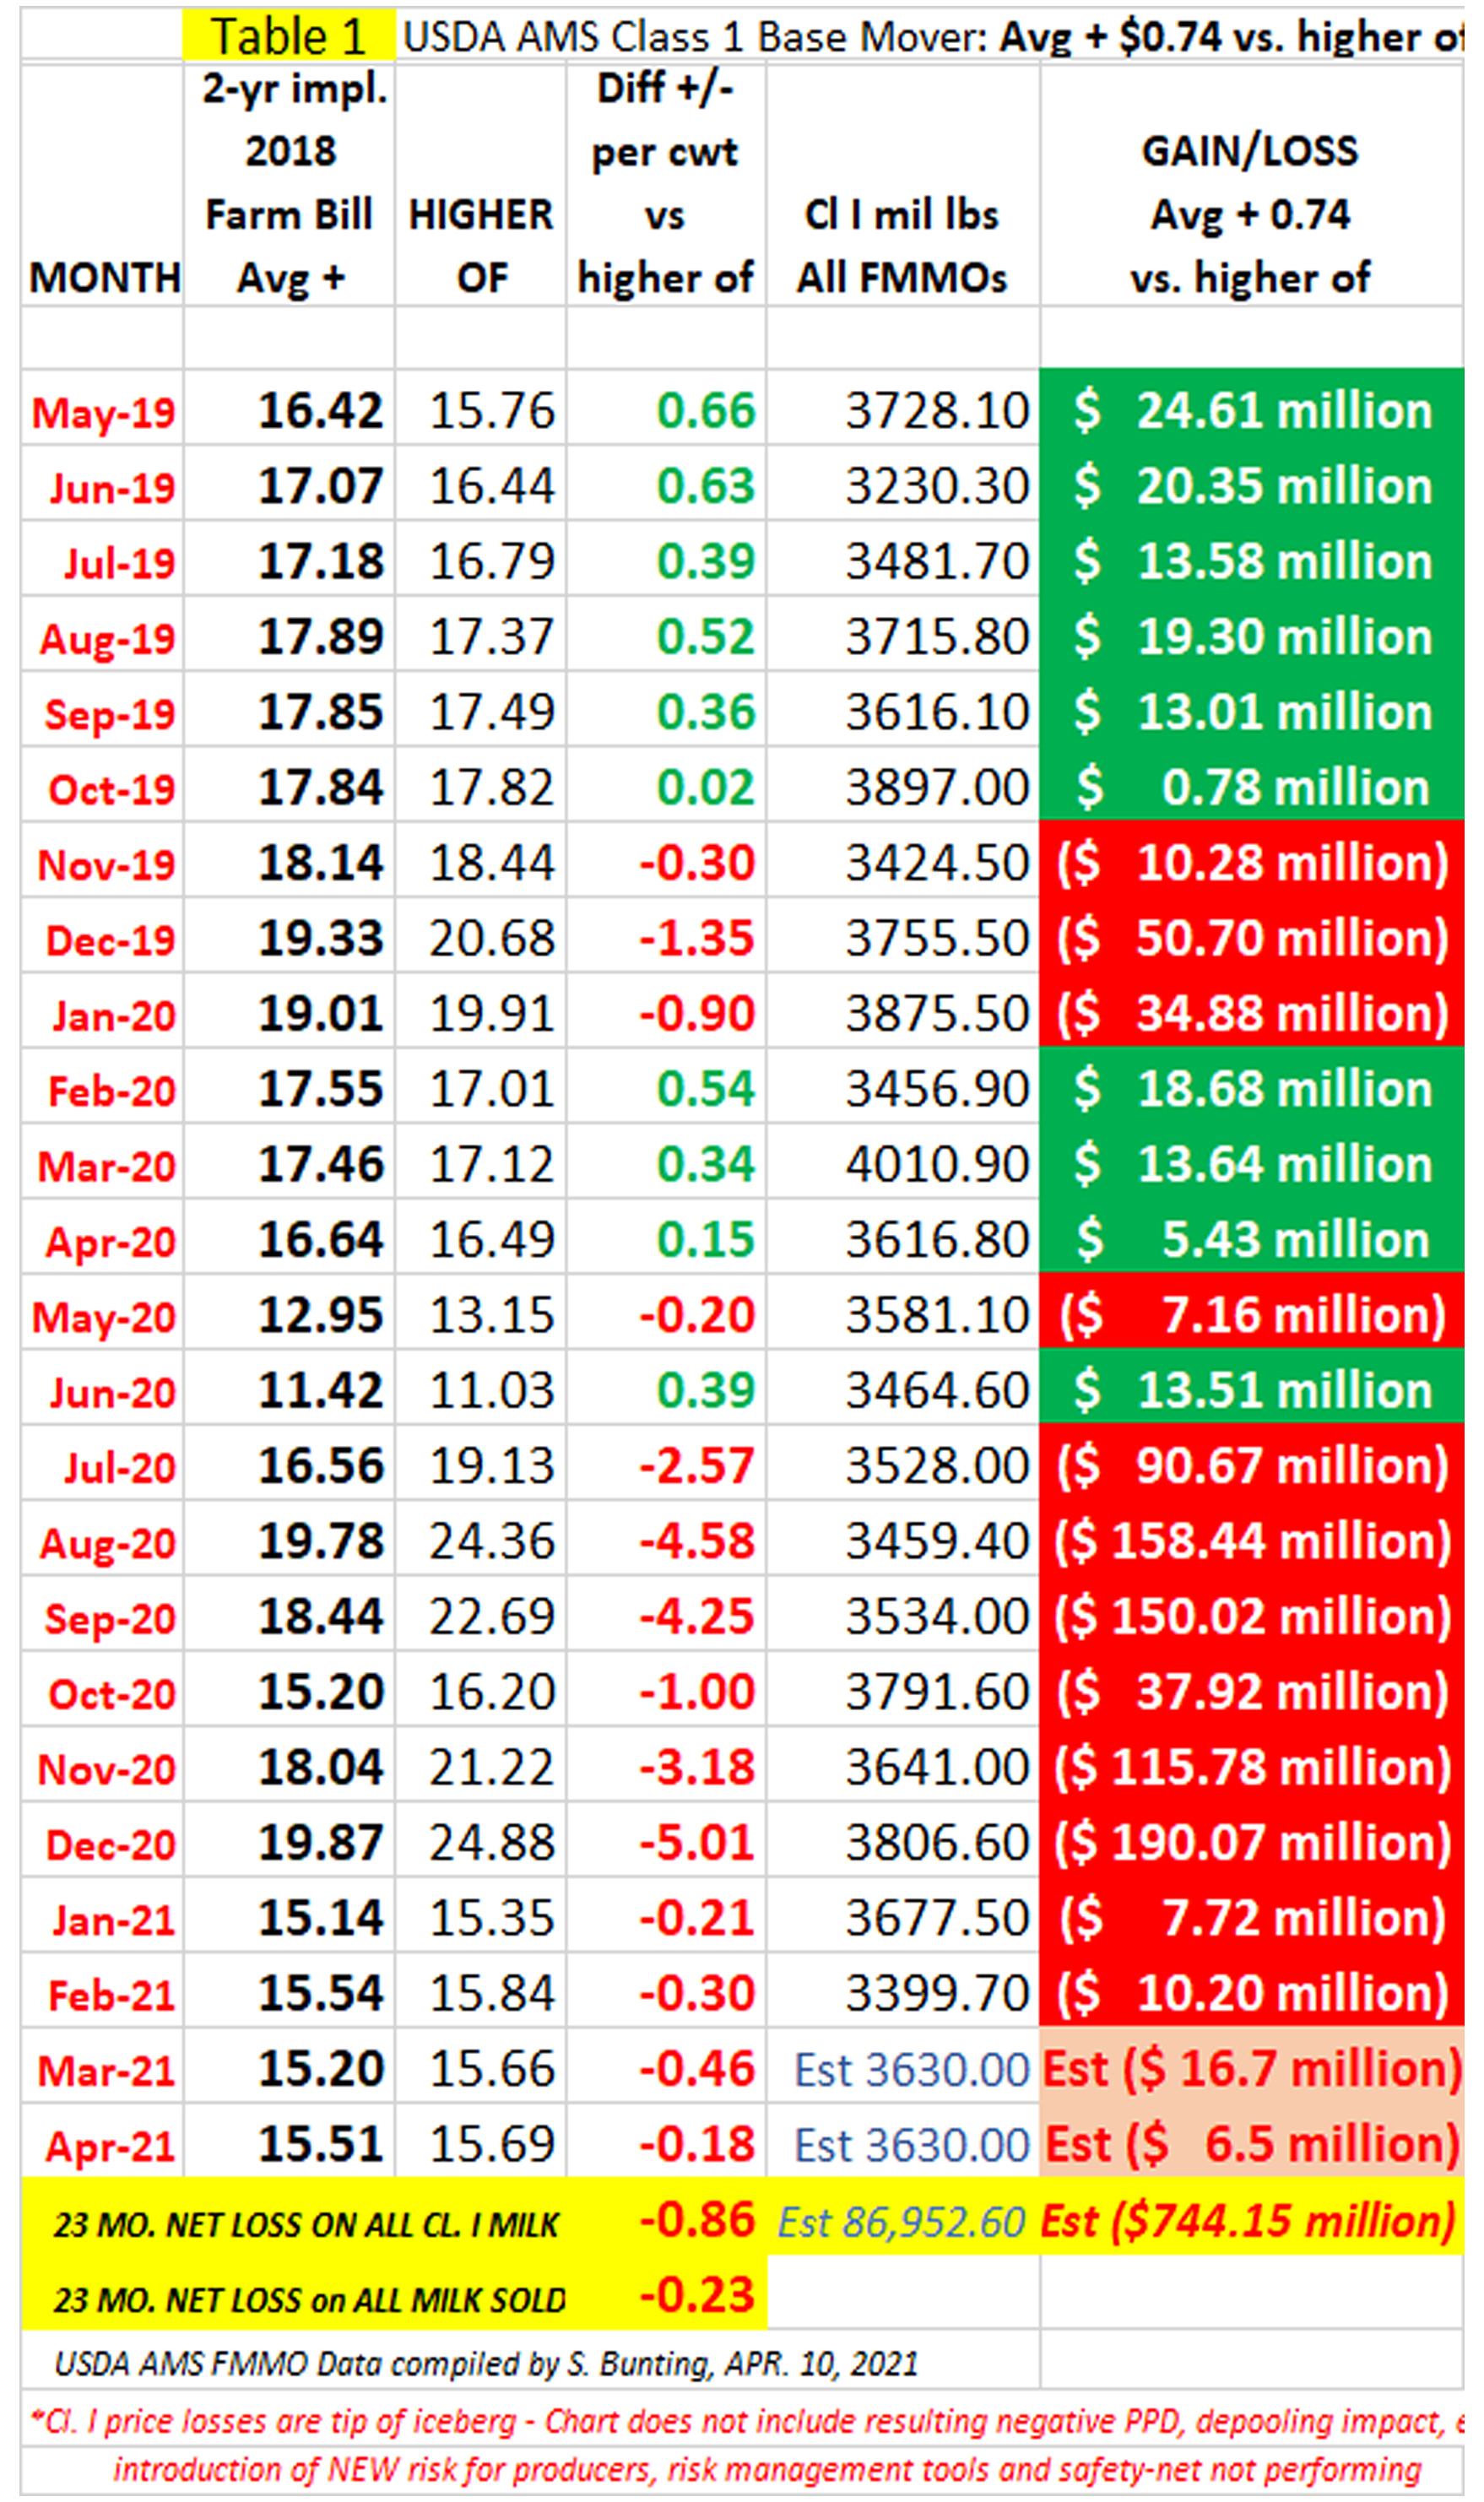
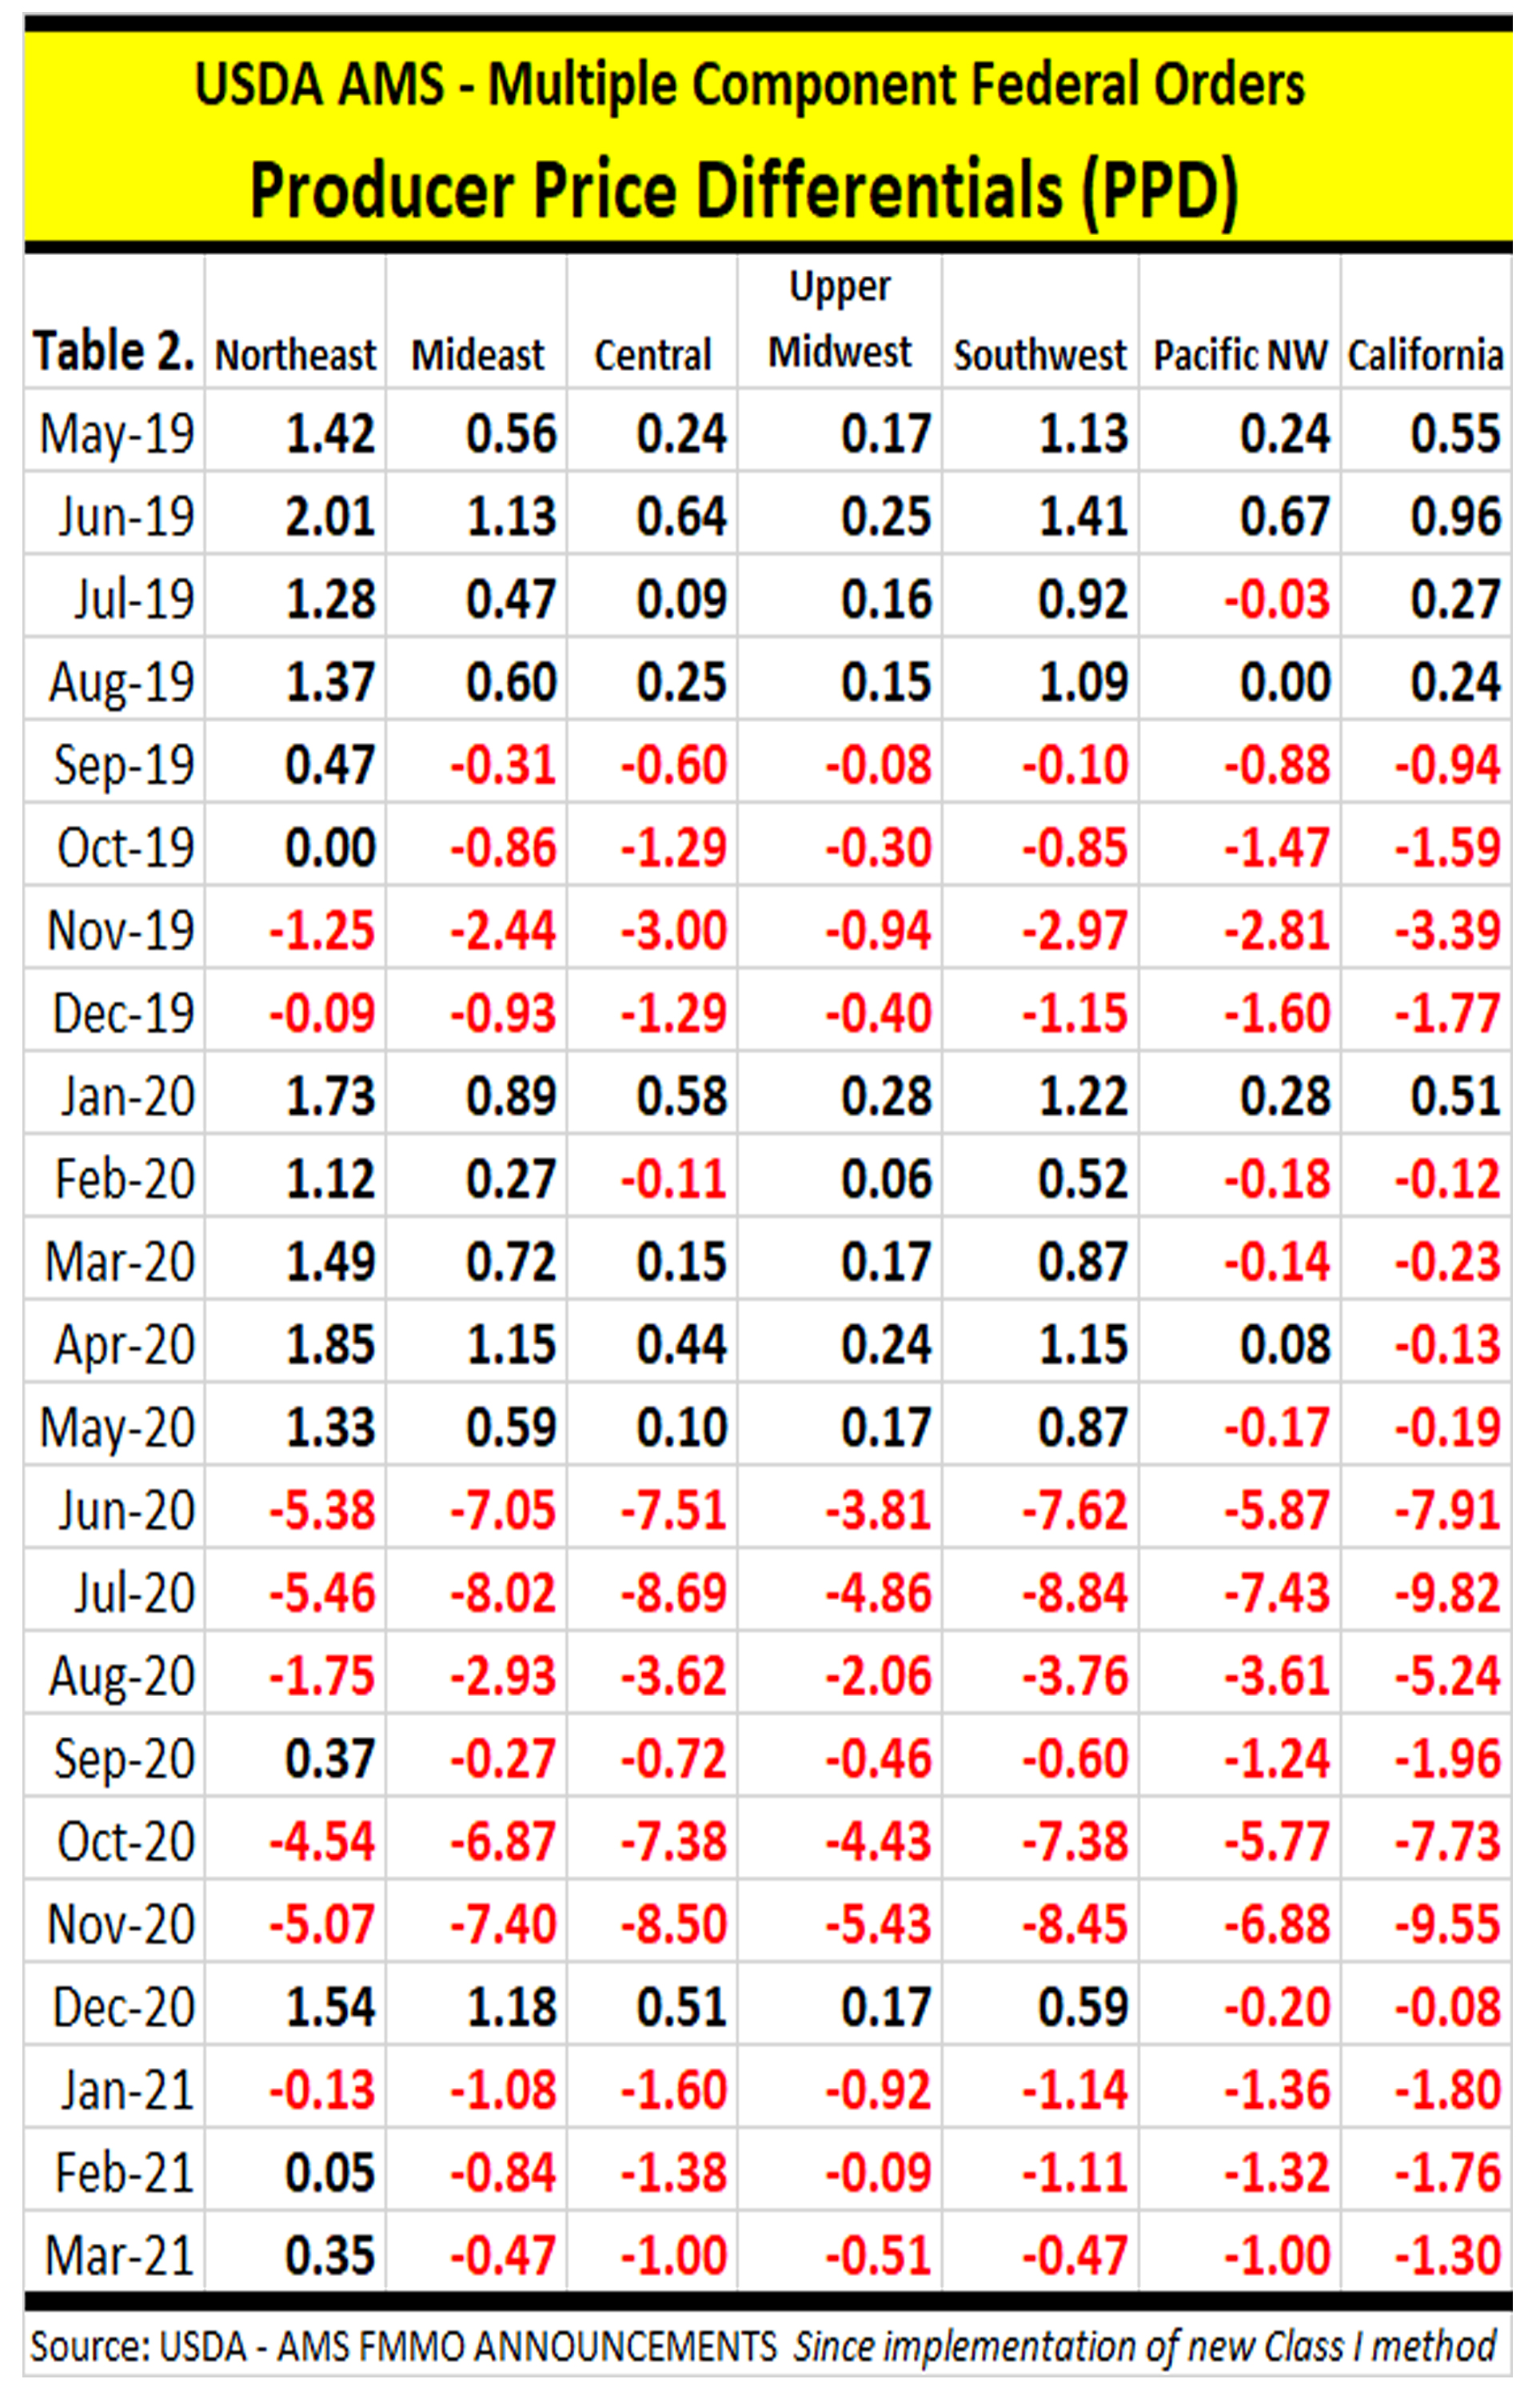
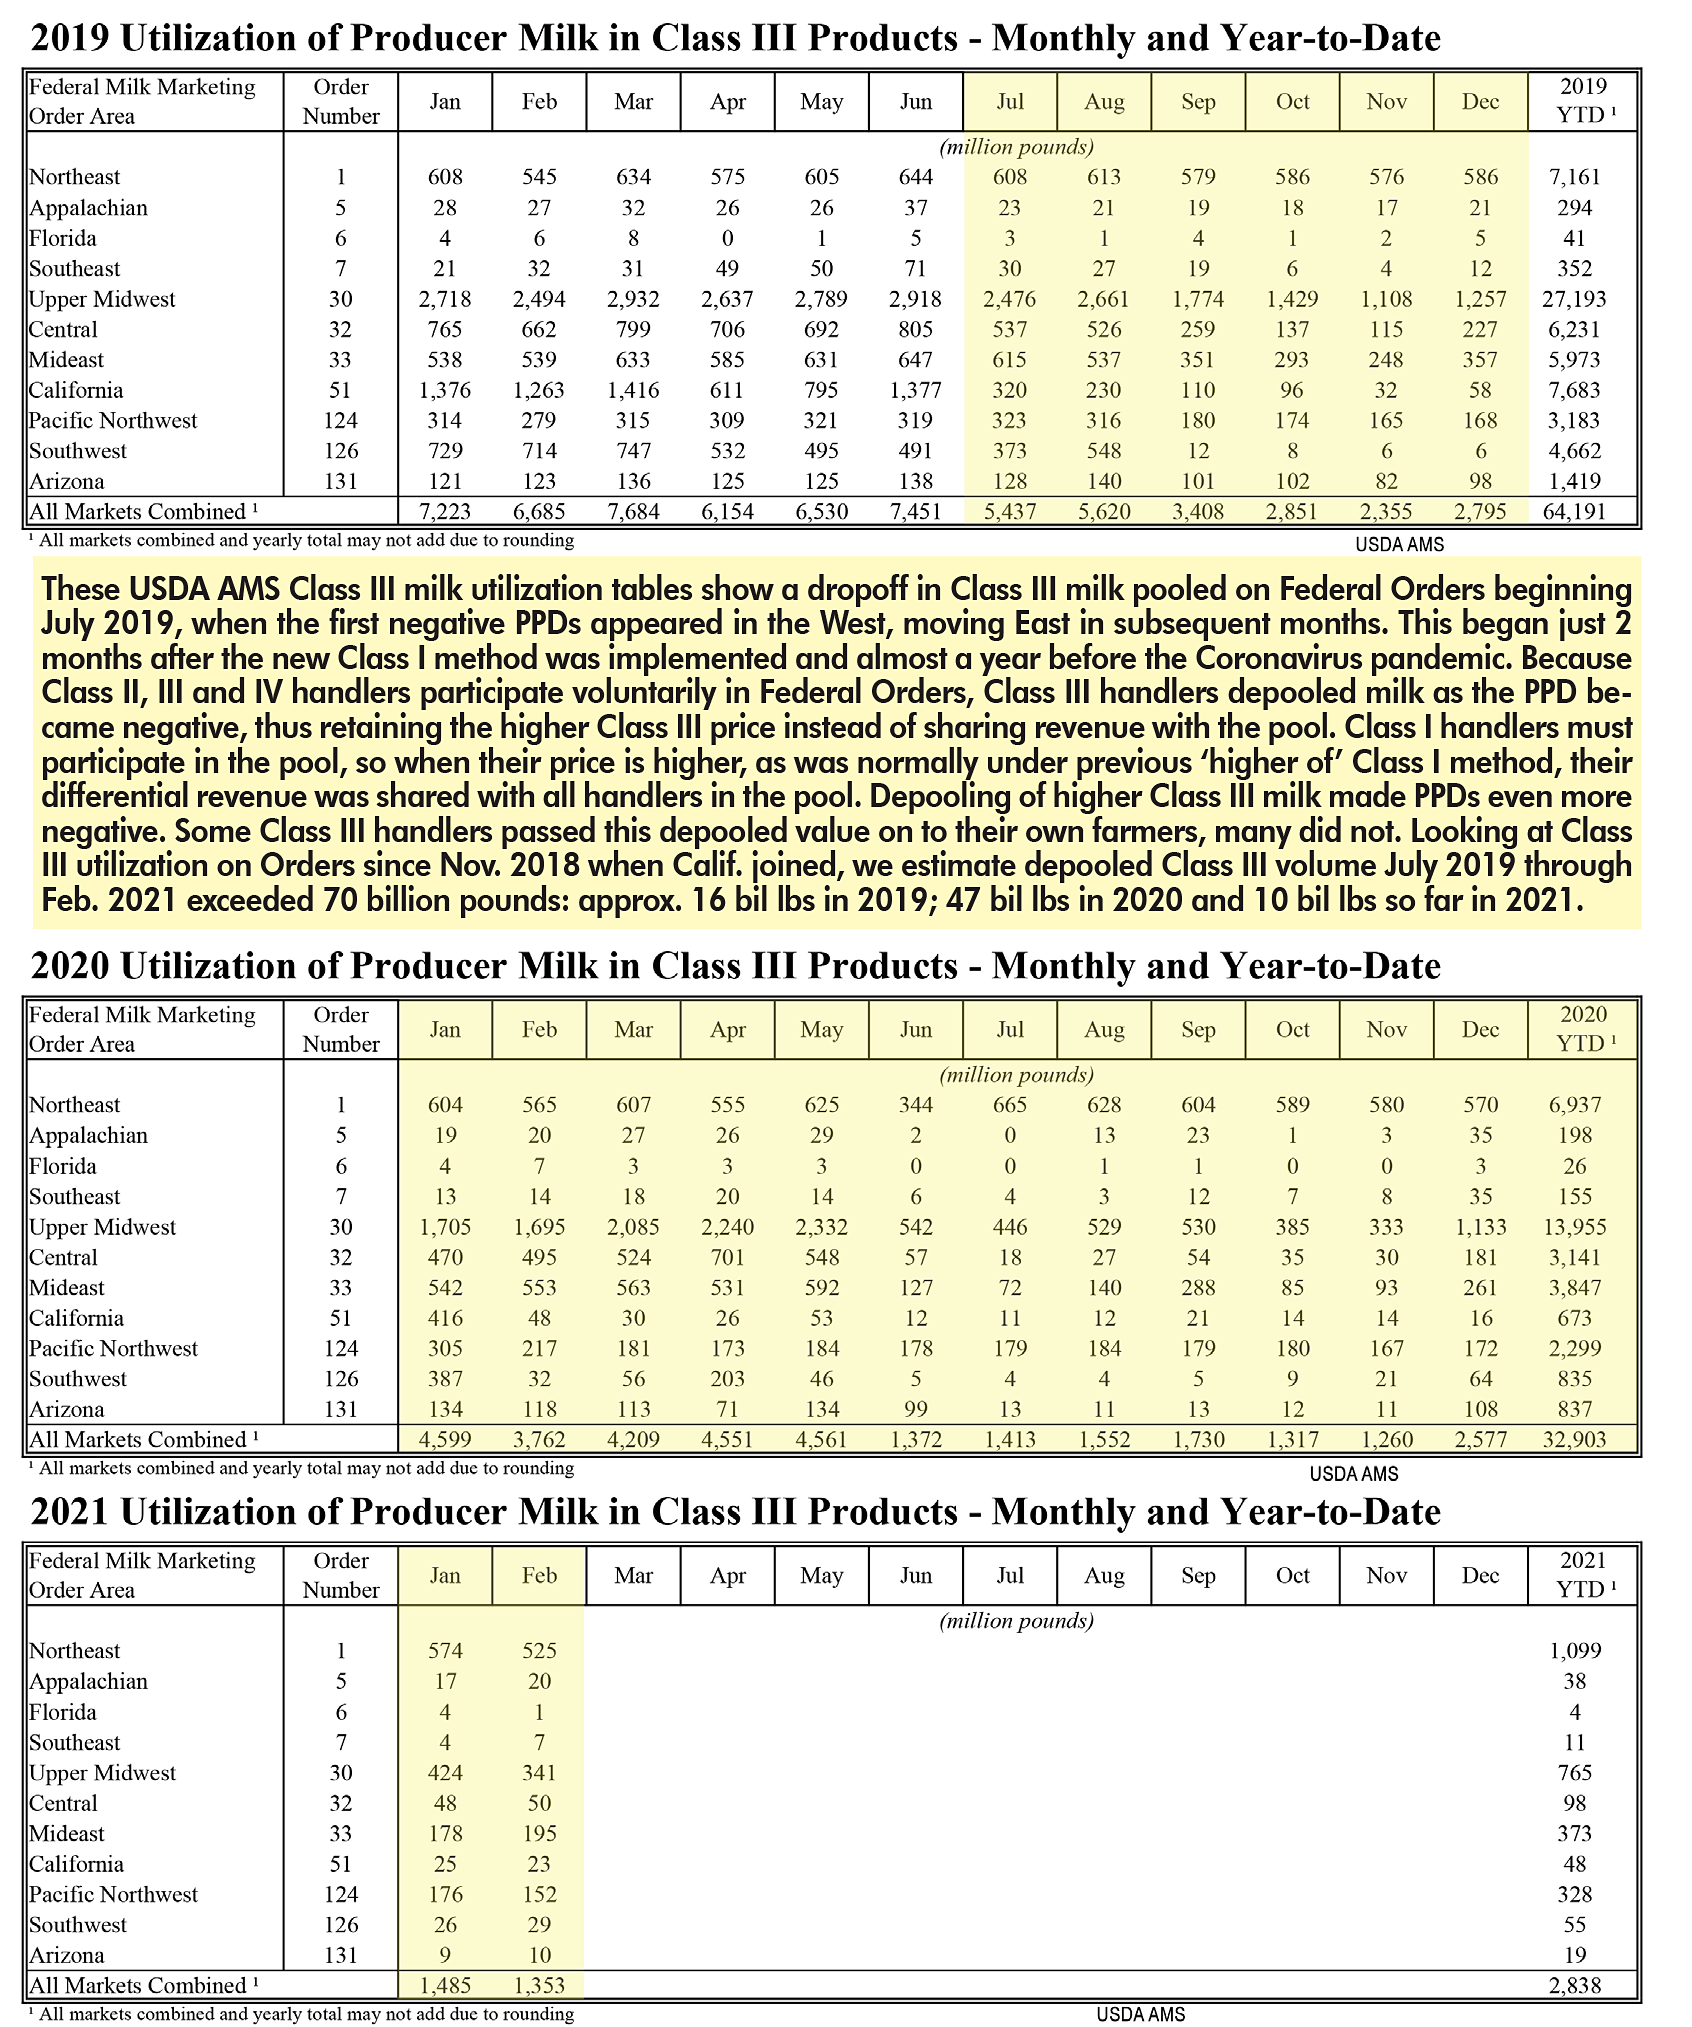
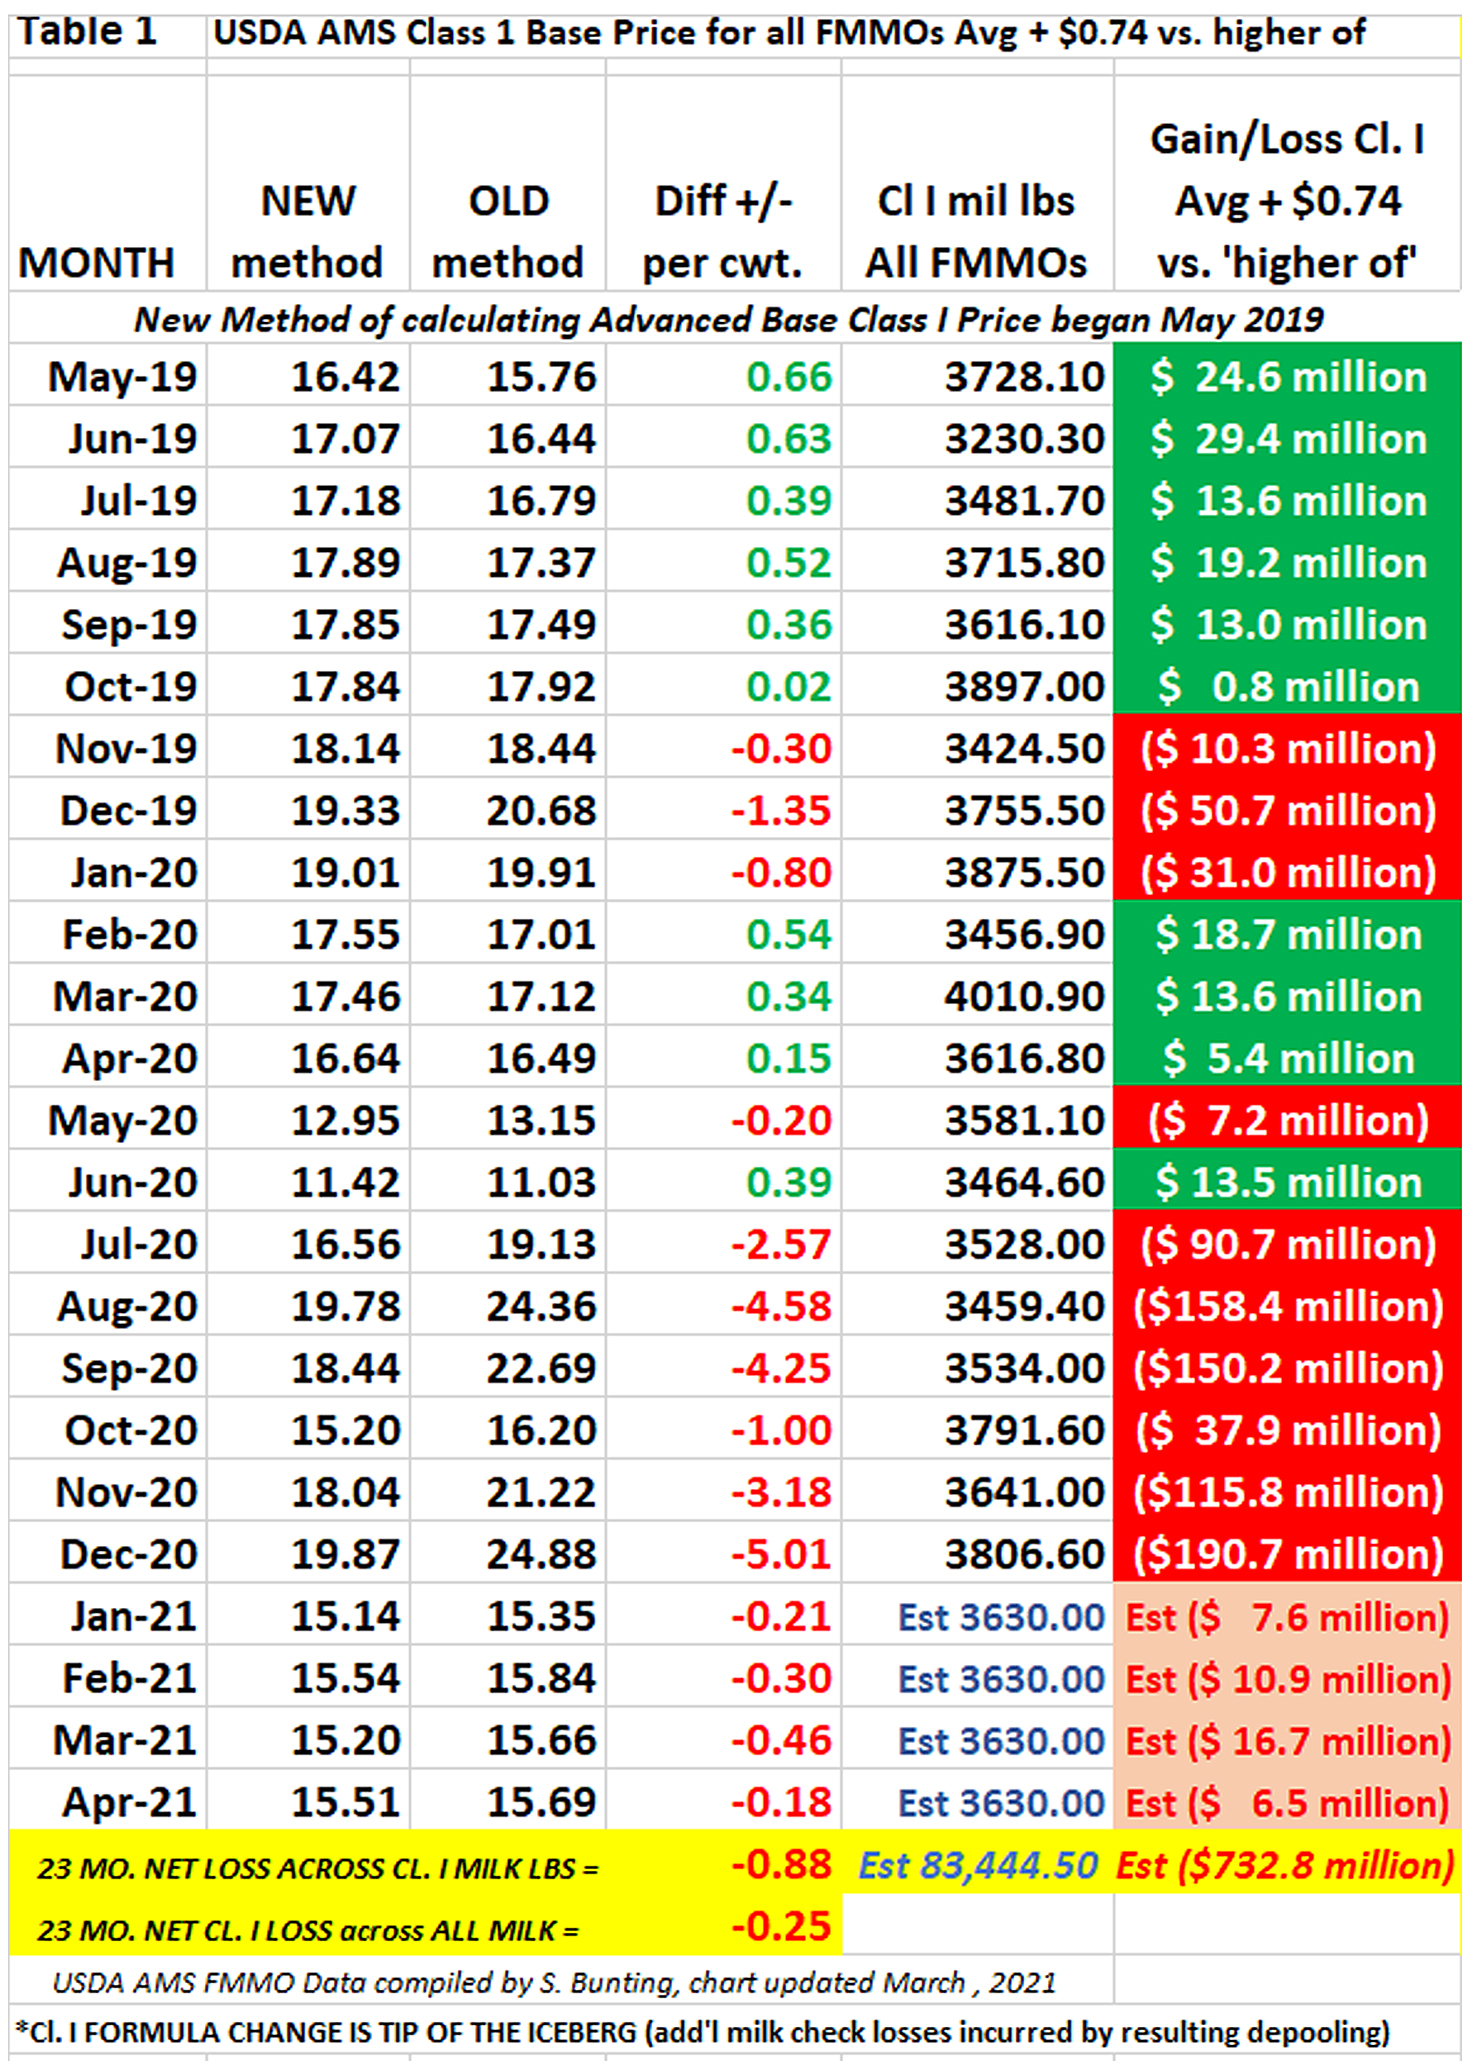
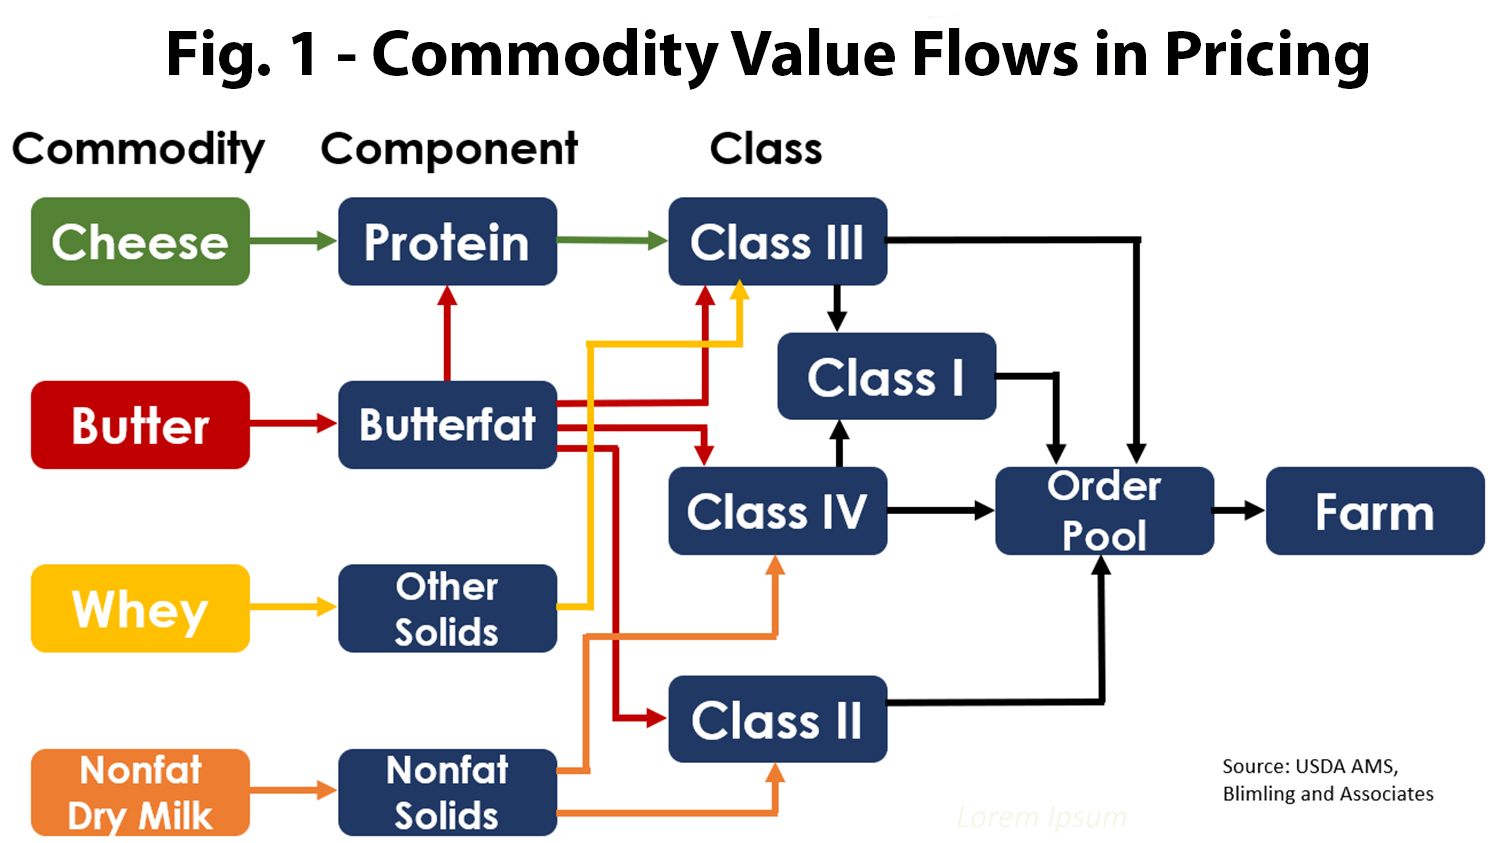
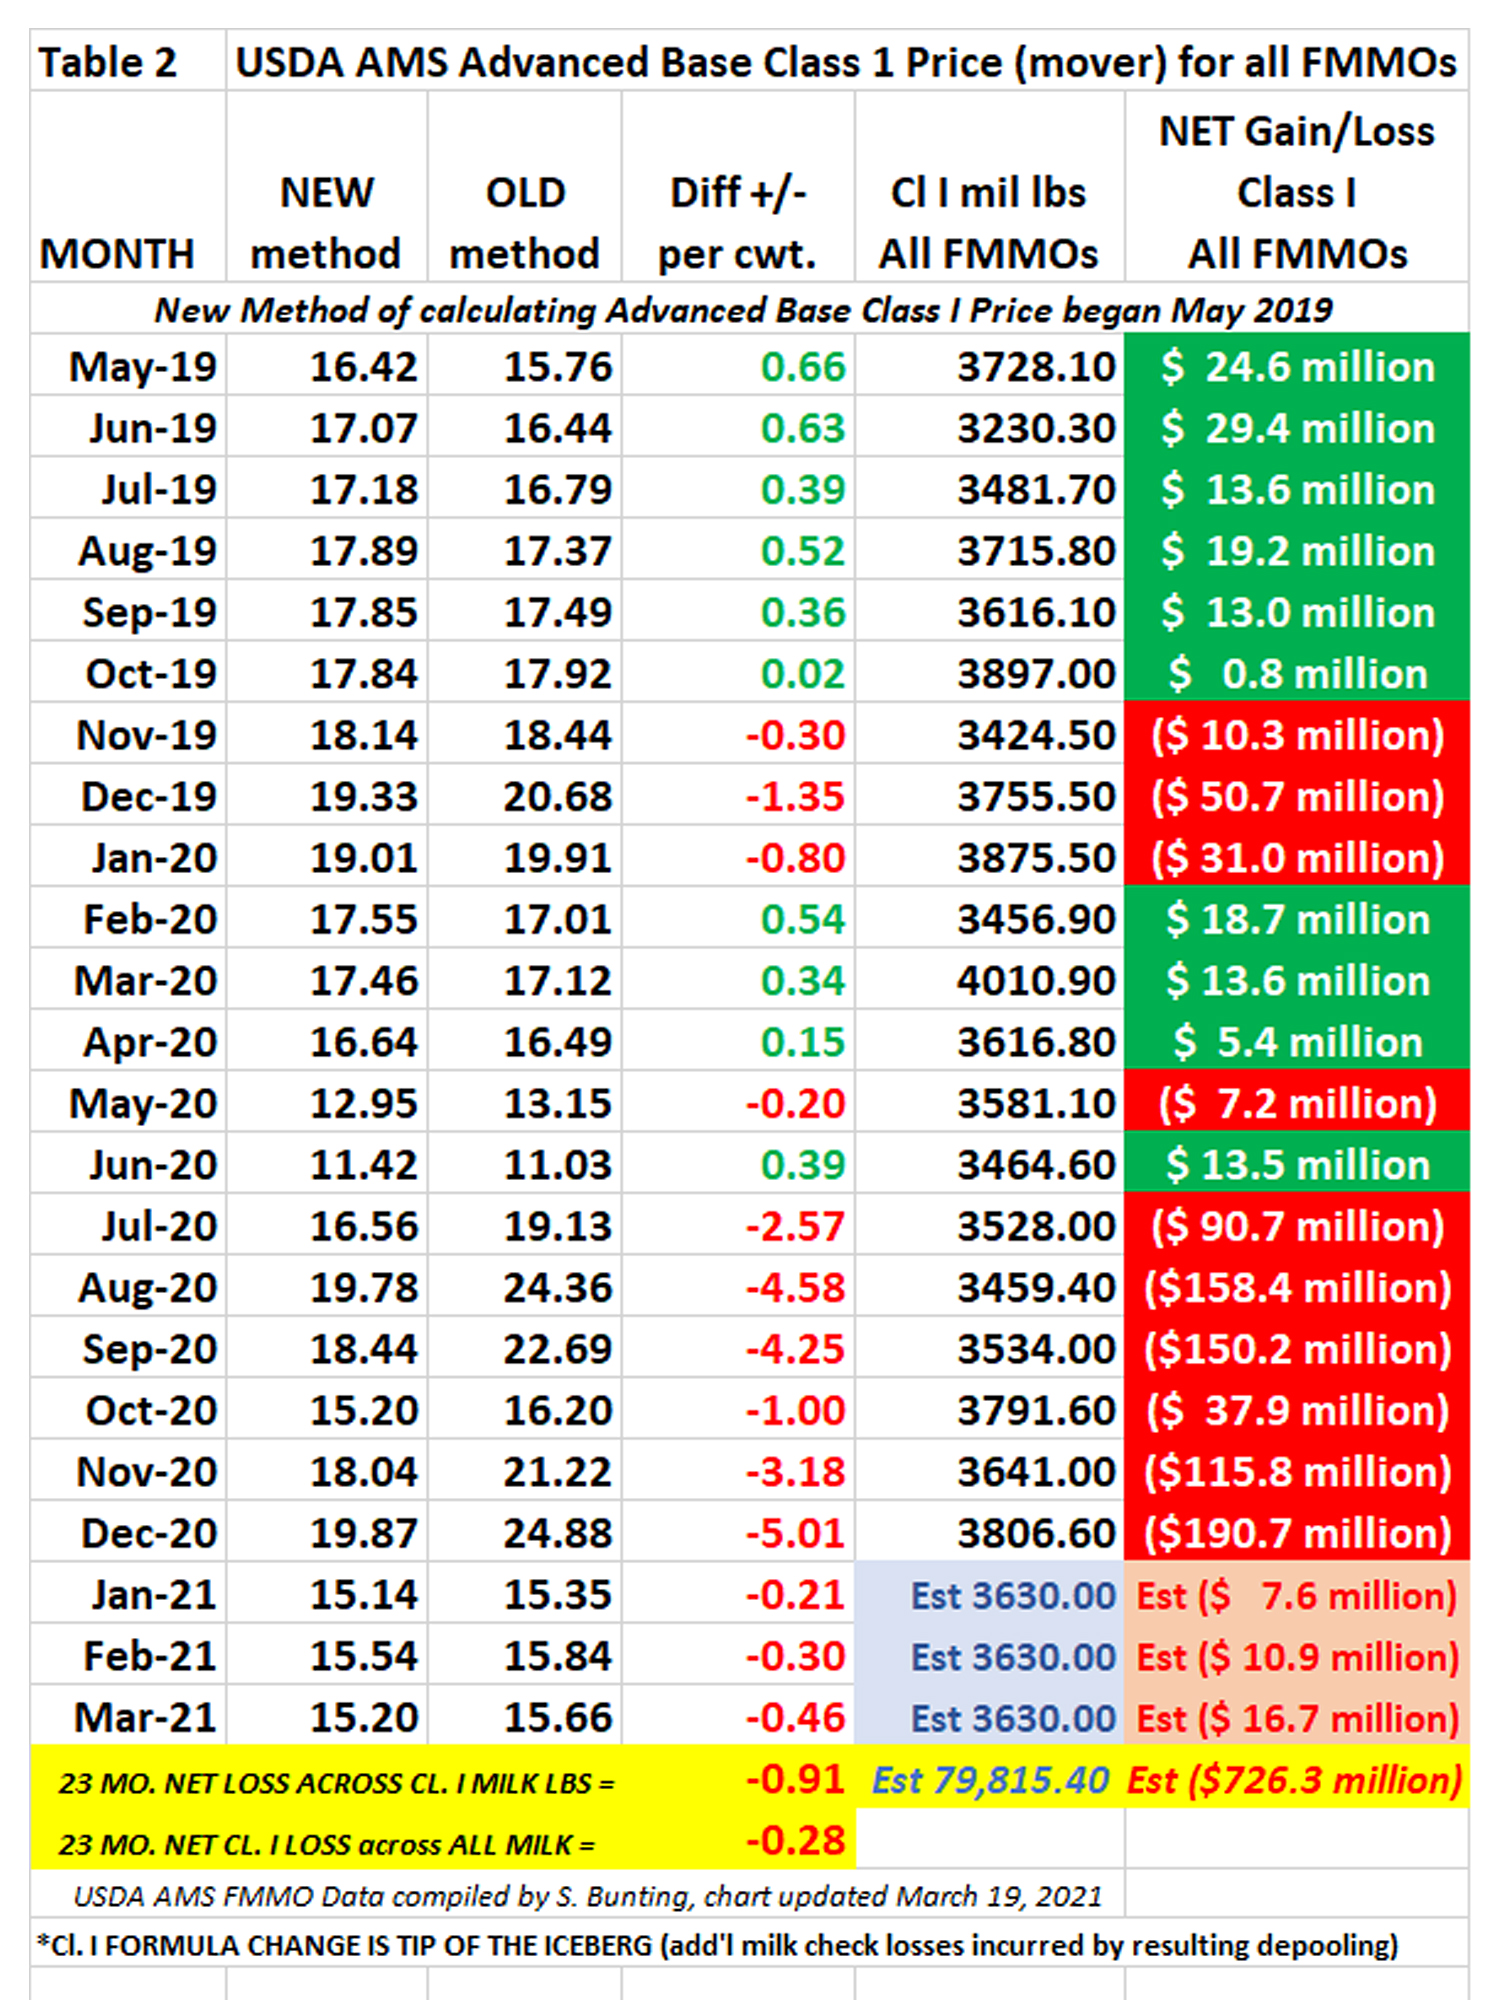
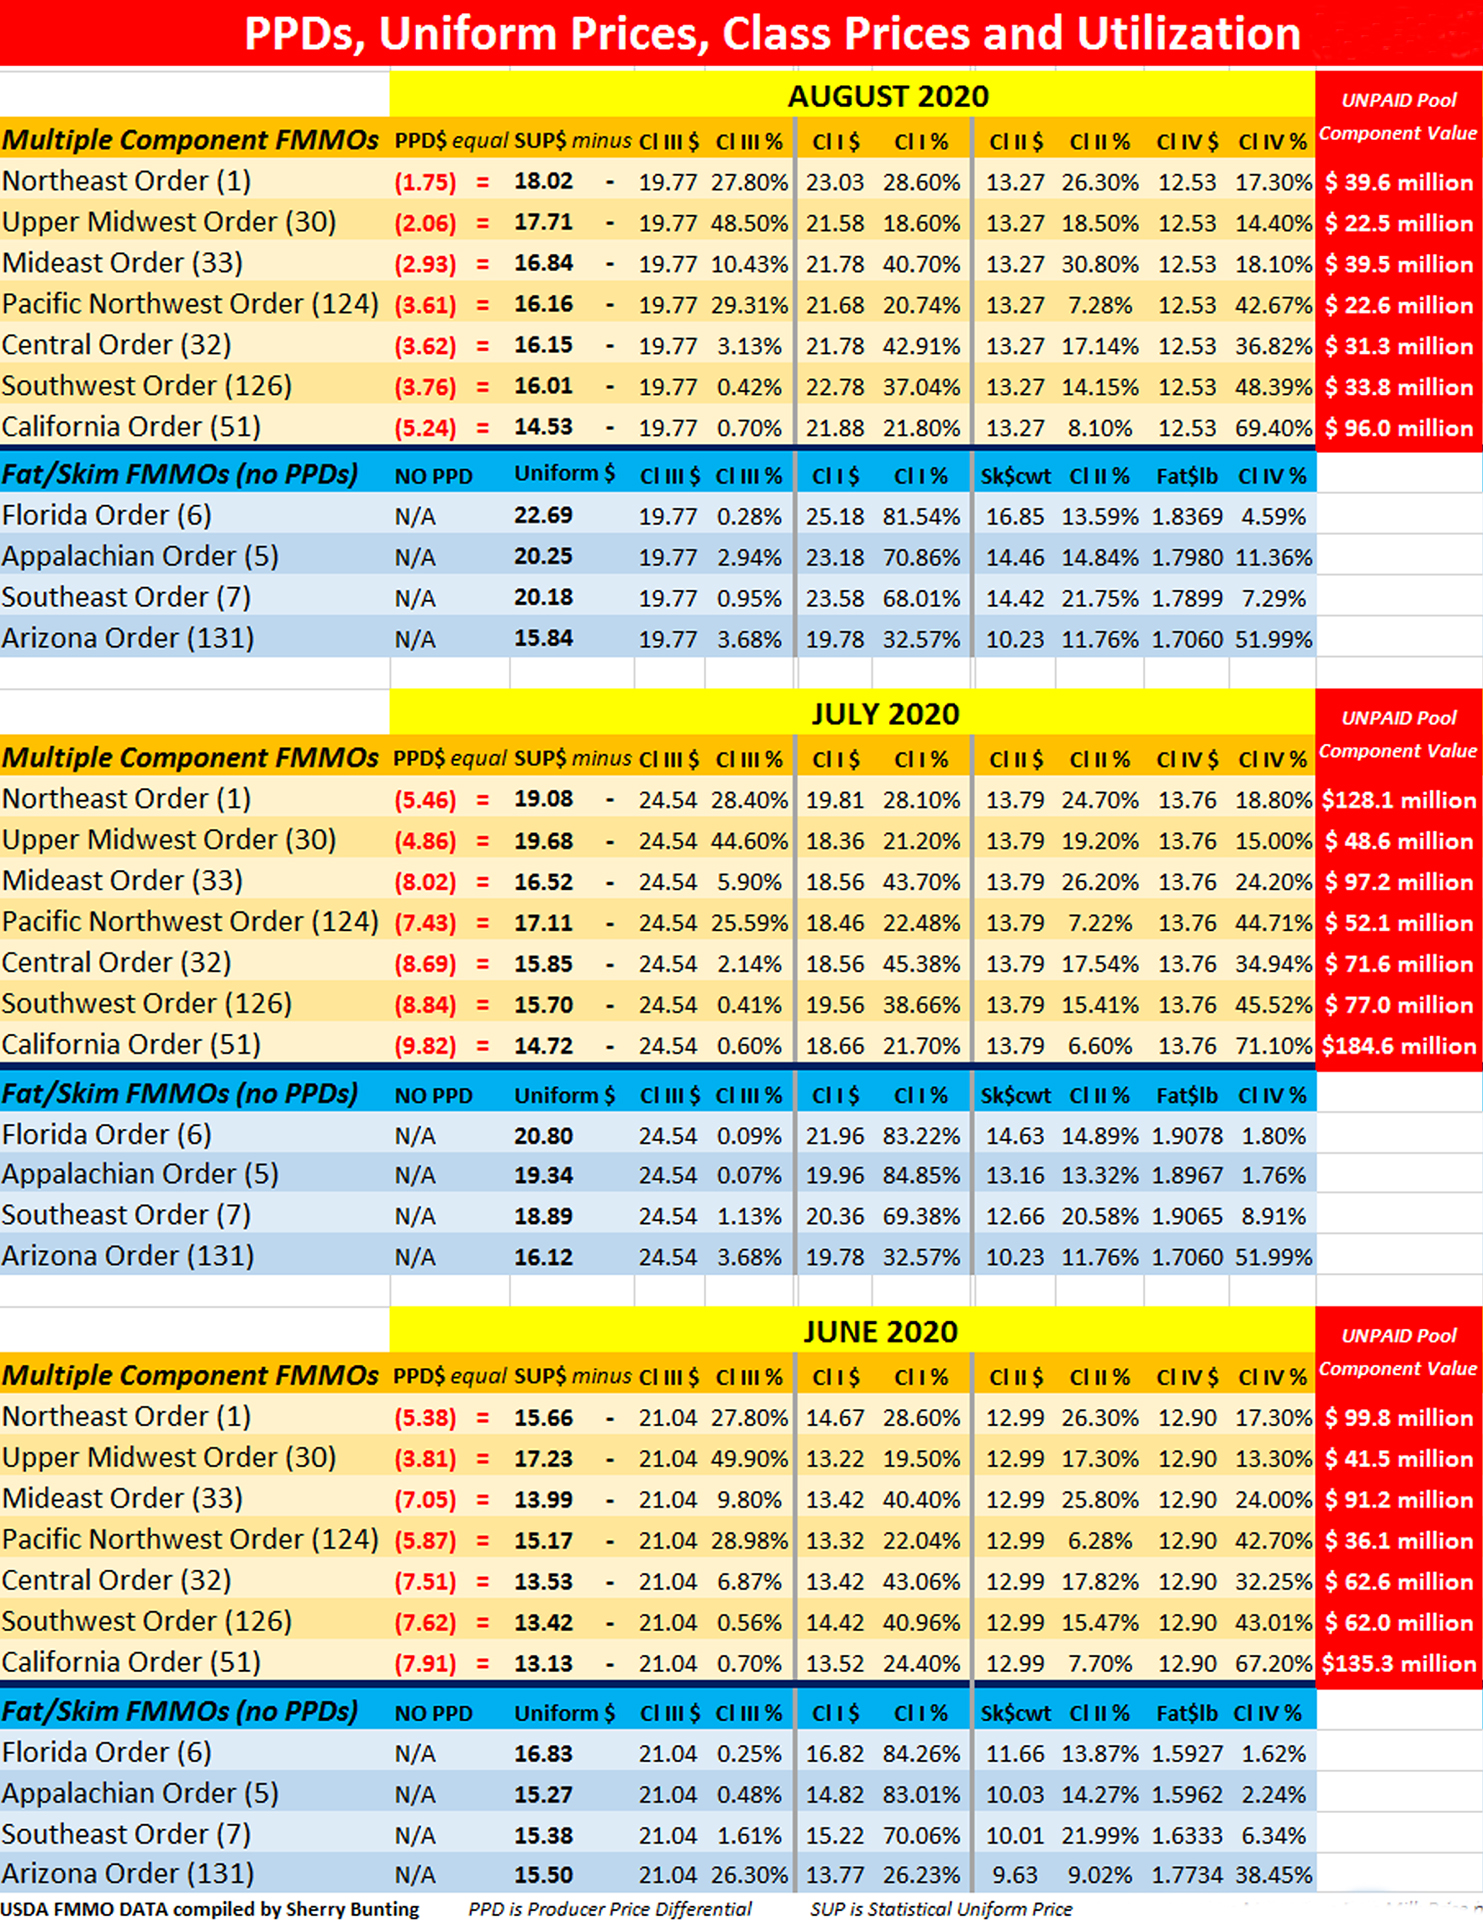
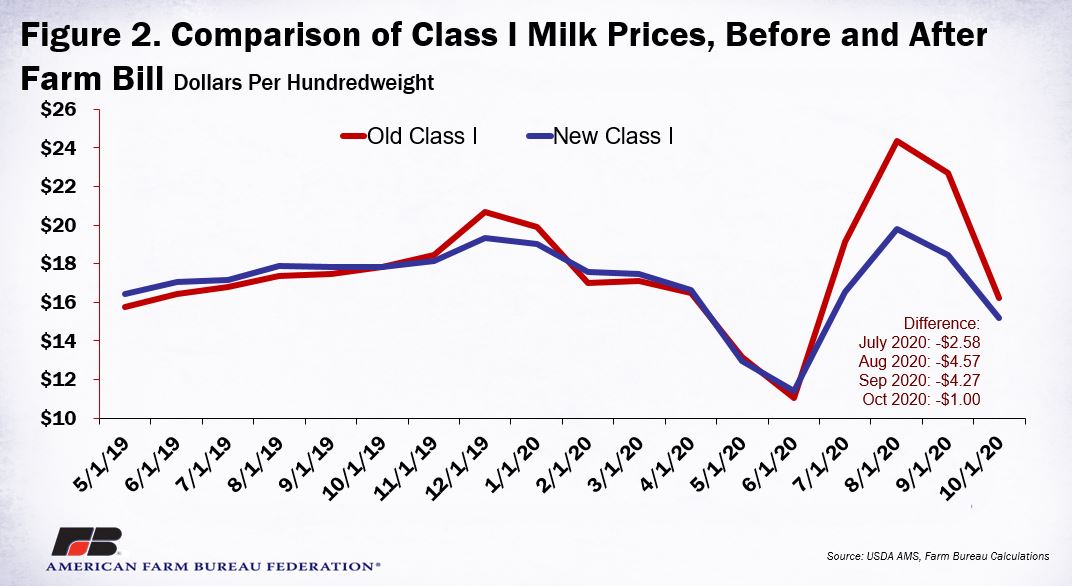
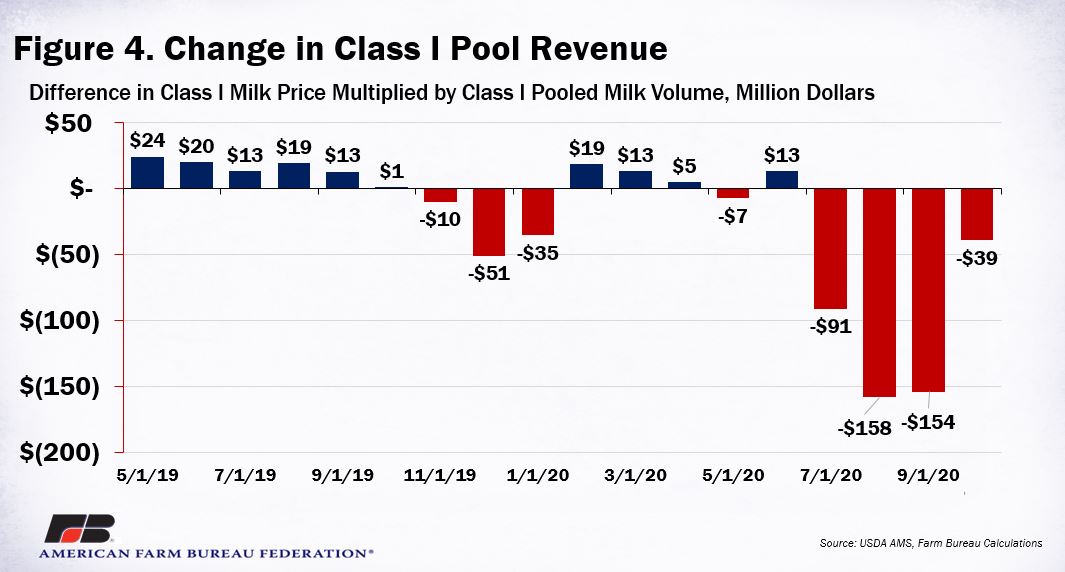
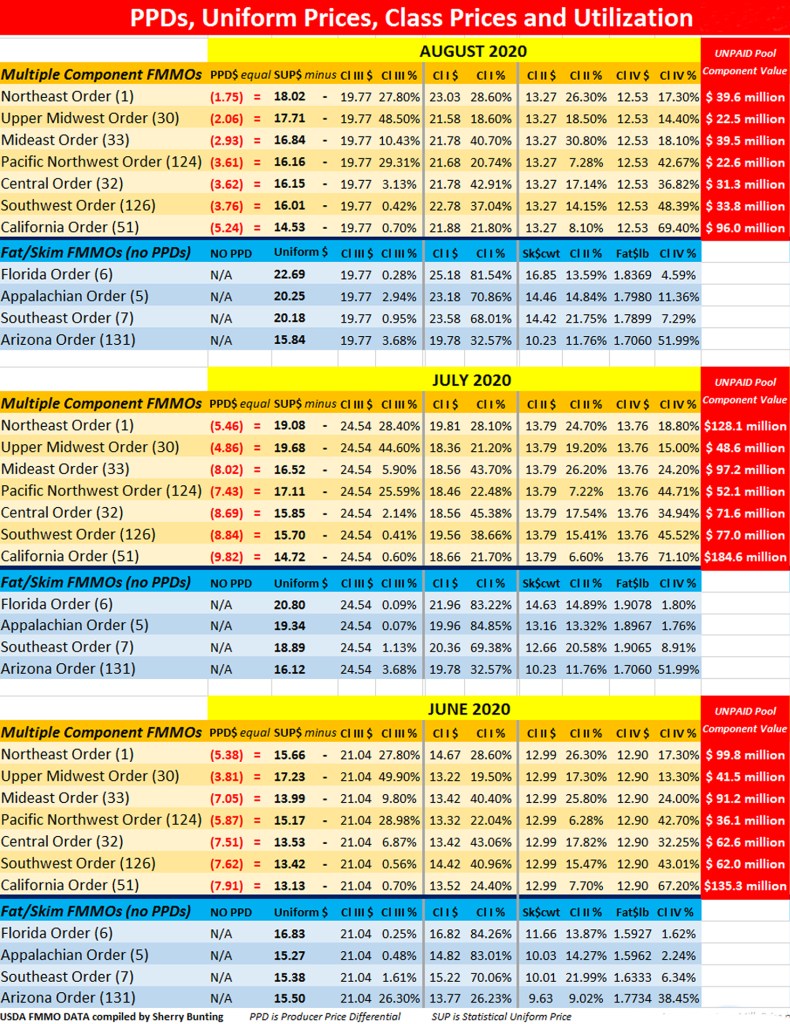
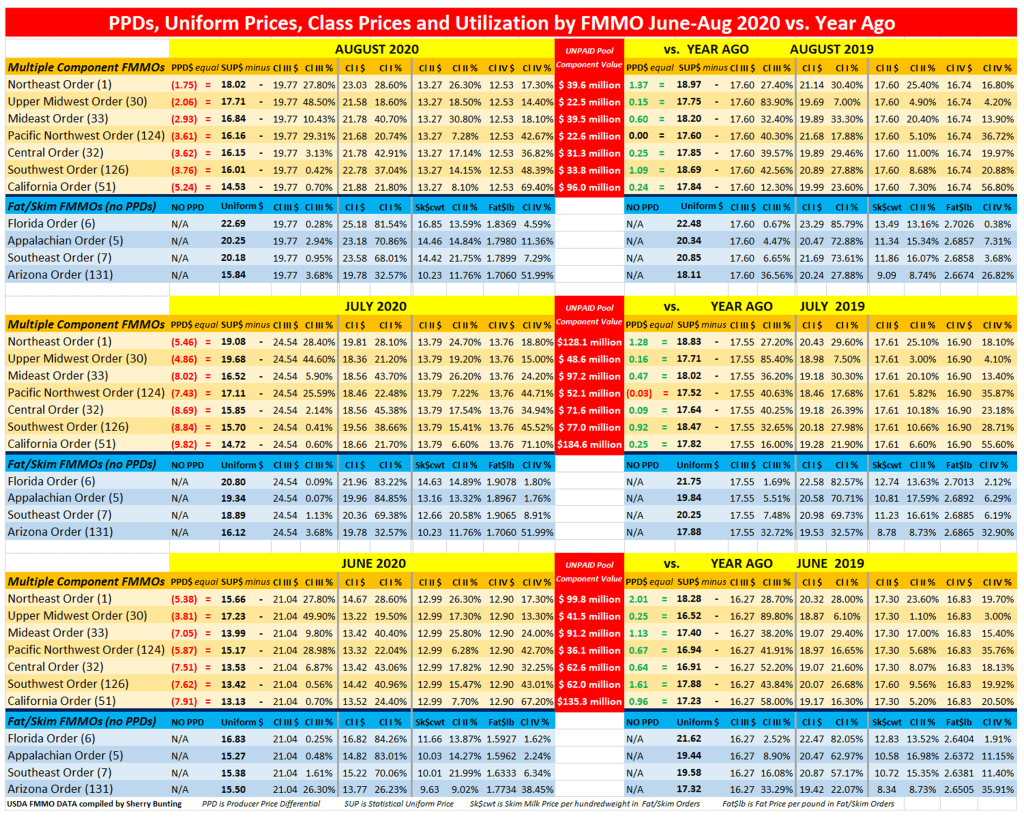
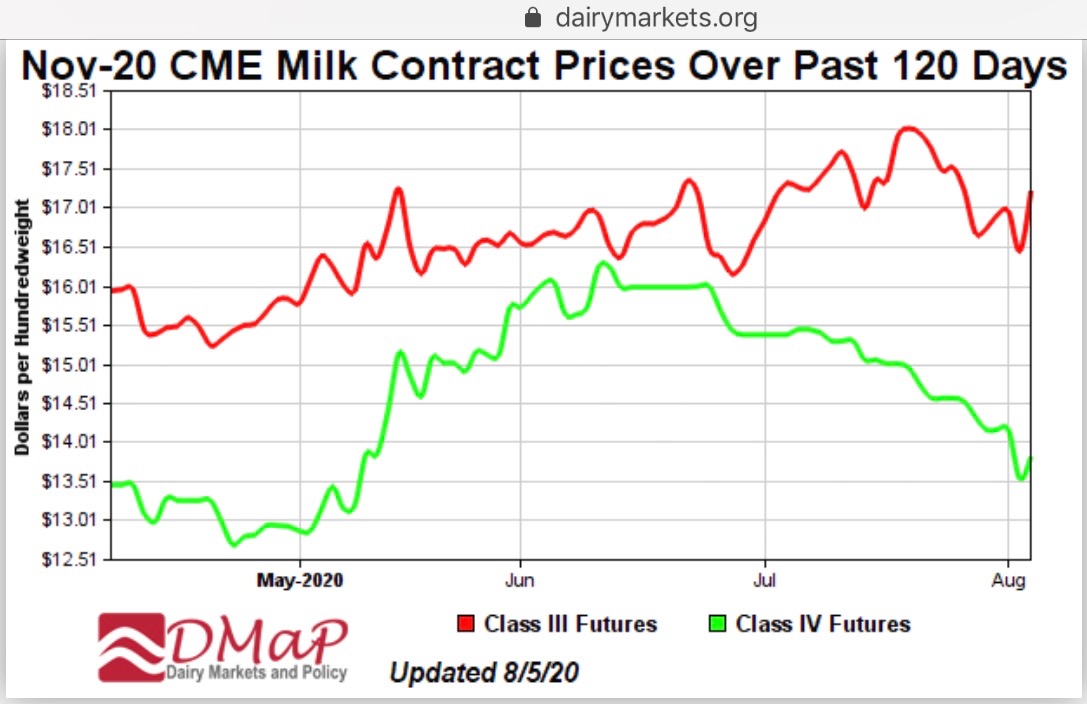
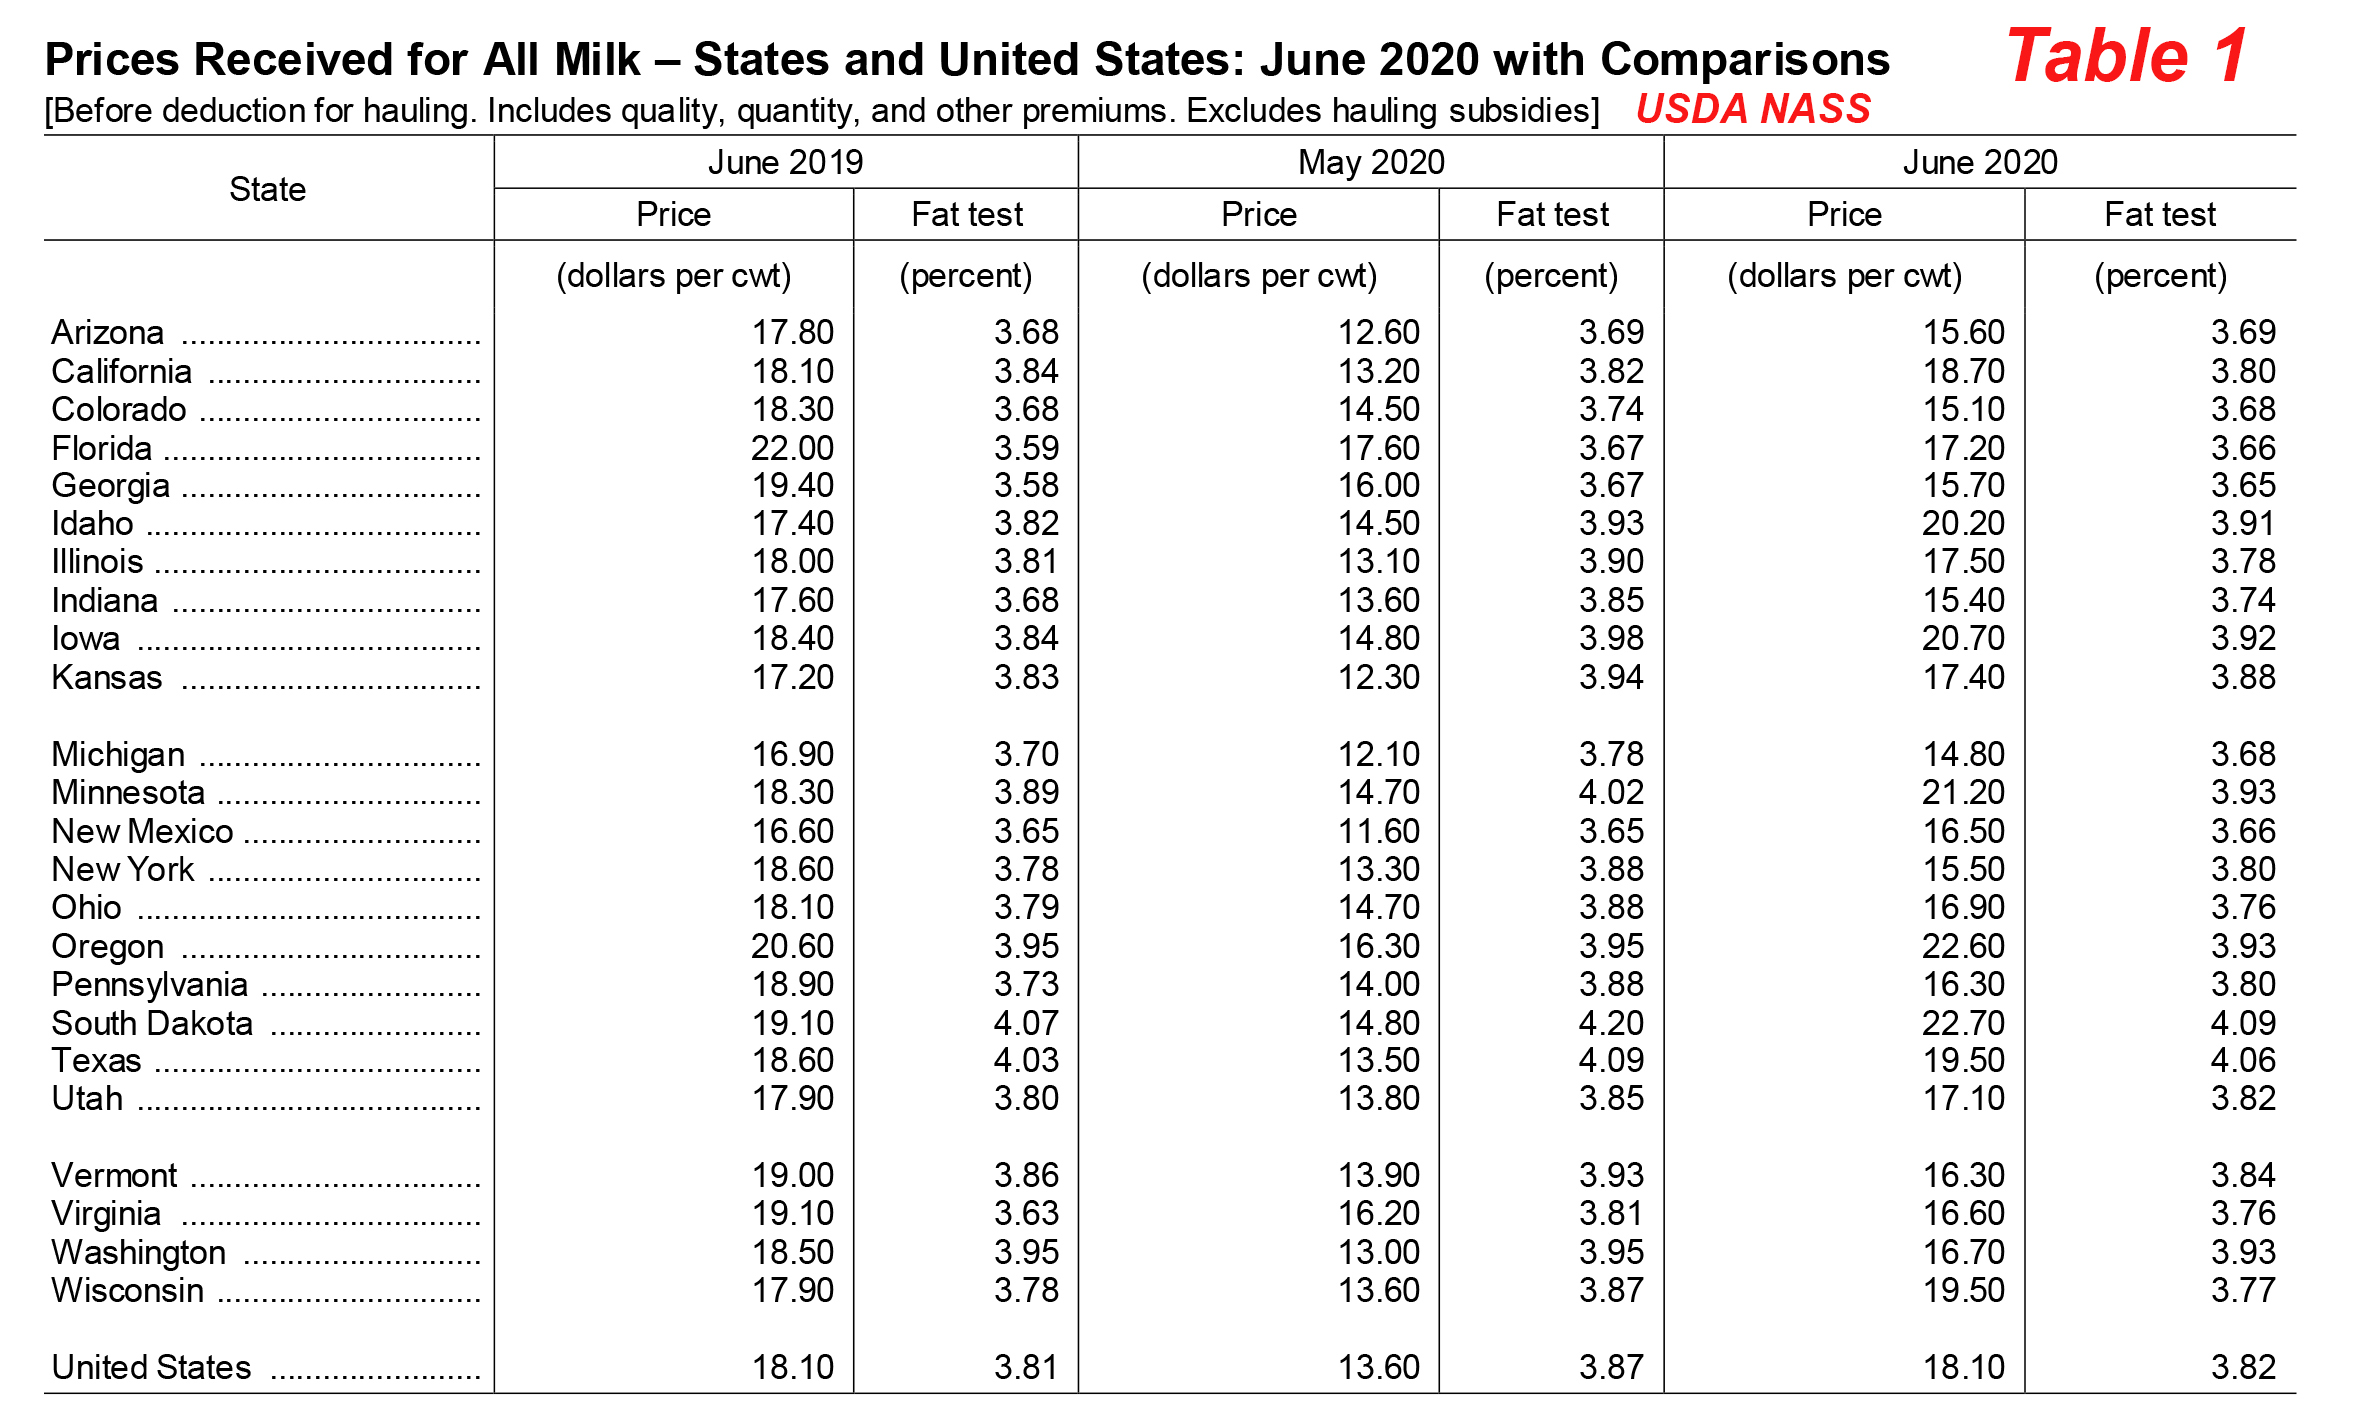
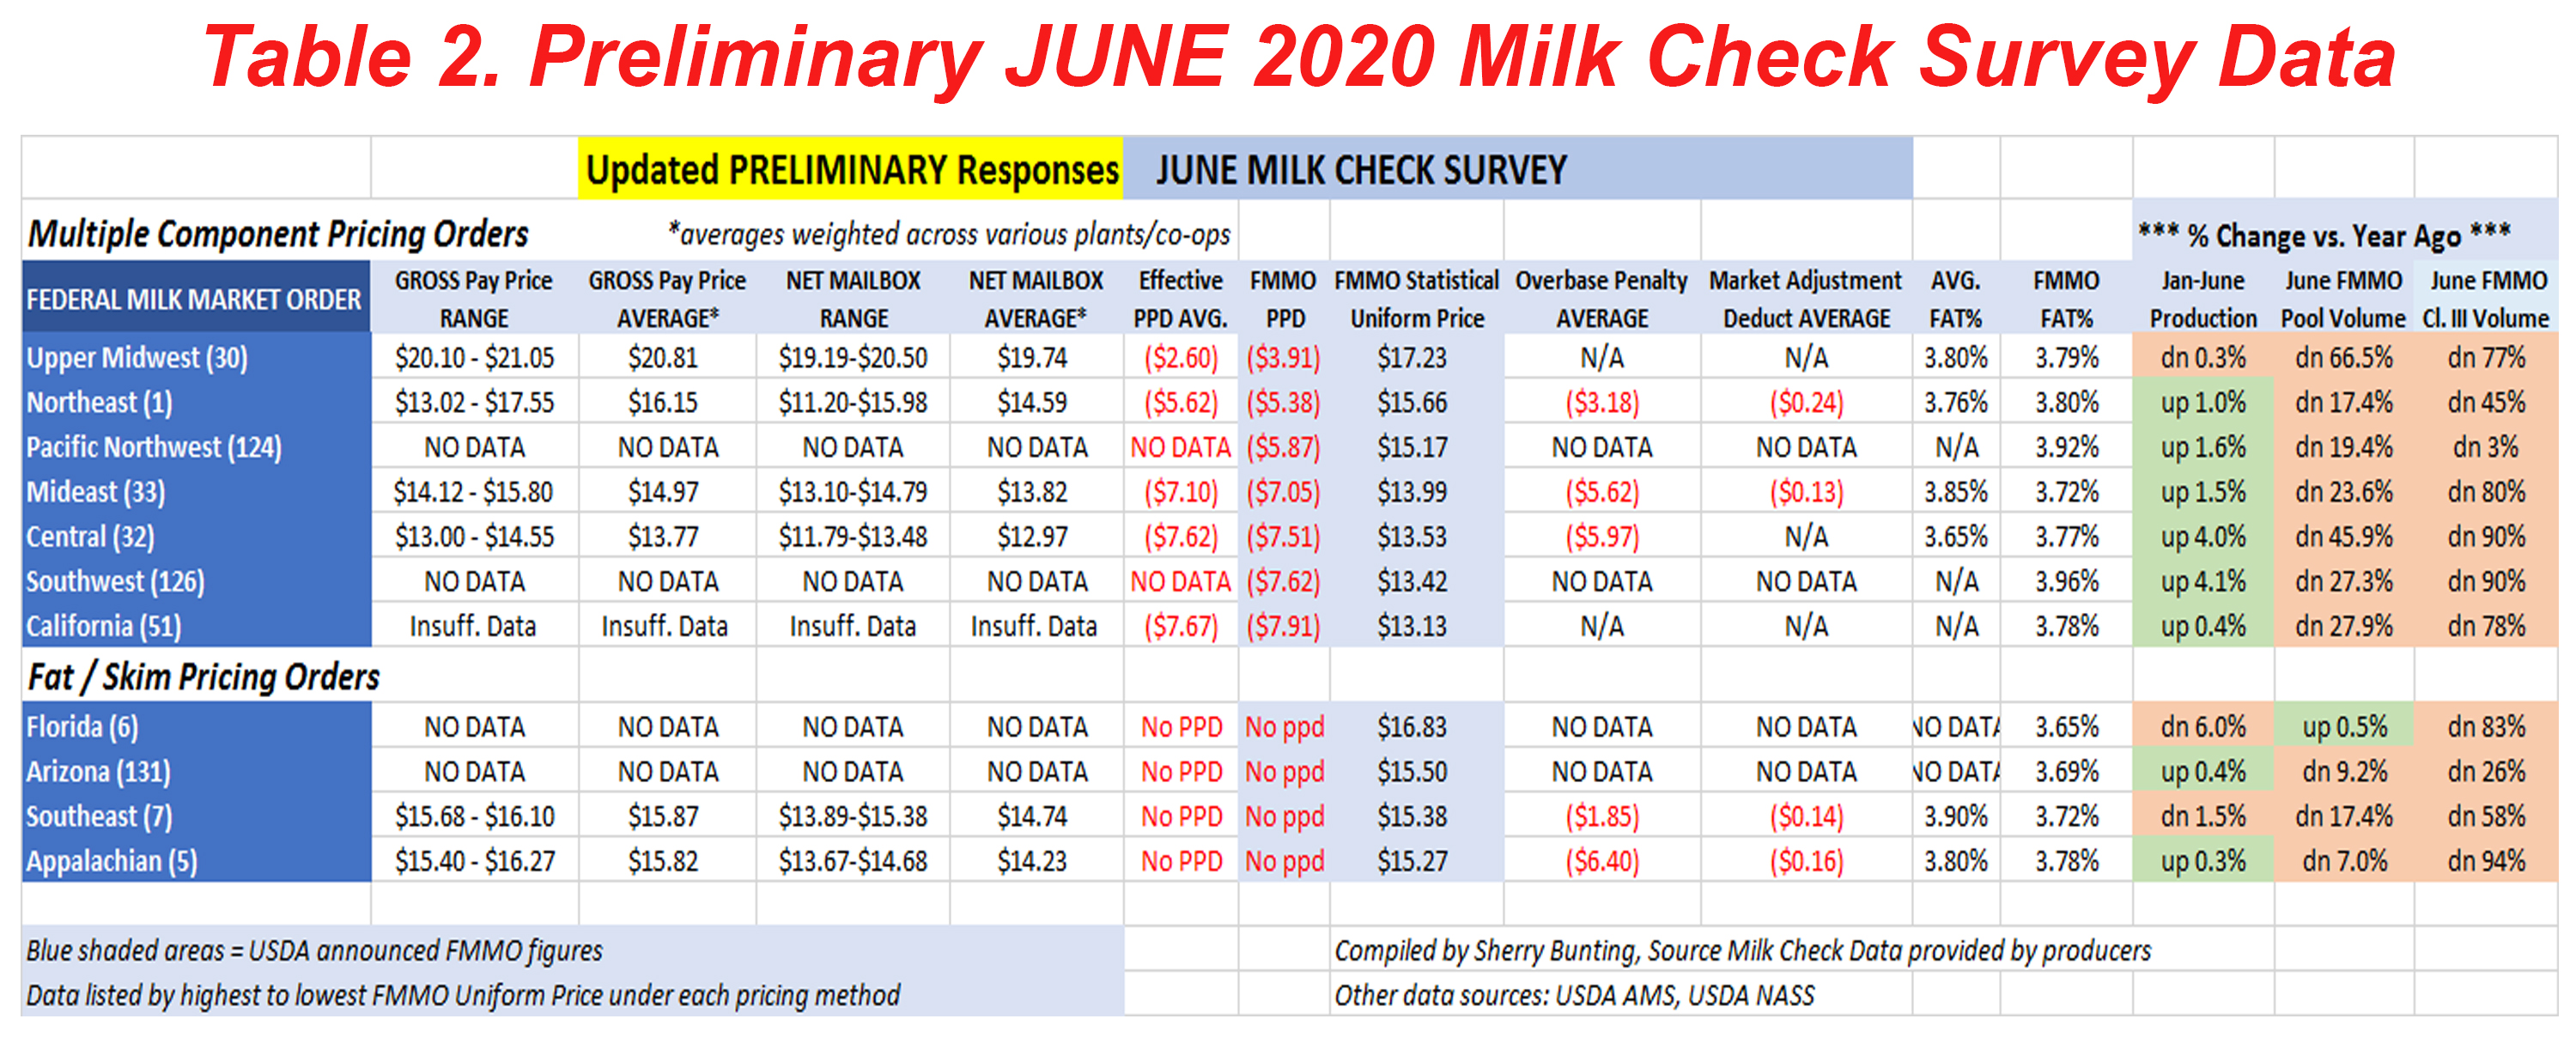
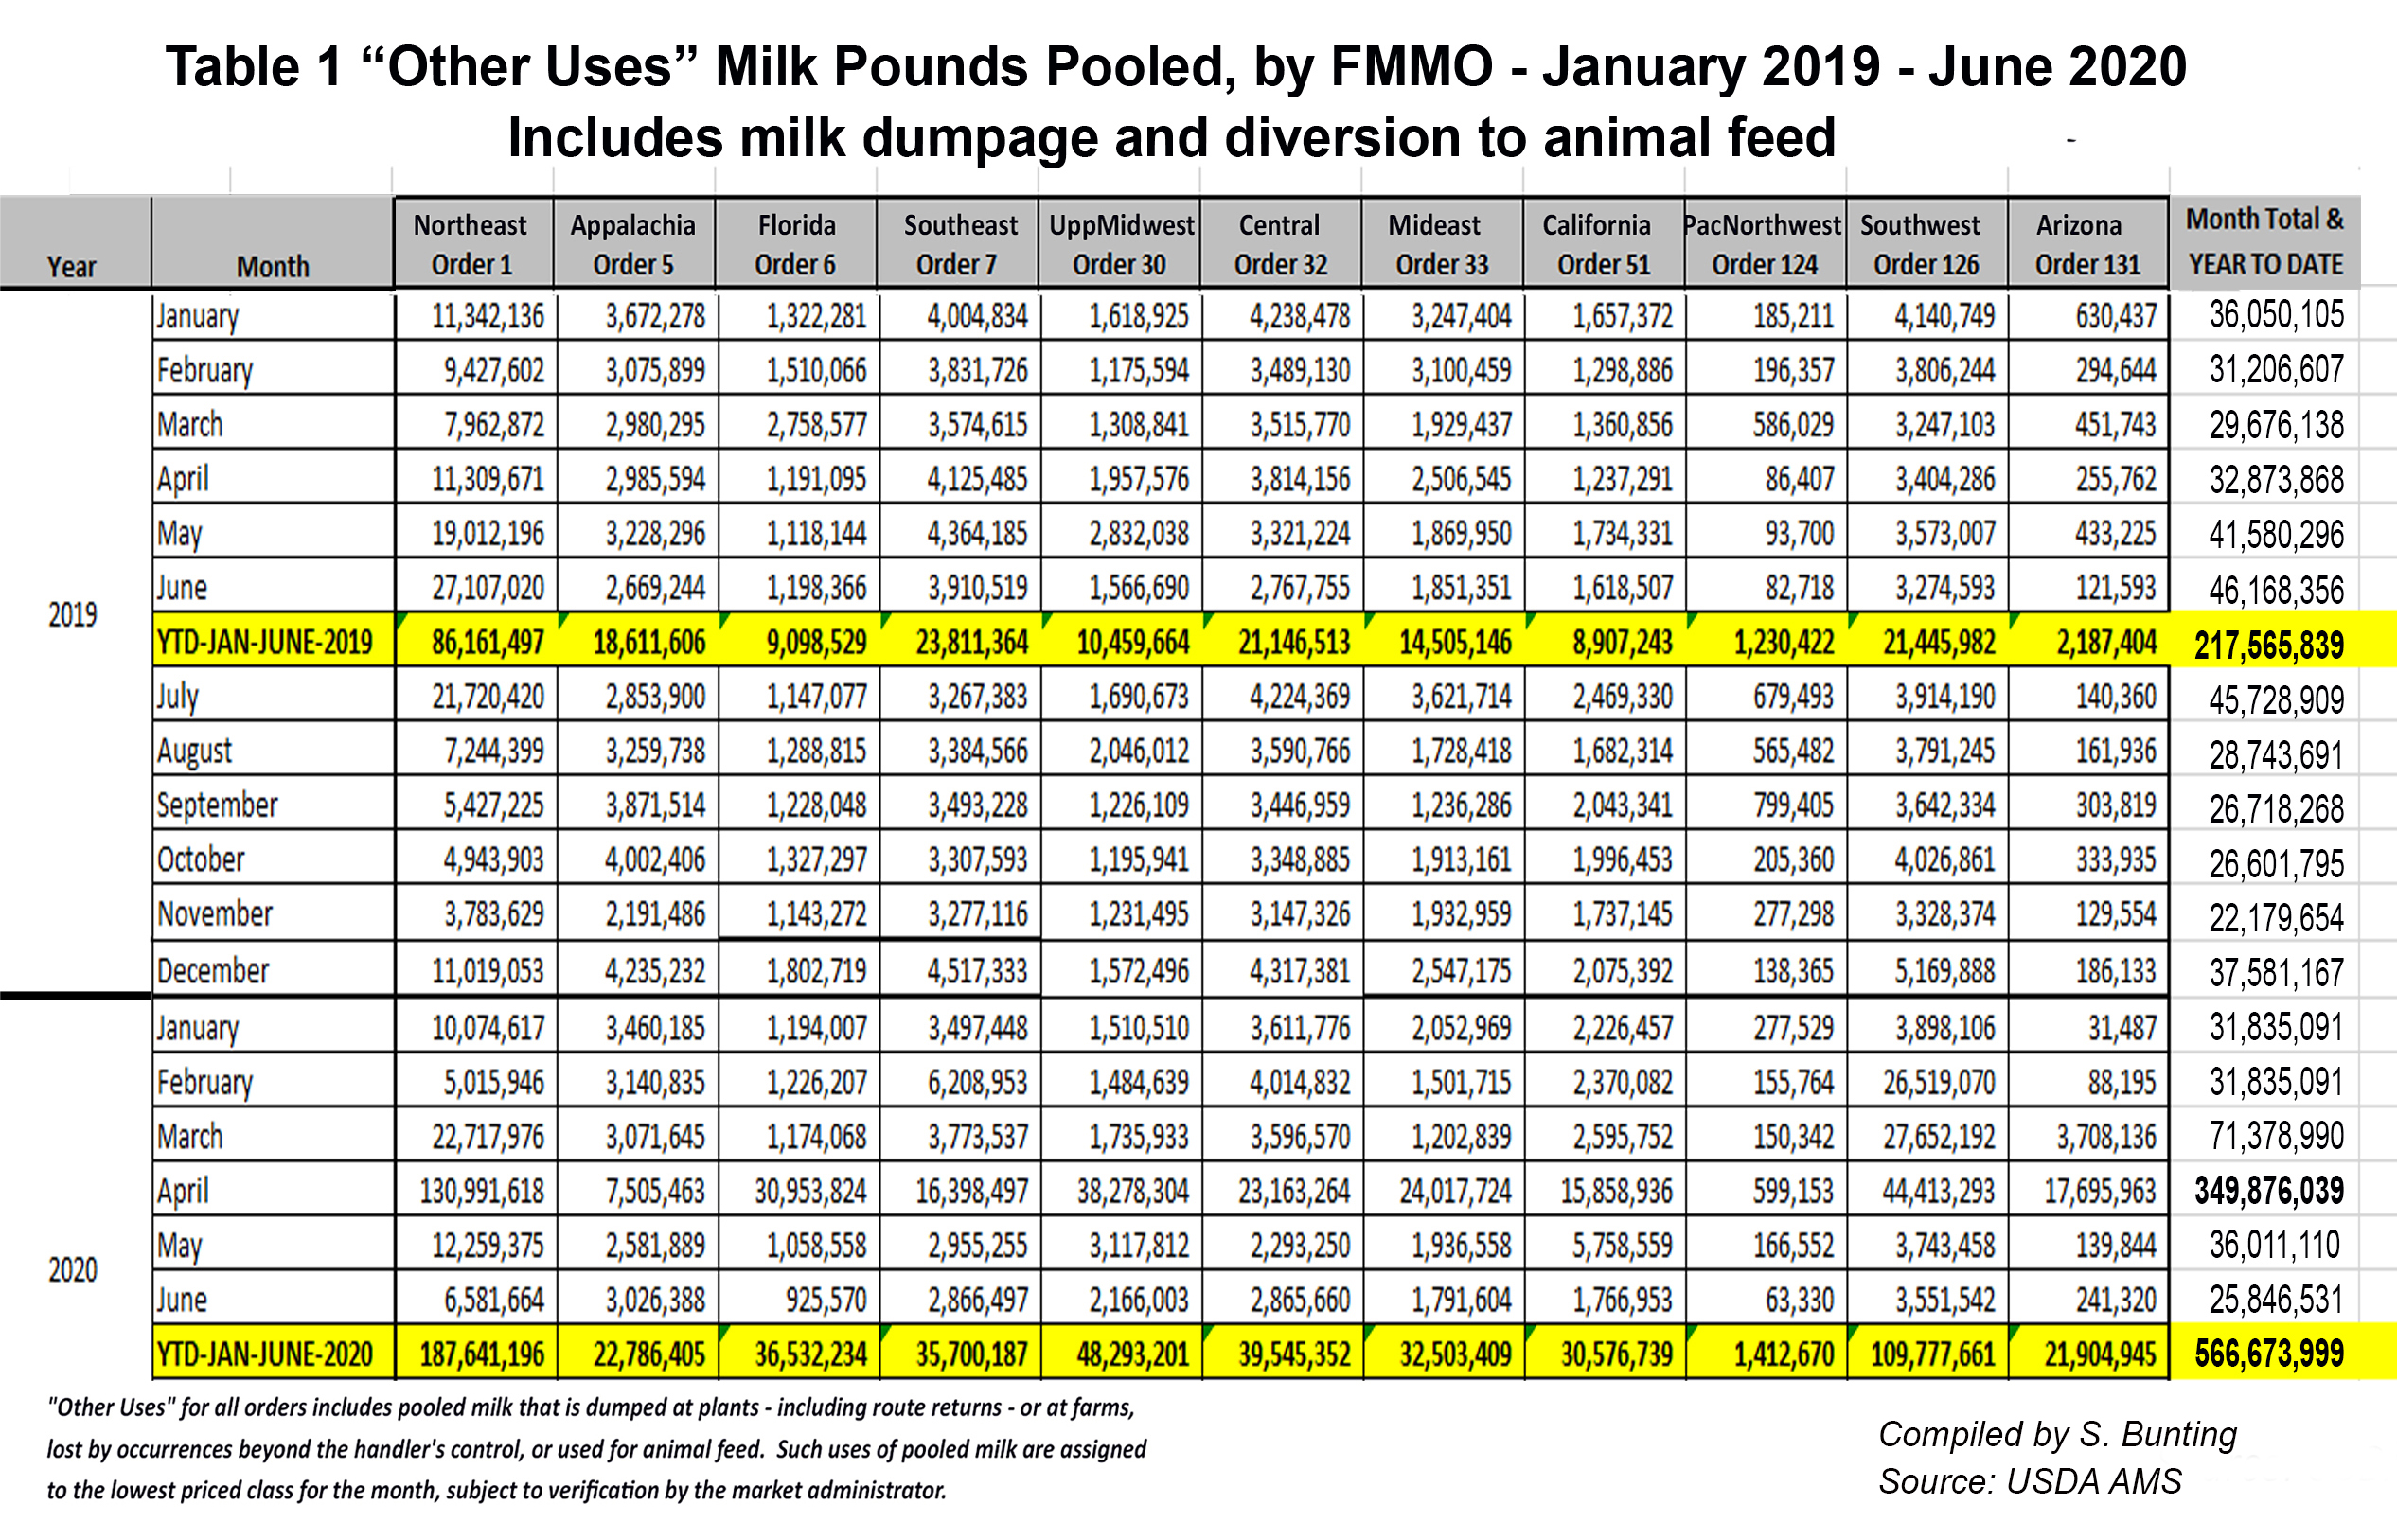
Table 1 (above) shows the “other use / milk dumpage” pooling data. What is mind-boggling is that year-to-date milk dumped totals at 566.7 million pounds for just the first 6 months of 2020, is 125 to 150 million pounds greater than the 12-month annual totals for each of the past five years.

Dairy producers wishing to submit June milk check data as well as next month’s milk check data for July to broaden this survey geographically, please send: Gross price, net mailbox price, PPD, butterfat and protein, other deductions (especially ‘market adjustment’ deductions), overbase penalties if applicable, along with your location or the FMMO in which your milk is marketed and information stating whether you market with a cooperative or as an independent. There is no need to provide your name or your specific co-op or plant affiliation unless you choose to include that.

Please consider emailing me at agrite2011@gmail.com or text/call 717.587.3706. All information is aggregated anonymously by state, region and FMMO.

-30-

Understanding these negative PPDs, massive depooling; ‘New’ Class I calculation doubles the rub


Microsoft Word - DMAP IL20-3.docx

Large negative PPDs, Class III depooling and buyers reblending the milk price paid to farmers in June and July could be with us through August and even September because of how wide the divergence is between the Class III and Class IV prices, based on what the CME futures markets are showing. This divergence lowers all other classes in the pool (I, II and IV), especially now with the new “averaging” method of calculating each month’s Class I Mover in effect since May of 2019.

By Sherry Bunting, Farmshine, July 3, 2020

BROWNSTOWN, Pa. – Dairy producers seek to understand record-large negative PPDs (Producer Price Differentials) for June milk, meaning the the significant gains made in cheese markets and and Class III milk price are not making it to milk checks, especially for Federal Milk Marketing Orders (FMMOs) that are not predominantly cheese markets. (See FMMO data here

The extent of these negative PPDs – ranging from -$3.00 to -$8.00 per hundredweight (cwt) – has several factors, including the new way the Class I Mover is calculated since the 2018 Farm Bill changed it from the “higher of” Class III or IV pricing factors to an average of the two with an arbitrary 74-cent add-on. (See related July 28 story on revealing milk check data here)

“Expect historically large negative PPDs in Multiple Component markets for June and July,” writes Calvin Covington, retired breed association executive secretary and milk cooperative CEO, in an email interview with Farmshine this week.

He also estimates the volume of milk depooled in June will set a record (it did), further limiting how much of the past six weeks of higher dairy product prices will even make it into their milk checks.

Covington confirms Class III milk was already being depooled in May. As reported in last week’s Farmshine, we calculated the volume of milk pooled across all Federal Orders in May was already 13% below year ago levels.  For June, the depooling volume will be much more significant, in fact it is likely to be enormous.

“There is little economical reason to pool any Class III milk in June,” Covington asserts. “The only Class III milk that will be pooled in June is Class III milk going to a pool plant, and to meet any requirements to keep milk pooled in July.”

In fact, if buyers pooled Class III milk on Federal Orders in June, they would have to write a check to the settlement fund (instead of taking a draw from the fund as they do in normal conditions when the Class I bottlers are writing that check).

This is because the Class III price for June was announced this week at $21.04 – nearly $10 per cwt higher than the Class I Mover for June, which was set at $11.42 back in the beginning of May. The June Class I Mover is the lowest since the Great Recession while the June Class III price is the highest since 2014 — both now occurring in the same pooling month!

The reasons for the steep negative PPDs producers in Multiple Component Pricing (MCP) FMMOs will see for June milk, says Covington, are the high Class III price ($21.04) vs. Class IV ($12.90) and Class II ($12.99), the Class I Mover advanced pricing lag at $11.42, and the new method of calculating the Class I Mover, especially for July.

“In skim-butterfat priced markets – the Southeast Orders – blend prices will be lower than the Class III price,” Covington adds.

He explains that the PPD is paid on a hundredweight (cwt) basis, and it impacts all milk the same regardless of milk components.

“High component herds, especially in Multiple Component markets, see larger variation in milk prices,” Covington explains. “It is all due to arithmetic. Milk is paid on fat and protein. The more fat and protein in the milk, the greater the price change when fat and protein prices change.”

Covington spoke at World Dairy Expo last fall about the makeup of the milk check, and all of the factors that go into it. He reminds producers that only regulated plants are required to pay minimum class prices. Unregulated non-Class I plants choose to be associated with the pool so they can draw from it to pay a blend price to their farmers.

Now that the price for milk used to make cheese is so much higher than the price for milk used as a beverage or to make yogurt, ice cream, dips, butter, powder and all other products —  cheese plants are free to disassociate themselves from the FMMO pool, and there is no regulation stating they must pay their producers even the minimum announced Class III price for components.

Under the current system, when the Class III price rises quickly to overshadow the previously-set Class I Mover, there’s no reason for those Class III plants to pool the milk, unless they want to remain “qualified” to participate in the pool (draw) in the following month.

Covington observes that the upside-down pricing and negative PPDs will be with us at least through July. Dairy economists Mark Stephenson, University of Wisconsin and Andrew Novakovic, Cornell, noted in a recent Dairy Markets and Policy brief that this situation of negative PPDs, Class III depooling and buyers reblending the price paid to farmers could be with us through August and even September because of how wide the divergence is between the Class III and Class IV price via the CME futures markets.

This divergence lowers all other classes in the pool (I, II and IV), especially now with the new “averaging” method of calculating each month’s Class I Mover in effect since May of 2019.

Covington notes that it all boils down to math. The PPD is simply the difference between a Federal Order’s revenue available for producer payment (Class I, II, III and IV combined), minus the payment to producers at the Class III price based on components.

When Class III components are higher than the available revenue in the pool, the PPD is negative. When the Class III milk is depooled in that scenario, the funds aren’t there to pay the value.

“Factors impacting the size of the PPD, positive or negative,” he says, “are Class III price relative to the other class prices, volume of Class III milk pooled and an Order’s Class I price and usage.”

The primary factor in June’s negative PPDs is the extreme rapid increase in the Class III milk price. The rising cheese markets and Class III milk futures were mostly translated into the June Class III price because it was based on four weeks of June cheese sales.

The Class I Mover, on the other hand, was calculated six weeks earlier based on what the trade was doing at the end of April and beginning of May.

In the Covid-19 market-disrupted environment this is like two different world’s colliding based on timing and calculations.

Add to this the fact that Class IV and Class II prices saw muted increases during June compared to Class III’s large and abrupt increase, and what we are left with is the scenario where Class III beats all other classes by $7 to $10 in the same pooling month.

FMMOs with larger utilization of Classes I, II and IV will not see much boost from the uptrending cheese markets in their June blend price.

FMMO’s with large Class III utilization would see that boost. But depooling, reblending and assessments will all play further roles in how even those mailbox milk checks look once June milk is paid for.

Negative PPDs are not new. Dairy producers have experienced negative PPDs on milk checks in the past. Seeing a negative number in an uptrending milk market always brings questions and frustration. In fact, the November 2019 through January 2020 period in several of the past five years produced negative PPDs.

Last November, for example, the seven Multiple Component Pricing FMMOs saw a negative PPD averaging -$2 and ranging from just under -$1 to over -$3.

That pales in comparison to the negative PPDs producers will see for June, July and potentially August or September of 2020. Expect to see PPDs that are double, even triple, what was seen last November.

By now, most dairy farmers understand that a rapidly rising cheese market and corresponding Class III milk price presents the key factor putting PPDs into negative territory. When this happens, producers are reminded that a rising Class III milk price is still a positive development because it indicates milk markets are improving.

But in what some are calling a “whipsaw market” where prices turn abruptly in unexpected directions due to an unforeseen disruption like Covid-19, it’s useful to look at the other factors, for the long term.

First, when Class III milk’s component value is higher than the value of all the classes combined, the result is a negative PPD because after the Class III component values are paid, there is nothing left in the pool for the PPD draw. When the Class III milk is depooled, then that value is not available either.

When the blend price is higher than the Class III price, which is the norm, those Class III plants take a draw. When the reverse is true, they would technically owe the pool.

What sets this up against a huge market-disrupting event like Covid-19 is the lag-time between the calculation of the Class I Mover based on two weeks of trade and calculated six weeks in advance compared with the calculation of the manufacturing class prices based on the current month’s market conditions weighted over four weeks.

Even in those prices, there is a one to two week lag between what happens on the CME daily spot market and its translation to the weekly USDA National Dairy Product Sales Report, on which the class and component prices are based. There is no daily reporting of actual trade, actual sales of the four main dairy commodities, just weekly surveys that are published the following week.

On the flip-side, for April, the Class I Mover was set at $16.64 based on market conditions (advance pricing factors) during the first two weeks of March, before the Covid-shutdown. The Class III price came to $13.07 for April based on the economic shutdown affecting foodservice demand while retailers had a tough time keeping dairy products in stock.

With Class I sales rising dramatically in April, and the Class I Mover sitting $3.57 higher than Class III and $5.24 higher than Class IV – there was incentive to pool everything, even the displaced milk as the industry adjusted to an unforeseeable event and the Class I Mover stood well above all other classes, especially the dumped milk that was pooled at Class IV value.

Thus, April set a record the amount of ‘other use / dumpage’ milk as 350 million pounds of displaced milk was pooled at the lowest class price across all FMMOs, nearly 10-times the amount that is normally pooled as ‘other use / dumpage’.

Now, that lag-time produces an opposite situation for June and July, and there is another wrinkle in the FMMO fabric – the new method for calculating the Class I Mover doubles the rub.

As a result of changes made in the 2018 Farm Bill, the Class I mover is now established by averaging Class III and Class IV and then adding 74 cents to that average. It used to be calculated using the higher of Class III or Class IV. In this case, that would have made a difference as Class III and IV have significantly diverged.

The calculation change for the Class I Mover was made to help processors hedge their future milk costs on the futures markets without having to guess which futures contract to use – Class III or IV. This was said to be something that would provide stability for Class I producers by stabilizing pricing for Class I processors. However, in these very unstable ‘whipsaw market’ times, the rub on producer milk checks will sting.

When it was proposed in 2017, American Farm Bureau Federation studied this method and documented little change to the net result for dairy producers when multiple years of pricing were averaged together and evaluated. In fact, when the new method went into place, there were several months where the average-plus-74-cents made the Class I Mover higher than it would have been under the old “higher of” method.

Not so in a volatile market with a time-lag involved.

These issues of negative PPD affect disproportionately the Federal Milk Marketing Orders (FMMOs) that have more Class I and IV utilization. FMMOs with small Class I utilization and large Class III utilization are relatively untouched as those blend prices would reflect mainly the much higher Class III cheese milk component value. But with depooling and reblending, those checks may also be impacted.

Looking ahead to July, the Class I Mover was already announced at $16.56, based on the advance pricing factors from the first two weeks of June. While July’s cheese trade is yet to be seen, the July Class III contract on the CME futures market stood at $22.85 at this writing on July 1st, which is $6.29 per cwt higher than the already set Class I Mover for July.

Even though the July Class I Mover stands $5.14 per cwt above the June Class I Mover, not even July’s Class I had the benefit of the full advance in June cheese trade because it was based on just the first two weeks of the June rally.

According to John Newton American Farm Bureau chief economist , there is currently, no mechanism to prevent negative PPDs. Newton writes in a recent ‘market intel’ piece:

“Historically, negative PPDs occur less than 15% of the time. Methods to prevent or mitigate negative PPDs  — such as eliminating the advanced pricing component, reconsidering the higher-of pricing formula (but with forward contracting of Class I milk), requiring mandatory pooling of milk in all Classes or consideration of decoupling the Class I milk from the price of manufactured milk products  – could be explored.”

UPDATE: Negative PPDs will be here for a while. Looking at these price spreads does not bode well for the continued inverted relationship between Class III and the Class I Mover — or what milk market analysts call “unorthodox pricing arrangements” — that will lead to continued negative PPDs and de-pooling of the higher Class III value milk from Federal Milk Marketing Order pools. In fact, the discussion of this issue has many twists and turns, a few questions have been forwarded to USDA Dairy Programs for some explanations, and June pooling data and blend price / PPD information is anticipated after the 14th.

Here’s the problem. Even when the ‘advanced pricing’ method gets caught up, the real problem is the way the Mover is now calculated. The 2018 Farm Bill made a huge change without a USDA administrative hearing and without a producer (bloc) vote.

Fluid milk processors wanted stability. They wanted to be able to forward-contract their milk costs and not have to deliberate over which futures contract to use — Class III or IV — since the Class I Mover used to be based on the “higher of” the two classes. Now, the futures markets are showing us that the spread between Class III and IV is going to be well above $1.48/cwt through November. That’s the significant number because the new Class I Mover method is calculated by averaging Class III and IV and adding 74 cents to that average. Once the III / IV spread hits $1.48/cwt, the 74 cents no
longer covers the difference.

Once we get to 2021, the spread narrows through those months, according to what the futures show now, but the Class III / IV spread looked reasonable and well within that $1.48/cwt for this current period back when viewed on the futures markets six months ago. If Congress can make a big change like this to Federal Order pricing formulas based on NMPF and IDFA agreeing on such while the Farm Bureau took a neutral position
— other than to review it and show it to be a wash when averaged over time — why can’t the Congress require a USDA National Hearing on milk pricing with Report to Congress?

Previous Farm Bills had such language, but the National Hearing “cost” was never funded. Now, the idea of a National Hearing on milk pricing, and a producer vote on Federal Orders, is seldom discussed. What we see from this Class I Mover example that a big changes can be made and implemented quite readily at the legislative level — no hearing or vote required — as long as the cooperative processors and proprietary processors agree on the change in advance. If milk is substantially depooled to keep higher end product values in hand, hopefully through the reblending process, plants and cooperatives will pay the marketplace value to dairy farmers, given the sacrifices producers have made to bring production into line with demand.

FYI: The Pennsylvania Milk Marketing Board (PMMB) successfully “decoupled” and stabilized the Class I milk price for two months by setting a Class I floor of $15 through the state’s over-order premium authority. The Federal Milk Marketing Orders were going to have a national hearing on this in April, but chose not to after economists and organizations in the Upper Midwest cheese region complained. The PMMB action was limited only to Pennsylvania, so for two months (the limit of the Order), when the Class I beverage milk price for milk produced, processed and sold in Pennsylvania fell below $15, the current over-order premium of around $1.00 per cwt was expanded automatically to bring the price back up to $15 for May-July 2020 for this very reason.

Trouble is, with the FMMOs not considering a similar move, this PA ‘premium’ only pertains to bottling plants paying milk suppliers for milk produced on PA farms (and they are free to take milk from other farms outside of PA). This price was built into the PA minimum retail milk price for May and June, but retailers, processors and cooperatives are not required to pass these state-mandated premium funds paid by PA consumers back to PA farms — unless the milk meets all three of these criteria: produced, processed and sold in Pennsylvania.

Author’s Opinion: There is one other thing worthy of consideration. A national hearing on milk pricing, period, to look at options, updates, simplification, transparency, daily reporting, producer voting, consolidation, transportation and deductions. Some grassroots groups have been asking for a national hearing with report to Congress for nearly 10 years as there is no other way for farmers to access the FMMO system run by market administrators, and they don’t even get a vote because cooperatives bloc-vote changes on behalf of their members. Previous Farm Bills included language for such a national hearing, but they were never conducted. At some point, the complexities at play here need to be evaluated from both regional and national perspectives in terms of “orderly marketing” and how farm viability and farm and food security in regions are affected and in terms of fulfilling the desire of many consumers wanting fresh, local milk.

-30-