
By Sherry Bunting, Portions reprinted from the May 10, 2024 column with a few preview notes for the May 17 weekly Milk Market Moos, available exclusively in Farmshine Newspaper
This week’s settlement checks for April milk are hard hit by the record-low protein price of $0.83/lb and the $4 to $5 spread of Class IV over III that continues to depress the Class I price via the ‘average of’ method — resulting in depooling of higher value manufacturing milk. But the good news is the cheese markets have sustained a 5-week rally that has been heating up, pushing Class III milk futures higher, while tight supplies of nonfat dry milk moved briskly at higher prices to keep Class IV forging ahead too.
First the bad news: April FO blend prices are mixed with component-pricing lower, Fat/skim-pricing generally higher
The record-low April protein price of 83 cents/lb and second lowest Class III price of the year pushed the Federal Order (FO) blend prices 25 to 45 cents lower in six of the seven FOs that use Multiple Component Pricing (MCP). The Northeast, was off just 9 cents, given the fact that processors still pooled some milk used for higher value Class II and IV products, although not as much. De-pooling of Class II and IV milk was heavier in other MCP FOs due to the whopping $5 spread between Class II and IV ($20.23 and $20.11) over Class III ($15.50) and the fact that Class II and IV were $1.00 higher than the Class I ‘mover.’
The wide spread pushed the Class I ‘mover’ price $1.00 lower using the ‘average of’ calculation than it would have been under the previous ‘higher of’ method. The May Class I mover price is even more disadvantaged — down $1.73 vs. ‘higher of’ — based on the advance pricing factors at the beginning of April before the CME cheese market rally begins filtering its way into USDA weekly surveys and FO formulas.
Three of the four fat/skim priced FOs — Florida, Southeast and Appalachian — have April blends that are mostly 20 cents higher than March. Fat/skim priced FOs benefitted from the butterfat price at $3.33/lb and a solids nonfat (skim) price at 97 cents/lb that was 14 cents higher than the protein price. This is the first time such an inversion has occurred.
Meanwhile, the fat/skim-priced Arizona FO (131) saw its April uniform price fall by 19 cents due to Class II and IV depooling, which increased the negative effect of a higher Class III utilization percentage.
The uniform price in the three southeastern region FOs (5, 6 and 7) would have netted an additional 70 to 80 cents per cwt — if Class I had been priced via the ‘higher of.’ The Mideast (FO 33) would have netted 40 cents per cwt more; the Northeast, Central, and Southwest (FOs 1, 32 and 126) 29 to 30 cents; California and Pacific Northwest (FOs 51 and 124) 20 cents; Upper Midwest (FO 30) 6 cents. All MCP FOs would have benefitted from better alignment keeping more of the higher-valued Class II and IV milk in the FO revenue sharing pools. It’s hard to say whether or how much of the windfall profits of depooling are consequently shared with dairy farmers shipping the milk.
Once again, the Upper Midwest (FO 30) had the rock-bottom uniform price of $15.95 at 3.5% butterfat, with over 92% of the utilization being Class III. If the ‘higher of’ had been used for pricing Class I, the pounds of Class II and IV utilization would likely be greater, which may have contributed to a more positive uniform blend price while yielding a little more than a nickel of additional Class I contribution. Instead, the blend price included less than 2% Class II and IV, and just over 6% Class I.
The FO 30 market administrator saw fit to send a reminder letter to handlers in March that they must show separately how milk payments were calculated for producers having both pooled and depooled milk to ensure the pooled milk was paid at the FO minimum price. Even 100% pooled producers have been seeing ‘milk check gymnastics’ such as underpayment of the FO minimum for ‘other solids’, and then using the producer’s protein premium to make up the difference in order to achieve the regulated gross minimum.
According to USDA AMS, Federal Milk Marketing Orders with multiple component pricing, use individual component values to determine the minimum gross value due to producers. The FMMOs’ primary function is to ensure that the gross payment to the producer is at least equal to the minimum payment for their pooled milk. Enforcement of individual component values may be pursued by FMMOs to prevent handler deception and maintain transparency. In FMMOs where it is common to pool only a portion of a producer’s milk, proprietary handlers are required to send statements to producers indicating the separate amounts paid for pooled and non-pooled milk.
The April 2024 uniform prices and PPDs were announced May 12 through 14 as follow (+/- change from month ago):

Now the good news! What’s UP with Class III?
For 18 months, Class III has been the underdog in milk pricing, especially rough for dairy producers in the Upper Midwest struggling under the brunt of FMMO 30 blend prices built mainly on Class III.
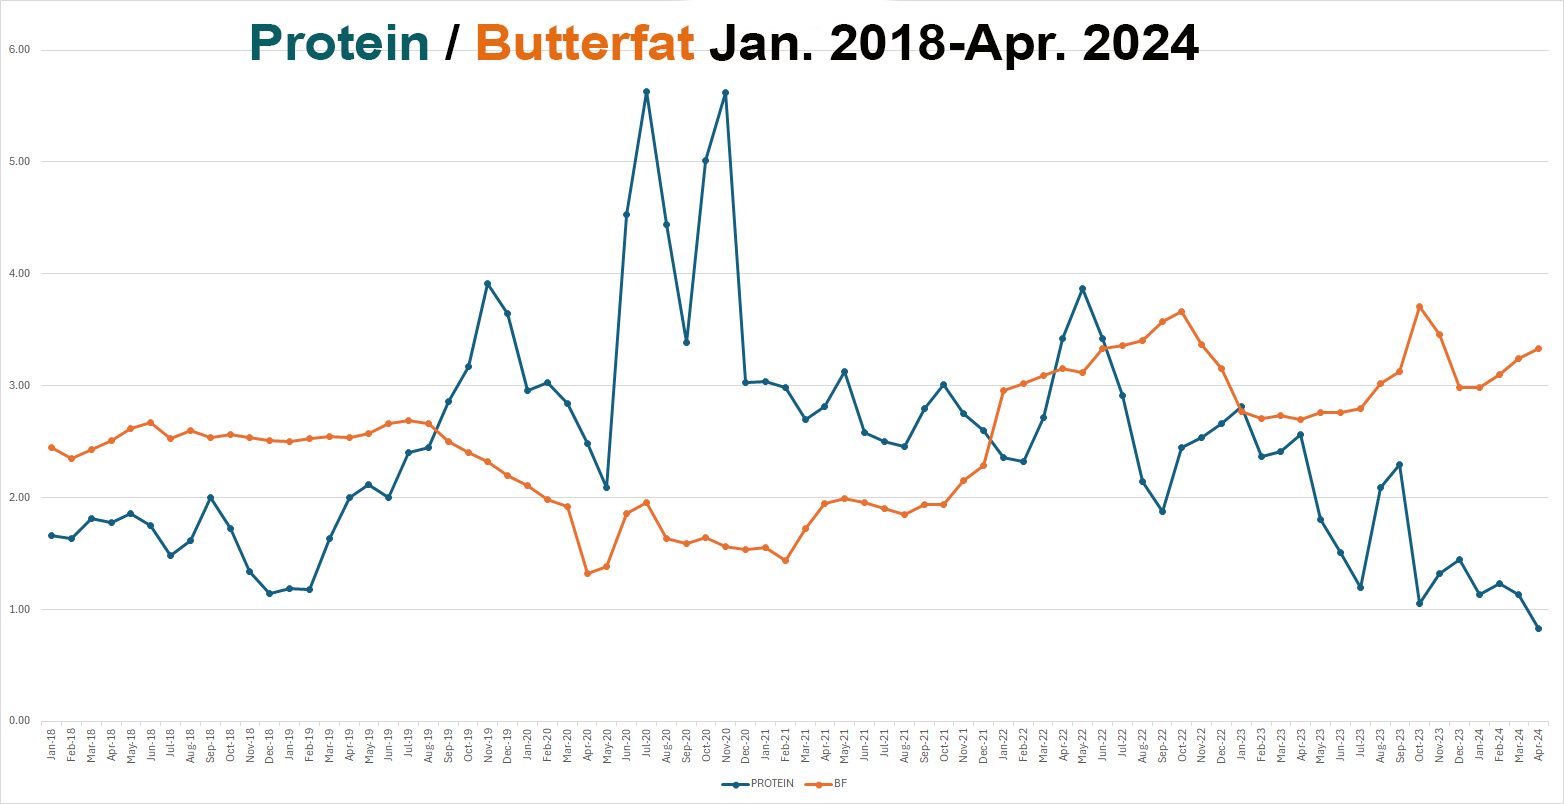
In fact, the April protein price hit a record low, announced May 1st at 83 cents/lb, which is 14 cents below the 97 cents/lb price for solids nonfat. This inversion has never happened before, according to our search of class and component pricing archives.
The butterfat price for April is quadruple the protein price at $3.33, creating additional divergence issues in multiple component pricing orders.
Meanwhile, the Class III milk futures haven’t offered much of a breakeven price to spend money protecting with hedges or DRP…
Until now…
Class III milk futures continued higher — skyrocketing limit-up for nearby contracts Wed., May 8, putting the exclamation point on five straight week of gains that have added $3 per hundredweight to the remaining 2024 contract months, going from the $16s and low $17s to the $19s and $20s, with 2025 contracts well into the $18s. This is the first time the Class III milk futures board has seen a $20 mark in over 18 months.
Class IV futures also made solid 20- to 30-cent gains charting over $20 and $21 across the board.
If the current Class III rally goes too far, too fast in the near-term, we could see negative PPDs in some Federal Orders in June for May’s milk because the May Class I advance base price mover was already announced in mid-April, and includes the much lower advance pricing factors of the (Class III) cheese and whey markets during the first two weeks of April.
The ‘average of’ method disadvantaged the May Class I mover by $1.73/cwt, which will undoubtedly be a factor for milk pooling / depooling decisions at the end of this month as Class I, at a base price of $18.46, will likely be rock-bottom lowest class for May, except where location differentials are high enough to boost it.
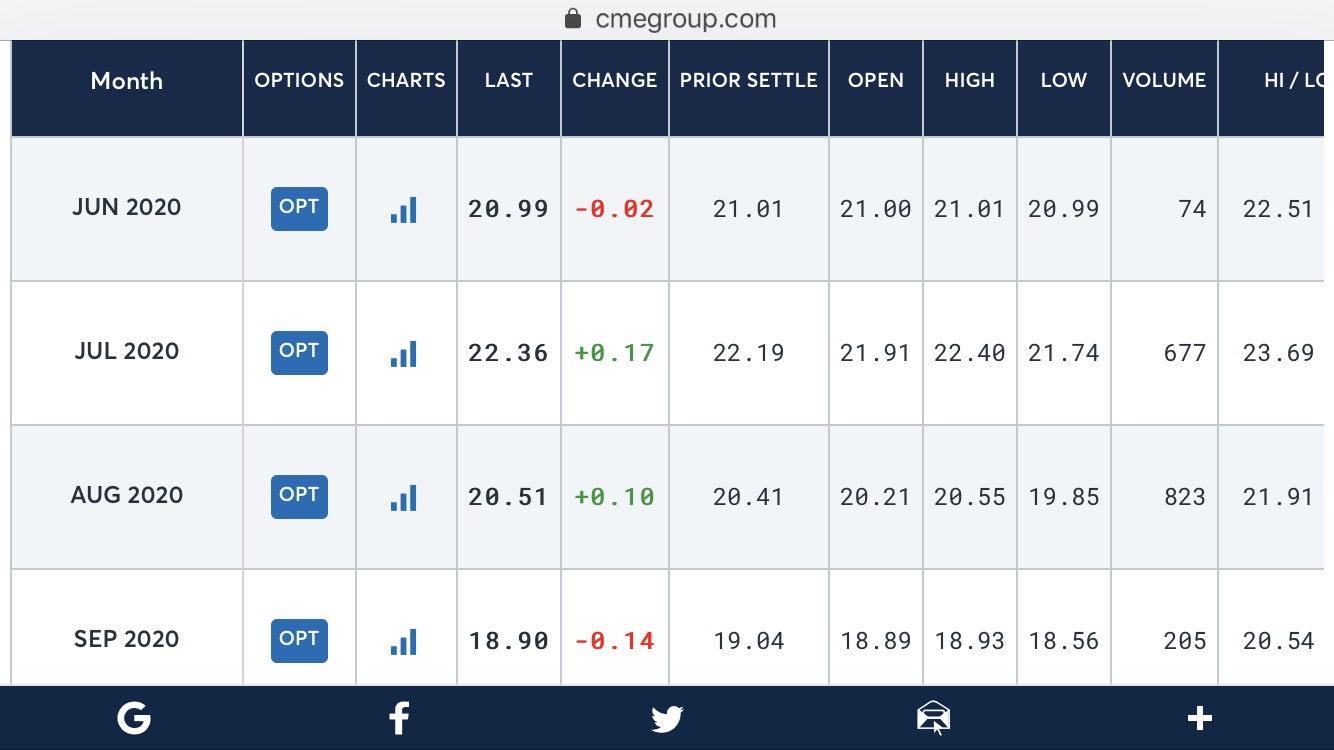
$20 finally appears on Class III futures board (June), Spot cheese hits highest price in over a year.
On Wed., May 8 the Class III milk futures for the next 12 months (May24 through Apr25) averaged $19.04, up 54 cents from the previous Wednesday. Class IV milk futures averaged $20.86, up 22 cents from the prior Wednesday.
The milk futures rally is driven by the upward momentum in CME daily spot cheese markets, reaching levels May 8 that are 50 to 55 cents per pound higher than six weeks ago.
The 40-lb block Cheddar price roared 11 1/2 cents higher to $1.95/lb in a single trading session Wed., May 8, gaining 20 cents/lb on the week, and hitting the highest level since last fall, with a single load trading. For 500-lb barrel cheese, at $1.90/lb, the gain was a dime on the week, and the highest price in over a year, with zero loads trading.
(Spoiler alert, the spot price for 500-lb barrel cheese skyrocketed well north of $2 on Tues., May 14 with a single load trading at $2.06. Conversely, Tuesday’s trading session on 40-lb block Cheddar started out moving a load as high as $2.00/lb, which would have been a 2-cent gain for the day. However, after the dust settled on the brisk trading session that moved a whopping 14 loads of blocks in a few short minutes, the market was pegged at the lowest load price of $1.93/lb — down 5 cents from the day before. A bid came in at $1.92 and was ignored after such an abnormally large clearance of blocks for a single session. More on this in the May 17 Farmshine.)
All other dairy commodity prices were higher Wed., May 8, with no trades changing hands. Dry whey gained a penny at 38 1/2 cents/lb (where it continued trading on Tues., May 14 with 2 loads changing hands). May 8th Butter was up 2 cents at $3.02/lb (but traded 16 loads at $3.00/lb Tues., May 14 and 1 load at $2.99/lb, which was a 3-cent loss since the low price is the peg for the day). Nonfat dry milk (NFDM) was up a penny at $1.13/lb on May 8 (and gained 3 1/2 cents more on May 14 at $1.1650/lb with an incredible 26 loads moving in a single session’s narrow $1.16 to $1.1650/lb range).
Dairy farmers will not see these gains in their milk checks until June, if the trend is sustained.
In the face of lower overall dairy exports, analysts tout the record volume of cheese exports in March, which were no-doubt prompted by the cut-rate January through April pricing that doesn’t pay bills on the dairy farm.
We have to go back to 2019 to find a 4-month Jan-April average Class III milk price that was lower than the first four months of 2024. We have to go back to the Covid shutdown in 2020 to find an April Class III milk price that was lower than April 2024. But even then, protein held up at $2.48/lb, not the 83 cents per pound that USDA announced for April settlement.
The difference this time is that fat is so much higher (quadruple the protein price at $3.33/lb for April). This essentially pulls a credit out of protein as an adjustment in fat values for cheese vs. butter. This is a seldom-discussed and little understood function of FMMO multiple component pricing, and another downfall of the many months of wide Class IV over III divergence.
Better views ahead… Higher Class I sales and record-high made-to-order fresh mozzarella production compete with stored product output for reduced milk supply
While the rear-view mirror shows the rough road traveled, the view ahead is improving for Class III milk and the beleaguered record-low protein price. Milk production is down. Packaged Class I fluid milk sales are UP. Processors are making record amounts of fresh (made to order) mozzarella cheese, causing Cheddar production to slow. Meanwhile, Class IV product supplies are tight. (One reason overall U.S. dairy exports were down is that inventories and production of milk powder is down!)
The most recent USDA Dairy Products Report showed Cheddar cheese production down 3.3% year-over-year (YOY) in March, with all American style cheeses down 2.9%. A positive this year that was missing last spring and summer is the draw for milk to make Italian cheeses.
Mozzarella production set records in March, up 6.8% YOY, but those products are not price-surveyed, nor are they included in the FMMO Class III pricing formula.
In addition to Cheddar cheese, the Class III price is also made up of dry whey sales via the ‘other solids’ component. Whey production for both human and animal use is accelerating as inventories of value-added whey protein concentrate (WPC) and whey protein isolates (WPI) were more than 40% below year ago at the end of March, despite March WPC production being up 1% for human use and up 40% for animal use; WPI up 73% YOY.
Dry whey is the commodity used in the FMMO Class III pricing formula with production up 2.4% for human use and 19.2% for animal use in March.
On the Class IV side, butter production was up 1.5% YOY in March with inventories up 2%.
As for powders: Whole milk powder (WMP) production was down 14.6% with inventory 36.3% lower YOY; Skim milk powder (SMP), typically made for export orders, was down 41.7%; and Nonfat dry milk (NFDM) output was down 7.9% YOY in March with inventories off 20.3%.
On the flip side, milk protein concentrate (MPC) production was the contrarian — up a whopping 38.5% YOY in March. MPCs are often used to bump cheese yields higher per hundredweight of raw milk.
These factors beg questions: Why were Class III milk prices for the first four months of 2024 at 5-year lows and protein at a record-low 83 cents per pound for April? Was it the plan to crush Q-1 2024 spot cheese and Class III milk prices to generate record cheese export volumes in March? Are cheesemakers using some of that big increase in MPC production to make more cheese from each cwt of raw milk? Are bioengineered fermentation yeast proteins that are marketed in trade publications as ‘dairy protein analogs’ diluting the supply and demand equation fractionally?
Global picture improving
The global picture is also improving. New Zealand tallied a lower output for the season, and recent reports show stable to lower milk output in EU countries.

In the Global Dairy Trade (GDT) biweekly internet auction Tues., May 7, the all products index was up 1.8% over the previous auction on April 16. This includes a whopping 8% increase in the GDT price index for bulk Cheddar sales contracted out through November, plus a 2.3% increase in bulk Mozzarella sales for July.
In fact, GDT Cheddar contracts for June were up 6.5% in Tuesday’s auction; July up 3.9%; August and September had no sales. October and November contracts were up 11.2 and 12.5%, respectively, compared with three weeks ago.

 Recently, Farmshine interviewed O’Brien to better understand from a trader’s perspective how the dairy spot markets function since the transition from live floor trading to electronic trading in the second half of 2017. We also gained insights on some differences between the global and domestic trading platforms.
 For example, in past years, the largest physical producers and end users in the United States would regularly use the same clearing broker for their spot transactions, resulting in the majority of market participants acting on this inferred knowledge in real time. A single bid or offer from certain brokers would set distinct levels of support and resistance, and this was coveted as the most prolific dairy information of the day.