USDA announced $14 bil in CFAP 2 payments, Dairy estimate is $1.20/cwt for Apr-Dec milk

Second checks under CFAP 1 delayed by enrollment extensions

By Sherry Bunting, Farmshine, Sept. 25, 2020

WASHINGTON, D.C. — President Donald Trump and U.S. Secretary of Agriculture Sonny Perdue announced an expansion of the Coronavirus Food Assistance Program (CFAP) on Sept. 17, which means a second round of $14 billion in additional CFAP payments will be made to a new list of eligible commodities, including dairy cow’s milk as a price-trigger calculation and even goat’s milk as a sales-triggered calculation.

Sign up for this second round of assistance – CFAP 2 — runs from Sept. 21 through Dec. 11, 2020.

CFAP 2 payments for dairy calculate to a little over $2.00 per hundredweight on the equivalent of April through August milk marketings. However, the calculation boils down to $1.20/cwt on actual April through August milk marketings, plus another $1.20/cwt on the estimated September through December milk marketings – a 4-month period – using the average daily milk production from the prior 5-month’s actual marketings.

Specifically, the announcement describes the CFAP 2 dairy payments as follows:

Payments for cow milk under CFAP 2 will be equal to the sum of the following:

1) The producer’s total actual milk production from April 1, 2020, to August 31, 2020, multiplied by the payment of $1.20 per hundredweight, and

2)  The producer’s estimated milk production from September 1, 2020, to December 31, 2020, based on the daily average production from April 1, 2020, through August 31, 2020, multiplied by 122, multiplied by a payment rate of $1.20 per hundredweight.

This round of farm assistance, known as CFAP 2, follows in addition to CFAP 1.

The CFAP 1 payments were to be made in two stages, with enrolled producers having received most of their eligible payment in their first check. However, the second portion or balance of payments under CFAP 1 won’t be received until after all enrolled producers receive their first checks.

Producers have not yet received their second checks from CFAP 1 because the enrollment period for CFAP 1 was extended through Sept. 11. 

Further complicating payment of second checks under CFAP 1 is USDA’s extension of signups for certain counties in Louisiana, Oregon and Texas that were impacted by natural disasters (fires and hurricanes). Producers in those areas have until Oct. 9, 2020 to enroll in CFAP 1.

Once all enrollments in CFAP 1 are completed by Oct. 9, and once all enrolled farms receive their first checks for all eligible commodities under CFAP 1, then the remaining funds from CFAP 1 will be disbursed in the second checks to enrolled producers for eligible commodities, including milk.

CFAP 2, on the other hand, represents a totally separate second source of funding and assistance — and a second enrollment period — to cover market disruptions and additional marketing costs for the nine months period of April through December, whereas CFAP 1 covered mainly the disruptions for the first part of the year. There is some overlap in the time period, but these are two separate enrollments and calculations under CFAP.

To-date, according to USDA, nearly $1.75 billion has been paid to dairy farmers for milk under CFAP 1. The total paid or approved for payment to-date for all commodities under CFAP 1 is $10.2 billion.

Funds for CFAP 1 and 2 are from a combination of the CARES Act and the CCC. USDA used public feedback to make improvements under CFAP 2, according to Secretary Perdue.

CFAP 2 divides commodities into three categories for compensation as 1) Price Trigger Commodities, 2) Flat-rate Crops, and 3) Sales Commodities. Each category has a different method for calculating a payment.

Eligible livestock, including beef cattle and dairy cattle destined for beef, will be based on maximum owned inventory on a date selected by the producer between April 16 and August 31, 2020. USDA FSA personnel report that it’s okay if the date selected by a producer is within the same window as the date selected for CFAP 1 livestock payments as long as the animals in inventory on that date were destined for market as meat animals, not for dairy purposes.

USDA FSA personnel indicate that cull dairy cows are not eligible livestock under CFAP 2, but bull calves and any heifers identified as market animals for beef or veal can be claimed as inventory for market impact payments under CFAP 2.

Corn silage and other forages grown as feed for dairy cattle are also eligible under the corresponding flat rate acreage crops portion of CFAP 2

A complete list of farm commodities covered under CFAP 2 is available at farmers.gov/cfap

As with CFAP 1, there is a payment limitation of $250,000 per person or entity for all commodities combined. Applicants that are corporations, LLCs and partnerships may qualify for additional payment limits when members actively provide personal labor or management to the operation. 

In addition, USDA reports that this special payment limitation provision has been expanded to include trusts and estates for both CFAP 1 and 2.

Producers will also have to certify they meet the adjusted gross income limitation of $900,000 unless at least 75% or more of their income is derived from farming, ranching or forestry-related activities. Producers must also be in compliance with Highly Erodible Land and Wetland Conservation provisions to receive payments.

USDA reports that Farm Service Agency staff at local USDA Service Centers will work with producers to file CFAP 2 applications. Producers interested in one-on-one support with the CFAP 2 application can also call 877-508-8364 to speak directly with a USDA employee ready to offer assistance at the call center.

Farmers can also visit farmers.gov/cfap for additional information.

-30-

‘Unify or die’ concept doesn’t cut it

Time for transparency on where dairy checkoff’s partnerships are leading

By Sherry Bunting, Farmshine, August 28, 2020

Partnerships and proprietary information stop many conversations from moving forward when it comes to the direction of dairy checkoff leadership under Dairy Management Inc. (DMI).

Meanwhile, contrary to DMI CEO Tom Gallagher’s assertions in the Aug. 5 ‘open mic’ call, consumers DON’T know the nutritional benefits of milk. That’s why grassroots efforts to promote milk (like the Drink Whole Milk 97% Fat Free effort) get so much action. People really know very little about milk and dairy after decades of dairy farmers spending hundreds of millions of dollars annually in promotion and education.

But that’s okay, according to Gallagher, DMI is a supply chain expander.

We keep hearing this theme that consumers will deal with fewer players, shop at fewer stores, become less brand-loyal, learn to accept pre-planned food categories and assortments, realize ‘generics’ are just as good as brands, and will focus more on how diets affect the planet, while spending more for new innovative products… We have to stop a minute and wonder:

What does all of THAT mean?

First off, the math is not adding up.

More than one report or webinar has hit on the indicators showing consumers are focused on food purchases that address their concerns about health and economic value, and they are finding comfort in traditional choices – like real milk and dairy products.

Furthermore, the food disruptions of the pandemic have created more interest among consumers in where their food comes from – is it local, regional, produced in the U.S.? They are more in touch with the importance of local and regional food systems, and less keen on global supply chains nor globalization — not just of food, but also medicine and other necessities.

While rank-and-file consumers and farmers find opportunity and security in building localized or regional food systems, that is the last thing the big players want to see happen. So what do they do? They mine consumer data, something DMI will help with, to twist consumers’ health- and value-focused concerns to fit a ‘planetary’ values system that steers consumers straight into the jaws of the global suppliers that have checked all their pre-planned criteria boxes.

They want consumers to prioritize planetary diets so supply chains can be centralized and globalized — pure and simple — and our own industry checkoff organizations are participating at best, helping them accomplish it, at worst.

In fact, the “good for the planet” mantra — as defined by World Wildlife Fund (WWF) and its World Resources Institute (WRI) is what global corporations and Silicon Valley tech food investors are all about. They are creating the boxes, checking them off, and then trying to convince consumers that this is what is important to them when making decisions about their food.

Data clouds, omnichannel marketing, digitized food, personalized experiences, purpose-driven marketing, planetary diets – these are but a few of the buzz terms and technologies driving future of food transformation.

Through GENYOUth, the dairy checkoff is actually facilitating transformation, grooming schoolchildren to make choices that will eventually pad the wallets of billionaire tech-sector food investors and give them control under the guise of planetary diets and climate change. The future-of-food players need a global ‘value-driver’. It was climate change. 

Then came Covid, and people were forced home and began to turn inward to the health and economic needs of themselves and their families. They began to see the importance of communities and began to recognize that farmers are connected to their communities.

To bring them back “on-task”, WWF recently launched a campaign to link Covid-19 to the already set goals. In fact, according to its website, WWF explains that, “A big possible casualty of COVID-19 are the world’s Sustainable Development Goals (SDGs).

In a July 22 report on the pandemic and planetary health, WWF scientist Robin Naidoo states that, “In 2015, the United Nations adopted (Sustainable Development) goals to improve people’s lives and the natural world by 2030.The success of these SDGs depends on two big assumptions: sustained economic growth and globalization.

“COVID-19 has now torn both assumptions to shreds,” the WWF report states. “This has fundamental implications for how we conceive of and prioritize sustainability in a post-pandemic world.”

The report then goes on to twist the narrative on these UN SDGs (that are also part of DMI’s Net Zero Initiative) to say 30 of the targets “would help to lessen the likelihood of another global pandemic.”

Like a chameleon, the big players adapt the plan by changing the picture to shift consumer focus back onto the planetary diets and by honing in on post-Covid concerns about health and economics from a different angle. Easier to do this when people do not know much about milk and dairy.

Yes, there is a tug of war emerging from the pandemic in which consumers seek and grassroots farmers can deliver real, whole, healthful foods in regional, national and international food systems that are in direct competition with centralized global supply chains that want to streamline, limit options and control diets.

While DMI leaders are busy convincing dairy farmers to get with the program of unified marketing in order to compete – as one — in a big marketplace, what is DMI actually doing with their empowerment?

— DMI has a close working relationship with WWF to write the rules of the ‘sustainability’ and ‘net-zero GHG’ playbook – the driver.

— DMI’s marketing and public relations contractor Edelman has close ties to WWF, the EAT Lancet forums, and is developing new terms for brands in the plant-based alternative milk sectors.

— DMI partners with DFA to help launch a 50% milk 50% oat or almond juice beverage with pretty packaging and marketing that make it appear superior to the milk produced and bottled from dairy farms.

— DMI’s GENYOUth program facilitates access to schoolchildren so global corporations and other partners can groom schoolchildren into future decision-making consumers focused on “planetary diets” – their global value system.

DMI recently hired a digital food and cellular ag proponent as its vice president of Dairy Scale for Good. Caleb Harper’s hiring has brought many questions but is merely one more cog in the supply chain wheel being built with dairy farmer checkoff money. His focus will be large dairies. His background is controlled environment horticulture through computerized plant boxes that several science publications, and even public radio, pointed out were “smoke and mirrors.” His father has ties to the early rendition of fairlife through Mike McCloskey, and both Harper and McCloskey are part of WWF’s thought leadership group

Innovation is normally something to be enthusiastic about. Technology is progressive and something farmers embrace. Competition is healthy and provides entrepreneurial opportunities.

But when it comes to mandatory promotion dollars, gone are the days of managing content that everyone can see, as it all goes digitally underground to meet proprietary consumer targets of partners. Gone are the days of education to promote the benefits of dairy to meet the needs and questions of consumers.

When farmers are forced to fund an entity with the power to set parameters on how they do business, an entity that is overseen by USDA and yet is partnered with activist groups, large multinational companies and global supply chain consolidators, and an entity that can pay for research that then becomes proprietary and could involve diluted dairy products such as butter that is mostly water, and an entity that begins to see its role as the expander of the supply chain… yes, transparency and vigilance are most definitely needed.

-30-

Markets review and look-ahead, USDA pegs July ‘All-Milk’ at $20.50

U.S. All-Milk $20.50, DMC $12.41

The USDA NASS Agricultural Prices report calculated a U.S. All-Milk price of $20.50 for July, up $2.40 from the June All-Milk price of $18.10 and $1.80 higher than a year ago. With this as the pegged U.S. average milk price, the July Dairy Margin Coverage (DMC) margin was calculated at $12.41, also $2.40 higher than June and $2.91 above the highest level of DMC coverage.

These July USDA numbers are welcome, but tell half the story.

The chart above lists the July 2020 USDA All-Milk price calculations for the top 24 milk-producing states in descending order with the U.S. average highlighted.

What stands out is the range from top to bottom. It has doubled from a more typical $3 to $4 spread to an $8 to $9 spread in June and July 2020. This is the widest we could find on record — with the U.S. average All-Milk price standing fully $4.00 higher than the state with the lowest All-Milk price in June and July 2020 compared with a more typical $1.50 difference a year ago.

A year ago, 7 of the 24 USDA milk production report states were below the U.S. average, a more typical occurrence. In June and July 2020, 15 of the 24 states were below the U.S. average All-Milk price.

On the up-side of the chart, we see that the highest states are $4 to $5 above the U.S. average, when normally that difference would be less than $3.00.

Actual mailbox price calculations won’t be released for five months, and when they are released, the range will likely be even wider from top to bottom than the $8 to $9 spread we see in All-Milk prices the past two months.

Unofficial milk check surveys of volunteered data from dairy producers in six federal orders for June and July show a whopping $14.00 per hundredweight range from top to bottom in gross pay and mailbox net pay.

As for the August All-Milk price, USDA won’t report that until the end of September. We will get Federal Order uniform price announcements for payment of August milk in mid-September. On Sept. 2, USDA did announce August Class and Component prices with Class III (cheese) milk at $19.77, which is $7.24 above the Class IV (butter / powder) price of $12.53. Class II was announced at $13.27. The August protein price was pegged at $4.44 and butterfat $1.63.

Margin ‘equity’ affected by wide spreads

For dairy producers enrolled in DMC — but in regions receiving the lower end of these All-Milk prices in June and July — the safety net program thresholds were not met by the ‘average’ margin even as that margin did not reflect their reality. For dairy producers using a variety of risk management options, new challenges have also emerged in the current market dynamic due to de-pooling of milk making negative producer price differentials (PPD) more negative in some areas.

While the spread between Class III and IV looked like it would narrow this fall, an upswing in Class III futures for October through December contracts this week — and lackluster performance on Class IV — show spreads in manufacturing class values could widen again, which tends to be an incentive for de-pooling in Federal Orders where a mix of products, including Class I beverage milk, are produced.

There are tools to navigate these challenges, say the experts, but a deeper concern is how closely the divergence can be related to the product mix of the CFAP food box government purchase rounds — and changes in U.S. dairy imports.

As the third round of CFAP Farmers to Families Food Box purchases are underway for fourth quarter 2020 delivery, USDA this time set parameters for food box dairy products to be more representative of Class II and IV products, along with the Class III cheese products. In addition, the third round defines the fluid milk in several solicitations to be 2% or whole milk. This will also help with fat value that has plummeted this year.

Still, the majority of government food box purchases continue to be cheese, and the markets responded last week as spot cheddar rallied back above $2.

CME spot cheese pushes higher — past $2/lb, butter and powder steady-ish

Cheese markets gained more than a dime in CME spot trade on Wed., Sept. 2 with 40 lb blocks pegged at $1.91/lb. From there, the market continued to move higher at $2.12 by Friday, Sept. 4, up 30 cents from the previous Friday with zero loads trading; 500-lb barrels were pegged at $1.70/lb, up 27 cents with a single load trading.

Spot butter managed to gain through midweek before losing some of that advance at the end of the week. On Friday, Sept. 4, a whopping 12 loads were traded on the CME spot market with the price pegged at $1.4925/lb — up a nickel from the previous Friday. Nonfat dry milk on the CME spot market gained a penny at 1.03/lb with 6 loads trading Friday.

Milk futures are improving again, divergence continues

Class III and IV milk futures for the next 12 months came a bit closer together, on average, but the fourth quarter 2020 contracts are still divergent as Class III milk futures rallied Wednesday while Class IV was stagnant through yearend.

Trade on Sept. 4 closed with the September Class III contract up $1.37 from previous week at $17.06, October up $1.27 at $18.89, November up 21 cents at $17.55, and December down 12 cents at $16.65. On Friday, Sept. 4, the next 12 months averaged $16.82.

Conversely, yearend Class IV futures closed with the September Class IV contract down 14 cents from a week ago at $12.82, October down a penny at $13.86, November down a dime at $14.39, and December down 9 cents at $14.69. The next 12 months (Sept. 2020 through Aug. 2021) averaged $15.03 on Sept. 4.

The average spread between III and IV over the next 12 months was $1.79/cwt.

Imports/export factors affect storage, which in turn affects markets

The USDA Cold Storage Report released at the end of August showed butter stocks at the end of July were up 3% compared with June and 13% above year ago. Total natural cheese stocks were 2% less than June and up only 2% from a year ago. Bear these numbers in mind as we look at exports and imports.

According to the U.S. Dairy Export Council (USDEC), total export volume is up 16% over year ago year-to-date – January through July – and July, alone, was up 22% over year ago. Half of the 7-month export volume was skim milk powder to Southeast Asia.  January through July export value is 14% above year ago.

However, butterfat exports are down 5% year-to-date. The big butter export number for July was not enough to make up for the cumulative decline over the previous 6 months.

On the import side, the difference between cheese and butter is stark. Cheese imports are down 10% below year ago, but the U.S. imported 13% more butter in the first 7 months of 2020 compared with a year ago.

When butterfat and butteroil as well as butter substitutes containing more than 45% butterfat are included in the total, the volume of imports is 14% higher than a year ago with the largest increases over year ago seen from March through June at the height of the pandemic when retail butter sales were 46% greater than year ago.

Looking at these butter imports another way, is it any wonder butter stocks are accumulating in cold storage to levels 13% above year ago at the end of July — putting a big damper on butter prices and therefore Class IV? The U.S. imported 13% more butter and 14% more butter and butterfat combined, plus exported 5% less butter and butterfat year to date.

As accumulating supplies pressured butter prices lower, the U.S. became the low price producer and exported a whopping 80% more butter in July compared with a year ago. This was the first year over year increase in butter exports in 17 months. Still, the record is clear, year-to-date butter exports remain 30% below year ago and total butterfat exports are down 5% year-to-date.

Experts suggest that butter and butterfat imports are higher because U.S. consumer demand for butterfat has been consistently higher even before the impact of the Coronavirus pandemic stimulated a run on butter at stores for at-home cooking and baking. This seems to be a difficult reasoning to justify — given there is 13% more butter currently stockpiled in cold storage vs. year ago.

If 14% more butter and butterfat are being imported, does this mean we need to import to serve consumer retail demand and keep larger inventory to serve that retail demand? If so, why is the inventory considered so bearish as to hold prices back so far as to amplify the Class III and IV divergence? Does month to month cold storage inventory represent excess or simply a difference in how inventory is managed in today’s times, where companies are not as willing to do “just in time” and “hand to mouth” — after having dealt with empty butter cases and limits on consumer purchases at the height of the pandemic shut down.

The trade has not sorted out the answers to these questions.

Meanwhile, these export, import, and government purchase factors impact the inventory levels of Class III and IV products very differently — and we see as a result the wide divergence between Class III and IV prices and between fat and protein component value.

Interestingly, USDA Dairy Programs in an email response about negative PPDs that have contributed to the wide range in “All-Milk” prices, says the higher value of components “is still in the marketplace” even if All-Milk and mailbox price calculations do not fully reflect it across more than half of the country.

— By Sherry Bunting

-30-

Farmers wonder what happened? June PPDs ugly, pool volume down 36%

TableOne_FMMO_Statistics_June2020_Bunting (1)

By Sherry Bunting, Farmshine, July 17, 2020

BROWNSTOWN, Pa. — The negative PPDs are turning out to be whoppers as expected for June, and experts say the situation will repeat in July. In fact, by the looks of the milk futures markets, the wide spread between Class III and IV is projected to remain above the magic number of $1.48/cwt. through at least September and quite possibly through the end of the year.

That’s the big news. This divergence is messing with PPDs more than normal and changing the ‘basis’ for producers in a way that defies most risk management tools. While the Upper Midwest milk checks reflected some of the marketplace rally, other regions fell quite flat. The range in uniform prices among FMMO’s is $4 from the $13s in in California, the Southwest and Mideast (Ohio, western PA, Indiana, Michigan) to $15s in Northeast, Southeast, Appalachia to $16s in Florida and the highest uniform price in the $17s for the Upper Midwest.

In fact, depending what Federal Milk Marketing Order (FMMO) you are in, and depending upon how much of that higher Class III “marketplace” value makes it into payments by plants to co-ops and producers, this could alter how “real” the Dairy Margin Coverage margin is, as well as the workings of Dairy Revenue Protection (DRP) program insurance and other risk management options that play off Class III but settle out on an “All Milk” price USDA will calculate for June at the end of July.

Producers who purchased DRP policies and based them on components to stabilize their risk in markets that utilize a blend of classes, are realizing an indemnity they expected to receive as protein doubled from May to June is now deflated to a smaller number due to negative ‘basis’.

Experts admit —  There’s no good way to manage PPD risk (or as it’s referred to in the skim/fat Orders of the South “revenues available to pay”). Interestingly, Dairy Farmers of America (DFA), at its member risk management website, is touting it has “strategies” for members to “mitigate future negative PPD risk”.

(Read to the end to learn how to participate in the Farmshine Milk Market Moos milk check survey on this issue.)

So, what changed? Other than a pandemic disrupting things.

A big change is the new way USDA calculates the Class I Mover. This was implemented in May 2019 and is currently adding on to the largeness of the inverse relationship between Class III and the uniform price in multiple component pricing orders.

In fat/skim orders of the South, producers are seeing one price on their check but then “revenues available” to pay a different price. In some cases, the “revenues available” is reference to dispensing with “overbase penalties” in June because revenues were available to pay a better price on that milk.

There are no PPDs in the four FMMOs still pricing on a fat/skim basis. But those Orders are seeing a flat-out reduction in their uniform price as announced for Florida and the Southeast FMMOs being lower than May! Meanwhile the Appalachian Order gained just 13 cents over May. (See Table I above.)

During the formation of the 2018 Farm Bill, National Milk Producers Federation (NMPF) and International Dairy Foods Association (IDFA) agreed on this new way to price Class I so that Class I processors could find “stability” in their costs by forward pricing without having to “guess” which manufacturing class price contract would be the “higher of.”

Farm Bureau remained neutral at the time that this was going through, and their analysis showed, historically, this new way leveled out over time for dairy producers. In fact, supporters stated that the stability of averaging Class III and IV to make the Class I Mover offered stability in input costs to milk bottlers so they could forward price, which in turn would offer stability to farmers by keeping bottlers in a position of strength to invest for the future. These are the reasons we heard, and it wasn’t much debated at the time.

No hearings were held by USDA on this major change in Federal Order pricing for the one and only class that is actually regulated. It was done in the Farm Bill, legislatively, because cooperatives and processors agreed it was what they both wanted. (More information next week on what factors Covid and non-Covid-related that are contributing to these diverse trends between Class III and IV.)

Under the current method, instead of using advance pricing factors from the “higher of” Class III or IV to calculate the Class I Mover, the two classes are averaged together and 74 cents is arbitrarily added.

The reason this is such a big issue right now, and likely for months to come, is the size of the spread. Rapidly rising block Cheddar — which hit another record of $3.00 per pound on the CME spot market early this week – keep pushing the AMS end-product pricing higher, more than doubling the value of protein between May and June and pushing Class III milk futures further into the $20s.

In fact, Class III milk futures settled Tues., July 14 at $24.34 for July, $23.09 August, $20.23 September, $18.40 October, $17.44 November and $16.35 December. Meanwhile those months for Class IV milk futures settled Tuesday at $14.03 for July, $14.51 August, $14.85 September, $15.07 October, $15.31 November and $15.53 December. Not until December is the spread within the $1.48/cwt range where the new way of averaging the two classes returns from being so out of kilter to Class III.

Remember, these negative PPDs are the result of Class III being larger than the uniform blend price, and the large amount of depooling that resulted keeps that higher value from being shared in the pool. Class III handlers are accustomed to taking a draw, not writing a check, and there’s no requirement to be pooled unless a plant is a pool supplier or wants to stay qualified for the next month in most FMMOs.

A Farmshine article two weeks ago explained these price relationships in more detail.

Now the numbers are coming in. The recently announced uniform prices and PPDs range from nearly $4 to near $8 — just as leading dairy economists had estimated.

The least negative was the Upper Midwest FMMO 30, at minus-$3.81, where 50% of the milk utilization was Class III, and the uniform price gained a whopping $4.92 at $17.23 for June. In fact, producers in Wisconsin and Minnesota report $20 milk checks for June.

The most negative PPD was minus-$7.91 in California, where less than half of one percent of the milk utilization was Class III, and the uniform price gained just $1.18 at $13.13 for June.

The Southwest FMMO 126 wasn’t far from that at minus-$7.62 with a uniform price announced at $13.42 — up 41 cents from May.

In the Northeast FMMO One had a minus-$5.38 average marketwide PPD, but the uniform price gained $2.19 over May at $15.66 with 18.5% Class III milk utilization.

The Mideast Order PPD is minus-$7.05, and the uniform price gained $1.26 at $13.99 with just over 9% Class III utilization.

In the southern FMMOs, pricing is still on a fat/skim basis, not multiple components, but the inverse relationship of the Class I Mover to Class III pricing is keeping June uniform prices flat or lower compared with May. The Southeast FMMO 7 saw a penny decline in the uniform price to $15.38 in June, and Florida Order 6 uniform price fell 46 cents from $17.29 in May to $16.83 for June. The Appalachian FMMO 5 gained just 13 cents at $15.27 for June.

Nationwide, just over 9.5 billion pounds of milk was pooled across all Federal Orders in June, down 36% from 14.4 billion pounds a year ago and down 28% from the 13.2 billion pounds last month.

May milk production was down 1.5% compared with a year ago, but the pooling volume nationwide was already 13% lower than a year ago in May.

USDA confirms that handlers making just Class II, III or IV products are not required to pool the milk, and therefore, due to “expected price relationships,” some handlers decided to not pool some of their milk receipts in May, and most definitely elected not to pool in June.

“Only Class I handlers are required to pool all of their milk receipts no matter how it was used,” USDA Dairy Programs explained in an email response to Farmshine this week.

In Table I are the marketwide FMMO data for June from Market Administrator announcements on different dates over the past several days. Comparing Class III volumes reported to month ago and year ago, an estimated 45 to 94% of Class III milk was depooled in various FMMOs, with the exceptions of Arizona and the Pacific Northwest where depooling was less of a factor.

Looking at the Northeast FMMO, alone, the estimated 45% less Class III volume in the pool in June vs. May, kept just over $110 million in collective component value out of the Northeast pool.

The question is, since USDA confirms that money is “in the marketplace”, will that “marketplace money” make it to farm-level milk checks, 13th checks, reduced retains? And will the “Covid assessments” and “marketing or balancing fees” and “overbase penalties” be adjusted or eliminated in June?

Others wonder how this will affect the All Milk price for June as calculated by USDA NASS at the end of July. Will the erraticness of how this “value in the marketplace” could be handled make winners and losers in terms of the Dairy Margin Coverage? How will this situation translate to those margins as a national average?

USDA AMS Dairy Programs defined the NASS All Milk price in an email as follows: “The NASS U.S. All Milk Price is a measurement of what plants paid the non-members and cooperatives for milk delivered to the plant before deduction for hauling, and this includes quality, quantity and other premiums and is at test. The NASS price should include the amount paid for the “not pooled milk.”

USDA explained that, “The blend price (Statistical Uniform Price, or SUP) is a weighted average of the uses of milk that was pooled for the marketing period (month).  If some ‘higher value’ use milk is not in the ‘pool’, then the weighted average price will be lower.”

However, the USDA response also points out that, “It is important to note that the Class III money still exists in the marketplace.  It is just that manufacturing handlers are not required to share that money through the regulated pool.”

So, will it be shared at the producer level outside of the pool? From the looks of a few June milk check settlements that have been reported to Farmshine on the morning of July 15, it’s not looking like the higher Class III value is helping checks shared from the Southeast FMMO at this writing. How will that stack up to a margin that gets figured also looking at the Upper Midwest where the uniform price saw almost a $5 gain?

We’ll look at that more closely next week.

Dairy producers who want to participate in my Milk Market Moos survey of June milk checks, please email, call or text your June milk price, fat test and PPD, and the list of deduct line items, especially any “Covid-deducts,” and include any overbase penalties. Also, provide your location or in what FMMO your milk is marketed. All the information will be anonymously aggregated. Email agrite2011@gmail.com or call or text 717.587.3706.

The Jersey Cattle Association is doing a similar June milk check survey sampling across the country.

This is a big topic when risk management is based largely on components and Class III, even though Class III use is not regulated unless processors want it to be, and certainly not in a pricing scheme that no longer prices the higher of two divergent manufacturing price trends into the only truly regulated class — Class I fluid milk. 

-30-

Understanding these negative PPDs, massive depooling; ‘New’ Class I calculation doubles the rub


Microsoft Word - DMAP IL20-3.docx

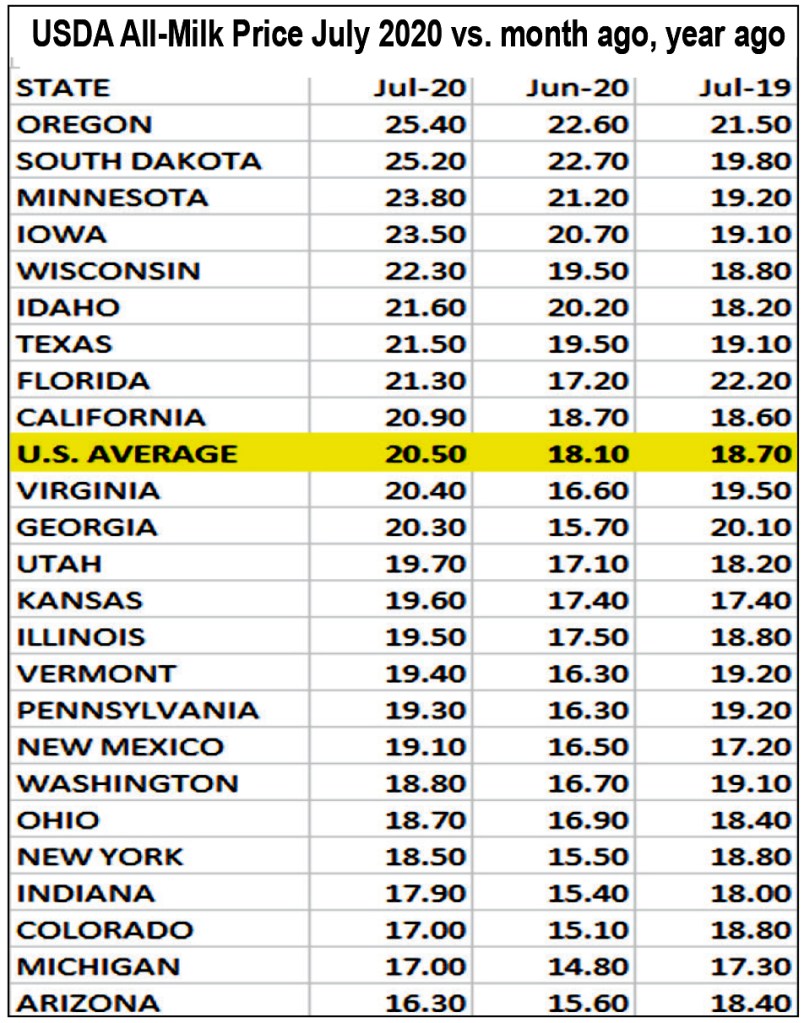
Large negative PPDs, Class III depooling and buyers reblending the milk price paid to farmers in June and July could be with us through August and even September because of how wide the divergence is between the Class III and Class IV prices, based on what the CME futures markets are showing. This divergence lowers all other classes in the pool (I, II and IV), especially now with the new “averaging” method of calculating each month’s Class I Mover in effect since May of 2019.

By Sherry Bunting, Farmshine, July 3, 2020

BROWNSTOWN, Pa. – Dairy producers seek to understand record-large negative PPDs (Producer Price Differentials) for June milk, meaning the the significant gains made in cheese markets and and Class III milk price are not making it to milk checks, especially for Federal Milk Marketing Orders (FMMOs) that are not predominantly cheese markets. (See FMMO data here

The extent of these negative PPDs – ranging from -$3.00 to -$8.00 per hundredweight (cwt) – has several factors, including the new way the Class I Mover is calculated since the 2018 Farm Bill changed it from the “higher of” Class III or IV pricing factors to an average of the two with an arbitrary 74-cent add-on. (See related July 28 story on revealing milk check data here)

“Expect historically large negative PPDs in Multiple Component markets for June and July,” writes Calvin Covington, retired breed association executive secretary and milk cooperative CEO, in an email interview with Farmshine this week.

He also estimates the volume of milk depooled in June will set a record (it did), further limiting how much of the past six weeks of higher dairy product prices will even make it into their milk checks.

Covington confirms Class III milk was already being depooled in May. As reported in last week’s Farmshine, we calculated the volume of milk pooled across all Federal Orders in May was already 13% below year ago levels.  For June, the depooling volume will be much more significant, in fact it is likely to be enormous.

“There is little economical reason to pool any Class III milk in June,” Covington asserts. “The only Class III milk that will be pooled in June is Class III milk going to a pool plant, and to meet any requirements to keep milk pooled in July.”

In fact, if buyers pooled Class III milk on Federal Orders in June, they would have to write a check to the settlement fund (instead of taking a draw from the fund as they do in normal conditions when the Class I bottlers are writing that check).

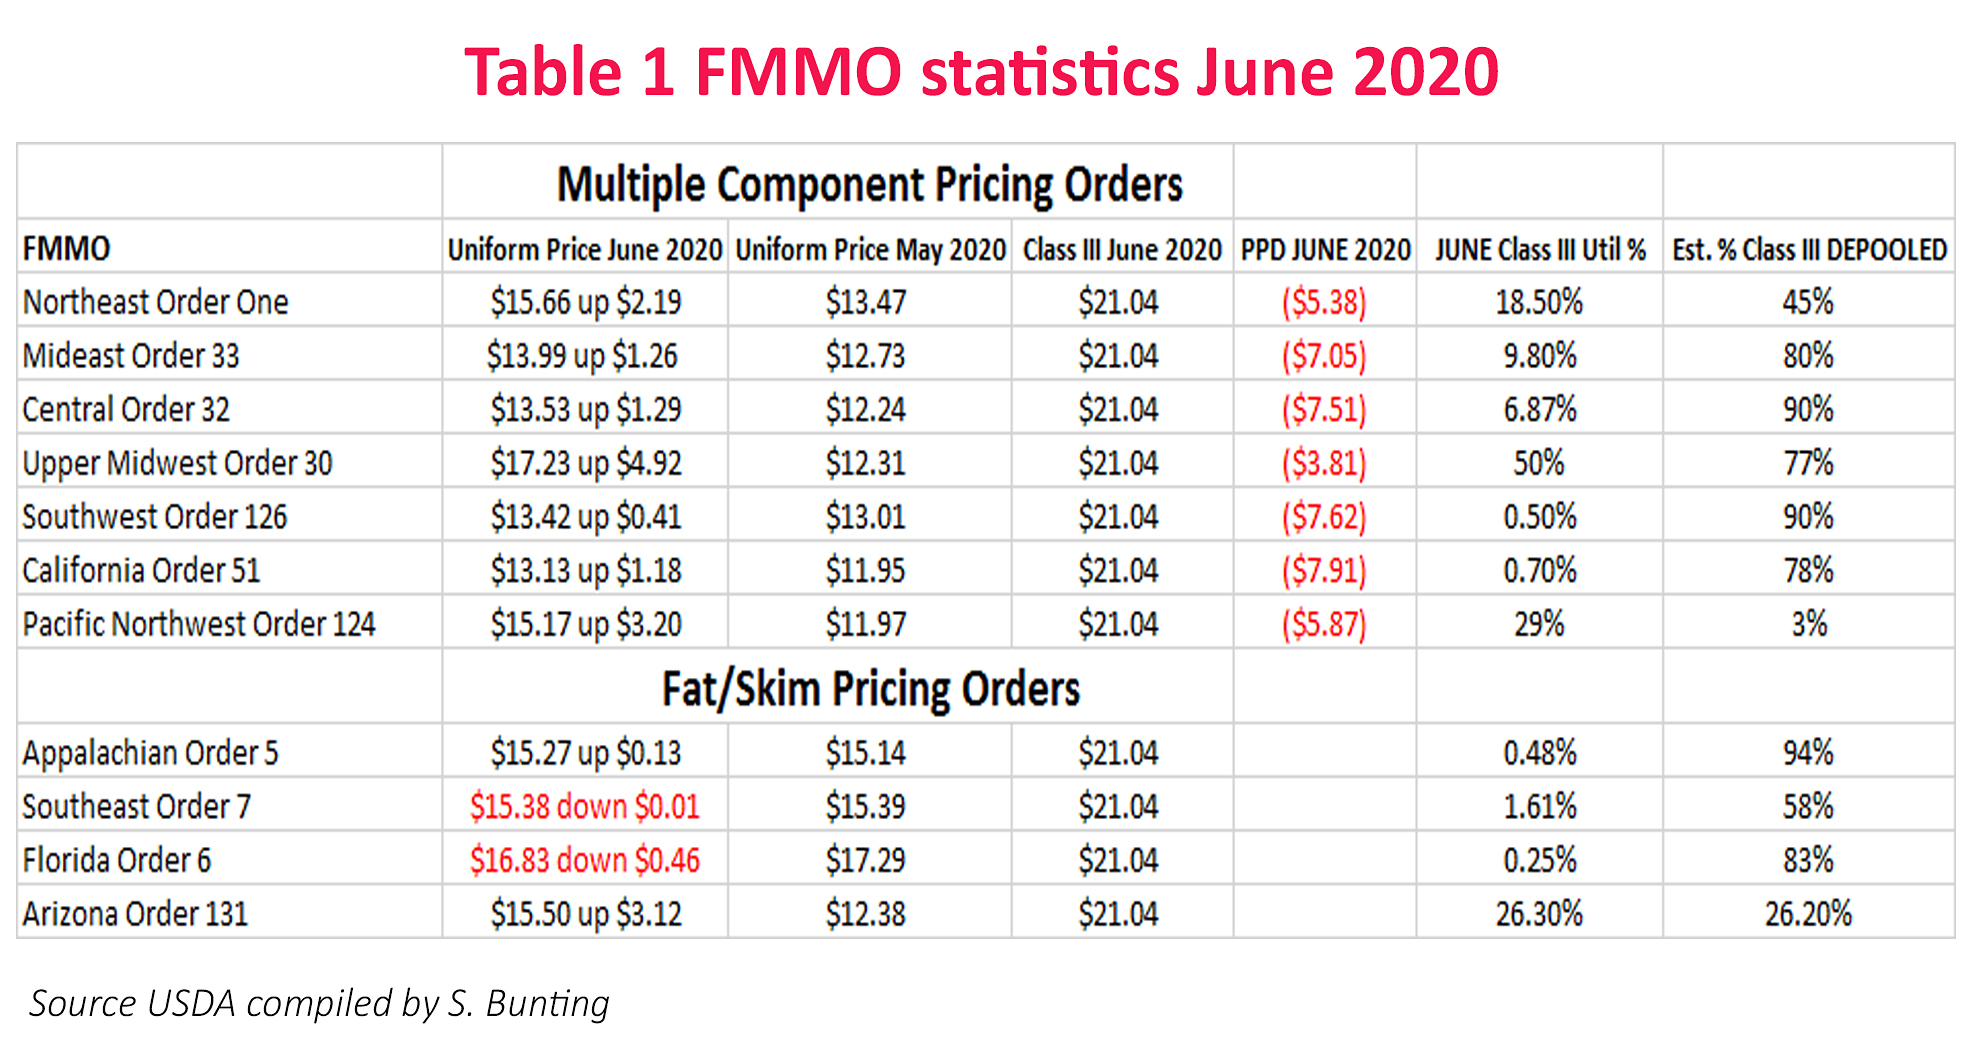
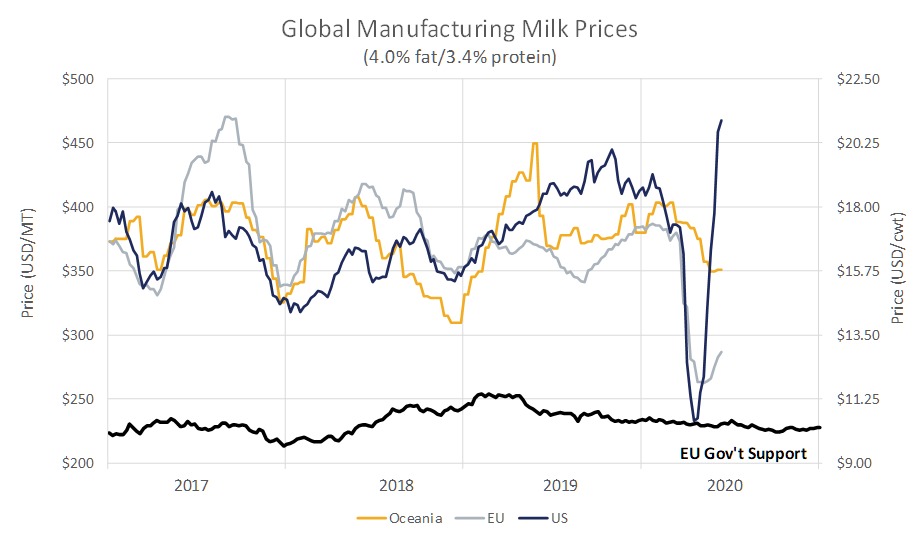
This is because the Class III price for June was announced this week at $21.04 – nearly $10 per cwt higher than the Class I Mover for June, which was set at $11.42 back in the beginning of May. The June Class I Mover is the lowest since the Great Recession while the June Class III price is the highest since 2014 — both now occurring in the same pooling month!

The reasons for the steep negative PPDs producers in Multiple Component Pricing (MCP) FMMOs will see for June milk, says Covington, are the high Class III price ($21.04) vs. Class IV ($12.90) and Class II ($12.99), the Class I Mover advanced pricing lag at $11.42, and the new method of calculating the Class I Mover, especially for July.

“In skim-butterfat priced markets – the Southeast Orders – blend prices will be lower than the Class III price,” Covington adds.

He explains that the PPD is paid on a hundredweight (cwt) basis, and it impacts all milk the same regardless of milk components.

“High component herds, especially in Multiple Component markets, see larger variation in milk prices,” Covington explains. “It is all due to arithmetic. Milk is paid on fat and protein. The more fat and protein in the milk, the greater the price change when fat and protein prices change.”

Covington spoke at World Dairy Expo last fall about the makeup of the milk check, and all of the factors that go into it. He reminds producers that only regulated plants are required to pay minimum class prices. Unregulated non-Class I plants choose to be associated with the pool so they can draw from it to pay a blend price to their farmers.

Now that the price for milk used to make cheese is so much higher than the price for milk used as a beverage or to make yogurt, ice cream, dips, butter, powder and all other products —  cheese plants are free to disassociate themselves from the FMMO pool, and there is no regulation stating they must pay their producers even the minimum announced Class III price for components.

Under the current system, when the Class III price rises quickly to overshadow the previously-set Class I Mover, there’s no reason for those Class III plants to pool the milk, unless they want to remain “qualified” to participate in the pool (draw) in the following month.

Covington observes that the upside-down pricing and negative PPDs will be with us at least through July. Dairy economists Mark Stephenson, University of Wisconsin and Andrew Novakovic, Cornell, noted in a recent Dairy Markets and Policy brief that this situation of negative PPDs, Class III depooling and buyers reblending the price paid to farmers could be with us through August and even September because of how wide the divergence is between the Class III and Class IV price via the CME futures markets.

This divergence lowers all other classes in the pool (I, II and IV), especially now with the new “averaging” method of calculating each month’s Class I Mover in effect since May of 2019.

Covington notes that it all boils down to math. The PPD is simply the difference between a Federal Order’s revenue available for producer payment (Class I, II, III and IV combined), minus the payment to producers at the Class III price based on components.

When Class III components are higher than the available revenue in the pool, the PPD is negative. When the Class III milk is depooled in that scenario, the funds aren’t there to pay the value.

“Factors impacting the size of the PPD, positive or negative,” he says, “are Class III price relative to the other class prices, volume of Class III milk pooled and an Order’s Class I price and usage.”

The primary factor in June’s negative PPDs is the extreme rapid increase in the Class III milk price. The rising cheese markets and Class III milk futures were mostly translated into the June Class III price because it was based on four weeks of June cheese sales.

The Class I Mover, on the other hand, was calculated six weeks earlier based on what the trade was doing at the end of April and beginning of May.

In the Covid-19 market-disrupted environment this is like two different world’s colliding based on timing and calculations.

Add to this the fact that Class IV and Class II prices saw muted increases during June compared to Class III’s large and abrupt increase, and what we are left with is the scenario where Class III beats all other classes by $7 to $10 in the same pooling month.

FMMOs with larger utilization of Classes I, II and IV will not see much boost from the uptrending cheese markets in their June blend price.

FMMO’s with large Class III utilization would see that boost. But depooling, reblending and assessments will all play further roles in how even those mailbox milk checks look once June milk is paid for.

Negative PPDs are not new. Dairy producers have experienced negative PPDs on milk checks in the past. Seeing a negative number in an uptrending milk market always brings questions and frustration. In fact, the November 2019 through January 2020 period in several of the past five years produced negative PPDs.

Last November, for example, the seven Multiple Component Pricing FMMOs saw a negative PPD averaging -$2 and ranging from just under -$1 to over -$3.

That pales in comparison to the negative PPDs producers will see for June, July and potentially August or September of 2020. Expect to see PPDs that are double, even triple, what was seen last November.

By now, most dairy farmers understand that a rapidly rising cheese market and corresponding Class III milk price presents the key factor putting PPDs into negative territory. When this happens, producers are reminded that a rising Class III milk price is still a positive development because it indicates milk markets are improving.

But in what some are calling a “whipsaw market” where prices turn abruptly in unexpected directions due to an unforeseen disruption like Covid-19, it’s useful to look at the other factors, for the long term.

First, when Class III milk’s component value is higher than the value of all the classes combined, the result is a negative PPD because after the Class III component values are paid, there is nothing left in the pool for the PPD draw. When the Class III milk is depooled, then that value is not available either.

When the blend price is higher than the Class III price, which is the norm, those Class III plants take a draw. When the reverse is true, they would technically owe the pool.

What sets this up against a huge market-disrupting event like Covid-19 is the lag-time between the calculation of the Class I Mover based on two weeks of trade and calculated six weeks in advance compared with the calculation of the manufacturing class prices based on the current month’s market conditions weighted over four weeks.

Even in those prices, there is a one to two week lag between what happens on the CME daily spot market and its translation to the weekly USDA National Dairy Product Sales Report, on which the class and component prices are based. There is no daily reporting of actual trade, actual sales of the four main dairy commodities, just weekly surveys that are published the following week.

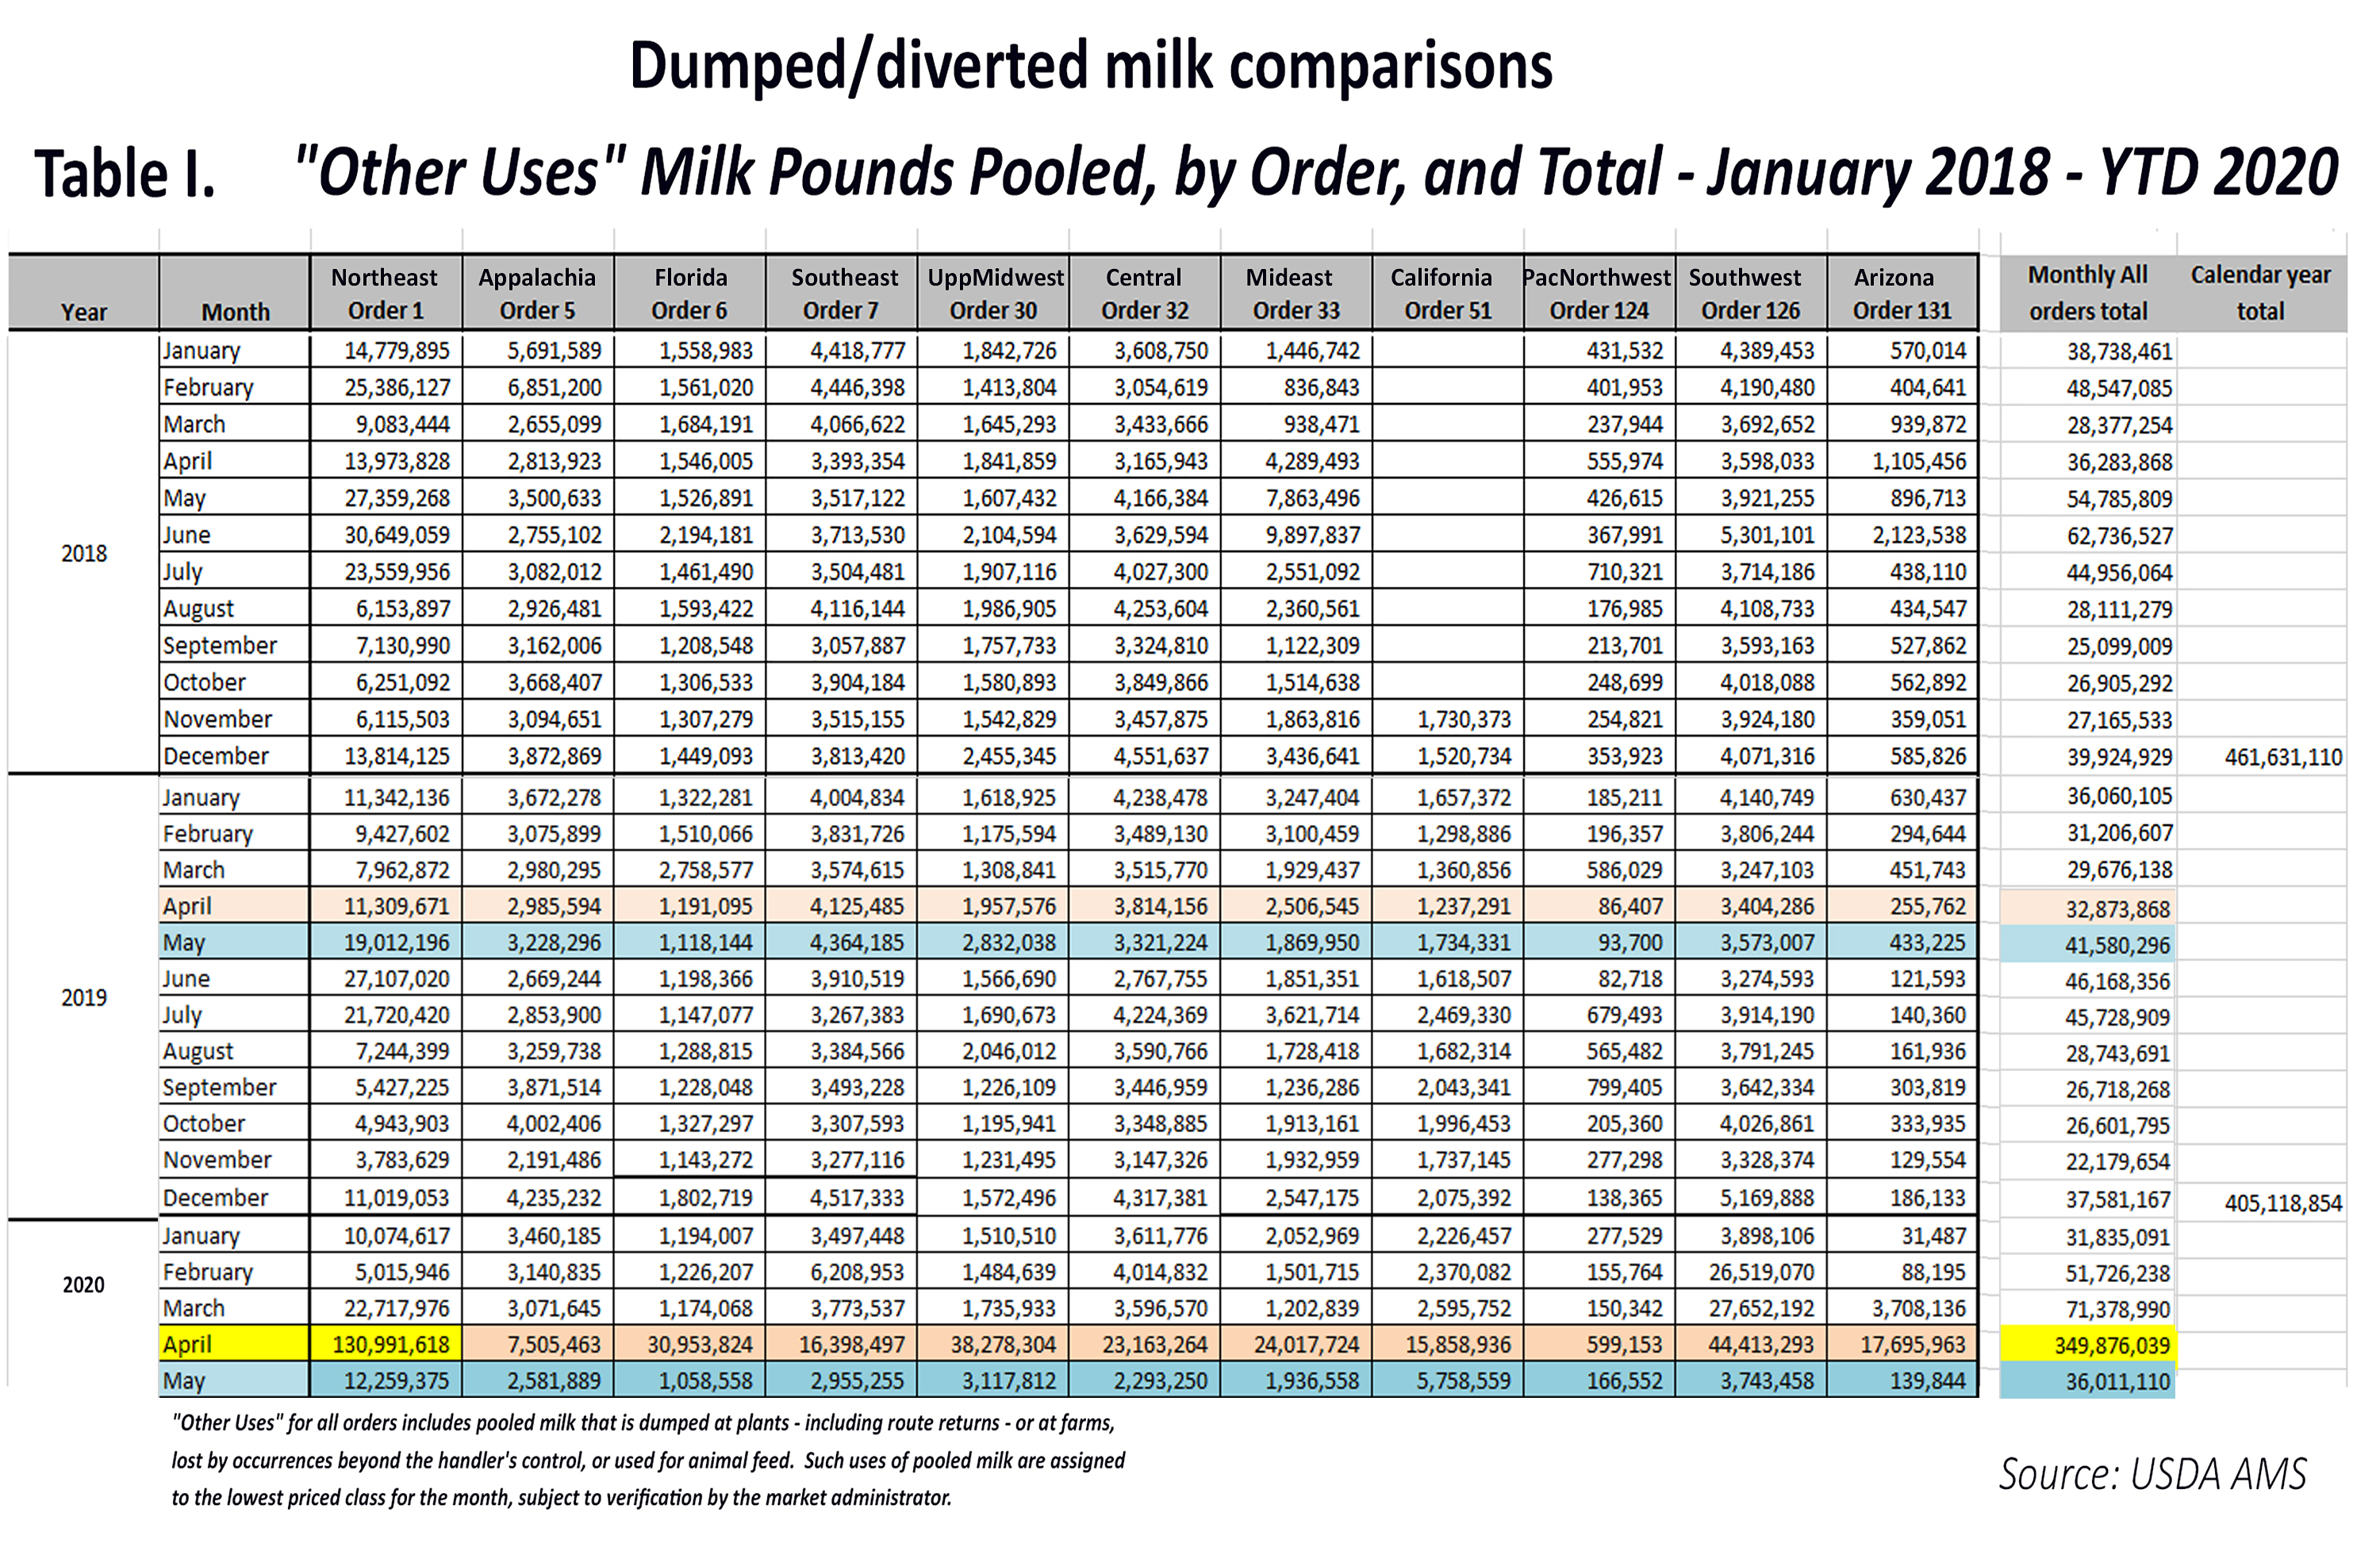
On the flip-side, for April, the Class I Mover was set at $16.64 based on market conditions (advance pricing factors) during the first two weeks of March, before the Covid-shutdown. The Class III price came to $13.07 for April based on the economic shutdown affecting foodservice demand while retailers had a tough time keeping dairy products in stock.

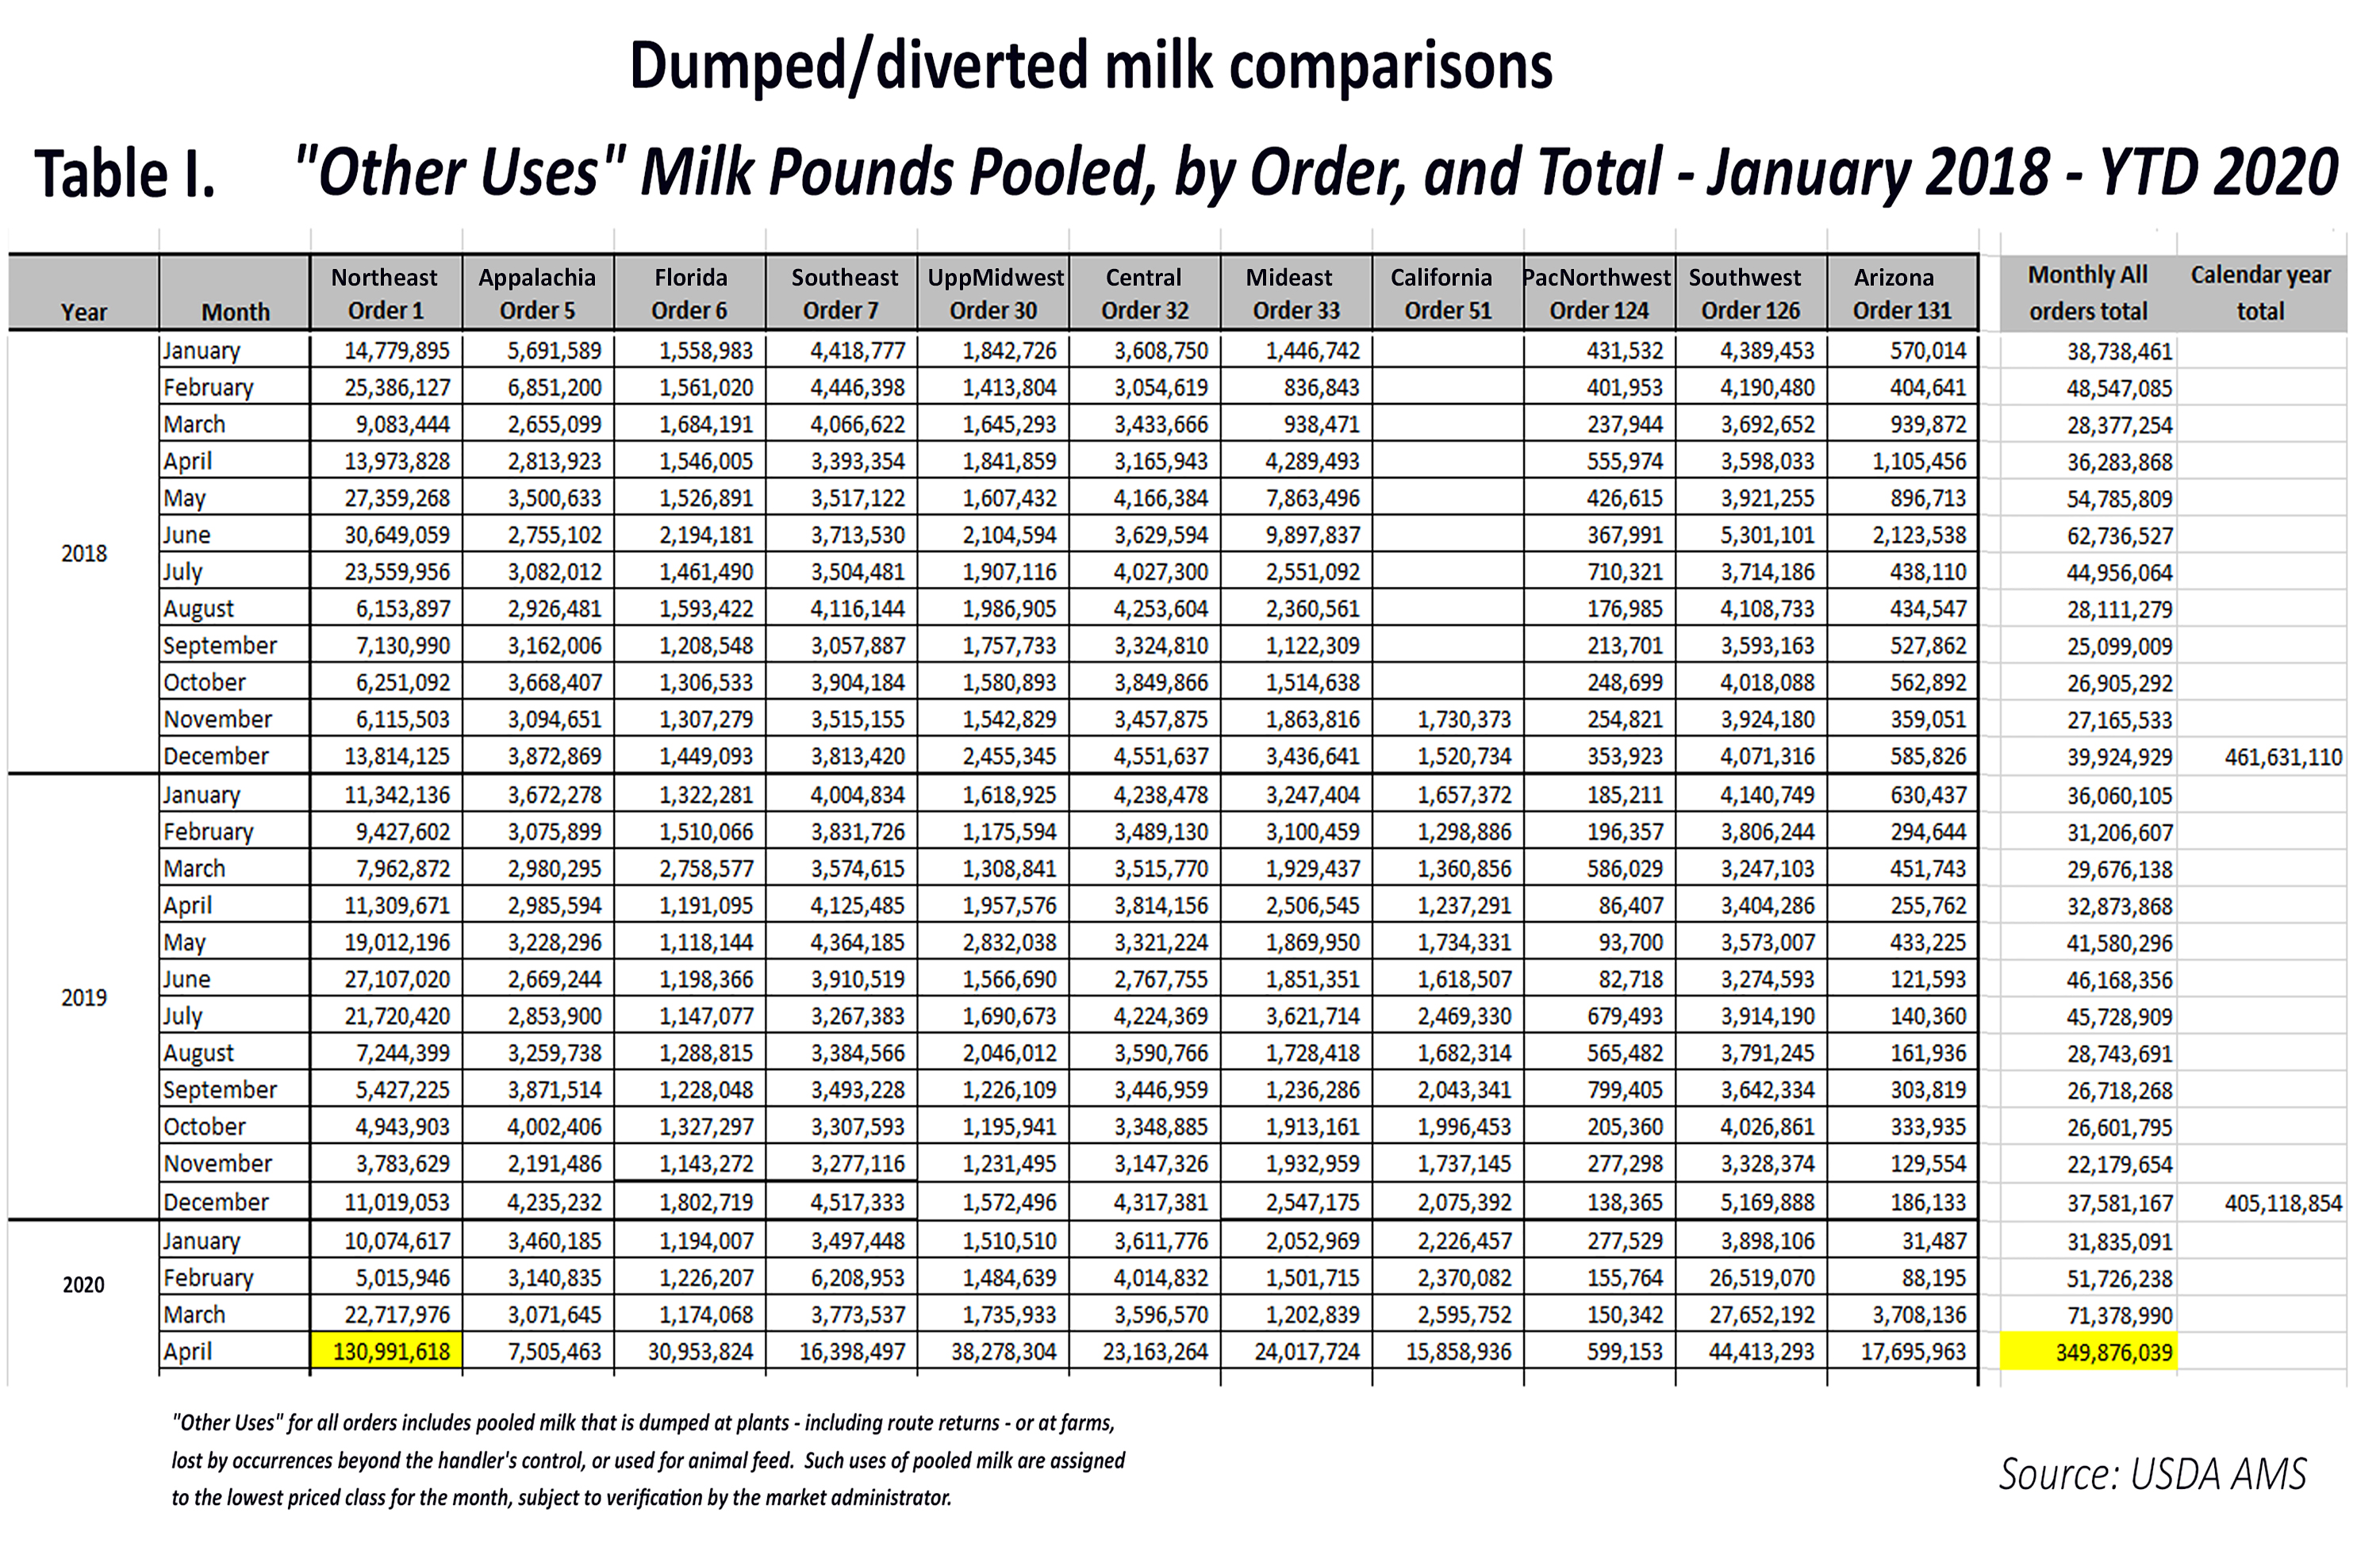
With Class I sales rising dramatically in April, and the Class I Mover sitting $3.57 higher than Class III and $5.24 higher than Class IV – there was incentive to pool everything, even the displaced milk as the industry adjusted to an unforeseeable event and the Class I Mover stood well above all other classes, especially the dumped milk that was pooled at Class IV value.

Thus, April set a record the amount of ‘other use / dumpage’ milk as 350 million pounds of displaced milk was pooled at the lowest class price across all FMMOs, nearly 10-times the amount that is normally pooled as ‘other use / dumpage’.

Now, that lag-time produces an opposite situation for June and July, and there is another wrinkle in the FMMO fabric – the new method for calculating the Class I Mover doubles the rub.

As a result of changes made in the 2018 Farm Bill, the Class I mover is now established by averaging Class III and Class IV and then adding 74 cents to that average. It used to be calculated using the higher of Class III or Class IV. In this case, that would have made a difference as Class III and IV have significantly diverged.

The calculation change for the Class I Mover was made to help processors hedge their future milk costs on the futures markets without having to guess which futures contract to use – Class III or IV. This was said to be something that would provide stability for Class I producers by stabilizing pricing for Class I processors. However, in these very unstable ‘whipsaw market’ times, the rub on producer milk checks will sting.

When it was proposed in 2017, American Farm Bureau Federation studied this method and documented little change to the net result for dairy producers when multiple years of pricing were averaged together and evaluated. In fact, when the new method went into place, there were several months where the average-plus-74-cents made the Class I Mover higher than it would have been under the old “higher of” method.

Not so in a volatile market with a time-lag involved.

These issues of negative PPD affect disproportionately the Federal Milk Marketing Orders (FMMOs) that have more Class I and IV utilization. FMMOs with small Class I utilization and large Class III utilization are relatively untouched as those blend prices would reflect mainly the much higher Class III cheese milk component value. But with depooling and reblending, those checks may also be impacted.

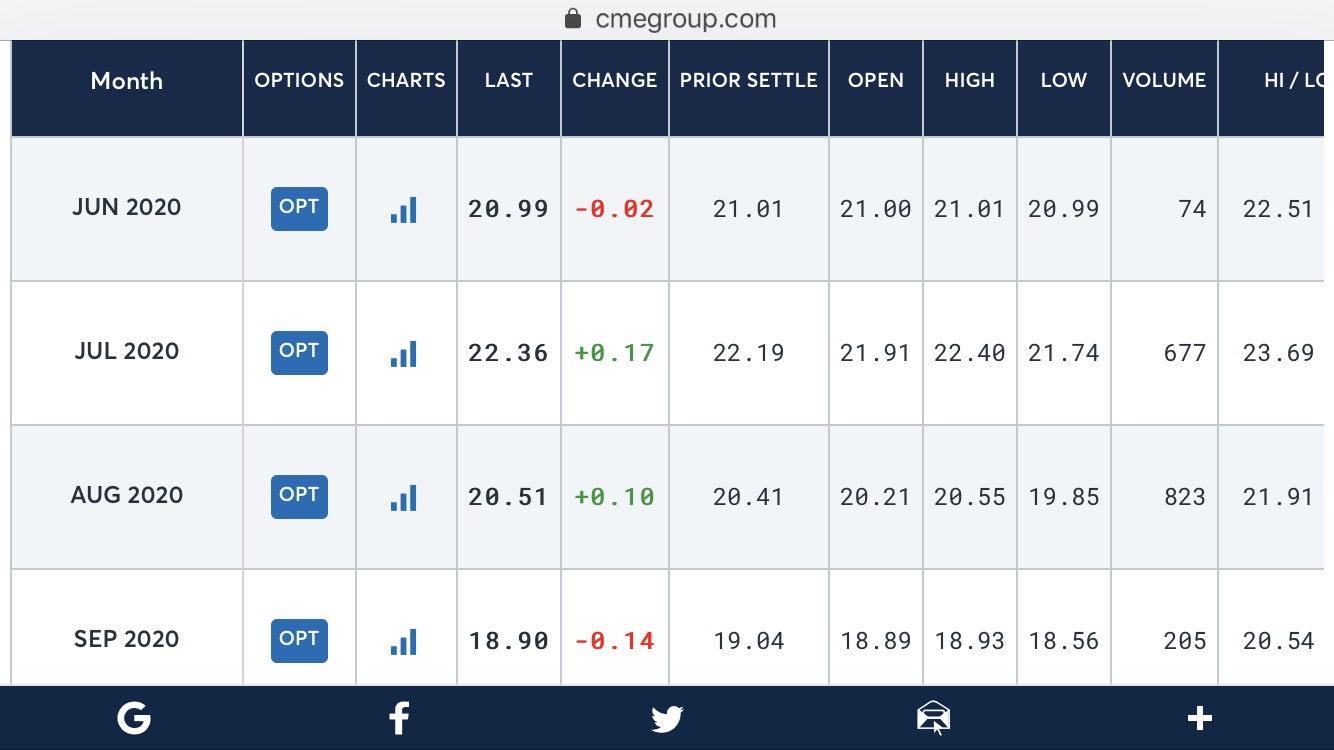
Looking ahead to July, the Class I Mover was already announced at $16.56, based on the advance pricing factors from the first two weeks of June. While July’s cheese trade is yet to be seen, the July Class III contract on the CME futures market stood at $22.85 at this writing on July 1st, which is $6.29 per cwt higher than the already set Class I Mover for July.

Even though the July Class I Mover stands $5.14 per cwt above the June Class I Mover, not even July’s Class I had the benefit of the full advance in June cheese trade because it was based on just the first two weeks of the June rally.

According to John Newton American Farm Bureau chief economist , there is currently, no mechanism to prevent negative PPDs. Newton writes in a recent ‘market intel’ piece:

“Historically, negative PPDs occur less than 15% of the time. Methods to prevent or mitigate negative PPDs  — such as eliminating the advanced pricing component, reconsidering the higher-of pricing formula (but with forward contracting of Class I milk), requiring mandatory pooling of milk in all Classes or consideration of decoupling the Class I milk from the price of manufactured milk products  – could be explored.”

UPDATE: Negative PPDs will be here for a while. Looking at these price spreads does not bode well for the continued inverted relationship between Class III and the Class I Mover — or what milk market analysts call “unorthodox pricing arrangements” — that will lead to continued negative PPDs and de-pooling of the higher Class III value milk from Federal Milk Marketing Order pools. In fact, the discussion of this issue has many twists and turns, a few questions have been forwarded to USDA Dairy Programs for some explanations, and June pooling data and blend price / PPD information is anticipated after the 14th.

Here’s the problem. Even when the ‘advanced pricing’ method gets caught up, the real problem is the way the Mover is now calculated. The 2018 Farm Bill made a huge change without a USDA administrative hearing and without a producer (bloc) vote.

Fluid milk processors wanted stability. They wanted to be able to forward-contract their milk costs and not have to deliberate over which futures contract to use — Class III or IV — since the Class I Mover used to be based on the “higher of” the two classes. Now, the futures markets are showing us that the spread between Class III and IV is going to be well above $1.48/cwt through November. That’s the significant number because the new Class I Mover method is calculated by averaging Class III and IV and adding 74 cents to that average. Once the III / IV spread hits $1.48/cwt, the 74 cents no
longer covers the difference.

Once we get to 2021, the spread narrows through those months, according to what the futures show now, but the Class III / IV spread looked reasonable and well within that $1.48/cwt for this current period back when viewed on the futures markets six months ago. If Congress can make a big change like this to Federal Order pricing formulas based on NMPF and IDFA agreeing on such while the Farm Bureau took a neutral position
— other than to review it and show it to be a wash when averaged over time — why can’t the Congress require a USDA National Hearing on milk pricing with Report to Congress?

Previous Farm Bills had such language, but the National Hearing “cost” was never funded. Now, the idea of a National Hearing on milk pricing, and a producer vote on Federal Orders, is seldom discussed. What we see from this Class I Mover example that a big changes can be made and implemented quite readily at the legislative level — no hearing or vote required — as long as the cooperative processors and proprietary processors agree on the change in advance. If milk is substantially depooled to keep higher end product values in hand, hopefully through the reblending process, plants and cooperatives will pay the marketplace value to dairy farmers, given the sacrifices producers have made to bring production into line with demand.

FYI: The Pennsylvania Milk Marketing Board (PMMB) successfully “decoupled” and stabilized the Class I milk price for two months by setting a Class I floor of $15 through the state’s over-order premium authority. The Federal Milk Marketing Orders were going to have a national hearing on this in April, but chose not to after economists and organizations in the Upper Midwest cheese region complained. The PMMB action was limited only to Pennsylvania, so for two months (the limit of the Order), when the Class I beverage milk price for milk produced, processed and sold in Pennsylvania fell below $15, the current over-order premium of around $1.00 per cwt was expanded automatically to bring the price back up to $15 for May-July 2020 for this very reason.

Trouble is, with the FMMOs not considering a similar move, this PA ‘premium’ only pertains to bottling plants paying milk suppliers for milk produced on PA farms (and they are free to take milk from other farms outside of PA). This price was built into the PA minimum retail milk price for May and June, but retailers, processors and cooperatives are not required to pass these state-mandated premium funds paid by PA consumers back to PA farms — unless the milk meets all three of these criteria: produced, processed and sold in Pennsylvania.

Author’s Opinion: There is one other thing worthy of consideration. A national hearing on milk pricing, period, to look at options, updates, simplification, transparency, daily reporting, producer voting, consolidation, transportation and deductions. Some grassroots groups have been asking for a national hearing with report to Congress for nearly 10 years as there is no other way for farmers to access the FMMO system run by market administrators, and they don’t even get a vote because cooperatives bloc-vote changes on behalf of their members. Previous Farm Bills included language for such a national hearing, but they were never conducted. At some point, the complexities at play here need to be evaluated from both regional and national perspectives in terms of “orderly marketing” and how farm viability and farm and food security in regions are affected and in terms of fulfilling the desire of many consumers wanting fresh, local milk.

-30-

U.S. milk production falls 1% in May, FMMOs pool 13% less milk

OtherUsePooledMilk_Table_I(withMay2020) (1)

Table 1 showing “other use / milk dumpage” totals by Federal Order includes data for May 2020. The month of May saw 13% less milk pooled on Federal Orders compared with a year ago, and 13% less milk in the “other use / dumpage” category compared with a year ago — down dramatically from the enormous 350 million pounds of “other use” milk pooled in April 2020.

States east of Mississippi cut production, west mainly grow

By Sherry Bunting, Farmshine, June 26, 2020

WASHINGTON, D.C. — As April’s dismal Covid-impacted dairy market spilled into May milk checks, the supply-side of the ship turned in May at the same time as demand was strengthened by dairy donations, retail demand and food-service re-stocking.

USDA Dairy Market News reports each week have signaled progressively tighter milk supplies heading into summer vs. stable to strong demand pushing spot loads to sell above class price in some areas.

In April, cooperatives across the country set base limits on member milk production for May until further notice. Some severely discounted any milk provided that was above 80 to 90% of a member farm’s March marketings. Many producers chose to leave this penalty milk out of the tank.

As these co-op ‘base’ programs went into effect in May, the impact is demonstrated in the USDA May Milk Production report, estimating  U.S. output at 18.8 billion pounds, which is 1.1% below year ago for May.

Cow numbers were down 11,000 compared with April, according to USDA, but still 37,000 more milk cows were estimated on farms compared with a year ago.

Nationally, milk output per cow dropped by one pound/cow/day in May compared with a year ago, the report stated.

In addition, Federal Order milk pooling totals and “other use / dumpage” data provided to Farmshine by USDA AMS by request, showed the total volume of milk pooled across all Federal Orders in May dropped like a rock to levels 13% below year ago.

Similarly, the volume pooled as “other use / dumpage” across all Federal Orders fell to levels 13% below year ago nationwide — from the enormous 350 million pounds recorded in April to 36 million pounds in May. (See Table 1.)

What is eyebrow-raising is how the numbers in these reports geographically arrange themselves.

In last Thursday’s Monthly Milk Production Report, the national drop in total output for May masks the fact that among the 24 top milk producing states listed individually in the report, those east of the Mississippi accounted for all of the production decline – plus balancing the accelerated western growth to get the U.S. total a significant 1% below year ago.

States east of the Mississippi saw large decreases in production, while in contrast, the growth states of Texas, Colorado, Idaho, Kansas, Arizona, South Dakota saw increases in production ranging from 1.4 to 9.7% above year ago.

East of the Mississippi, the Northeast milkshed really clamped down on production with Pennsylvania 3% below year ago, New York down 3.7%, and Vermont down 6.4% vs. year ago in May.

Further south, Virginia and Florida were unchanged from a year ago, while Georgia’s production fell 1.4%.

In the Mideast and Midwest, Michigan was off a fraction (0.4%), Minnesota down 1.9% and Wisconsin’s production fell by 3.1% vs. year ago. Indiana, Illinois and Iowa were down 1.7 to 2%. Ohio was the outlier, gaining 0.4% in production over year ago.

In the West, May production was larger than a year ago with South Dakota leading on a percentage basis producing a whopping 9.7% more milk compared with a year ago. Number five Texas grew by 1.9%. Number three Idaho grew by 4.6%, and Colorado grew by 4.8%. Arizona grew by 1.4%, and Kansas by 2.4%.

Three western states were key outliers as California dropped production 1.5% below year ago, Utah was down 3%, and New Mexico fell a whopping 7.2% below year ago. The Pacific Northwest had generally steady production with Oregon unchanged from a year ago and Washington down fractionally.

In Federal Order pooling, the volume pooled nationwide was down a whopping 13% from 15.1 billion pounds in May of 2019 to 13.2 billion pounds this May of 2020.

In the Northeast, total pooled pounds on Federal Order One for April and May of 2020 were essentially equal at 2.3 billion pounds each, but relative to year ago, this was a decline of 1.7% while production on farms in the region fell a whopping 4%, collectively. The difference likely came from elsewhere.

Meanwhile, the amount pooled as “other use / dumpage” in the Northeast Order One dropped abruptly from the enormous 131 million pounds in April to 12.3 million pounds in May, representing a 35% drop in “other use / dumpage” compared with a year ago.

Pooled milk classified as “other use / dumpage” in the Appalachian, Florida and Southeast Orders 5, 6 and 7, also dropped significantly in May compared with April’s large records. In fact “other use” milk in those three Orders fell to levels that were 19% (Appalachian), 9% (Florida) and 32% (Southeast) below year ago. At the same time, total pooled pounds for these three Orders – 5, 6 and 7 – were calculate below year ago in May by 1% in Order 5 (Appalachian), 2.5% less in Order 6 (Florida) and a significant drop of 11.7% less milk pooled compared with a year ago in Order 7 (Southeast).

In a sense, the pull back in production in the Northeast, Mid-Atlantic and Southeast regions, where April’s dumping had been so extreme, helped bring down total pooled pounds in those areas to rein-in the “other use” pounds as well.

Growth areas of the nation showed significantly less “other use / dumpage” pounds in May vs. April. However, in some of the Orders, such as the Southwest (Order 126) and Upper Midwest (Order 30), the “other use / dumpage” category was still above year ago levels by a modest margin, according to the USDA AMS figures.

As the dairy industry right-sizes itself after COVID-19 supply-disruptions that abruptly cut 30 to 40% from producer milk checks, it remains to be seen how states east of the Mississippi can regain their footing as western growth areas kept shipping more milk right on through — without missing a beat.

-30-

Industry, government follow grassroots donations lead, CFAP adds to dairy demand driving markets higher

By Sherry Bunting, Farmshine, June 26, 2020

WASHINGTON, D.C. – Government and industry dairy donations and record-setting CME cheese prices all got their starter fuel from grassroots dairy producers in what has become one of the good news stories of the COVID-19 era.

Today, USDA has systemized the donating through the Coronavirus Food Assistance Program (CFAP), and dairy processors, cooperatives and checkoff organizations have partnered with food banks and non-profits to extend the reach of efforts begun originally by generous dairy producers and their agribusiness partners supplying grateful consumers.

In April, when milk dumping was at its height, and stores had purchase-limits or sparse supplies of milk and dairy products, farmers and their agribusiness partners and communities went into immediate action. Examples of milk donation drive-through events began popping up in succession – just a fraction of them featured in the pages of Farmshine.

Also in April, farmer-funded Dairy Pricing Association (DPA) purchased 228,000 pounds of block cheddar, immediately moving the CME block cheese price from its $1/lb plummet to $1.20 (adding $1.00 to Class III milk values at the same time).

This DPA move, working with charities for distribution and a Midwest processor to turn their CME-style bulk purchase into consumer-packaged goods for donation, gave a green light to other cheese market participants. Within a week of that purchase and the initial 20-cent gain in blocks that followed, block cheese continued its climb to $1.80/lb, and the upward momentum has not stopped — fueled now by huge government purchases and food-service pipeline re-stocking.

On the heels of these grassroots efforts, dairy checkoff organizations began getting involved to work with their partners and “convene” the industry to do big donations in May.

Meanwhile, the U.S. Congress had passed the Coronavirus Food Assistance Program (CFAP) in April, with $3 billion of the $19 billion set aside for the Farmers to Families Food box purchases. But it was mid-May before USDA announced those first-round contract awards totaling $1.2 billion in fresh food — $317 million of it for fluid milk and dairy products – for distribution May 15 through June 30.

This week, USDA Secretary Sonny Perdue called the food box program a “trifecta, win-win-win”, pointing out how the program is getting farmers, processors and non-profits together to directly provide fresh food to people without burdening food banks with refrigerated inventory they aren’t prepared to handle.

DPA_CHEESE (1)

In April, when block cheddar was plummeting to $1.00/lb, the farmer-funded Dairy Pricing Association based in Wisconsin with member-contributors nationwide, purchased 228,000 pounds of block cheese to be cut-down for distribution by several charities. DPA Facebook photo

This was the model of grassroots groups and individuals on their own dime and time doing dairy donation drive-throughs, milk-drops, and whole milk gallon challenges from late March to the present. It was also the model of DPA, funded by voluntary dairy farmer milk check deductions, when DPA purchased the block cheese in April for cut-down and donation. Also in April, we saw the partnership initiated in Pennsylvania between 97 Milk and Blessings of Hope. They raised funds to buy local milk for donation to families in need.

As these grassroots efforts began having an impact, Midwest Dairy got approval from USDA in May to use checkoff funds to donate cheese, and UDIA of Michigan was allowed to provide minimal funding to food banks for “handling costs” associated with receiving cheese donated in May by DFA.

Now, with USDA systemizing that smart approach — started by grassroots efforts — the department stated in a news release that as of June 23, its CFAP Farmers to Families Food Box Program had delivered more than 20 million boxes of fresh food, including milk and dairy products, to families impacted by COVID-19.

The initial round of USDA CFAP contracts ends on June 30. But this week, USDA announced it will extend “well-performing” first-round contracts for similar amounts in a second-round from July 1 through August 31 to total an additional $1.16 billion.

The share of this second-round to be devoted to fluid milk and dairy purchases was not specified in the USDA announcement. One thing USDA did note is that even though most of the second-round dollars will be spent with “selected” current contract awardees, a few new contracts may be awarded to previous applicants that had been passed over due to technical errors or to provide boxes in areas identified as “underserved.”

Throughout the USDA CFAP food box delivery process, regional dairy checkoff organizations have been involved as “facilitators.”

Week after week, Farmshine has received press releases from dairy checkoff organizations, and there have been numerous social media posts, about the CFAP milk and dairy box donations. Regional checkoff organizations say they are working with processors, cooperatives and non-profits — in conjunction with the USDA CFAP food box program — and that area dairy farmers are involved as volunteers to hand out the boxes.

According to National Dairy Council president Barb O’Brien, dairy checkoff organizations began “convening the industry” before CFAP.

“We have leveraged the checkoff’s unique ability to convene companies from across the value chain to identify a number of ways to redistribute excess milk and other dairy products to families facing food insecurity,” writes O’Brien in an email response to Farmshine recently.

In a specific cheese example she had mentioned in a media call described as block cheese being purchased and cut into consumer size portions, our inquiry for details was met with this response:

“In response to lost food-service markets and dairy farmers being asked to dispose of milk, we’ve worked to connect coops to partners that donated processing capacity for any excess milk available for food banks,” O’Brien wrote. “Many other dairy companies — such as the example I gave from DFA of cheese donations in Michigan — provided massive quantities of dairy products to food banks before the USDA Farmers to Families Food Box Program was even put into place. Moving forward, it will be important that we continue working together as an industry to target the greatest needs and find long-term solutions to our nation’s hunger crisis.”

O’Brien cites DMI’s “long-time partner” Feeding America and other relationships with local food banks and pantries. Former Ag Secretary Tom Vilsack, now a top dairy checkoff executive with DMI, sits on the Feeding America board of directors.

O’Brien also noted in her response that dairy checkoff “counseled industry partners and others on how to direct dairy products toward the greatest needs.”

She reports that, “This widescale approach enabled us to pinpoint some of the biggest barriers in getting excess dairy products to hungry families during the pandemic” and to “rapidly initiate an industry response.”

As communities began doing their own grassroots efforts through the generosity of dairy farmers, agribusiness and individuals purchasing milk or contributing milk for dairy donations in the early days of the COVID-19 ‘stay-at-home’ orders, checkoff organizations took note and began to look at what they could do in terms of refrigeration equipment and setting up refrigeration trucks for industry and governmental efforts.

LancMilkGiveaway_5378

Grassroots whole milk donation events like this one just outside of Lancaster, Pa. in May, have been providing whole nutrition to families across the state and region since the height of COVID-19 ‘stay-at-home’ orders in April.  Photo by Michelle Kunjappu

While many of the grassroots-organized milk donations were comprised of whole milk purchases vs. low-fat milk, this week marked the first time a checkoff news release showed red-cap whole milk gallons or even referenced whole milk in their facilitation of USDA CFAP box deliveries. This is another win led by early grassroots efforts.

ADA Northeast (ADANE), for example, indicated in a press release this week that 200,000 gallons of milk will have been handed out in the Northeast / Mid-Atlantic region by the time June Dairy Month ends. The release stated that 20,000 gallons would be donated this week, alone, from DFA, Upstate Niagara and Schneider’s Dairy to be given out in New York and Pennsylvania through the Nourish New York state funds and CFAP food box federal funds.

ADANE_wholemilk (1)

For the first time among the many news releases sent by ADA Northeast (ADANE) touting checkoff ‘facilitation’ of fluid milk and dairy donations, whole milk is in the box! Here, dairy farmer Joel Riehlman of Fabius, N.Y., and a 4-H member, hand out whole milk in mid-June at a Nourish New York and USDA CFAP Farmers to Families Food Box donation drop in Syracuse. Photo provided by ADANE

In a recent Watertown, New York drop point for these donations, ADANE board member Peggy Murray of Murcrest Farm, Copenhagen, N.Y. volunteered, and she noted in the ADANE press release that, “It was heartwarming to see their gratitude – especially for the whole milk — and to know that people really want the products that we produce on the farm.”

This has been the experience of so many farmers and ag community members involved in the grassroots distributions, as well as the industry and governmental distributions, because each event affirms that consumers love milk and dairy products, especially whole milk, and that they want to support local farms — as evidenced by their comments and long car-lines of families eager to receive these products. In some cases, recipients gave money asking it be put toward more drive-through dairy events.

In the Southeast and Midwest, CFAP contract recipients Borden and Prairie Farms have also been visible this month with Dairy Alliance and Midwest Dairy checkoff organizations often as partners, along with several state dairy producer group members joining in as volunteers and location coordinators.

Overall, the CFAP food boxes have been well-received. The program was designed by USDA to give farmers and food providers a presence within their communities, working with local food banks and non-profits without creating inventory hardships. In this way, USDA has taken what local communities were doing at the grassroots level — on their own dime and time — and systemized it with federal funds and contracts.

While dairy’s share has not been specified in USDA’s announcement of the second round of $1.16 billion in fresh food purchases in the contract extensions through August 31, it is believed fluid milk and dairy purchases will be similar to the first-round total of $317 million because several non-profits indicate they will be supplied with all their milk and dairy needs through the USDA until at least August 31.

This includes Blessings of Hope, which had partnered with 97 Milk in April, and raised over $50,000 for purchasing and/or processing local milk for families they serve in Pennsylvania.

Farms in southeast and southcentral Pennsylvania that were wanting to donate “over-base” milk for this 97 Milk / Blessings of Hope program will have to wait until after August 31, when the USDA CFAP food box program is set to end. It is possible that the CFAP program may again be extended until all $3 billion in food box funds are exhausted.

DPA_graph (1)

When Dairy Pricing Association (DPA) first ran an ad in the Cheese Reporter in early April looking for 200,000 pounds of USDA-graded cheddar cheese less than 30 days of age, the calls they received could not fill the order. By requesting USDA-graded cheese, the delay in their eventual purchase of 228,000 pounds showed a void in supplies that led to the initial turnaround in the plummeting block cheese price on the CME, which fueled the advances in manufacturing milk value. CME cheese prices drive Class III milk futures, which have risen rapidly since the DPA purchase bridged the gap in April. Current market strength has been extended through the large USDA food box program demand occurring at the same time as the re-opening of the food-service sector. DPA Facebook image

A positive outcome for farmers from all of these efforts — now extended by these large government purchases — is the real impact they are having in helping drive dairy markets higher since that first farmer-funded DPA purchase of block cheddar in April turned the CME away from its $1.00/lb record-low plummet.

Block cheese is traded every day around noon on the CME spot auction, and the price has set several new record-highs in June, including the most recent record-highs of $2.70/lb on Monday, June 22 and $2.81/lb on Tuesday, June 23.

This rally has pushed Class III milk futures into new contract highs for June, July, and August, while adding strength across the board.

In CME futures trading Monday (June 22) the June Class III milk contract hit $21, up $9 from the USDA-announced May Class III price of $12.14. July’s contract topped at $22.19, and August edged into the $20s. Monday’s Class III milk futures averaged $17.98 for the next 12 months, and Tuesday’s futures trading held most of that level, even adding to the July contract.

There is a supply side to this scenario also. See the related article on USDA milk statistics, pooling, production and dumping.

Trade sentiment is mixed on how long the upward momentum in dairy markets can last.

On the one hand, cheese prices are being driven by the combination of USDA CFAP purchases now continuing through August, re-stocking of food-service pipelines as the country re-opens, and the USDA Dairy Market News reports of consumer buying strength shown in strong pizza sales throughout the Covid period, and stable to strong retail sales meeting tighter supplies of milk and cream.

On the other hand, some experts warn of weakness ahead as these record-setting prices may prompt milk production expansion by fall when demand may wane after the USDA CFAP food box purchases end and food-service pipelines are re-stocked.

Much of the future will depend on how the re-opening of America goes for families, the food-service sector, schools, sports, and the economy at-large.

-30-

Eye on markets as reined-in supply vs. strong demand drive dairy higher

img_1123rgb 3

By Sherry Bunting

Trade sentiment is mixed on how long the upward momentum in dairy markets can last as producers wait for these higher levels to land in their milk checks.

On one hand, USDA Dairy Market News reports strong pizza sales, stable to strong retail sales, and government purchases all stoking demand against reined-in supply. On the other hand, some analysts see weakness ahead as higher prices may prompt milk expansion by fall when demand may wane after CFAP food box purchases end and food-service pipelines are re-stocked. Much will depend on how the economic re-opening goes for families and food-service, as well as what happens with schools and sports. Experts suggest producers evaluate their risk management tools while markets present positive margins in a tumultuous time.

To-date, the USDA Coronavirus Food Assistance Program (CFAP) Farmers to Families Food Box Program has delivered 18.5 million boxes. The first round of May 15-June 30 fresh food purchases totaled $1.2 billion, including $317 million for milk and dairy products. Now USDA is poised to announce a second round of $1.16 billion for July 15-Aug. 30, of which dairy’s share has not yet been specified.

Also, as of June 22, USDA paid $895 million in CFAP dairy farm payments, and a total of 15,222 dairy producers (about half) have applied. The dairy payment formula equates to $6.20 per hundredweight on Q1 milk (including dumped milk). CFAP enrollment continues through August 28, 2020.

Meanwhile, milk futures continued their multi-week march higher on the heels of record-setting CME block-cheese prices through June, pegged at $2.70/lb Monday, June 22 and then $2.81/lb Tues., June 23. Barrels shared the advance, but were a record 44-cent spread behind the block trade at $2.37/lb.

June’s Class III milk contract hit $21 Monday, up $9 from the USDA-announced May Class III price of $12.14. July’s contract topped at $22.19, and August edged into the $20s. Monday’s Class III milk futures averaged $17.98 for the next 12 months — up 69 cents from two weeks ago.

Part of the extent of Monday’s advance is attributed to new rules when higher trading surpasses the 75-cent limit, as happened Friday, the limit doubles for the next trading day, allowing more speculative activity up or down. But Monday’s spot cheese increase shored-up the gains, while after-hours trading hinted a 20-cent pull-back before another spot cheese market gain Tuesday noon narrowed the dip in fall milk futures. At mid-day Tuesday, summer 2020 front-months were another potential nickel or dime in the green, and penny to nickel gains were applied to 2021 Class III contracts.

IMG_8670

Screenshot of June-Sept. Class III milk futures trading at Noon CDT Tuesday, June 23 — just after the spot cheese auction on the CME in Chicago saw 40-lb block cheddar trade at yet another record high of $2.81/lb with 500-lb barrels also higher at $2.36/lb — behind blocks by a new record-setting 45-cent spread.

New block cheese futures at the CME were launched in 2020, helping processors manage the risk of the wide spreads between 40-lb block and 500-lb barrel cheddar that broke records in 2019, setting new record spreads again this week.

Class IV milk futures gains into this week have been less stellar as butter had melted off a previous advance, but firmed up late last week, then pegged a 2-penny loss at $1.81/lb Tuesday. Spot powder strengthened last week in active trade after the biweekly Global Dairy Trade auction index rose 1.9%. The first two days this week, the Grade A nonfat dry milk spot price remained pegged at $1.03/lb with just two loads changing hands on the CME.

The awaited June 22 USDA Cold Storage report confirmed that accumulating cheese moved to food-service with a seasonally-unusual and record-large natural cheese inventory pull-out for the month of May. Despite this inventory pull, cheese stocks remain 5% above year ago, and butter stocks are up 21% vs. year ago. Inventory is apparently not as negative to markets as it was pre-Covid due to the retail shortages experienced in April during the height of ‘stay-at-home’ orders. Some companies report wanting to keep more inventory instead of operating ‘hand-to-mouth.’

On the farm side, USDA confirmed 1.1% less milk was produced in May vs. year ago. USDA data also showed 13% less milk was pooled on Federal Orders vs. year ago — abruptly reducing the pooling of dumped and diverted milk. At 36 million pounds, the volume of milk pooled as “other use / dumpage” in May was a fraction of April’s 350 million pounds of “other use / dumpage” milk pooled.

DumpedMilk_Table(withMay2020)

Northeast bore brunt of huge milk dumping in April

USDA data: 350 million pounds dumped, diverted nationwide. Over one-third of it pooled on Northeast Federal Order. May data show improvement

DumpedMilk_Table_I (1)

By Sherry Bunting, Farmshine, June 19, 2020

BROWNSTOWN, Pa. – The picture for May has improved as “other use” milk totals pooled across all Federal Orders came back in line, and total “all use” pooled volume also receded.

But… Remember April? The figures are in, and they are ugly.

April was the month where the COVID-19 shutdown was at its height. Everyone was bracing to flatten the curve. Retail dairy case shelves were often empty or sparse, and many stores had two-item limits on milk, butter, even cheese, yogurt and sour cream.

The milk dumping that had begun during the last weekend of March ramped up in April. By the time final milk checks were received for April milk, producers were dismayed to find big deductions, almost $2 per hundredweight in some cases, as COVID-19 line items on top of additional marketing adjustments, reduced quality premiums, and the like. Of course, hauling was also a bigger deduction, some being told they were charged destination hauling on dumped milk that never left the farm! This, despite the fact that fuel prices fell like milk due in part to COVID.

What do the USDA data tell us?

According to “other use” milk pooling data supplied by USDA AMS Dairy Programs by request, milk pounds pooled at minimum class as “other use, milk dumpage and animal feed” for all Federal Orders totaled almost 350 million pounds in April (349.9 million pounds to be exact). That was 2.57% of the total pounds of milk pooled across all Federal Orders in April, according to USDA AMS data, and it was 1.8% of total U.S. April milk production (pooled or unpooled) as reported by USDA in its Monthly Milk Production Report.

Year-to-date milk dumpage and diversion by Federal Order and total combined — as well as for 2018 and 2019 — are shown graphically in Table 1.

While March saw the milk volume classified as “other use” grow by 142% compared with year ago at 71.3 million pounds. The volume of diverted milk in this “other use” category for April 2020 was absolutely enormous at 349.9 million pounds – up 960% from a year ago.

In fact, the Northeast Milk Marketing Area, Federal Order One, as usual, was dumping-zone-central as more than one-third (37.4%) of all the milk pooled as “other use” in the U.S. showed up in the Northeast pool as minimum class “other use.”

In other words, 37.4% of diverted milk in the entire U.S. was dumped on farms or at plants or otherwise diverted as “other use” including animal feed in the Northeast Milk Marketing Area.

The Northeast Order pooled 131 million pounds of “other use” milk in April – up more than 1000% from the 11.3 million pounds of “other use” milk in April 2019 and the 13.6 million pounds in April 2018. Table 1 shows this enormous amount dwarfing other months, other years and other Orders quite plainly as highlighted in yellow.

This means that the Northeast Order pooled 4.4 million pounds, or 80 loads, of dumped or diverted milk every single day for 30 days in April.

The second largest pooling of “other use” milk was the Southwest Order 126 at 44.4 million pounds, up 1200 percent from 3.4 million pounds a year ago (April 2019) and 3.6 million pounds in April of 2018.

Third largest was the Upper Midwest Order 30, with 38.3 million pounds of “other use” milk pooled, up 1855% from the 1.95 million pounds a year ago (April 2019) and 1.84 million pounds in April of 2018.

Fourth largest was the Florida Order 6, with 31 million pounds of “other use” milk pooled, up 1520% compared with 1.2 million pounds a year ago (April 2019) and 1.5 million pounds in April of 2018.

The Mideast Order 33 came in fifth with 24 million pounds of “other use” milk pooled, up 860% from 2.5 million pounds a year ago (April 2019) and up 460% from the 4.28 million pounds in April of 2018.

USDA AMS confirms that milk purchased by USDA for feeding programs, including the extra Section 32 purchases and new Farmers to Families Food Box milk purchases are included in receipts and utilization as the class of product purchased. This means when fluid milk is purchased with these government funds and then donated to families in need, the fluid milk is to be reported as Class I.

This is also true of milk purchases by businesses, individuals and fundraisers that then use these purchases as donations to families in need or the public at large. These sales also contribute to Class I utilization.

However, when milk destined for dumping or over-base milk kept aside is processed and packaged and donated outside of these marketing channels, it can be considered “other use”.

The equally disappointing news in April was that despite the fact that retail sales data show packaged milk sales to be running about 5% ahead of year ago for April and May, the USDA Class I utilization total for April across all Federal Orders was fell by 9.7% in April compared with March to 3.6 million pounds compared with 4.0 million pounds of milk utilized as Class I in March across all Federal Order pool data. This is down 3.3% from Class I utilization pounds, nationwide, a year ago.

As noted, the milk dumping situation in May improved compared with March and April as “other use” milk totals pooled across all Federal Orders came back in line, and were actually down 13% from a year ago at 36 million pounds – roughly 10% of what was discarded the month prior in April. Total “all use” pooled volume also receded as cooperative base programs kicked in. Government purchases for the CFAP Farmers to Families Food Box Program also began pulling milk the second half of May and will continue through June.

However, keep in mind, the cooperative base programs do cause some milk dumping of non-pooled pounds on farms that choose to only ship what they are paid a price for. Some are feeding cows and other livestock with extra milk. Others are finding local processors to bottle it so they can do community whole milk donations. Some may even be fertilizing fields with extra milk.

It isn’t easy for many to cut by 10 to 20% from March production in May – as many have been asked to do to avoid salvage value and stiff penalties for the “extra”.

Seasonal style dairies especially have their work cut out for them, and it appears the true seasonal dairies with little or no milk production in the first quarter of the year won’t be eligible for CFAP payments as 6 months of payment calculations are being based on production for the first 3 months of the year.

To be continued in next week’s Farmshine with May data on total pooled pounds, Class utilization trends, “other use” data, and other information for the month as well as year-to-date for all FMMOs and individually.

-30-

Lancaster event blesses farms and families, 9,296 gal. of whole milk given

Author’s note: There are so many examples of farmers and communities coming together throughout the U.S. to bless one another with nourishment for body and soul during this pandemic. Here is another great story about a grassroots whole milk giveaway in Lancaster, Pa.

By Sherry Bunting, Farmshine, June 5, 2020 (photos by Michelle Kunjappu)

LANCASTER, Pa. — It poured raindrops and milk blessings Saturday, May 22 as the wet weather was no obstacle for volunteers working the Lancaster Whole Milk Giveaway Community Support Event.

Local farmers, businesses, community volunteers — along with Pequea Township Police, New Danville Fire Police, Pioneer Milk Producers Cooperative, Hy-Point Farms Dairy, Clover Farms Dairy and Pennsylvania Miss Agriculture USA — all came together to bless thousands of families in true farm-to-city fashion.

They gave away 9,296 gallons of fresh whole milk during a scheduled five-hour drive-through distribution that began early when cars started lining up three hours ahead of time.

LancMilkGiveaway_5318

CK Manufacturing hosted the event in their parking lot just south of Lancaster in Pequea Township, Pennsylvania, where two refrigerated trailers of milk were parked to serve two lines of cars flowing through in two directions.

Organizers said the event was planned to “demonstrate God’s love in support of those in need in our local communities and on our farms in this time of hardship.”

“It is just amazing how much support is out there for the farming community and how many people are in need and want whole milk,” says David Miller about the event he was instrumental in organizing with the help of others. “I had to do something. I had this urge to make something like this happen, and it is unbelievable how it all worked out.”

A member of Lancaster County’s Amish community, Miller works for CK Manufacturing, maker of dairy replacement stalls and other cattle equipment. One of the first people Miller got involved in the idea was the company’s owner Chris King.

“Chris was very supportive, so we pushed forward with it. We wanted to target this to benefit people living in Lancaster city, and our location just outside of town was perfect for that,” Miller relates. “Chris got the Pequea Township Police and New Danville Fire Police involved because we have a lot of traffic on this road, and we wanted to be prepared and to do it right. They were all very supportive and encouraging of what we were doing.”

WholeMilkGiveaway5502

Miller also got in touch with Amos Zimmerman of Dairy Pricing Association. “Amos mentioned it on Dairy Pricing’s Monday night call,” says Miller. “As people were hearing about it, many were asking how they could help. It’s unbelievable how fast it came together and how much support is out there to do this.”

They set up a donation account, so other local businesses and individuals could contribute to help purchase the milk. And a nice surprise on the day of the event, some families gave money to pay-forward to help fund future milk donation events.

LancMilkGiveaway_5477

Initially, Miller contacted Pioneer Milk Producers Cooperative, a relatively new cooperative made up of mostly Lancaster and Chester County dairy producers. He says they were glad to provide a load of milk, and they had Hy-Point in Delaware bottle it.

The event was advertised in the local paper and on social media, as well as being publicized on the 97 Milk facebook page and twitter.

When the views and comments on social media began growing, Miller realized 5000 gallons would not be enough, so 4000 additional gallons were ordered from Clover Farms Dairy in Reading, Pa.

LancMilkGiveaway_5439

“We knew a week ahead that one load was not going to reach around because they were telling us it had over 25,000 views on facebook, which was rather dumbfounding to me,” Miller reports. “Hy-Point couldn’t do a second load that day, so we went to Clover because that’s local milk too.”

LancMilkGiveaway_5468

Miller says he was moved to initiate the planning for a milk purchase and giveaway because he knew a lot of milk was being dumped and that people were out of work. He had been watching what others were doing, and he spoke with Mike Sensenig of Sensenig’s Feed Mill for some ideas from their drive-through in April.

“I told everyone from the beginning that if we do this, it’s got to be local whole milk,” Miller says. Those two criteria were also important to the families who came.

Zimmerman reports that many people driving through asked if the milk was whole milk and if it was local. “It felt good to answer ‘yes’ to both questions,” he confirms.

LancMilkGiveaway_5307

Miller wanted to provide education about whole milk at the same time, and he knew about 97 Milk and the whole milk flyers Sensenigs had handed out. So, he reached out to GN Hursh, president of 97 Milk LLC board. 97 Milk is a nationwide grassroots effort run by volunteers and donations and founded by dairy farmers in Lancaster and neighboring counties with other areas interested in starting chapters.

Hursh put up some banners and brought handouts.

(In fact, 97 Milk recently revamped the website at 97milk.com  to include a new online store where educational materials can be directly purchased, along with other promotional items.)

WholeMilkGiveaway5416

Among the volunteers for the Lancaster event were Cassidy Kuhl, Pa. Mrs. Agriculture USA and her sister-in-law Rebecca, Pa. Teen Miss Agriculture USA. They were all smiles handing out gallons and educational materials.

“This was a great opportunity to be a part of because this is my community we were serving,” said Cassidy. “I was excited to see so many people come for milk and take extra to pass on to their friends, families and neighbors. It felt good.”

From the comments on facebook, it is obvious this meant a lot to the community as well.

LancMilkGiveaway_5335

“There were smiles all day long, and some neat stories about people coming in and getting decent quantities to go out and deliver whole milk to people in the inner city – reaching out to people beyond what we were doing,” adds Miller.

WholeMilkGiveaway5312

Truly representing the Lancaster community, organizers said the volunteers who showed up to hand out milk included about half from the Amish community and half from the ‘English’ community.

LancMilkGiveaway_5329

The help of the fire police was appreciated as the traffic flowed steadily all afternoon and into the evening, and the timing was perfect for the volume of milk. Volunteers report that the last gallon was given right at 7:00 p.m.

To get this together within less than two weeks, and to see this kind of local response has many calling the event an answered prayer, a true farm-city event and a real blessing shared by all in the midst of very challenging times.

-30-