
U.S. All-Milk $20.50, DMC $12.41
The USDA NASS Agricultural Prices report calculated a U.S. All-Milk price of $20.50 for July, up $2.40 from the June All-Milk price of $18.10 and $1.80 higher than a year ago. With this as the pegged U.S. average milk price, the July Dairy Margin Coverage (DMC) margin was calculated at $12.41, also $2.40 higher than June and $2.91 above the highest level of DMC coverage.
These July USDA numbers are welcome, but tell half the story.
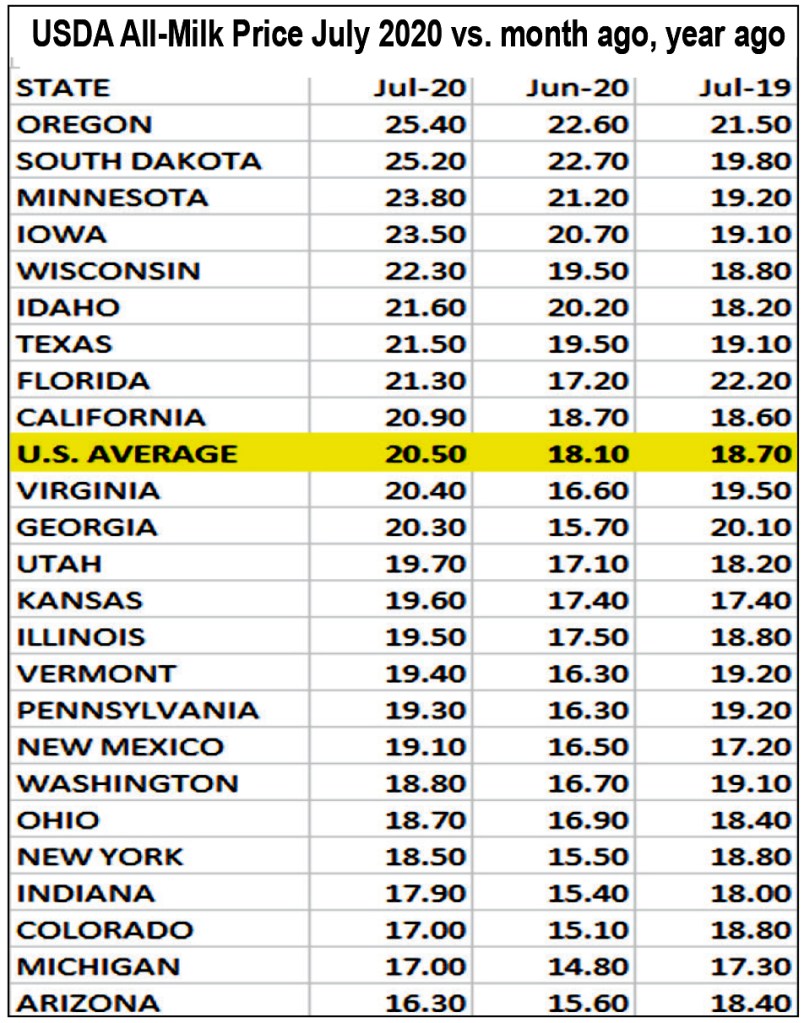
The chart above lists the July 2020 USDA All-Milk price calculations for the top 24 milk-producing states in descending order with the U.S. average highlighted.
What stands out is the range from top to bottom. It has doubled from a more typical $3 to $4 spread to an $8 to $9 spread in June and July 2020. This is the widest we could find on record — with the U.S. average All-Milk price standing fully $4.00 higher than the state with the lowest All-Milk price in June and July 2020 compared with a more typical $1.50 difference a year ago.
A year ago, 7 of the 24 USDA milk production report states were below the U.S. average, a more typical occurrence. In June and July 2020, 15 of the 24 states were below the U.S. average All-Milk price.
On the up-side of the chart, we see that the highest states are $4 to $5 above the U.S. average, when normally that difference would be less than $3.00.
Actual mailbox price calculations won’t be released for five months, and when they are released, the range will likely be even wider from top to bottom than the $8 to $9 spread we see in All-Milk prices the past two months.
Unofficial milk check surveys of volunteered data from dairy producers in six federal orders for June and July show a whopping $14.00 per hundredweight range from top to bottom in gross pay and mailbox net pay.
As for the August All-Milk price, USDA won’t report that until the end of September. We will get Federal Order uniform price announcements for payment of August milk in mid-September. On Sept. 2, USDA did announce August Class and Component prices with Class III (cheese) milk at $19.77, which is $7.24 above the Class IV (butter / powder) price of $12.53. Class II was announced at $13.27. The August protein price was pegged at $4.44 and butterfat $1.63.
Margin ‘equity’ affected by wide spreads
For dairy producers enrolled in DMC — but in regions receiving the lower end of these All-Milk prices in June and July — the safety net program thresholds were not met by the ‘average’ margin even as that margin did not reflect their reality. For dairy producers using a variety of risk management options, new challenges have also emerged in the current market dynamic due to de-pooling of milk making negative producer price differentials (PPD) more negative in some areas.
While the spread between Class III and IV looked like it would narrow this fall, an upswing in Class III futures for October through December contracts this week — and lackluster performance on Class IV — show spreads in manufacturing class values could widen again, which tends to be an incentive for de-pooling in Federal Orders where a mix of products, including Class I beverage milk, are produced.
There are tools to navigate these challenges, say the experts, but a deeper concern is how closely the divergence can be related to the product mix of the CFAP food box government purchase rounds — and changes in U.S. dairy imports.
As the third round of CFAP Farmers to Families Food Box purchases are underway for fourth quarter 2020 delivery, USDA this time set parameters for food box dairy products to be more representative of Class II and IV products, along with the Class III cheese products. In addition, the third round defines the fluid milk in several solicitations to be 2% or whole milk. This will also help with fat value that has plummeted this year.
Still, the majority of government food box purchases continue to be cheese, and the markets responded last week as spot cheddar rallied back above $2.
CME spot cheese pushes higher — past $2/lb, butter and powder steady-ish
Cheese markets gained more than a dime in CME spot trade on Wed., Sept. 2 with 40 lb blocks pegged at $1.91/lb. From there, the market continued to move higher at $2.12 by Friday, Sept. 4, up 30 cents from the previous Friday with zero loads trading; 500-lb barrels were pegged at $1.70/lb, up 27 cents with a single load trading.
Spot butter managed to gain through midweek before losing some of that advance at the end of the week. On Friday, Sept. 4, a whopping 12 loads were traded on the CME spot market with the price pegged at $1.4925/lb — up a nickel from the previous Friday. Nonfat dry milk on the CME spot market gained a penny at 1.03/lb with 6 loads trading Friday.
Milk futures are improving again, divergence continues
Class III and IV milk futures for the next 12 months came a bit closer together, on average, but the fourth quarter 2020 contracts are still divergent as Class III milk futures rallied Wednesday while Class IV was stagnant through yearend.
Trade on Sept. 4 closed with the September Class III contract up $1.37 from previous week at $17.06, October up $1.27 at $18.89, November up 21 cents at $17.55, and December down 12 cents at $16.65. On Friday, Sept. 4, the next 12 months averaged $16.82.
Conversely, yearend Class IV futures closed with the September Class IV contract down 14 cents from a week ago at $12.82, October down a penny at $13.86, November down a dime at $14.39, and December down 9 cents at $14.69. The next 12 months (Sept. 2020 through Aug. 2021) averaged $15.03 on Sept. 4.
The average spread between III and IV over the next 12 months was $1.79/cwt.
Imports/export factors affect storage, which in turn affects markets
The USDA Cold Storage Report released at the end of August showed butter stocks at the end of July were up 3% compared with June and 13% above year ago. Total natural cheese stocks were 2% less than June and up only 2% from a year ago. Bear these numbers in mind as we look at exports and imports.
According to the U.S. Dairy Export Council (USDEC), total export volume is up 16% over year ago year-to-date – January through July – and July, alone, was up 22% over year ago. Half of the 7-month export volume was skim milk powder to Southeast Asia. January through July export value is 14% above year ago.
However, butterfat exports are down 5% year-to-date. The big butter export number for July was not enough to make up for the cumulative decline over the previous 6 months.
On the import side, the difference between cheese and butter is stark. Cheese imports are down 10% below year ago, but the U.S. imported 13% more butter in the first 7 months of 2020 compared with a year ago.
When butterfat and butteroil as well as butter substitutes containing more than 45% butterfat are included in the total, the volume of imports is 14% higher than a year ago with the largest increases over year ago seen from March through June at the height of the pandemic when retail butter sales were 46% greater than year ago.
Looking at these butter imports another way, is it any wonder butter stocks are accumulating in cold storage to levels 13% above year ago at the end of July — putting a big damper on butter prices and therefore Class IV? The U.S. imported 13% more butter and 14% more butter and butterfat combined, plus exported 5% less butter and butterfat year to date.
As accumulating supplies pressured butter prices lower, the U.S. became the low price producer and exported a whopping 80% more butter in July compared with a year ago. This was the first year over year increase in butter exports in 17 months. Still, the record is clear, year-to-date butter exports remain 30% below year ago and total butterfat exports are down 5% year-to-date.
Experts suggest that butter and butterfat imports are higher because U.S. consumer demand for butterfat has been consistently higher even before the impact of the Coronavirus pandemic stimulated a run on butter at stores for at-home cooking and baking. This seems to be a difficult reasoning to justify — given there is 13% more butter currently stockpiled in cold storage vs. year ago.
If 14% more butter and butterfat are being imported, does this mean we need to import to serve consumer retail demand and keep larger inventory to serve that retail demand? If so, why is the inventory considered so bearish as to hold prices back so far as to amplify the Class III and IV divergence? Does month to month cold storage inventory represent excess or simply a difference in how inventory is managed in today’s times, where companies are not as willing to do “just in time” and “hand to mouth” — after having dealt with empty butter cases and limits on consumer purchases at the height of the pandemic shut down.
The trade has not sorted out the answers to these questions.
Meanwhile, these export, import, and government purchase factors impact the inventory levels of Class III and IV products very differently — and we see as a result the wide divergence between Class III and IV prices and between fat and protein component value.
Interestingly, USDA Dairy Programs in an email response about negative PPDs that have contributed to the wide range in “All-Milk” prices, says the higher value of components “is still in the marketplace” even if All-Milk and mailbox price calculations do not fully reflect it across more than half of the country.
— By Sherry Bunting
-30-
