Ag Secretary says ‘Dairy will change’, economist digs into how, why

Using a graphic pulled from the September 10, 2021 edition of Farmshine in which a follow up story ran about Danone dropping 89 organic dairy farms from its Horizon brand — all of its Horizon farms in the Northeast — Bozic explained that the ‘social mission’ of cooperatives is to market all of their members’ milk. He said the “primary function of the future” for the Federal Milk Marketing Orders — as an extension of the cooperatives — is to ensure market access for dairy farms. “Market Orders are there to ensure orderly consolidation at a humane pace,” he declared.

By Sherry Bunting, Farmshine, Sept. 24, 2021

HARRISBURG, Pa. – ‘Turning the page’ was the theme for the annual Financial and Risk Management Conference where key takeaways about a changing dairy industry were presented.

The conference was hosted by the Center for Dairy Excellence Sept. 21 in Harrisburg.

Pennsylvania Secretary of Agriculture Russell Redding summarized his own thoughts: “I am still very positive about dairy, but dairy will change. It is changing,” he said.

The Center’s risk management educator Zach Myers set the stage for attending lenders, vendors, producers and industry talking about Dairy Margin Coverage and Dairy Revenue Protection and how these programs have worked (more on that in a separate article.)

Digging into the stress — the ‘change’ — was Marin Bozic, University of Minnesota associate professor of applied economics and dairy foods marketing, who also serves as facilitator for the Midwest Dairy Growth Alliance. He dug right into how and why, discussing some of the Federal Milk Marketing Order complexities, industry trends and pricing relationships. He made the case that more flexibility, competition and innovation are needed in the Federal Orders for a “level playing field” so winners and losers can “self-select.”

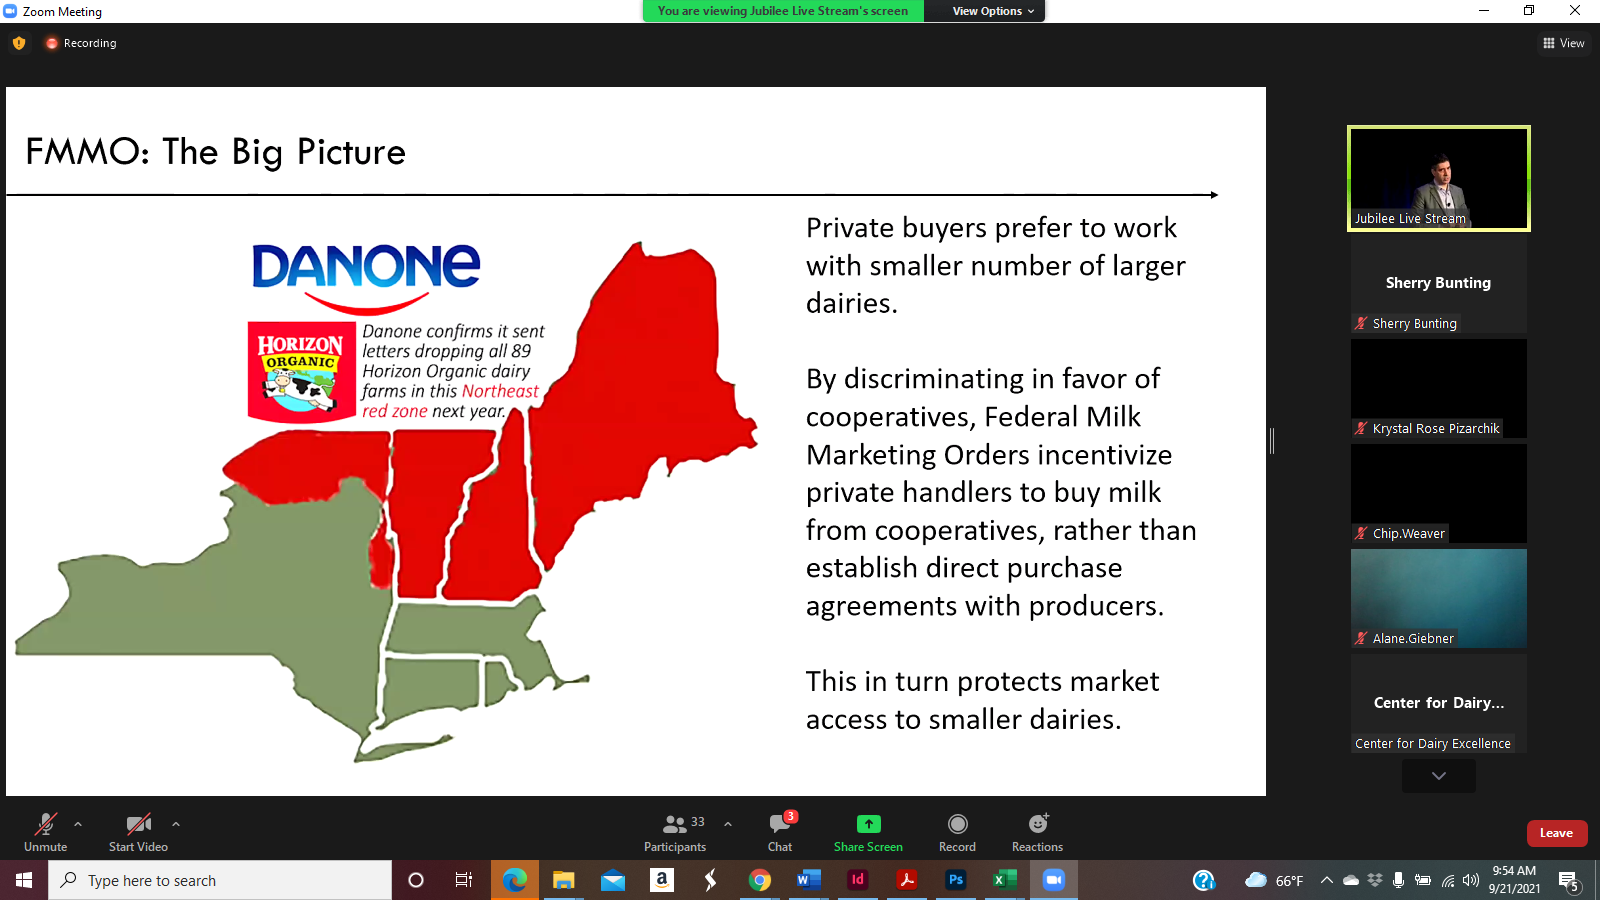
Bringing up the 89 organic producers Danone will drop from Horizon next year, Bozic said it is an example that, “One new farm in Indiana replaced 89 or 90 farms in the Northeast, and they can do that. There is nothing illegal about it. They could say they have a fiduciary responsibility to stakeholders and are minding their bottom line, but none of that helps you if 90 producers get dumped in a year.”

He pointed out the “social mission” of the cooperatives is to leave no member behind, so remaining an independent producer carries more risk today than in the past.

Bozic connected the dots to say the “primary function of the future for Federal Milk Marketing Orders — as an extension of the milk cooperatives — is to ensure market access for dairy producers.

“Market orders are there to ensure orderly consolidation at a humane pace,” he declared.

That’s a change from the central promise of the FMMOs today, which Bozic described earlier as “broken.”

“To navigate our businesses over the next year and longer,” said Bozic, “we have to count the passes and see the gorilla” — a nod to the visual exercise he had the audience participate in.

Bozic mentioned a few gorillas in milk. Gorillas in the FMMOs, in risk management, in dairy markets and in the macroeconomic situation – what else is going on in the world.

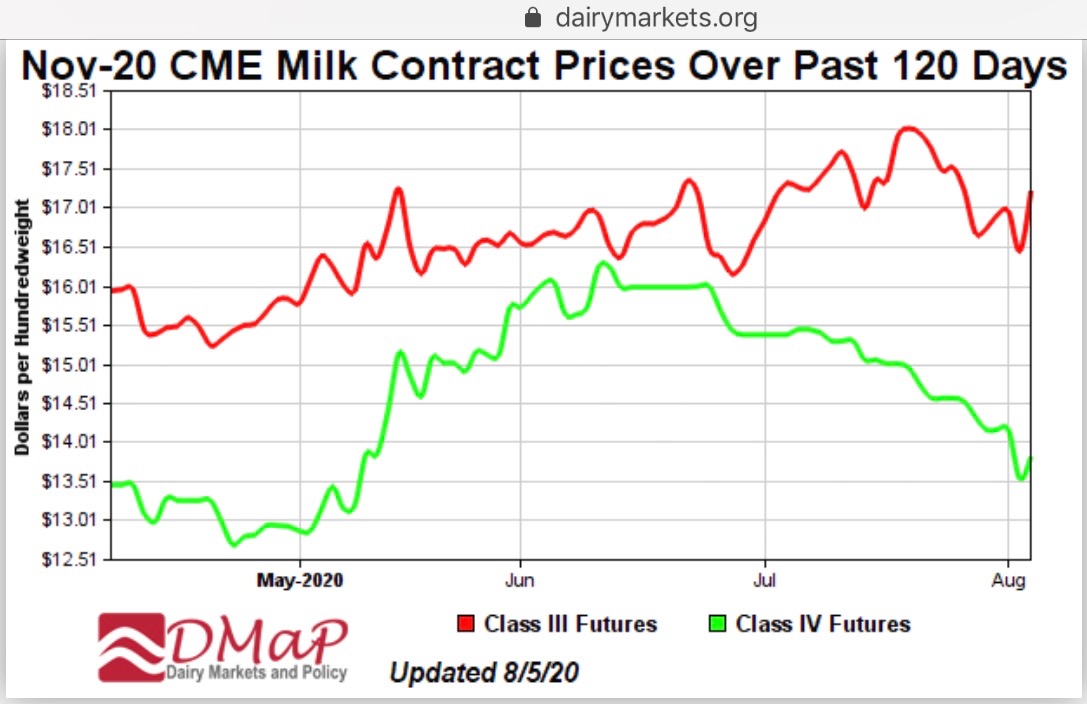
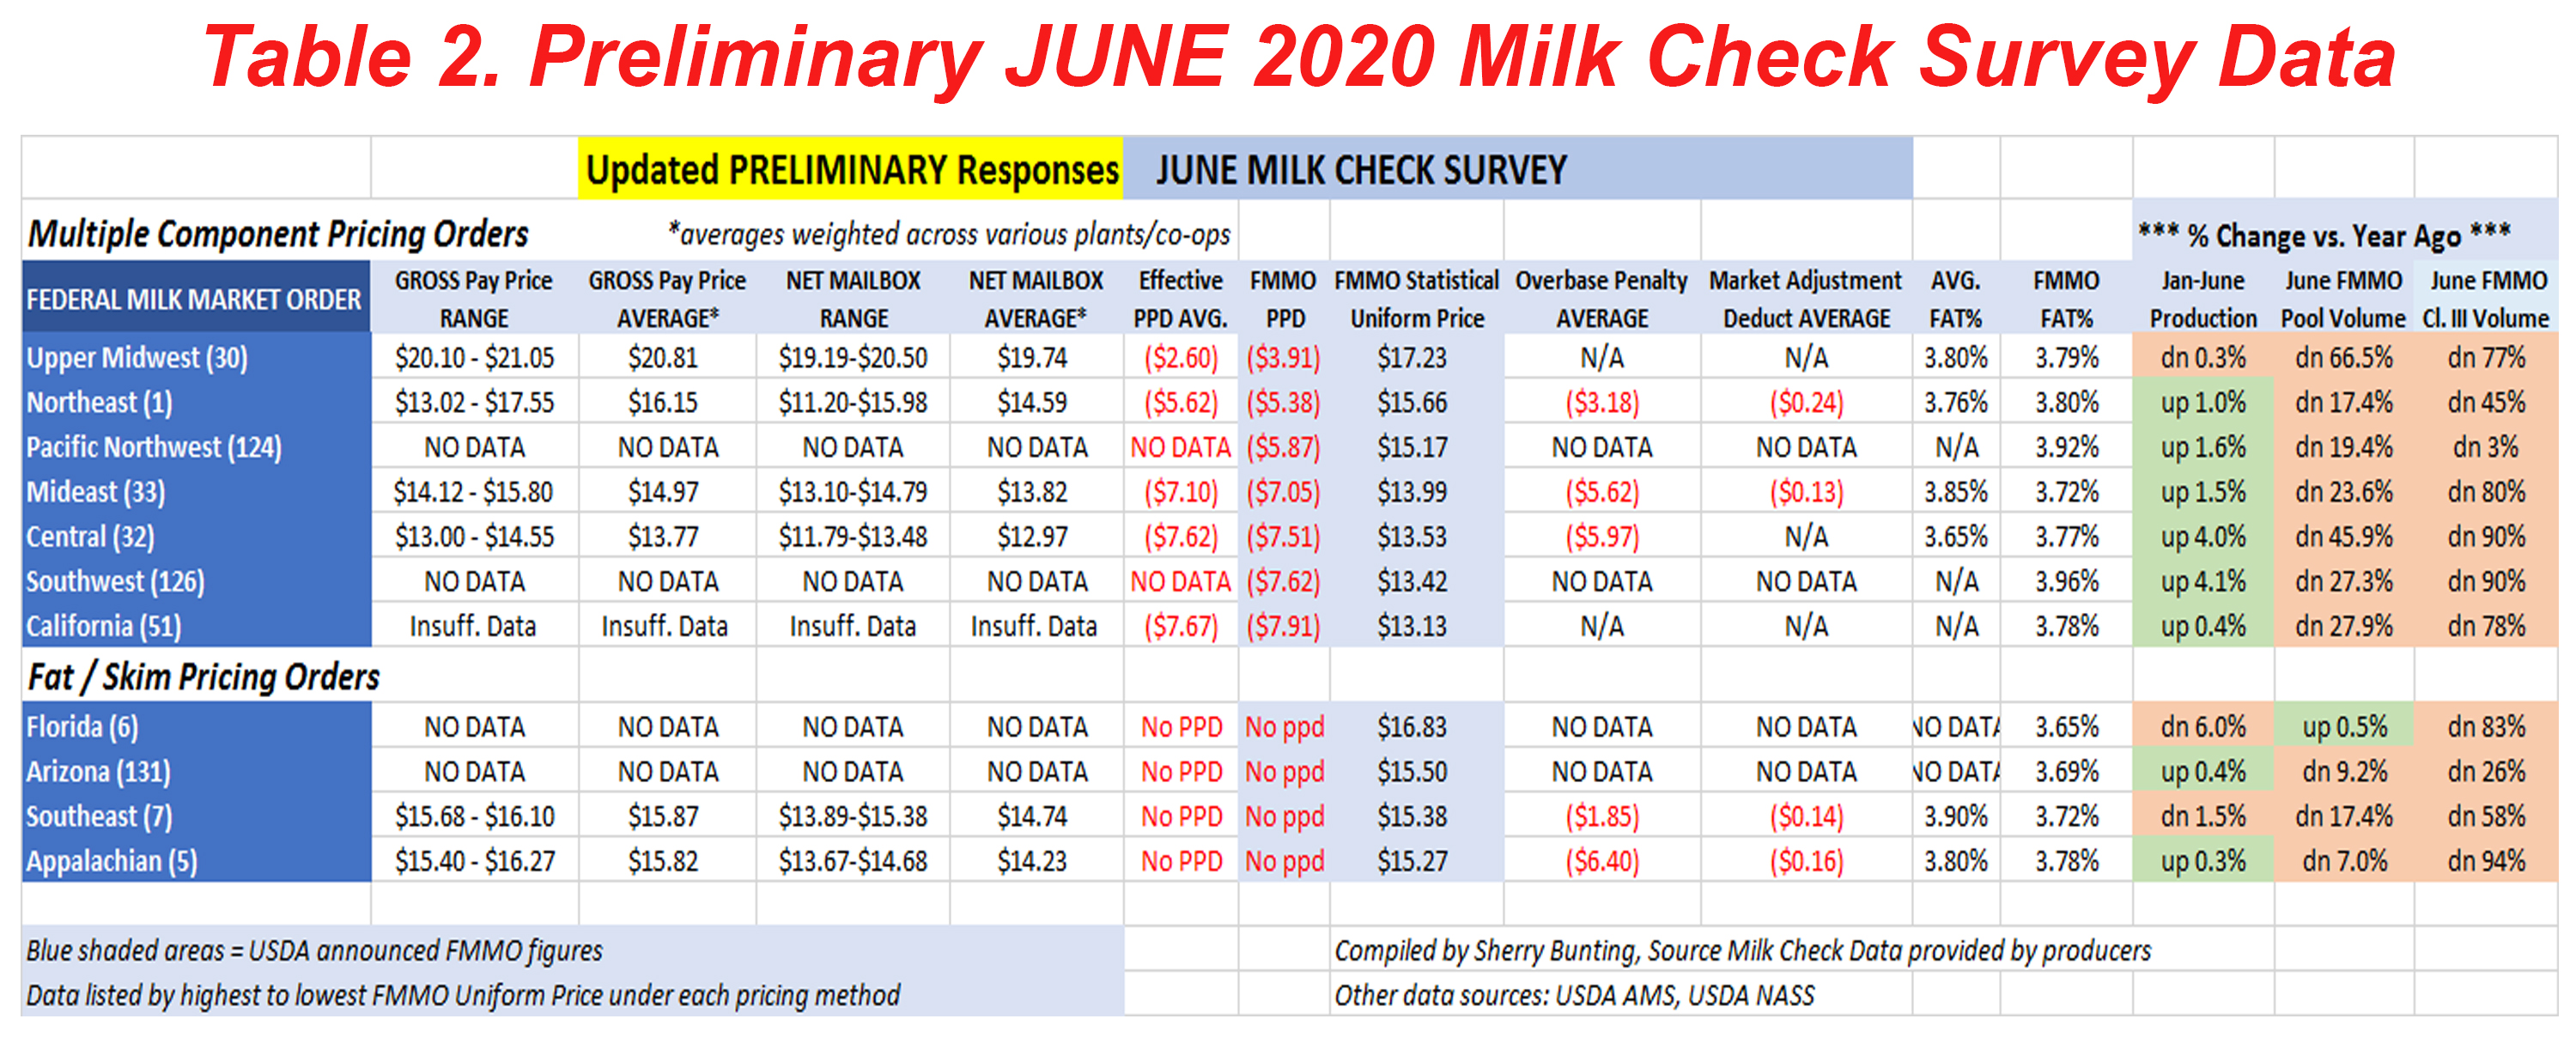
He showed graphs of what Producer Price Differentials (PPDs) looked like for the Northeast in 2020, the $4 and $5 negatives that represented cash flow bleeding, equity bleeding.

While the futures show the view out to the horizon over the next 6, 12, 15 months that would suggest there won’t be a repeat of that carnage, Bozic cited some of these risks, or gorillas, in the market and in world events that could represent shocks that can make the whole thing “go haywire again.”

Observing that the FMMOs are not the same today as when they were designed many decades ago, Bozic stepped conference attendees through the various long- and short-term impacts that reduce PPD, such as declining Class I utilization compared with increasing Class IV utilization and production.

“Orders were designed around the assumption that there would be plenty of fluid milk usage (as a percentage of total production), and we can just take it and designate it to be the highest and use those funds to make everyone whole,” said Bozic.

“The central promise of the FMMOs is that if your milk is as good as your neighbor’s, you get paid the same, so one farmer does not bid against another for market access and a good price,” he asserted. “That promise is now getting broken, not as much here, the East Coast FMMOs still have Class I.”

The next effect in the Northeast is the rise of protein tests. This impact comes through two channels where higher protein reduces PPD, the economist explained.

“Envision FMMOs as all processors paying into the pool and then taking from the pool. First they pay to the pool with classified pricing based on their respective milk solids. Class I pays on pounds of skim milk as volume, not on protein pounds,” he explained. “Even if sales are the same and the only thing that changes is protein, those (Class I) processors would pay the same amount (on skim) into the pool and take more money out (on protein) so there is less money remaining and a lower PPD.”

The second way higher protein production affects PPD is when the value of protein is lower in the powder than it is in the cheese. The butter/powder plant pays to the pool on nonfat solids price but takes money from the pool on protein price, “so that spread between the value of protein in cheese and powder also leaves less money for PPD,” said Bozic.

He explained the Class III price as an index of butterfat, protein and solids, in a straight formula that equals the class price. “When Class III price is higher than Class IV price, the predicted PPD for the Northeast Order declines,” said Bozic. “It’s almost linear.”

Conversely, when IV is above III, PPD goes up. “This has to do with paying the pool based on protein and nonfat solids, but when handlers take money out of the pool for components, everyone takes protein price leaving less money in the pool for PPD.

Bozic explained the demand shock to this system when the Food Box program “focused on smaller packages of cheese to put in every box. They didn’t take bulk powder and butter. So we went from a record low cheese price on the CME to a record high and no one expected this.”

The pull of 5% of the cheese supply for immediate delivery had everyone scrambling, said Bozic.

The amount of spare cheese available was not as high a volume as the government wanted to buy so cheese went from being long to short, and the price skyrocketed. This translated to an historically higher gap between Class III and IV prices as wide as $10 apart.

So why not just send more milk to make cheese? Bozic maintains that Class IV processing is accustomed to “balancing” fluid milk seasonality so there is extra capacity in that system.

Not so with Class III because those plants already run at capacity. “That’s the only way processors of commodity cheese make margin is to run at capacity, so when the demand shock came, and spare product was used up, there was no spare capacity and the price went higher. That was the main driver of negative PPD in 2020,” said Bozic.

Will it happen again? Bozic doesn’t foresee Food box programs with the same intensity in the future, but, “yes, it can happen, but I would say you need to have a pandemic in an election year. Don’t count on a program like this.”

The industry did ask USDA back in the 2008-09 recession to buy consumer packaged cheese instead of bulk commodities, so it could move instead of being stored to overhang the market later. That wasn’t working either.

“Now we understand that this other method disturbs PPDs so the dairy industry is united behind a more balanced approach,” said Bozic, describing the next iteration of purchases through the Dairy Donation Program will not be as aggressive in moving the markets by three orders of magnitude.”

Bozic said quick rallies and crashes impact PPDs also because of advance pricing on Class I based on the first two weeks of the prior month and announced pricing for the other classes at the end of the month.

Bozic explained why the change in Class I pricing was made: “The dairy industry wants to attract new distributors like Starbucks and McDonalds that are used to hedging their input costs. They don’t want to change prices every month. They want it to be what it is for a year, so the industry wants stable, predictable milk price costs to win favor with new distribution channels by making it easier for them to hedge.”

He said the new average plus 74 cents was designed to be revenue neutral. Looking forward, when Classes III and IV have less than $1.48/cwt spread, PPD under the new system is higher than under the old. But the most it can be higher is by 74 cents on Class I, which translates to 20 cents on the blend price.

The best case scenario is to add 20 cents to the blend price, but when Classes III and IV are far apart “the PPD can go haywire. Bottom line, the upside benefit of the averaging method with 74-cent adjuster is limited but the downside risk is big,” said Bozic.

Analyst says global trends suggest ‘mediocre’ year in 2021

Huge new cheese processing capacity is negative, a somewhat ‘balanced’ global powder inventory is positive

During the Dairy Financial and Risk Management Conference held virtually by Center for Dairy Excellence via Zoom, Matt Gould of Dairy Market Analyst Inc. showed how four long-term global dairy cycles were anticipated for 2017 through 2020 and are forecasted to be mostly neutral or “mediocre” for 2021. Zoom conference screenshot

By Sherry Bunting

HARRISBURG, Pa. — Back in December of 2019, “No one thought 2020 would be a bad year. What wallops you over the head are the unknowns,” said Matt Gould, president of Dairy & Food Analyst Inc. last Wednesday during the Center for Dairy Excellence Risk Management Conference held virtually. The list of over 100 attendees was a v‘who’s who’ of dairy market analysts, brokers, cooperative marketers, consultants and lenders with a sprinkling of farmers.

As for the 2021 outlook sitting here in September with so many unknowns, Gould said the consensus is next year will be a “mediocre” year for dairy markets.

“We can only talk about the known-knowns, with plenty of room for surprises,” he said, focusing on four long-term trends through forecasting models.

From a high level view, Gould said the conflict between indicators that are price-supportive and indicators that are price-negative will temper each other to be more-or-less “a wash in terms of market direction” – except for the influence of surprises one way or the other.

He discussed these trends within the context of how a producer’s milk check is figured, looking at cheese and whey setting the Class III price and butter and nonfat dry milk setting Class IV.

Putting some emphasis on the huge new cheese production facilities coming into operation at the end of 2020 and first quarter of 2021 in both the U.S. and Europe, Gould’s forecast for product prices included low cheese prices next year, stable butter prices, and the highest skim milk powder prices the world has seen in a long time.

The 3-year cycle

The 3-year cycle is still one of the four patterns that most people are familiar with. Historically, it has done a good job of reliably nailing the highs and lows, but not how high or how low, said Gould.

It is also the simplest of the four major patterns. If 2018 was the low in a 3-year cycle, then 2021 will be the next low – 2006, 2009, 2012, 2015, 2018…. 2021.

The global milk supply cycle

The second cycle Gould talked about was the global milk supply cycle, and this cycle is “neutral-ish” for 2021.

Globally, there is milk production growth, but it is not surging, said Gould.

“That’s the good news. We don’t have this wall of milk coming at us, but the flip side is that we don’t have a big contraction either to set us up for really good milk prices like in 2014,” he explained.

Globally, farmers have grown milk production through June, but only by 1 billion pounds per month. “When we cross that 1.5 to 2 billion pounds per month threshold, that’s the guard rail. That would be excessive over-supply territory,” said Gould. “We want some growth to keep balance with demand. There is rising dairy demand as the population grows and the middle class rises, but if we get over that guard rail, then growth becomes inventory.”

So, on global supply as a cycle, 2021 is neutral because global production is growing, but at a pace that should mirror demand growth.

The inventory cycle

On the global dairy inventory side, Gould said the set up into 2021 is “more price supportive.” Mainly because the global supply of the world’s balancing product – milk powder – is on the tight side of adequate.

“When we have big powder inventory, it overhangs the market and prices tend to be lower. Spikes happen when the trade is drawing down supply or when there is no overhang,” said Gould.

Heading into 2021, he said the dairy market with respect to global milk powder inventory “is in a price inflationary zone. We don’t have big inventory and we’re not setting up to build big inventories, so the risk of a good year for milk prices is still in there within this inventory cycle.”

The inventory cycle is setting up to be a price supportive one for 2021.

The trade cycle

Over the past 20 years, the world has gone through a period of booking trade agreements rapidly and aggressively. “We got new customers, grew exports, saw new opportunities and new demand,” said Gould. “The bad news is we have not booked any new WTO-style agreements in a long time.”

Gould explained that WTO-style agreements are the kind that give dairy access to new markets that grow quickly as opposed to more sales within existing markets that grow slowly.

Those WTO-style agreements of the past presented a “trade tailwind” fueling rapid market growth. “This lack of a trade tail wind is price negative for 2021,” said Gould. “The long-term view shows a lack of new global demand growth, which will hurt us.”

Gould acknowledged that the U.S. is getting a new style of trade agreement. “We have trade negotiations ongoing with several countries and we have taken existing agreements and negotiated new ones with the same customers. So, we are seeing new market access but not the advantages of WTO-style access.”

Gould sees the change from rapid growth to steady access in this trade cycle as setting up to be price negative.

Taken together, these four cycles show 2021 setting up with two neutrals, one negative and one positive.

Class III and IV expected to flip

As the indicators will be mixed, so will dairy product markets.

Gould’s cheese forecast is for an average $1.62/lb and his forecast for nonfat dry milk is that prices could reach $1.23/lb.

In farm milk checks, said Gould, it’s no simple task how milk prices get determined. “We use end products so it’s not a question of what the milk is worth, but what these products are worth, and it subtracts-out the cost of making the products and a yield factor too.”

Ostensibly, the Class II prices uses Class IV and the Class I price uses all the classes.

With Class III so much higher presently than the other classes, Gould noted the switch is setting up to flip for 2021.

Milk powder prices are expected to rise into and through 2021 because the big surpluses are gone and 2019 production kept pace with demand, which ended up drawing down on global powder supplies even further, with 2020 being more in balance heading into the first half of 2021.

While a penny change in nonfat dry milk price brings 8 cents to Class IV price a penny change in butter equates to 4 cents change in the Class IV price. Powder will be the more positive side of the 2021 setup compared with butter, according to Gould.

“The global butter market in 2020 saw big destruction of food service demand, which affected cheese, so processors (globally) made more butter, and foodservice is not using as much butter,” said Gould.

“In the short-term, there is an overhang of butter inventory, especially in the U.S., where we had big destruction of demand and the lowest butter price since 2013,” said Gould. “But people call me and say they can’t find butter on the shelf at the store, so how can this be?”

How can we have the lowest wholesale butter price and not be keeping up with retail demand?”

Gould explains that 55% of U.S. butter consumption pre-Covid was foodservice – going out to eat. In this pandemic environment, the foodservice industry has been devastated. Open Table, a company that books restaurant reservations estimates foodservice is still down by half and full-service restaurants are decimated.

“On the flipside, retail butter sales have been extraordinary at times, with some weeks more than doubled over year ago,” said Gould. But plants in the U.S. are specialized moreso than in Europe where dairy plants are more flexible making more different products instead of specialized for high volume and efficiency.

Matt Gould, Dairy Market Analyst Inc. talked about the differing market and inventory conditions for dairy products into the end of 2020. U.S. butter exports are down, imports are up, and U.S. butter inventory has been built up. Globally, butter is well supplied as more versatile plants in Europe switched from cheesemaking to butter when Covid-19 shut down the restaurant trade.   Zoom conference screenshot

“Where we have the bottleneck in the U.S. is turning bulk butter into quarter pound sticks for retail,” he said, adding that in the past21 days, retail butter sales have slowed to show smaller growth rates over year ago.

In short, while holiday sales will help boost fourth quarter, it won’t make much difference in the overall butter picture because “we’ve already gone through the demand destruction and the inventory is already built. We have more butter in stock than we have domestic sales so we are in surplus,” said Gould.

Gould did not specifically mention the large imports of butter and butterfat into the U.S. from March through July, but he did reference the bottleneck in turning enough bulk butter into sticks for retail. As this pushed retail butter prices higher, Gould noted that importing was incentivized.

Cheese is where some “known surprises” come into play.

The U.S. will see significant new cheese production capacity becoming operational in November (Michigan) and the beginning of 2021 (Minnesota).

“Every one penny in cheese price change is 10 cents of change on the milk check,” Gould pointed out. “As a globe, we are in relatively balanced to tight supply on cheese in the second half of 2020, but the forecast heading into 2021 is driven by the factories and capacity being built.”

He said the long-term export trend for cheese is positive. It has been a “winner” during Covid because the big cheese purveyors are pizza companies that were the first to adopt low and no-contact delivery and saw their sales surge 20% higher.

But new cheese processing capacity in the U.S. and in Europe will present short-term concerns.

“We will see huge growth in cheese processing,” said Gould. The plant in St. John’s Michigan as a joint venture of DFA, Select and Glanbia will be the sixth largest in the country.

“We have never opened a plant in the U.S. that big – that fast – in history. This is a first, and these types of plants have to be run full, or you will lose your tail,” he said, noting these types of plants in the American cheese business operate on margins of 0.5% (one half of one percent). “They’ll make a penny on a $2/lb cheddar price. That’s why they fill full and build to scale and magnitude to make volume.

“The consequence of that is a shock increase in supply,” said Gould. “Demand doesn’t grow that same way. We don’t wake up and see new demand present itself as a shock-increase like that.”

Some wild cards do exist, including government intervention. What we’ve seen already this year in dairy purchases is greater than dairy has seen in a long time.

“Government purchases (CFAP) are using 2.5 to 3% of the U.S. milk supply,” said Gould. “Normally we forecast within 1% to say a year will be good or bad, but when those purchases end, we are talking about 2.5 to 3%. That’s a huge number. That’s a price negative thing if all of a sudden there’s 2% more milk on the market without government purchases.”

The flip side, he said, is “We are going through a crisis, and people are hungry. When you have hungry people, the prescription is to get them food.”

In this way, government purchase could be a positive wild card if they continue under circumstances where economic slowdown impacts domestic demand. 

Other wild cards of course include the progress on a vaccine for Covid, and the status of the economy and foodservice. Positives in those areas could unleash demand for products that can be made quickly in bulk without the bottlenecks of serving retail demand.

— Previously published in Farmshine, Sept. 25, 2020

-30-

Dairy producers say risk management takes time, planning, daily involvement

Producers share priorities, experiences during risk management conference

A panel of producers during the Center for Dairy Excellence Risk Management Conference last week agreed their top priority is stabilizing input costs, especially feed, is the first component to any dairy risk management strategy.

HARRISBURG, Pa. — How are dairy producers navigating the rapidly changing dairy markets? A panel of Pennsylvania producers shared during the 11th annual Center for Dairy Excellence Risk Management and Financial Conference, conducted ‘virtually’ by Zoom in September with an audience each day of over 100 people, most of them dairy lenders and consultants.

“Risk management is important, but it takes planning,” said Mike Hosterman of AgChoice Farm Credit, moderating the panel comprised of Mark Mosemann, who farms with his father and brother milking 450 cows at Misty Mountain Dairy, Fulton County; Glenn Kline, who farms with his two sons milking 600 cows at Y-Run Farms in Bradford County; and Rod Hissong, who farms with his brother milking 1600 cows at Mercer Vu Farms in Franklin County, Pa. and 1200 cows at their satellite dairy 65 miles south in Whitepost, Virginia.

Polling the audience, Hosterman revealed a low percentage of lenders see a risk management or marketing plan from clients.

All three producers put a big emphasis on the input side of the margin since 2012. Some common themes and priorities emerged.

Stabilize feed costs

The 2012 margin squeeze caught many producers by surprise as milk prices skyrocketed and feed prices went wild.

After that happened, all three panelists aimed to expand their land base through ownership and especially rented ground to produce all of their own forages and a portion of energy and protein.

They also increased inventory capacity to buy and store feed commodities and do risk management with local feed mills.

By stabilizing feed costs – the largest input cost on the dairy – they are positioned to operate the business, plan for the future and think about risk management opportunities on the milk side.

Hissong noted that their expansion with a satellite farm in Virginia was also a hedge on the future in terms of the next generation. The brothers will be able to downsize or upsize depending on how the future shapes up for sons, daughters, nieces and nephews because they invested in two sites, not expanding into one larger site.

Value of networking

“Don’t underestimate your networking capability,” said Mosemann, who described how this enabled his family to acquire rented ground and work with others in custom harvesting and feed inventory.

For Hissong, relationships on buying forage changed to relationships in acquiring ground. 

They also brought more pieces under their own management, now raising their own dairy replacements and hauling their own milk.

The satellite dairy allows the Hissongs to manage weather risk on the feed side and to set up their cow flows to gain labor efficiencies in operating the dairy. Baby calves are raised at the home farm and go to the Virginia site when bred. They stay there through gestation and calving and for milking through first, sometimes second, lactation.

Kline and Mosemann both purchase some inputs collectively with other farms, which is a risk management strategy more producers are using to stabilize costs today. They also work with other farms in custom harvesting and trucking.

Relationships with feed mills offer additional opportunities to manage risk, and relationships with the nutritionists, veterinarians, and financial advisors bring ideas to the farm.

Two ways to breakeven

All three producers use their farm accountants to do both a cost of production analysis as well as cash flow analysis to come up with a Class III price that meets their farm’s breakeven price in both scenarios, including the cost of the risk management.

That’s essential because producers can’t afford to pay for risk management that doesn’t secure breakeven or better.

“We take the COP analysis and come up with a gross milk price. We calculate our basis into that and look at the Class III price that is required for us to break even,” said Mosemann, explaining that a separate cash flow analysis, with net income offsets, calculates a final Class III price target. “That’s what we use to measure against when deciding what to buy, and our goal is to come out of it with a net price above the net breakeven.”

Even armed with this knowledge, relying on the Class III breakeven method has become a challenge today with the inverted basis from negative PPDs.

While the basis on milk in the East has declined rapidly along with the declining Class I milk utilization over the past decade, at least it has been relatively stable and could be plugged into a Class III breakeven strategy at an approximate level.

However, in the current market, a “Class III breakeven” is much more difficult to calculate because the basis is all over the place and mostly negative. Looking out at risk management for the next six to 12 months is frustrating even for those who have been doing this for a while.

Hissong observed that their strategy changes with conditions, but a key to making it work is to keep their variable costs “fairly flat” from one quarter to the next.

“We are not trying to ‘guess the market,’” he explained. “We are trying to gather information and make an educated decision. We are trying to protect the breakeven.”

Watching it daily allows him to adjust using other tools through the cooperative. Forward contracting through the cooperative means no margin calls, but Hissong noted that, “Once you take a position, you are locked into that position.”

Having both Class III and IV contracts helped because where they lost on Class III because it went higher, they gained on Class IV because it went lower.

Layered approach

All three producers use a layered approach. They don’t put all their milk in one basket and they don’t necessarily cover all of their milk.

They start by using the Dairy Margin Coverage (DMC) on the first 5 million pounds of annual production. 

Each farm on the panel also forward contracts with their respective cooperatives, and they use more than one tool offered by the cooperative. They have also used Dairy Revenue Protection (DRP) on a portion of their milk in a few quarters where it made sense.

Dedicated person

It is essential to have someone within the farm ownership core who manages the strategy and is looking at it every day, the panelists said. This is not something they do and then forget about, or hand off to someone else.

“You’ve got to be passionate about it. It takes a lot of time, and you’ve got to look at it every day. So that means someone has to have the time to do it, and enjoy doing it,” said Kline, who does the risk management at Y-Run.

For Mercer Vu, that person is Rod, and at Misty Mountain, it is Mark’s father.

Kline says he is able to do it because his two sons are doing the other things in the operation. “This gives me another perspective in the operation of the business to work on,” he explained.

“This is such an important part of our bottom line, so we believe we have to be more involved in it,” Hissong said. “The first thing to know is COP, so we know what price to protect. We have to know what is a profit. We do cash flows and budgets with Mike Hosterman and work with Acuity to do quarterly accrual-based accounting so we can calculate-back our breakeven through Class III and basis.”

“Risk management is not always successful,” Mosemann acknowledged. “But our strategy is to get base-hits, not a grand-slam homerun. If we can get on base and stabilize things, then we can plan. Risk management is now a cost of doing business for us to protect against the volatility we see.”

All three producers said they tap other resources for information in addition to those they work with on risk management.

Difficult environment

The current market environment is a difficult one in which to execute a risk management plan.

These producers do their homework, develop their strategies, layer their tools, know their breakevens, know their goals, watch the markets, work with their team — but still find it difficult to know over the next six to 12 months when to pull the trigger at what looks like a breakeven forward contract or price floor due to the unknown and negative basis relative to Class III.

Each producer said they would participate in more risk management right now, but it’s difficult to assess a breakeven level because the tools based on CME futures do not match up with how their farms could ultimately be paid for the milk in those future months. 

Without knowing how their cash price will perform in relation to the futures price, it’s hard to commit to a strategy that worked in the past, so new thinking is needed. The producer needs to have a handle on what to do about basis. Will the farm’s cash price move in the same direction as the futures, and by what margin of premium or discount will the cash price move? This is part of the decision making when working through a plan.

Using advisors

All three producers mentioned working with their farm and financial advisors as a key to risk management. They see lenders starting to require some level of risk management and foresee this being part of lending packages in the future.

A little bit of everything

From renting more ground and networking with others, to contracting feed, creating inventory, running cost of production, budget and cash flow analyses and using multiple tools from DMC and DRP to forward contracting, these dairy producers say a little bit of everything adds up to some base-hits to keep margins in a zone where they can operate the business and plan for the future.

“With the way the last four to five years have been, and seeing how politics and a global pandemic can turn everything on its head, if we are looking to purchase land or expand for the next generation, we better have risk management in place even if the lender doesn’t require it,” said Kline.

Hissong added that, “We continue to see our industry change. For those actively wanting to be in it and see a future in it, or if they have to work with someone to make a go of it, risk management will almost become mandatory.”

At the same time, he observed that the government CFAP payments and dairy product purchases add another ripple.

“The CFAP payments changed the balance sheet for us, and they were definitely needed from the perspective of our dairies coming out of a rough spot and scary time,” said Mosemann.

At the same time, noted Hissong, the government involvement has an effect on the market “when trying to figure out market signals and trying to figure out what to do in 2021.”

With milk class and component pricing relationships in turmoil from pandemic disruptions and government intervention, risk management is more difficult to do right now. 

Even so, these producers would encourage others to take this time to learn more about it, to work through their numbers and work through some scenarios to be prepared to implement risk management at some level in the future.

— By Sherry Bunting, Farmshine, Sept. 25, 2020

-30-

Markets review and look-ahead, USDA pegs July ‘All-Milk’ at $20.50

U.S. All-Milk $20.50, DMC $12.41

The USDA NASS Agricultural Prices report calculated a U.S. All-Milk price of $20.50 for July, up $2.40 from the June All-Milk price of $18.10 and $1.80 higher than a year ago. With this as the pegged U.S. average milk price, the July Dairy Margin Coverage (DMC) margin was calculated at $12.41, also $2.40 higher than June and $2.91 above the highest level of DMC coverage.

These July USDA numbers are welcome, but tell half the story.

The chart above lists the July 2020 USDA All-Milk price calculations for the top 24 milk-producing states in descending order with the U.S. average highlighted.

What stands out is the range from top to bottom. It has doubled from a more typical $3 to $4 spread to an $8 to $9 spread in June and July 2020. This is the widest we could find on record — with the U.S. average All-Milk price standing fully $4.00 higher than the state with the lowest All-Milk price in June and July 2020 compared with a more typical $1.50 difference a year ago.

A year ago, 7 of the 24 USDA milk production report states were below the U.S. average, a more typical occurrence. In June and July 2020, 15 of the 24 states were below the U.S. average All-Milk price.

On the up-side of the chart, we see that the highest states are $4 to $5 above the U.S. average, when normally that difference would be less than $3.00.

Actual mailbox price calculations won’t be released for five months, and when they are released, the range will likely be even wider from top to bottom than the $8 to $9 spread we see in All-Milk prices the past two months.

Unofficial milk check surveys of volunteered data from dairy producers in six federal orders for June and July show a whopping $14.00 per hundredweight range from top to bottom in gross pay and mailbox net pay.

As for the August All-Milk price, USDA won’t report that until the end of September. We will get Federal Order uniform price announcements for payment of August milk in mid-September. On Sept. 2, USDA did announce August Class and Component prices with Class III (cheese) milk at $19.77, which is $7.24 above the Class IV (butter / powder) price of $12.53. Class II was announced at $13.27. The August protein price was pegged at $4.44 and butterfat $1.63.

Margin ‘equity’ affected by wide spreads

For dairy producers enrolled in DMC — but in regions receiving the lower end of these All-Milk prices in June and July — the safety net program thresholds were not met by the ‘average’ margin even as that margin did not reflect their reality. For dairy producers using a variety of risk management options, new challenges have also emerged in the current market dynamic due to de-pooling of milk making negative producer price differentials (PPD) more negative in some areas.

While the spread between Class III and IV looked like it would narrow this fall, an upswing in Class III futures for October through December contracts this week — and lackluster performance on Class IV — show spreads in manufacturing class values could widen again, which tends to be an incentive for de-pooling in Federal Orders where a mix of products, including Class I beverage milk, are produced.

There are tools to navigate these challenges, say the experts, but a deeper concern is how closely the divergence can be related to the product mix of the CFAP food box government purchase rounds — and changes in U.S. dairy imports.

As the third round of CFAP Farmers to Families Food Box purchases are underway for fourth quarter 2020 delivery, USDA this time set parameters for food box dairy products to be more representative of Class II and IV products, along with the Class III cheese products. In addition, the third round defines the fluid milk in several solicitations to be 2% or whole milk. This will also help with fat value that has plummeted this year.

Still, the majority of government food box purchases continue to be cheese, and the markets responded last week as spot cheddar rallied back above $2.

CME spot cheese pushes higher — past $2/lb, butter and powder steady-ish

Cheese markets gained more than a dime in CME spot trade on Wed., Sept. 2 with 40 lb blocks pegged at $1.91/lb. From there, the market continued to move higher at $2.12 by Friday, Sept. 4, up 30 cents from the previous Friday with zero loads trading; 500-lb barrels were pegged at $1.70/lb, up 27 cents with a single load trading.

Spot butter managed to gain through midweek before losing some of that advance at the end of the week. On Friday, Sept. 4, a whopping 12 loads were traded on the CME spot market with the price pegged at $1.4925/lb — up a nickel from the previous Friday. Nonfat dry milk on the CME spot market gained a penny at 1.03/lb with 6 loads trading Friday.

Milk futures are improving again, divergence continues

Class III and IV milk futures for the next 12 months came a bit closer together, on average, but the fourth quarter 2020 contracts are still divergent as Class III milk futures rallied Wednesday while Class IV was stagnant through yearend.

Trade on Sept. 4 closed with the September Class III contract up $1.37 from previous week at $17.06, October up $1.27 at $18.89, November up 21 cents at $17.55, and December down 12 cents at $16.65. On Friday, Sept. 4, the next 12 months averaged $16.82.

Conversely, yearend Class IV futures closed with the September Class IV contract down 14 cents from a week ago at $12.82, October down a penny at $13.86, November down a dime at $14.39, and December down 9 cents at $14.69. The next 12 months (Sept. 2020 through Aug. 2021) averaged $15.03 on Sept. 4.

The average spread between III and IV over the next 12 months was $1.79/cwt.

Imports/export factors affect storage, which in turn affects markets

The USDA Cold Storage Report released at the end of August showed butter stocks at the end of July were up 3% compared with June and 13% above year ago. Total natural cheese stocks were 2% less than June and up only 2% from a year ago. Bear these numbers in mind as we look at exports and imports.

According to the U.S. Dairy Export Council (USDEC), total export volume is up 16% over year ago year-to-date – January through July – and July, alone, was up 22% over year ago. Half of the 7-month export volume was skim milk powder to Southeast Asia.  January through July export value is 14% above year ago.

However, butterfat exports are down 5% year-to-date. The big butter export number for July was not enough to make up for the cumulative decline over the previous 6 months.

On the import side, the difference between cheese and butter is stark. Cheese imports are down 10% below year ago, but the U.S. imported 13% more butter in the first 7 months of 2020 compared with a year ago.

When butterfat and butteroil as well as butter substitutes containing more than 45% butterfat are included in the total, the volume of imports is 14% higher than a year ago with the largest increases over year ago seen from March through June at the height of the pandemic when retail butter sales were 46% greater than year ago.

Looking at these butter imports another way, is it any wonder butter stocks are accumulating in cold storage to levels 13% above year ago at the end of July — putting a big damper on butter prices and therefore Class IV? The U.S. imported 13% more butter and 14% more butter and butterfat combined, plus exported 5% less butter and butterfat year to date.

As accumulating supplies pressured butter prices lower, the U.S. became the low price producer and exported a whopping 80% more butter in July compared with a year ago. This was the first year over year increase in butter exports in 17 months. Still, the record is clear, year-to-date butter exports remain 30% below year ago and total butterfat exports are down 5% year-to-date.

Experts suggest that butter and butterfat imports are higher because U.S. consumer demand for butterfat has been consistently higher even before the impact of the Coronavirus pandemic stimulated a run on butter at stores for at-home cooking and baking. This seems to be a difficult reasoning to justify — given there is 13% more butter currently stockpiled in cold storage vs. year ago.

If 14% more butter and butterfat are being imported, does this mean we need to import to serve consumer retail demand and keep larger inventory to serve that retail demand? If so, why is the inventory considered so bearish as to hold prices back so far as to amplify the Class III and IV divergence? Does month to month cold storage inventory represent excess or simply a difference in how inventory is managed in today’s times, where companies are not as willing to do “just in time” and “hand to mouth” — after having dealt with empty butter cases and limits on consumer purchases at the height of the pandemic shut down.

The trade has not sorted out the answers to these questions.

Meanwhile, these export, import, and government purchase factors impact the inventory levels of Class III and IV products very differently — and we see as a result the wide divergence between Class III and IV prices and between fat and protein component value.

Interestingly, USDA Dairy Programs in an email response about negative PPDs that have contributed to the wide range in “All-Milk” prices, says the higher value of components “is still in the marketplace” even if All-Milk and mailbox price calculations do not fully reflect it across more than half of the country.

— By Sherry Bunting

-30-

Deep discounts on All-Milk prices bring new risk management challenges

NOTE: In the first part of this three-part series, we’ll look at some of the factors contributing to the huge divergence between Class III and IV at the root of current losses in milk income, especially for risk-managers who were caught off guard with no good tools to manage the misalignment and especially the de-pooling. In the next two parts, we’ll look at some of the advice for managing basis risk in CME-based tools and revenue insurance.

IMG-9043

This graph at dairymarkets.org shows the divergence between Class III and IV milk futures at the root of deep discounts in All-Milk prices as compared with Class III.

By Sherry Bunting, Farmshine, Friday, August 7, 2020

BROWNSTOWN, Pa. — Dairy producers find themselves in uncharted territory, where a mixed bag of market factors, pricing structures, class price misalignments, Federal Milk Marketing Order (FMMO) provisions, product-in / product-out flows via imports and exports vs. inventory, as well as the government’s thumbprint on the scales in a pandemic shutdown of the economy and the dairy product purchases that followed. All have affected Class III and Class IV milk prices quite differently, creating deep discounts in blended farm milk prices vs. Class III.

“We’re seeing milk class wars,” said economist Dan Basse of AgResource Company, a domestic and international agricultural research firm located in Chicago, during a PDPW Dairy Signal webinar recently. Basse opined that the current four-class FMMO system is old and outdated with pitfalls creating new volatility issues for producers in the form of the $7 to $10 spread between Class III and Class IV in June / July.

He noted, as have others in the past, that a simpler pricing system with one manufacturing milk price and one fluid milk price is something that “dairy farmers could live within.”

Under the current four-class system, and the new way of calculating the Class I Mover via averaging, dairy farmers now find themselves “living on the edge, not knowing what the PPD (Producer Price Differential) will be,” said Basse.

“A $7.00 per hundredweight discount is a lot of capital, a lot of income and a lot of margin to lose with no way to hedge for it, no way to protect it, when the losses are not being made up at home (as reflected in) the PPD,” Basse related.

Previous Farmshine articles over the past few weeks have explained some of the FMMO factors reflected in the negative PPDs everyone is focused on because they are so large. While June’s PPD was primarily affected by lag-time, the next several months of negative PPDs are likely to occur based on the legislated change to the Class I Mover calculation in the last Farm Bill.

The significance of the PPD is that it indicates to the producer the value of the milk in FMMO-available pool dollars as compared to the announced Class III price. The PPD is how the FMMO pool revenue is balanced.

Normally, component values are paid by class, and the extra is divided by hundredweights in the pool to calculate a PPD reflected as the difference (usually positive) between the FMMO uniform price and the Class III price, according to Dr. Mark Stephenson, University of Wisconsin dairy economist in a recent PDPW Dairy Signal.

When higher-value Class III milk is de-pooled in this scenario, the dollars don’t stretch, so the pool has to be balanced by dividing the loss (negative PPD). Even in the southern FMMOs based on fat/skim the same shortfall occurs and shows up as milk being worth less than Class III, instead of more.

The problem faced right now is the Class III price does not represent the broader industry, and there are no straightforward tools for managing this type of risk, especially when the higher-value Class III milk is de-pooled or replaced with a lower class.

“It’s a terrible situation on the hedging side, with three material sources of the problem,” notes Bill Curley of Blimling and Associates in a Farmshine interview this week.

While he describes ways to manage some of these sources in building a risk management price or margin, such as using a mix of Class III and IV and other strategies that reflect a producer’s milk market blend of classes, “there’s no hedge for de-pooling,” he relates.

In fact, Stephenson illustrates this for the Upper Midwest FMMO 30, showing a difference of $7 between the level of negative PPD for July without de-pooling and the level of negative PPD with de-pooling.

While July de-pooling figures won’t be known until mid-August, the June de-pooling in the Northeast wasn’t as bad as in California, as an example. In California, so much milk is already sold outside the pool, that it is easy to replace virtually all of the Class III milk with lower-value Class IV in this divergent classified price scenario.

In the Upper Midwest, only so much de-pooling can occur due to qualifying criteria, so utilization that may normally be 75% Class III, was 50% in June. They don’t have enough Class IV to simply replace Class III and stay qualified on the Order.

Curley and others explain that this situation could leave producers unprotected, especially since they can’t control any of the sources of misalignment between their All-Milk price and Class III. The only factor they can control is whether or not to drop the hedges, which then leaves them unprotected for market risk at a volatile time in the midst of a pandemic as virus rates are reportedly re-surging.

Meanwhile, this week began with risk working its way back into markets as three consecutive days of steep losses in CME cheese and butter prices pushed both Class III and IV milk futures lower, but still with a $4 to $7 gap between them in the next few months.

For its part in balancing broader industry demand, USDA announced a third round of food box purchases for September and October, which will again include cheese, but this time will include more from Class II (sour cream, yogurt, cream cheese) as well as some butter from Class IV. All told, the government will have spent about $1 billion in three phases of dairy purchases for the Farmers to Families Food Box program.

Stephenson reminds producers of the silver lining in this cloud.

“Remember what the pandemic economy looked like just a little over two months ago,” he said. “It was absolutely devastating. Cheese was at $1.00/lb, and milk dumping was unprecedented.

“Now, as we look at things, it’s going to be better than we expected then,” he said showing the All-Milk price for 2020 is now forecast to come in at just under $18 for the year, but that many farms will net $20 per hundredweight for the year via the combination of Dairy Margin Coverage (DMC) and Coronavirus Food Assistance Program (CFAP) payments.

He estimates 2020 DMC payments at the $9.50 coverage level should net 66 cents across annual production for the year while CFAP payments have produced, so far, an impact equal to $1.55 per hundredweight across annual production.

For many producers, however, it won’t feel like $20. It might not even feel like $18.

Agricultural Prices 07/31/2020

USDA NASS reported June All-Milk prices last Friday, July 31. The range from high to low is $8, nearly double the normal range. At $18.10, the U.S. average All-Milk price did push the Dairy Margin Coverage milk margin above the highest payout level at $9.99.

Take June milk checks for example. USDA announced Friday, July 31 that the June U.S. All-Milk price was $18.10. That’s almost $3 below the Class III price of $21.04 for June, something we just don’t see.

Worse, USDA’s own report showed an $8.00 per hundredweight spread between the lowest All-Milk price reported at $14.80 for Michigan and the highest reported at $22.70 for South Dakota. This unprecedented spread is almost double the normal range from top to bottom. (Table 1)

Also unprecedented is the Pennsylvania All-Milk price reported by USDA for June at $16.30. That’s a whopping $1.80 below the U.S. All-Milk price when normally the state’s All-Milk price is 30 to 60 cents above the U.S. average.

The same thing can be said for Southeast fluid markets and other regions where a mixed products, classes and de-pooling of higher-value milk left coffers lacking for producer payment in the pool, and results varied in how co-ops and handlers  compensated producers outside the pool.

Dairy producers participating in the June milk check survey announced in Farmshine a few weeks ago, have reported gross pay prices that averaged fully $2 below the respective USDA All-Milk prices calculated for their state or region. Net prices, after deductions, averaged $4 below, and the same wide $8 spread from top to bottom averages was seen in this data from over 150 producers across six of the 11 Federal Orders. (Table 2)

This all creates an additional wrinkle in terms of the impact on the DMC margin, which was announced this week at $9.99 for June – 49 cents over the highest coverage level of $9.50 in the DMC program. This margin does not reflect anything close to reality on most farms in June and potentially July.

Large, unexpected and unprotected revenue gap

Normally the All Milk price is higher than Class III, and the cost of managing risk when the market moves higher is then covered by the performance of the cash price, or milk check, instead of the hedge, forward contract or revenue insurance. The inverse relationship in June and July between blend prices and Class III price, left a large, unexpected and unprotected revenue gap.

For its part, USDA AMS Dairy Programs defines the All Milk price in an email response recently as “a measurement of what plants paid the non-members and cooperatives for milk delivered to the plant before deduction for hauling, and this includes quality, quantity and other premiums and is at test. The NASS price should include the amount paid for the ‘not pooled milk.’”

USDA’s response to our query further confirmed that, “The Class III money still exists in the marketplace. It is just that manufacturing handlers are not required to share that money through the regulated pool.”

MilkCheckSurvey080320

By the looks of the milk check data from many areas (Table 2), most of this value was not shared back to producers, with a few notable exceptions. However, economists project the situation for July milk will be worse in this regard.

The factors depressing June and July FMMO uniform prices, USDA All-Milk prices and producer mailbox milk check prices are three-fold: the 6 to 8-week lag-time in advance-pricing of the Class I Mover, the new method of averaging to calculate the Class I Mover, and de-pooling of the higher-value Class III milk. All three factors are rooted in the $7 to $10 divergence between Class III and IV in June and July.

The part of the equation attributed to the new Class I Mover calculation is perhaps most discouraging because this is not money producers will eventually see. On the other hand, the lost value from the advance-pricing lag-time is eventually “caught up” in future milk checks. Most of the discount to come in July farm-level prices and negative PPDs in future months vs. Class III will be from the divergent factors that are not reconciled later.

Demand drivers differ for Class III vs. IV

Driving Class III $7 to $10 above Class IV was the abrupt turnaround in the cheese market, fed by strong retail demand, the resupply of foodservice channels, a significant May rebound in exports of cheese and whey, significant declines in cheese imports in the March through June period, and new government purchases of cheese for immediate distribution under CFAP.

On the flipside, Class IV value weakened at the same time as butter and powder did not have as many competing demand drivers. Additionally, butter stocks were overhanging the market, despite butter being the dairy product that saw the very highest increase in retail demand during the March through June Coronavirus shutdown period with retail butter sales up 46% over year ago.

Butter and powder production in the U.S. are mainly through co-op owned and managed facilities, while cheese production is a mix of co-op, private and mixed plant ownership.

When co-ops petitioned USDA for a temporary Class I floor hearing, most of the pushback came from the Midwest, and there were calls instead for government direct payments and cheese purchases for distribution to bring down what had been a growing cheese inventory. A stabilizer, or “snubber” on the Class I Mover calculation would have helped avoid much of this unrecouped discount on All-Milk price compared with Class III that affected most of the country.

While cheese moved to retail, foodservice, government purchases and export, butter was mainly relying on the surge in retail sales. Butter and milk powder were not draws in government CFAP purchases.

Overall, however, CFAP has not been the biggest driver in the cheese rally, according to Stephenson, although it added another demand driver to the Class III mix.

He notes that while the government CFAP purchases included a lot of cheese, those purchases accounted for 10% of the cheese price rally in June and July. The rest was fueled by retail demand staying strong and restaurants reopening and refilling supply chains, along with strong demand for other dairy products at retail, such as fluid milk. Producers were also pulling back to avoid overbase penalties. These factors combined to reduce cheese production in May and June, while demand drivers reduced inventory vs. demand.

Other dairy products also saw higher retail demand and were included to some degree in the USDA’s CFAP purchases, but without the same level of visible pull for the trade.

Import/export and inventory equation differs for Class III vs. IV

In taking a closer look at imports and exports relative to inventory to gauge differences between the product mix for Class III vs. Class IV, there are some key differences on both sides of that equation.

Exports of cheese in May were up 8%, and whey exports up 16% over year ago, according to U.S. Dairy Export Council.

Meanwhile butter and butterfat exports were down 7% in May, and down 21% below year ago year-to-date.

Powder exports did break records up 24% for May on skim milk powder. Whole milk powder exports were up 83% in May and 44% year-to-date.

On the import side of the equation, cheese imports were down 13% in the March through June period vs. year ago, according to USDA’s Dairy Import License Circular.

Non-cheese imports, on the other hand, were up 37% above year ago at the same time.

One factor hanging over Class IV markets is the butter inventory — up 11% over year ago — despite significant draw-down month-to-month and retail sales volume being almost 50% higher than a year ago throughout the Covid period.

While U.S. dairy imports are dwarfed in volume by U.S. exports, overall, it is notable that the 37% increase in non-cheese imports included 17% more butter and butter substitute imported compared with a year ago during the March through June period and up 28% year-to-date. Furthermore, whole milk powder imports were up by 25% in the March through June period.

Looking ahead

In a dairy market outlook recently, both Stephenson and professor emeritus Bob Cropp said these wide swings that are creating deep discounts are expected to begin moving toward more normal pricing relationships after August, with Class III and IV prices both forecast to be in the $16s by the end of the year, and in the $16s and $17s for 2021.

Already this week, CME cheese has slipped below the $2 mark, pushing August Class III futures under the $20 mark and September into the mid-to-high $16s. Spot butter tumbled to $1.50/lb, pushing Class IV futures down into the low $13s — keeping the divergence between Class III and IV in place.

Experts encourage producers to be thinking more holistically about the milk markets in planning risk management and not to look at Class III as the leading indicator of which direction the market will take.

This makes any discussion of “margin” based on a Class III milk price irrelevant to the reality under the present conditions. In short, risk management tools did what they were designed to do, but new challenges on the cash price, or milk check side, will change how producers implement and use these tools, or blends of tools, in the future.

“Class III might be a wonderful market for cheese, but it’s not reflecting the entire dairy industry. Risk managers are losing margin on contracts that were meant to protect them from market risk,” says Basse.

“We normally trade at an All-Milk premium to the CME Class III. Today, that has changed dramatically,” he adds. “We are at a significant discount to the CME. We just don’t see these discounts relative to the CME. It is unprecedented.”

-30-