Analyst says global trends suggest ‘mediocre’ year in 2021

Huge new cheese processing capacity is negative, a somewhat ‘balanced’ global powder inventory is positive

During the Dairy Financial and Risk Management Conference held virtually by Center for Dairy Excellence via Zoom, Matt Gould of Dairy Market Analyst Inc. showed how four long-term global dairy cycles were anticipated for 2017 through 2020 and are forecasted to be mostly neutral or “mediocre” for 2021. Zoom conference screenshot

By Sherry Bunting

HARRISBURG, Pa. — Back in December of 2019, “No one thought 2020 would be a bad year. What wallops you over the head are the unknowns,” said Matt Gould, president of Dairy & Food Analyst Inc. last Wednesday during the Center for Dairy Excellence Risk Management Conference held virtually. The list of over 100 attendees was a v‘who’s who’ of dairy market analysts, brokers, cooperative marketers, consultants and lenders with a sprinkling of farmers.

As for the 2021 outlook sitting here in September with so many unknowns, Gould said the consensus is next year will be a “mediocre” year for dairy markets.

“We can only talk about the known-knowns, with plenty of room for surprises,” he said, focusing on four long-term trends through forecasting models.

From a high level view, Gould said the conflict between indicators that are price-supportive and indicators that are price-negative will temper each other to be more-or-less “a wash in terms of market direction” – except for the influence of surprises one way or the other.

He discussed these trends within the context of how a producer’s milk check is figured, looking at cheese and whey setting the Class III price and butter and nonfat dry milk setting Class IV.

Putting some emphasis on the huge new cheese production facilities coming into operation at the end of 2020 and first quarter of 2021 in both the U.S. and Europe, Gould’s forecast for product prices included low cheese prices next year, stable butter prices, and the highest skim milk powder prices the world has seen in a long time.

The 3-year cycle

The 3-year cycle is still one of the four patterns that most people are familiar with. Historically, it has done a good job of reliably nailing the highs and lows, but not how high or how low, said Gould.

It is also the simplest of the four major patterns. If 2018 was the low in a 3-year cycle, then 2021 will be the next low – 2006, 2009, 2012, 2015, 2018…. 2021.

The global milk supply cycle

The second cycle Gould talked about was the global milk supply cycle, and this cycle is “neutral-ish” for 2021.

Globally, there is milk production growth, but it is not surging, said Gould.

“That’s the good news. We don’t have this wall of milk coming at us, but the flip side is that we don’t have a big contraction either to set us up for really good milk prices like in 2014,” he explained.

Globally, farmers have grown milk production through June, but only by 1 billion pounds per month. “When we cross that 1.5 to 2 billion pounds per month threshold, that’s the guard rail. That would be excessive over-supply territory,” said Gould. “We want some growth to keep balance with demand. There is rising dairy demand as the population grows and the middle class rises, but if we get over that guard rail, then growth becomes inventory.”

So, on global supply as a cycle, 2021 is neutral because global production is growing, but at a pace that should mirror demand growth.

The inventory cycle

On the global dairy inventory side, Gould said the set up into 2021 is “more price supportive.” Mainly because the global supply of the world’s balancing product – milk powder – is on the tight side of adequate.

“When we have big powder inventory, it overhangs the market and prices tend to be lower. Spikes happen when the trade is drawing down supply or when there is no overhang,” said Gould.

Heading into 2021, he said the dairy market with respect to global milk powder inventory “is in a price inflationary zone. We don’t have big inventory and we’re not setting up to build big inventories, so the risk of a good year for milk prices is still in there within this inventory cycle.”

The inventory cycle is setting up to be a price supportive one for 2021.

The trade cycle

Over the past 20 years, the world has gone through a period of booking trade agreements rapidly and aggressively. “We got new customers, grew exports, saw new opportunities and new demand,” said Gould. “The bad news is we have not booked any new WTO-style agreements in a long time.”

Gould explained that WTO-style agreements are the kind that give dairy access to new markets that grow quickly as opposed to more sales within existing markets that grow slowly.

Those WTO-style agreements of the past presented a “trade tailwind” fueling rapid market growth. “This lack of a trade tail wind is price negative for 2021,” said Gould. “The long-term view shows a lack of new global demand growth, which will hurt us.”

Gould acknowledged that the U.S. is getting a new style of trade agreement. “We have trade negotiations ongoing with several countries and we have taken existing agreements and negotiated new ones with the same customers. So, we are seeing new market access but not the advantages of WTO-style access.”

Gould sees the change from rapid growth to steady access in this trade cycle as setting up to be price negative.

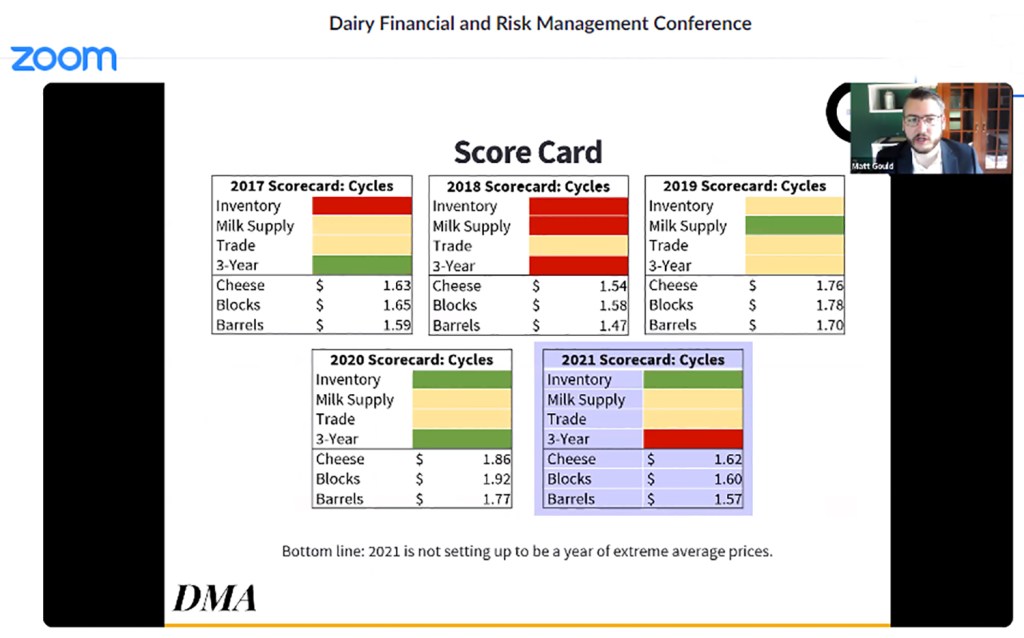
Taken together, these four cycles show 2021 setting up with two neutrals, one negative and one positive.

Class III and IV expected to flip

As the indicators will be mixed, so will dairy product markets.

Gould’s cheese forecast is for an average $1.62/lb and his forecast for nonfat dry milk is that prices could reach $1.23/lb.

In farm milk checks, said Gould, it’s no simple task how milk prices get determined. “We use end products so it’s not a question of what the milk is worth, but what these products are worth, and it subtracts-out the cost of making the products and a yield factor too.”

Ostensibly, the Class II prices uses Class IV and the Class I price uses all the classes.

With Class III so much higher presently than the other classes, Gould noted the switch is setting up to flip for 2021.

Milk powder prices are expected to rise into and through 2021 because the big surpluses are gone and 2019 production kept pace with demand, which ended up drawing down on global powder supplies even further, with 2020 being more in balance heading into the first half of 2021.

While a penny change in nonfat dry milk price brings 8 cents to Class IV price a penny change in butter equates to 4 cents change in the Class IV price. Powder will be the more positive side of the 2021 setup compared with butter, according to Gould.

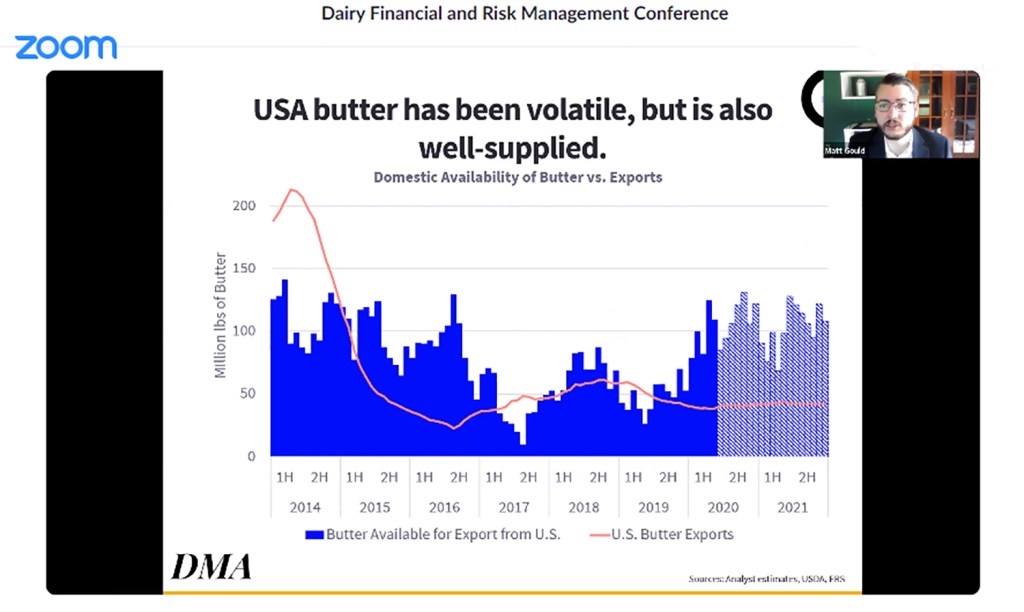
“The global butter market in 2020 saw big destruction of food service demand, which affected cheese, so processors (globally) made more butter, and foodservice is not using as much butter,” said Gould.

“In the short-term, there is an overhang of butter inventory, especially in the U.S., where we had big destruction of demand and the lowest butter price since 2013,” said Gould. “But people call me and say they can’t find butter on the shelf at the store, so how can this be?”

How can we have the lowest wholesale butter price and not be keeping up with retail demand?”

Gould explains that 55% of U.S. butter consumption pre-Covid was foodservice – going out to eat. In this pandemic environment, the foodservice industry has been devastated. Open Table, a company that books restaurant reservations estimates foodservice is still down by half and full-service restaurants are decimated.

“On the flipside, retail butter sales have been extraordinary at times, with some weeks more than doubled over year ago,” said Gould. But plants in the U.S. are specialized moreso than in Europe where dairy plants are more flexible making more different products instead of specialized for high volume and efficiency.

Matt Gould, Dairy Market Analyst Inc. talked about the differing market and inventory conditions for dairy products into the end of 2020. U.S. butter exports are down, imports are up, and U.S. butter inventory has been built up. Globally, butter is well supplied as more versatile plants in Europe switched from cheesemaking to butter when Covid-19 shut down the restaurant trade.   Zoom conference screenshot

“Where we have the bottleneck in the U.S. is turning bulk butter into quarter pound sticks for retail,” he said, adding that in the past21 days, retail butter sales have slowed to show smaller growth rates over year ago.

In short, while holiday sales will help boost fourth quarter, it won’t make much difference in the overall butter picture because “we’ve already gone through the demand destruction and the inventory is already built. We have more butter in stock than we have domestic sales so we are in surplus,” said Gould.

Gould did not specifically mention the large imports of butter and butterfat into the U.S. from March through July, but he did reference the bottleneck in turning enough bulk butter into sticks for retail. As this pushed retail butter prices higher, Gould noted that importing was incentivized.

Cheese is where some “known surprises” come into play.

The U.S. will see significant new cheese production capacity becoming operational in November (Michigan) and the beginning of 2021 (Minnesota).

“Every one penny in cheese price change is 10 cents of change on the milk check,” Gould pointed out. “As a globe, we are in relatively balanced to tight supply on cheese in the second half of 2020, but the forecast heading into 2021 is driven by the factories and capacity being built.”

He said the long-term export trend for cheese is positive. It has been a “winner” during Covid because the big cheese purveyors are pizza companies that were the first to adopt low and no-contact delivery and saw their sales surge 20% higher.

But new cheese processing capacity in the U.S. and in Europe will present short-term concerns.

“We will see huge growth in cheese processing,” said Gould. The plant in St. John’s Michigan as a joint venture of DFA, Select and Glanbia will be the sixth largest in the country.

“We have never opened a plant in the U.S. that big – that fast – in history. This is a first, and these types of plants have to be run full, or you will lose your tail,” he said, noting these types of plants in the American cheese business operate on margins of 0.5% (one half of one percent). “They’ll make a penny on a $2/lb cheddar price. That’s why they fill full and build to scale and magnitude to make volume.

“The consequence of that is a shock increase in supply,” said Gould. “Demand doesn’t grow that same way. We don’t wake up and see new demand present itself as a shock-increase like that.”

Some wild cards do exist, including government intervention. What we’ve seen already this year in dairy purchases is greater than dairy has seen in a long time.

“Government purchases (CFAP) are using 2.5 to 3% of the U.S. milk supply,” said Gould. “Normally we forecast within 1% to say a year will be good or bad, but when those purchases end, we are talking about 2.5 to 3%. That’s a huge number. That’s a price negative thing if all of a sudden there’s 2% more milk on the market without government purchases.”

The flip side, he said, is “We are going through a crisis, and people are hungry. When you have hungry people, the prescription is to get them food.”

In this way, government purchase could be a positive wild card if they continue under circumstances where economic slowdown impacts domestic demand. 

Other wild cards of course include the progress on a vaccine for Covid, and the status of the economy and foodservice. Positives in those areas could unleash demand for products that can be made quickly in bulk without the bottlenecks of serving retail demand.

— Previously published in Farmshine, Sept. 25, 2020

-30-

Global thoughts Part 4: As exports grow, who benefits from ‘new math’?

GlobalThoughtsPart4_Chart#2 (1).jpgBy Sherry Bunting, originally published in Farmshine, June 7, 2018 and examines the utilization of domestic Class I fluid milk vs. exported commodities during the worst three months of pricing at the beginning of 2018, but the trends show how FMMO pricing no longer provides the value to farmers for their milk as exports increase. Read Global Thoughts Part One, Part Two, and Part Three.

BROWNSTOWN, Pa. — U.S. dairy exports posted record-high 2018 first-quarter volumes (see Chart 1), representing 17.3% of U.S. milk utilization on a milk equivalent basis, according to the U.S. Dairy Export Council (USDEC). (Note, the average Jan. through Oct. was 16.3%, still a record high.)

This, against the backdrop of Class I milk utilization falling to 29% of Federal Order pooled milk but just 18.9% of total milk production in the first quarter of 2018 (Chart 2).

In fact, Federal Order pool reports for first quarter 2018 showed Northeast marketings 1.8% below year ago as pool receipts fell due to reduced production. At the same time, other FMMO pools recorded declines in pool receipts, which USDA confirmed by email were largely due to shifts in pooling or strategic despoiling to prop up Class I utilization percentages. (For example the pooled first quarter receipts in the Appalachian Order were up 6% while down 5.5% in the adjacent Mideast Order.)

globalthoughtspart4_chart#1
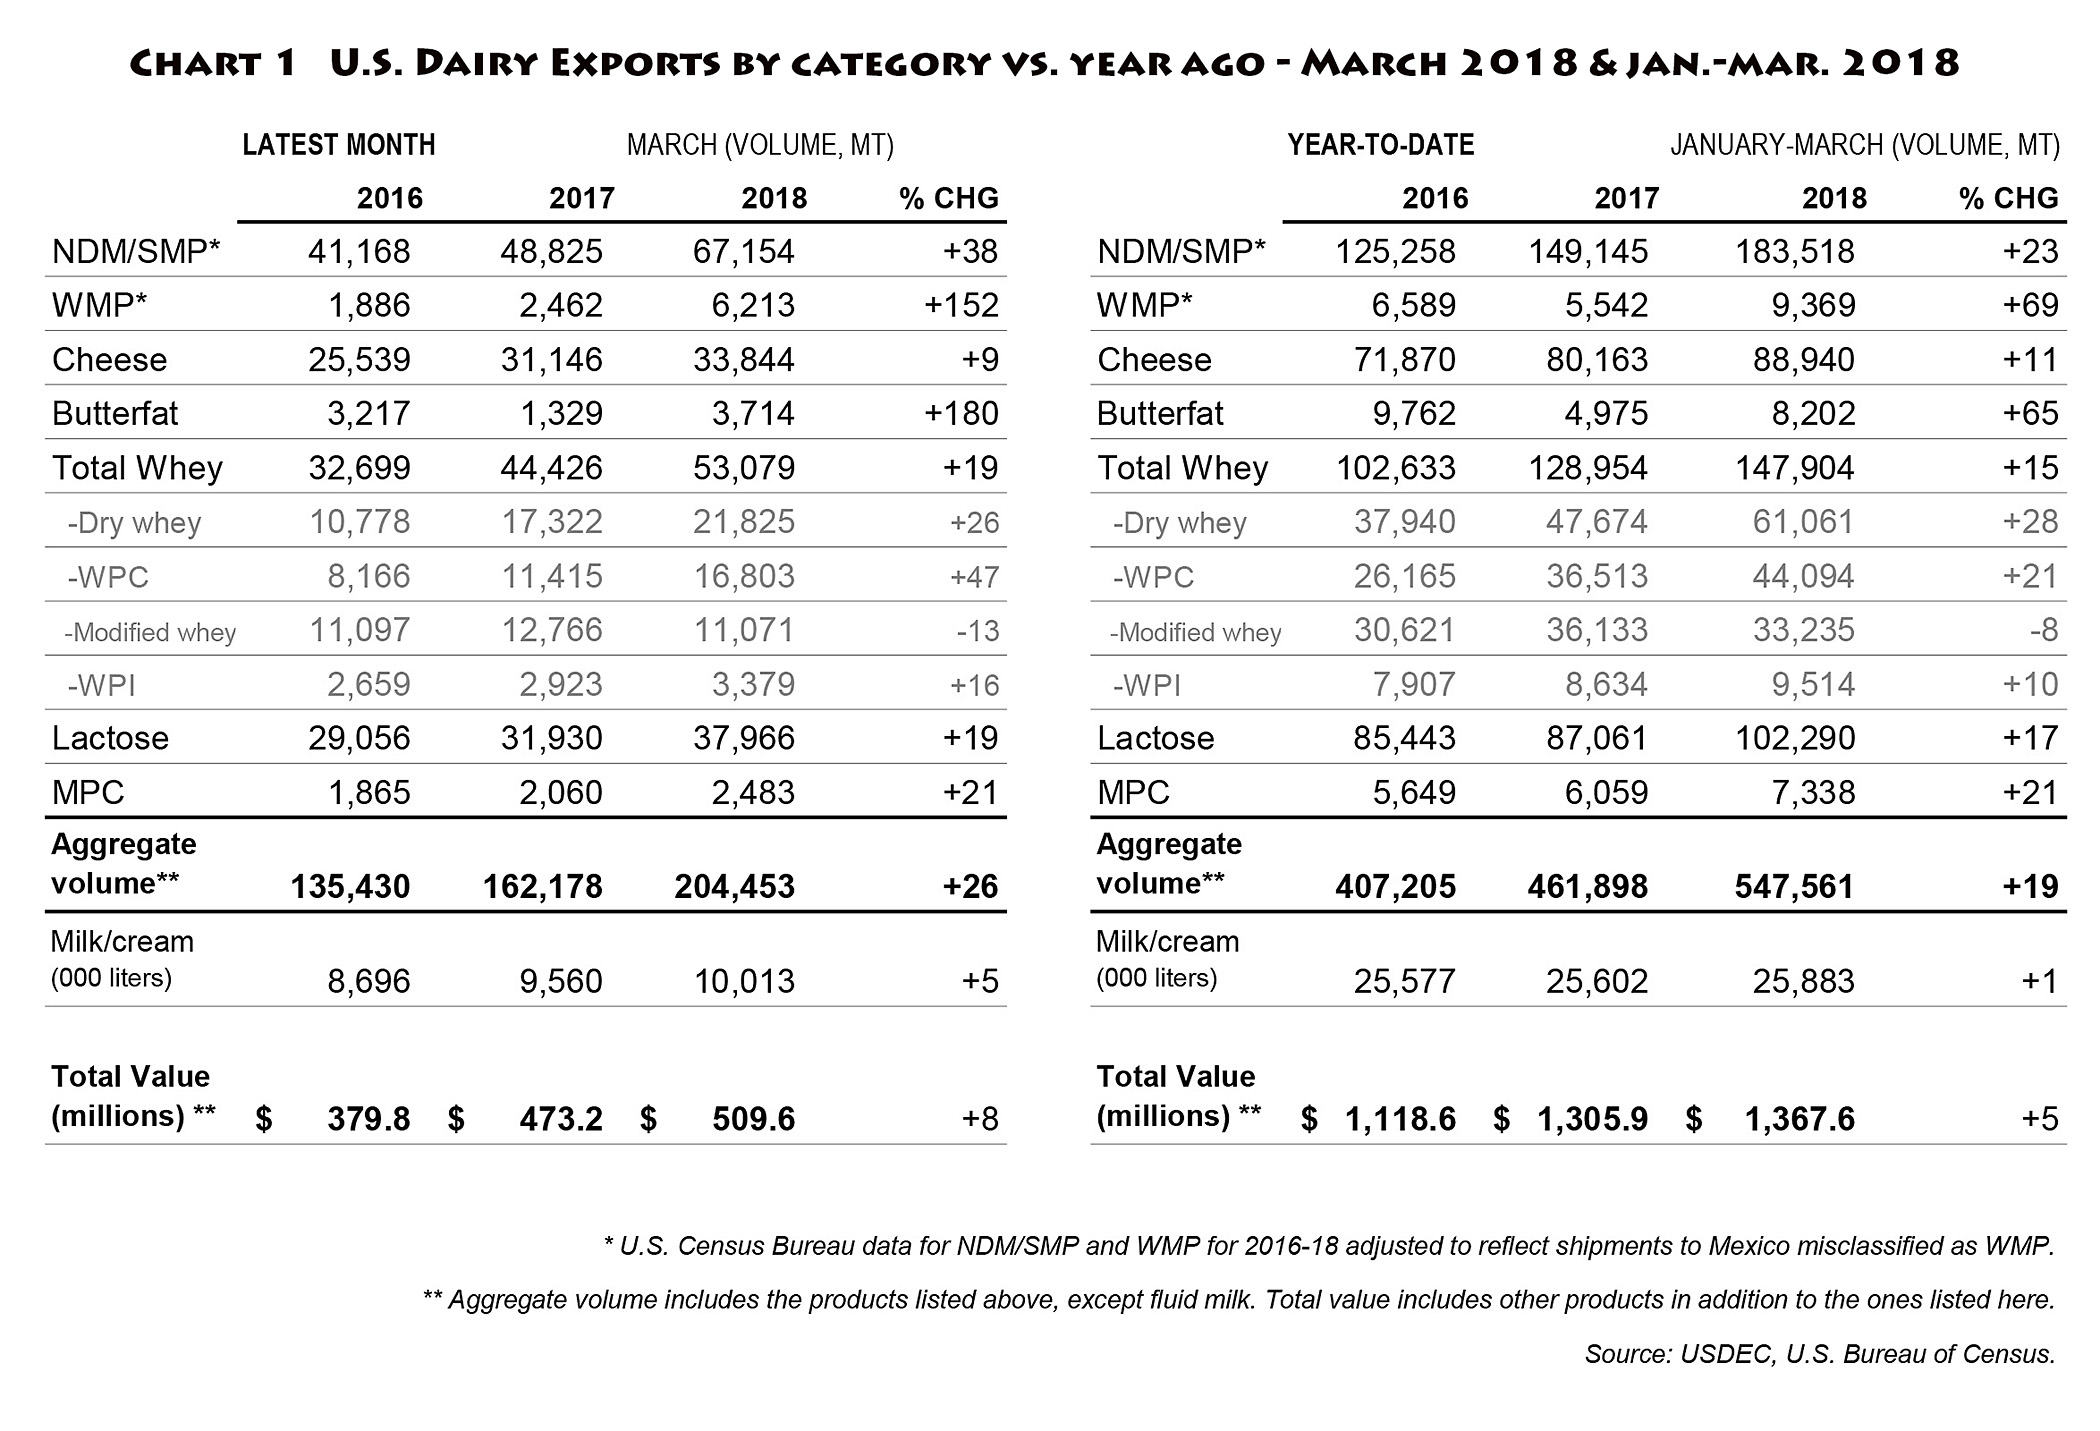
The total “official” U.S. Class I utilization for 2017 was 26.1%, down nearly 10% from 35.9% in 2009, according to USDA figures.

However, the Northeast Market Administrator’s most recent bulletin (April) observed that the real percentage of total U.S. milk production used for Class I fluid sales in 2017 was just 22.3%!

Bob Younkers, chief economist for the International Dairy Foods Association (IDFA), analyzed fluid milk trends, reporting in February that the 2017 fluid milk losses, alone, represented 20 million fewer pounds (2.3 million fewer gallons) of milk sold daily – nationwide – in 2017 vs. 2016. In addition to the blow dealt to producer milk checks, Younkers points to how the fixed costs of bottling increase when spread across fewer gallons of milk sold.

Coming into 2018, not only have first quarter Class I sales declined 1.5% compared with first quarter 2017, the Class I utilization percentage fell by even more — down 2.5% below year ago — in part because exports grew to this new first quarter record of 17.3%.

Left unchecked, the current math trend shows that as U.S. exports reach the goal of 20% set by the U.S. Dairy Export Council (USDEC), the percentage of milk utilized in export sales will very soon equal and surpass Class I utilization as a percent of total milk production.

Who benefits from this new math?

If the current classified pricing system — and its Class I regulation — must continue, perhaps the growing export utilization should have its own class formula tied directly to export pricing and representing growth milk in the U.S. system so that the other 80% of milk pricing can be more stable and reflective of serving that large anchor-base of domestic consumption?

Survey the experts on this idea and they’ll tell you an export class for U.S. milk pricing is a non-starter because of trade agreements and WTO. But trade agreements are being renegotiated and others in the global markets have mechanisms in play.

Perhaps instead of going after Canada’s export class implemented because of expanded production due to higher consumer demand for fat, the U.S. could learn from what’s being done north of the border with this pricing mechanism to match exports prices and products to growth milk that goes into products strictly for export?

This is not an idea that goes against free trade, but one that recognizes the U.S. as a free-trader in need of fair trade leverage for producer pricing.

The U.S. must be competitive enough to have its products arrive at other ports, so that it can remain competitive enough to keep other products from arriving at its ports — where a large market for dairy already exists. In Part Three, we looked at some of the product differences.

 But there’s another catch to this romance with export markets. They can be unstable and unpredictable, and while we make more of the globally significant products today than in 2008, our product mix and flexibilities are different than other successful exporting nations.

Would an export class allow pricing of growth milk — a percentage of the nation’s production or a percentage of production in high growth areas — to be aligned to the fluctuating global markets for globally-significant products with a margin to attract necessary investments in manufacturing flexibility and innovation? Such alignment could, at the same time, allow a more stable and profitable base price for milk going into dairy products for domestic consumption?

After all, we are increasing exports to levels that are approaching the falling Class I utilization percentages and yet NONE of the globally-significant products and/or prices are even used in the arbitrary U.S. Federal Order pricing formulas, to which location differentials are added to ensure the Class I price is always higher (more on this when we tackle logistics in a future part of this series).

As dairy exports become the new epicenter of U.S. marketing, a different light is cast on these regulatory pricing structures.

Let’s look at the differences between global and domestic pricing and trading platforms.

 For starters, price announcements to dairy producers in New Zealand are based on the actual value of global sales with producers buying shares of processing capacity for the quantity of milk they expect to produce. As milk falls short or exceeds those pegs, payout announcements are adjusted based on the relationship of the production to the sales.

In Europe, producers also see milk prices that reflect the value of what is sold not a formula like in the U.S. that leaves key products, prices and markets out of the math equation.

While Europe’s quota system has ended, the EU commission intervenes with purchases. Processors more nimbly shift between products to adapt to market changes. And if they miss in their projections — as they did in the shift to making more powder when the Russians stopped buying cheese and butter due to the economic sanctions — the EU commission intervened to buy and stockpile that powder to a degree that still is blamed for suppressing the global market for powder and holding back the U.S. milk price recovery.

In addition to differences in pricing, there are big differences between global and U.S. price discovery and trading platforms.

While the CME daily spot market in Chicago went electronic last year, the Global Dairy Trade (GDT) biweekly internet auction has always been an electronic platform.

The GDT engages more buyers and sellers, offers contract sales that are near-term and forward-looking to create what is essentially a 2-month ‘spot’ price, according to Bialkowski and Koeman’s November 2017 study at the University of Canterbury New Zealand of spot market design in relation to the success of futures markets.

They explain the GDT biweekly auction is a vehicle for Fonterra to market 30% of its production and to provide a global exchange for other sellers like Dairy Foods of the U.S. and Arla of Sweden.

The GDT auction includes many products and ingredients — from bulk cheese and butter to whole milk powder, skim milk powder, anhydrous milkfat powder, buttermilk powder, lactose powder, milk protein concentrate, rennet casein and occasionally sweet whey powder. Whey protein concentrate is another globally-significant product, which the U.S. makes and exports a lot of – but that price is never considered in the FMMO classified pricing scheme either.

By contrast, the CME futures markets provide a hedging opportunity for Class III and IV milk and futures markets for the four Federal Order pricing commodities: Cheddar, butter, nonfat dry milk and dry whey. The CME also operates a daily cash “spot” market primarily for three of the four Federal Order commodities – butter, Cheddar and nonfat dry milk.

The CME trades only those specific Federal Order commodities. It is thinly traded with few buyers and sellers, although volume has increased 1 to 3% in the past year since the change to an electronic trading platform.

As a spot market for hedging, Bialkowski’s analysis described the CME cash market as one that is less well-designed because daily ‘spot’ prices are market-clearing and used retroactively in government pricing formulas, with a pricing delay built in, while GDT auction contracts offer pricing points for delivery one to four months forward.

The biweekly GDT prices are always based on actual sales because all product offered is sold. And those sales are weighted to calculate a weighted average for each product as well as an overall weighted performance index for the dairy trade.

The CME spot market, on the other hand, pegs its daily spot prices on the activity occurring in the final moments of its 15-minute daily trading session.

As we saw on a few occasions earlier this year, a CME trading session had multiple loads change hands at specific prices, but the daily spot price was determined by a lower last-minute offer.

Access to the market is also different. CME traders must simply have product to sell and meet payment and delivery terms to buy. The GDT, on the other hand, has a more controlled process where buyers and sellers are vetted and approved by Fonterra of New Zealand because they run the platform.

How will the U.S. dairy industry adapt to competitively manage export growth and volatility? Are changes needed in the mix of commodity pricing and milk utilization formulas that govern the regulatory pricing structures?

If industry leaders want to focus on export market growth and bring home the message that dairy farmers must accept lower prices “because we are in a global market,” then why is the government involved in regulating prices on the shrinking piece of the expanding pie (Class I) and calculating component value from just four commodities while ignoring the globally significant products and their mostly higher prices?

This is new math and it is not adding up.

A national hearing with report to Congress would help examine new thinking and take a closer look at current regulatory pricing schemes. How is price regulation affecting milk movement and location? Do these schemes return enough component value to the farms? Are the arbitrary make allowances creating winners and losers? Would truly free market forces do a better job? Or if classified pricing is here to stay, should we be aligning milk growth in the U.S. with export market growth and price it accordingly?

In Part Five, we’ll look at U.S. dairy imports and why volume is not the only important factor.

-30-

Global dairy thoughts Part 3: Do regulated milk checks reflect true value?

KYTour-223w.jpgBy Sherry Bunting, Farmshine, June 1, 2018

BROWNSTOWN, Pa. — To discuss the U.S. role in global dairy trade and the role of global trade in how the value of milk is, or is not, reflected in milk checks at the farm level, we first have to understand our product differences.

For starters, there are subtle differences between global skim milk powder (SMP) and domestic nonfat dry milk (NDFM), traders say they view the two as one market. Global SMP trends translate promptly to CME trends for NFDM.

Product listings describe SMP as a standardized product with a minimum 34% protein, whereas NFDM is variable, ranging as high as 38% protein. The U.S. price for NFDM normally lags the global price for SMP, in part because it lacks the standardized specifications. Thus, the lag is even more significant on a per-protein-unit basis.

The U.S. makes more SMP today than 10 years ago, but NFDM production, typically a byproduct of butter production, remains more than four times larger than SMP. Year-to-date SMP production through March trailed year-ago by 15% while NFDM production was up 15%.

According to the U.S. Dairy Export Council (USDEC), the U.S. exports 50% of its combined production of SMP and NFDM, and the U.S. has about 25% of the total export marketshare for these powders.

Butter is also different. Globally-traded European style butter is fermented (soured) before churning, mostly sold unsalted and contains 82 to 85% butterfat. U.S.-produced butter is churned from sweet cream that is not cultured, contains 80% fat, and is available salted or unsalted.

More European style butter is made today in the U.S. than 10 years ago, and it has curried favor with urban chefs for its cooking and baking properties.

Specialized dairy ingredients, like milk protein concentrate (MPC) and whey protein concentrate (WPC), are also significant globally and rely on specialized technologies and markets. The U.S. makes and exports a lot of whey products, WPC and WPI as byproducts of cheese production. These products have significant value to ingredient markets.

At a meeting in Lebanon, Pennsylvania last fall, Dr. Mark Stephenson, University of Wisconsin-Madison, indicated how some cheese plants view the whey products as primary to the cheese. Specialty plants have also come online to make MPC and MPI for infant formula, sports and geriatric beverages, and other products for dairy ingredient markets.

Another product that is important globally, and traded only on global platforms, is whole milk powder (WMP). It is a market equalizer. The global market performance of WMP gives insight about both the fat and the protein sides of the market.

China’s current demand for WMP may be driving what is now being described as a potential “acute” global shortage of butter.

Like whole fluid milk sales in the U.S., WMP sales globally represent whole milk finding one market rather than being broken down for various markets. Often, this product is purchased by countries that reconstitute it for drinking milk and flavored dairy beverages. The bakery and confection industries also utilize both SMP and WMP.

More U.S. plants are making WMP. Interestingly, USDA’s March Dairy Products Report showed production of WMP at 21.6 mil lbs — up 11% from February and a whopping 93% greater than a year ago. It was the highest level of WMP production since 1993.

GlobalThoughtsPart3_CHART#2
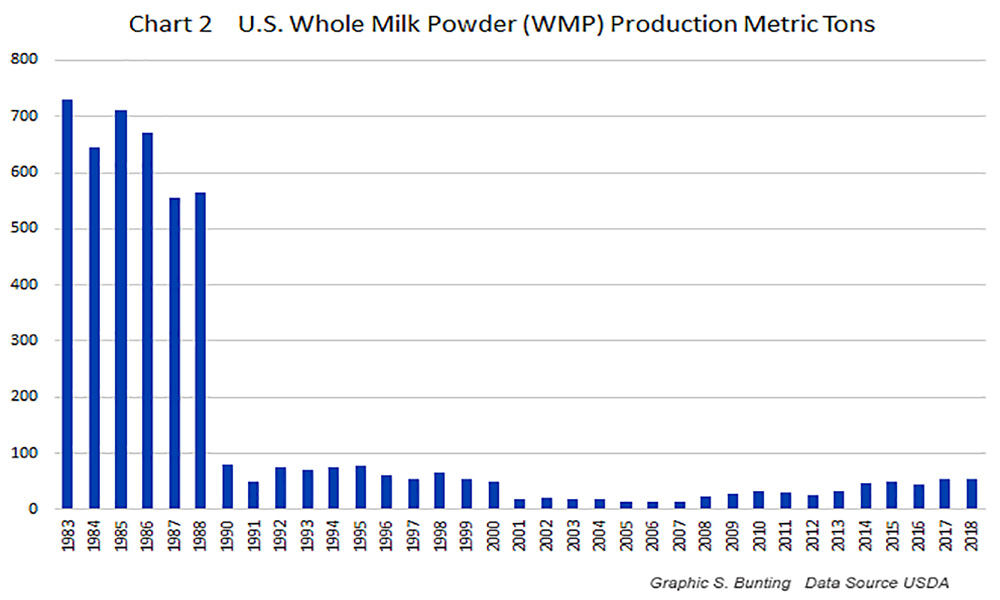
In fact, going back through USDA records to 1983, the U.S. once made up to 700 metric tons of dry whole milk powder (Chart 2). We don’t hear about that.

In the 1980s we also exported a lot of WMP, up to 420 metric tons of it (Chart 3). We don’t hear about that either.

GlobalThoughtsPart3_CHART#3One reason we don’t make more WMP today is we have a large and growing domestic market for cheese and butter and cream products. U.S. manufacturers want to keep the cream and not sell it overseas, whereas other dairy-producing nations — like New Zealand with its much smaller consumer population — make a lot of WMP for Asia.

China is a large, but erratic, buyer of WMP. In first quarter 2018, the U.S. exported 20% more WMP than a year ago, but the amounts are small compared to skim powders.

In fact, the drive of consumers away from margarine has led to greater sales and production of butter in the U.S. As more butter is made, and more cream salvaged for other products, NFDM production also increases as part of that model.

 As fluid milk sales decline in the U.S., more WMP can be made, and as whole fluid milk demand is restricted by dietary guidelines, more fat becomes available as a byproduct to dairy processors.

Right now, China is buying a lot of WMP and paying higher prices. So high, in fact, that Australia is seeing limitations in infant formula sales in their country due to China’s pull on powder stocks from that country.

GlobalThoughtsPart3_CHART_#4
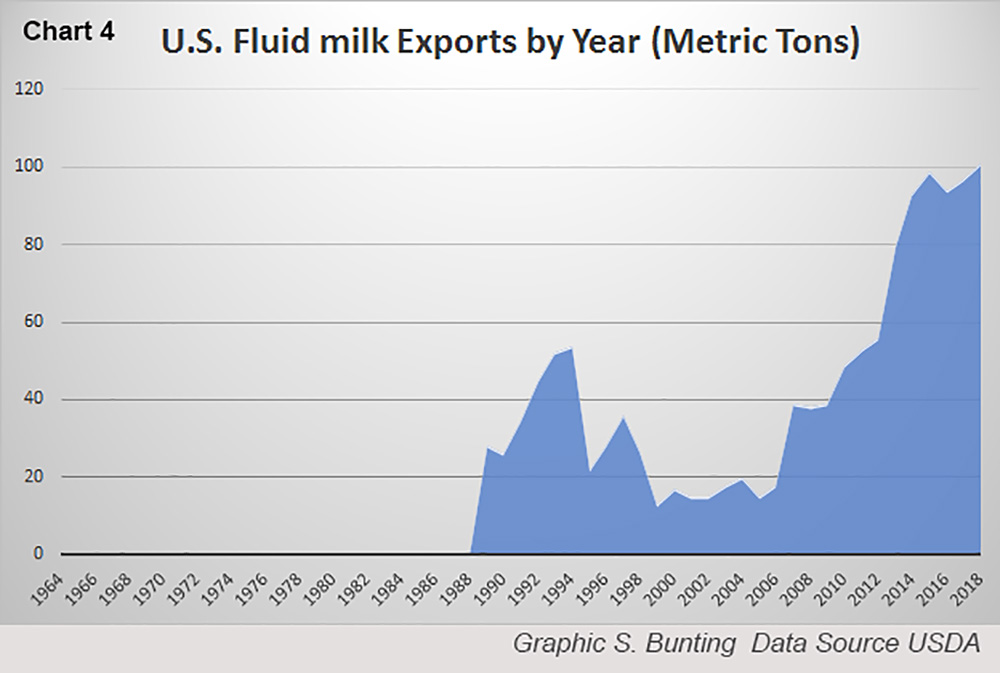
One lesser-known category of exports that grew by 85% in the first three months of 2018 is UHT shelf-stable milk. China is the biggest buyer, and DFA is a primary supplier with its California Gold, a primarily 3.5% fat, shelf-stable drinking milk with a non-refrigerated shelf life of one year. This product is shipped to Walmart and other chains in China. These sales have grown significantly since 2006. (Chart 4)

(Interestingly, here in the U.S. during the first five months of 2018, major supply-chain-related absences of whole milk from supermarket shelves — while fat free and lowfat rows are stocked full — have been observed across a wide swath of the U.S., mainly east of the Mississippi, and across a variety of supermarket chains with a sort of random consistency)

With the U.S. system set to keep the cream and export as much powder as possible, problems arise when geopolitical factors interrupt that export market pipeline. This can have big consequences in a market where demand for cream vs. skim is out of whack — in part because the U.S. dairy industry’s processing, marketing, pricing, promotion and exporting schemes have been designed to work in tandem with 40 years of flawed lowfat government health guidelines.

A national dairy pricing hearing is needed to look at the reality of today’s domestic and global markets.

Are dairy farmers receiving the true value of the milk they produce? If the true value of milk components were passed through the supply-chain to the farm level more accurately, could this help encourage right-sized production growth?

Can the pricing of “growth milk” be more directly aligned to global market growth trends? We’ll explore that in a future part of this series, and it is an important question for the industry to tackle.

In Part Four, we’ll look at the differences in U.S. and global trading platforms and pricing.

 -30-

Global dairy thoughts Part II: Who’s being creative?

Part Two of Five-part “Global Dairy Thoughts” Series in Farmshine

wGDC18-Day1-56By Sherry Bunting, from Farmshine May 4, 2018

BROWNSTOWN, Pa. — Everywhere we turn, we receive the message that fresh fluid milk is a market of the past and exports of less perishable dairy products are the wave of the future. As discussed in Part One of this ‘global dairy thoughts’ series, that seems to be the trend if you look at the markets.

Yet, could a portion of the reason we are in this fluid milk decline, be the effect of USDA-regulated pricing, USDA-imposed restraints on the ability to promote competitively in the beverage space, and the resulting industry neglect of this regulated commodity category — fresh fluid milk?

The government — USDA — and the checkoff and cooperative leadership have no appetite for significant change to any of these factors. USDA gets to pay less than it otherwise might for milk in its nutrition assistance programs, while both the proprietary and cooperative processors get to pay less than they might otherwise for components in a range of products.

Meanwhile, dairy farms see the first product to come from their herds — milk — declining, and their futures along with it.

Yes. We all know it. Fresh fluid milk — the most nutritious and natural option — is in the fight of its life. In meeting after meeting, presentation after presentation, we hear the messages from the industry and university economists — both subtly and outright.

Like this: “The fluid milk market is the dead horse we need to stop beating.”

Or this: “Do we want to hitch our wagon to a falling rock?”

And so forth, and so on.

It is difficult to question the industry and its economists on anything to do with the Eastern U.S. or the fluid milk market. Some have gone so far as to say that if the East is relying on fluid milk, they are out of luck.

Meanwhile, dairy farmers in eastern regions suggest that if fluid milk does not stabilize its losses or restore its market share — at least partially — they see their value as producers vanishing.

And in fact, this has an impact on our global advantage — that being the U.S. having a large consumer base at home to anchor the base production while growth is said to be the reason why we need exports.

As mentioned briefly in Part One, the Federal Orders are designed to move the milk from surplus regions to deficit regions, and that is what the proposed USDA change in Orders 5 and 7 will do further, the experts say.

Meanwhile, who is being creative to figure out how the deficit regions of the East can use or regain their primary competitive advantage — having a base of consumers within a day’s drive. This line of thinking is analogous to how the U.S. fits as an exporting nation with quite a large consumer base at home.

What really requires our creativity is the U.S. product mix and how milk resources are priced and sourced.

Here are some numbers. U.S. dairy protein disappearance has had average annual growth of 6.3% over the past five years, though it has been a bumpy ride, with U.S. production of milk protein concentrate (less exports) at its lowest levels over that five-year period in 2014.

Meanwhile, demand for fat is increasing as consumers heed the dietary revelations and switch from lowfat and fat-free milk to whole milk and have their butter without guilt.

Mentioned last week in part one is that global milk production increases are beyond the stable rate of 1.5% per year. According to the U.S. Dairy Export Council (USDEC), the combined growth rate from the EU-28, U.S., New Zealand, Australia and Argentina was double that collective 1.5% threshold. Looking at 2018, however, reports are surfacing to show spring flush is delayed in Europe just as it appears to be in the U.S.

Or is global production reining in? The markets are trying to figure that out with quite a rally going in powder right now.

One thing rarely mentioned in these reports is that Canada’s production has also grown with increased quota to account for the greater demand they see in their domestic market for dairy fat.

In fact, despite its supply management system, government figures show Canada’s milk production had year-over-year growth between 3 and 6% for each of the past three years, and 2018 production is off to a 5% start.

In Canada, as in the U.S., fat fortunes have changed over the past four years, so the belt has been loosened to serve that market, leaving more skim swimming around.

Canada’s new export class (Class 7) mainly pertains to this excess skim, which has reduced the amount of ultrafiltered milk they now buy from U.S. processors.

In addition, as pointed out by Calvin Covington in his presentation at the Georgia Dairy Conference in January, milk can be purchased at lower prices for this Canadian export Class 7 because the excess skim is used in products that are then exported.

This means the resulting products in the Canadian export class can be sold at globally competitive prices. While not in huge volumes, some of this product is going to Mexico.

This brings us to Mexico — currently the largest buyer of U.S.-produced nonfat dry milk, making the outcome of NAFTA negotiations a sticky issue for industry leaders, especially as Mexico recently signed a trade deal with the EU to include dairy.

The two forks come together in regions like the Northeast, where Class IV utilization has become an increasing part of the blend price and a more important balancer of the shrinking Class I.

While March showed a surprising jump in Class III utilization to a 15-year high in the Northeast, the overall trend over the past four years has been a blend price with increasing Class IV utilization and decreases in Classes I, II and III.

Dairy economists indicate the U.S. is making more world-standard skim milk powder for export, but in reality, the U.S. still makes a high percentage of nonfat dry milk (NFDM), which is still the largest domestically-produced milk powder category and it is the only milk powder that is used in the Federal Order pricing formulas.

NFDM is primarily made in conjunction with butter. As butter demand has grown and prompted greater butter production in the U.S. over the past four years, more NFDM has been made and stored (or the skim is dumped) as a result.

The market issue in the U.S. has been compounded by the EU having a mountain of intervention powder stocks in storage, some of it aging.

After the European Commission sold over 24 metric tons two weeks ago, global and domestic powder markets moved higher. It was the largest chunk to come out of that mountain to-date and was offered at reduced prices to attract buyers. But by the time the bidding was done, it sold at or above the GDT price for SMP powder.

It’s really true. Inventory depresses prices. Having a big chunk of a huge inventory gone, is, well, big.

The flip side of the coin is that European processors have shifted from powder production with their excess to making more cheese and butter.

Next in Part Three, we will look specifically at some differences between the products made in the U.S. vs. what is traded globally, and at the differences between the U.S. and global trading platforms.

-30-

PHOTO CAPTION

GDC18-Day1-56

While attending the 2018 Georgia Dairy Conference in January, a large global cargo ship on the Savannah River, passed by the glass windows at lunchtime on its way out to sea. Several dairy producers walked outside for a closer look, we all hoped there was plenty of powder on board. Photo by Sherry Bunting