
 By Sherry Bunting, originally published in Farmshine, June 7, 2018 and examines the utilization of domestic Class I fluid milk vs. exported commodities during the worst three months of pricing at the beginning of 2018, but the trends show how FMMO pricing no longer provides the value to farmers for their milk as exports increase. Read Global Thoughts Part One, Part Two, and Part Three.
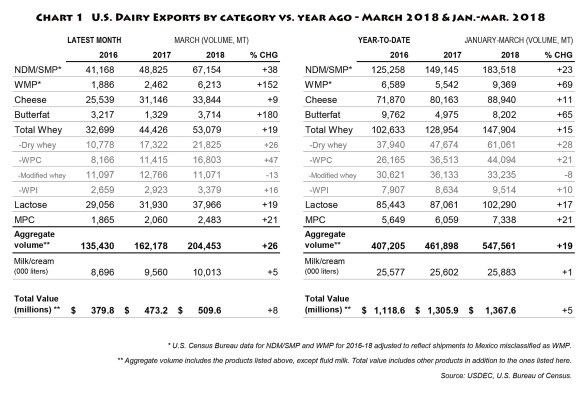
BROWNSTOWN, Pa. — U.S. dairy exports posted record-high 2018 first-quarter volumes (see Chart 1), representing 17.3% of U.S. milk utilization on a milk equivalent basis, according to the U.S. Dairy Export Council (USDEC). (Note, the average Jan. through Oct. was 16.3%, still a record high.)
This, against the backdrop of Class I milk utilization falling to 29% of Federal Order pooled milk but just 18.9% of total milk production in the first quarter of 2018 (Chart 2).
In fact, Federal Order pool reports for first quarter 2018 showed Northeast marketings 1.8% below year ago as pool receipts fell due to reduced production. At the same time, other FMMO pools recorded declines in pool receipts, which USDA confirmed by email were largely due to shifts in pooling or strategic despoiling to prop up Class I utilization percentages. (For example the pooled first quarter receipts in the Appalachian Order were up 6% while down 5.5% in the adjacent Mideast Order.)
 The total “official” U.S. Class I utilization for 2017 was 26.1%, down nearly 10% from 35.9% in 2009, according to USDA figures.
However, the Northeast Market Administrator’s most recent bulletin (April) observed that the real percentage of total U.S. milk production used for Class I fluid sales in 2017 was just 22.3%!
Bob Younkers, chief economist for the International Dairy Foods Association (IDFA), analyzed fluid milk trends, reporting in February that the 2017 fluid milk losses, alone, represented 20 million fewer pounds (2.3 million fewer gallons) of milk sold daily – nationwide – in 2017 vs. 2016. In addition to the blow dealt to producer milk checks, Younkers points to how the fixed costs of bottling increase when spread across fewer gallons of milk sold.
Coming into 2018, not only have first quarter Class I sales declined 1.5% compared with first quarter 2017, the Class I utilization percentage fell by even more — down 2.5% below year ago — in part because exports grew to this new first quarter record of 17.3%.
Left unchecked, the current math trend shows that as U.S. exports reach the goal of 20% set by the U.S. Dairy Export Council (USDEC), the percentage of milk utilized in export sales will very soon equal and surpass Class I utilization as a percent of total milk production.
Who benefits from this new math?
If the current classified pricing system — and its Class I regulation — must continue, perhaps the growing export utilization should have its own class formula tied directly to export pricing and representing growth milk in the U.S. system so that the other 80% of milk pricing can be more stable and reflective of serving that large anchor-base of domestic consumption?
Survey the experts on this idea and they’ll tell you an export class for U.S. milk pricing is a non-starter because of trade agreements and WTO. But trade agreements are being renegotiated and others in the global markets have mechanisms in play.
Perhaps instead of going after Canada’s export class implemented because of expanded production due to higher consumer demand for fat, the U.S. could learn from what’s being done north of the border with this pricing mechanism to match exports prices and products to growth milk that goes into products strictly for export?
This is not an idea that goes against free trade, but one that recognizes the U.S. as a free-trader in need of fair trade leverage for producer pricing.
The U.S. must be competitive enough to have its products arrive at other ports, so that it can remain competitive enough to keep other products from arriving at its ports — where a large market for dairy already exists. In Part Three, we looked at some of the product differences.
But there’s another catch to this romance with export markets. They can be unstable and unpredictable, and while we make more of the globally significant products today than in 2008, our product mix and flexibilities are different than other successful exporting nations.
Would an export class allow pricing of growth milk — a percentage of the nation’s production or a percentage of production in high growth areas — to be aligned to the fluctuating global markets for globally-significant products with a margin to attract necessary investments in manufacturing flexibility and innovation? Such alignment could, at the same time, allow a more stable and profitable base price for milk going into dairy products for domestic consumption?
After all, we are increasing exports to levels that are approaching the falling Class I utilization percentages and yet NONE of the globally-significant products and/or prices are even used in the arbitrary U.S. Federal Order pricing formulas, to which location differentials are added to ensure the Class I price is always higher (more on this when we tackle logistics in a future part of this series).
As dairy exports become the new epicenter of U.S. marketing, a different light is cast on these regulatory pricing structures.
Let’s look at the differences between global and domestic pricing and trading platforms.
For starters, price announcements to dairy producers in New Zealand are based on the actual value of global sales with producers buying shares of processing capacity for the quantity of milk they expect to produce. As milk falls short or exceeds those pegs, payout announcements are adjusted based on the relationship of the production to the sales.
In Europe, producers also see milk prices that reflect the value of what is sold not a formula like in the U.S. that leaves key products, prices and markets out of the math equation.
While Europe’s quota system has ended, the EU commission intervenes with purchases. Processors more nimbly shift between products to adapt to market changes. And if they miss in their projections — as they did in the shift to making more powder when the Russians stopped buying cheese and butter due to the economic sanctions — the EU commission intervened to buy and stockpile that powder to a degree that still is blamed for suppressing the global market for powder and holding back the U.S. milk price recovery.
In addition to differences in pricing, there are big differences between global and U.S. price discovery and trading platforms.
While the CME daily spot market in Chicago went electronic last year, the Global Dairy Trade (GDT) biweekly internet auction has always been an electronic platform.
The GDT engages more buyers and sellers, offers contract sales that are near-term and forward-looking to create what is essentially a 2-month ‘spot’ price, according to Bialkowski and Koeman’s November 2017 study at the University of Canterbury New Zealand of spot market design in relation to the success of futures markets.
They explain the GDT biweekly auction is a vehicle for Fonterra to market 30% of its production and to provide a global exchange for other sellers like Dairy Foods of the U.S. and Arla of Sweden.
The GDT auction includes many products and ingredients — from bulk cheese and butter to whole milk powder, skim milk powder, anhydrous milkfat powder, buttermilk powder, lactose powder, milk protein concentrate, rennet casein and occasionally sweet whey powder. Whey protein concentrate is another globally-significant product, which the U.S. makes and exports a lot of – but that price is never considered in the FMMO classified pricing scheme either.
By contrast, the CME futures markets provide a hedging opportunity for Class III and IV milk and futures markets for the four Federal Order pricing commodities: Cheddar, butter, nonfat dry milk and dry whey. The CME also operates a daily cash “spot” market primarily for three of the four Federal Order commodities – butter, Cheddar and nonfat dry milk.
The CME trades only those specific Federal Order commodities. It is thinly traded with few buyers and sellers, although volume has increased 1 to 3% in the past year since the change to an electronic trading platform.
As a spot market for hedging, Bialkowski’s analysis described the CME cash market as one that is less well-designed because daily ‘spot’ prices are market-clearing and used retroactively in government pricing formulas, with a pricing delay built in, while GDT auction contracts offer pricing points for delivery one to four months forward.
The biweekly GDT prices are always based on actual sales because all product offered is sold. And those sales are weighted to calculate a weighted average for each product as well as an overall weighted performance index for the dairy trade.
The CME spot market, on the other hand, pegs its daily spot prices on the activity occurring in the final moments of its 15-minute daily trading session.
As we saw on a few occasions earlier this year, a CME trading session had multiple loads change hands at specific prices, but the daily spot price was determined by a lower last-minute offer.
Access to the market is also different. CME traders must simply have product to sell and meet payment and delivery terms to buy. The GDT, on the other hand, has a more controlled process where buyers and sellers are vetted and approved by Fonterra of New Zealand because they run the platform.
How will the U.S. dairy industry adapt to competitively manage export growth and volatility? Are changes needed in the mix of commodity pricing and milk utilization formulas that govern the regulatory pricing structures?
If industry leaders want to focus on export market growth and bring home the message that dairy farmers must accept lower prices “because we are in a global market,” then why is the government involved in regulating prices on the shrinking piece of the expanding pie (Class I) and calculating component value from just four commodities while ignoring the globally significant products and their mostly higher prices?
This is new math and it is not adding up.
A national hearing with report to Congress would help examine new thinking and take a closer look at current regulatory pricing schemes. How is price regulation affecting milk movement and location? Do these schemes return enough component value to the farms? Are the arbitrary make allowances creating winners and losers? Would truly free market forces do a better job? Or if classified pricing is here to stay, should we be aligning milk growth in the U.S. with export market growth and price it accordingly?
In Part Five, we’ll look at U.S. dairy imports and why volume is not the only important factor.
-30-
