
By Sherry Bunting, republished from March 2023 editions of Farmshine
SAVANNAH, Ga. — Dairy checkoff-funded researchers say a new milk beverage platform is being developed to provide “the keys to the kingdom.”
Their consumer studies show people want clean labels, and at the same time they want more attributes. On the one hand, they want energy and protein. On yet anotherhand, they want indulgent creaminess.
Consumers also want flavor, but they want less sugar. They want sweeteners, but not artificial sweeteners. They want thickness without the thickeners. They do not want gums or gels, but they are okay with fibers and starches.
Some consumers want higher protein products. Others want everyday nutrition that is reasonably priced.
These are some of the highlights that were shared back in January 2023 during the Georgia Dairy Conference in Savannah. There, Dr. MaryAnne Drake, professor of food science at North Carolina State University and director of the Southeast Dairy Foods Research Center talked about the fluid milk innovation work funded through DMI.
The ‘new milk beverage platform’ leverages different processing applications for flavor and functionality around dairy protein, based on global protein trends in a rapidly growing nutritional drink market.
ESL shelf-stable milk: key to kingdom?
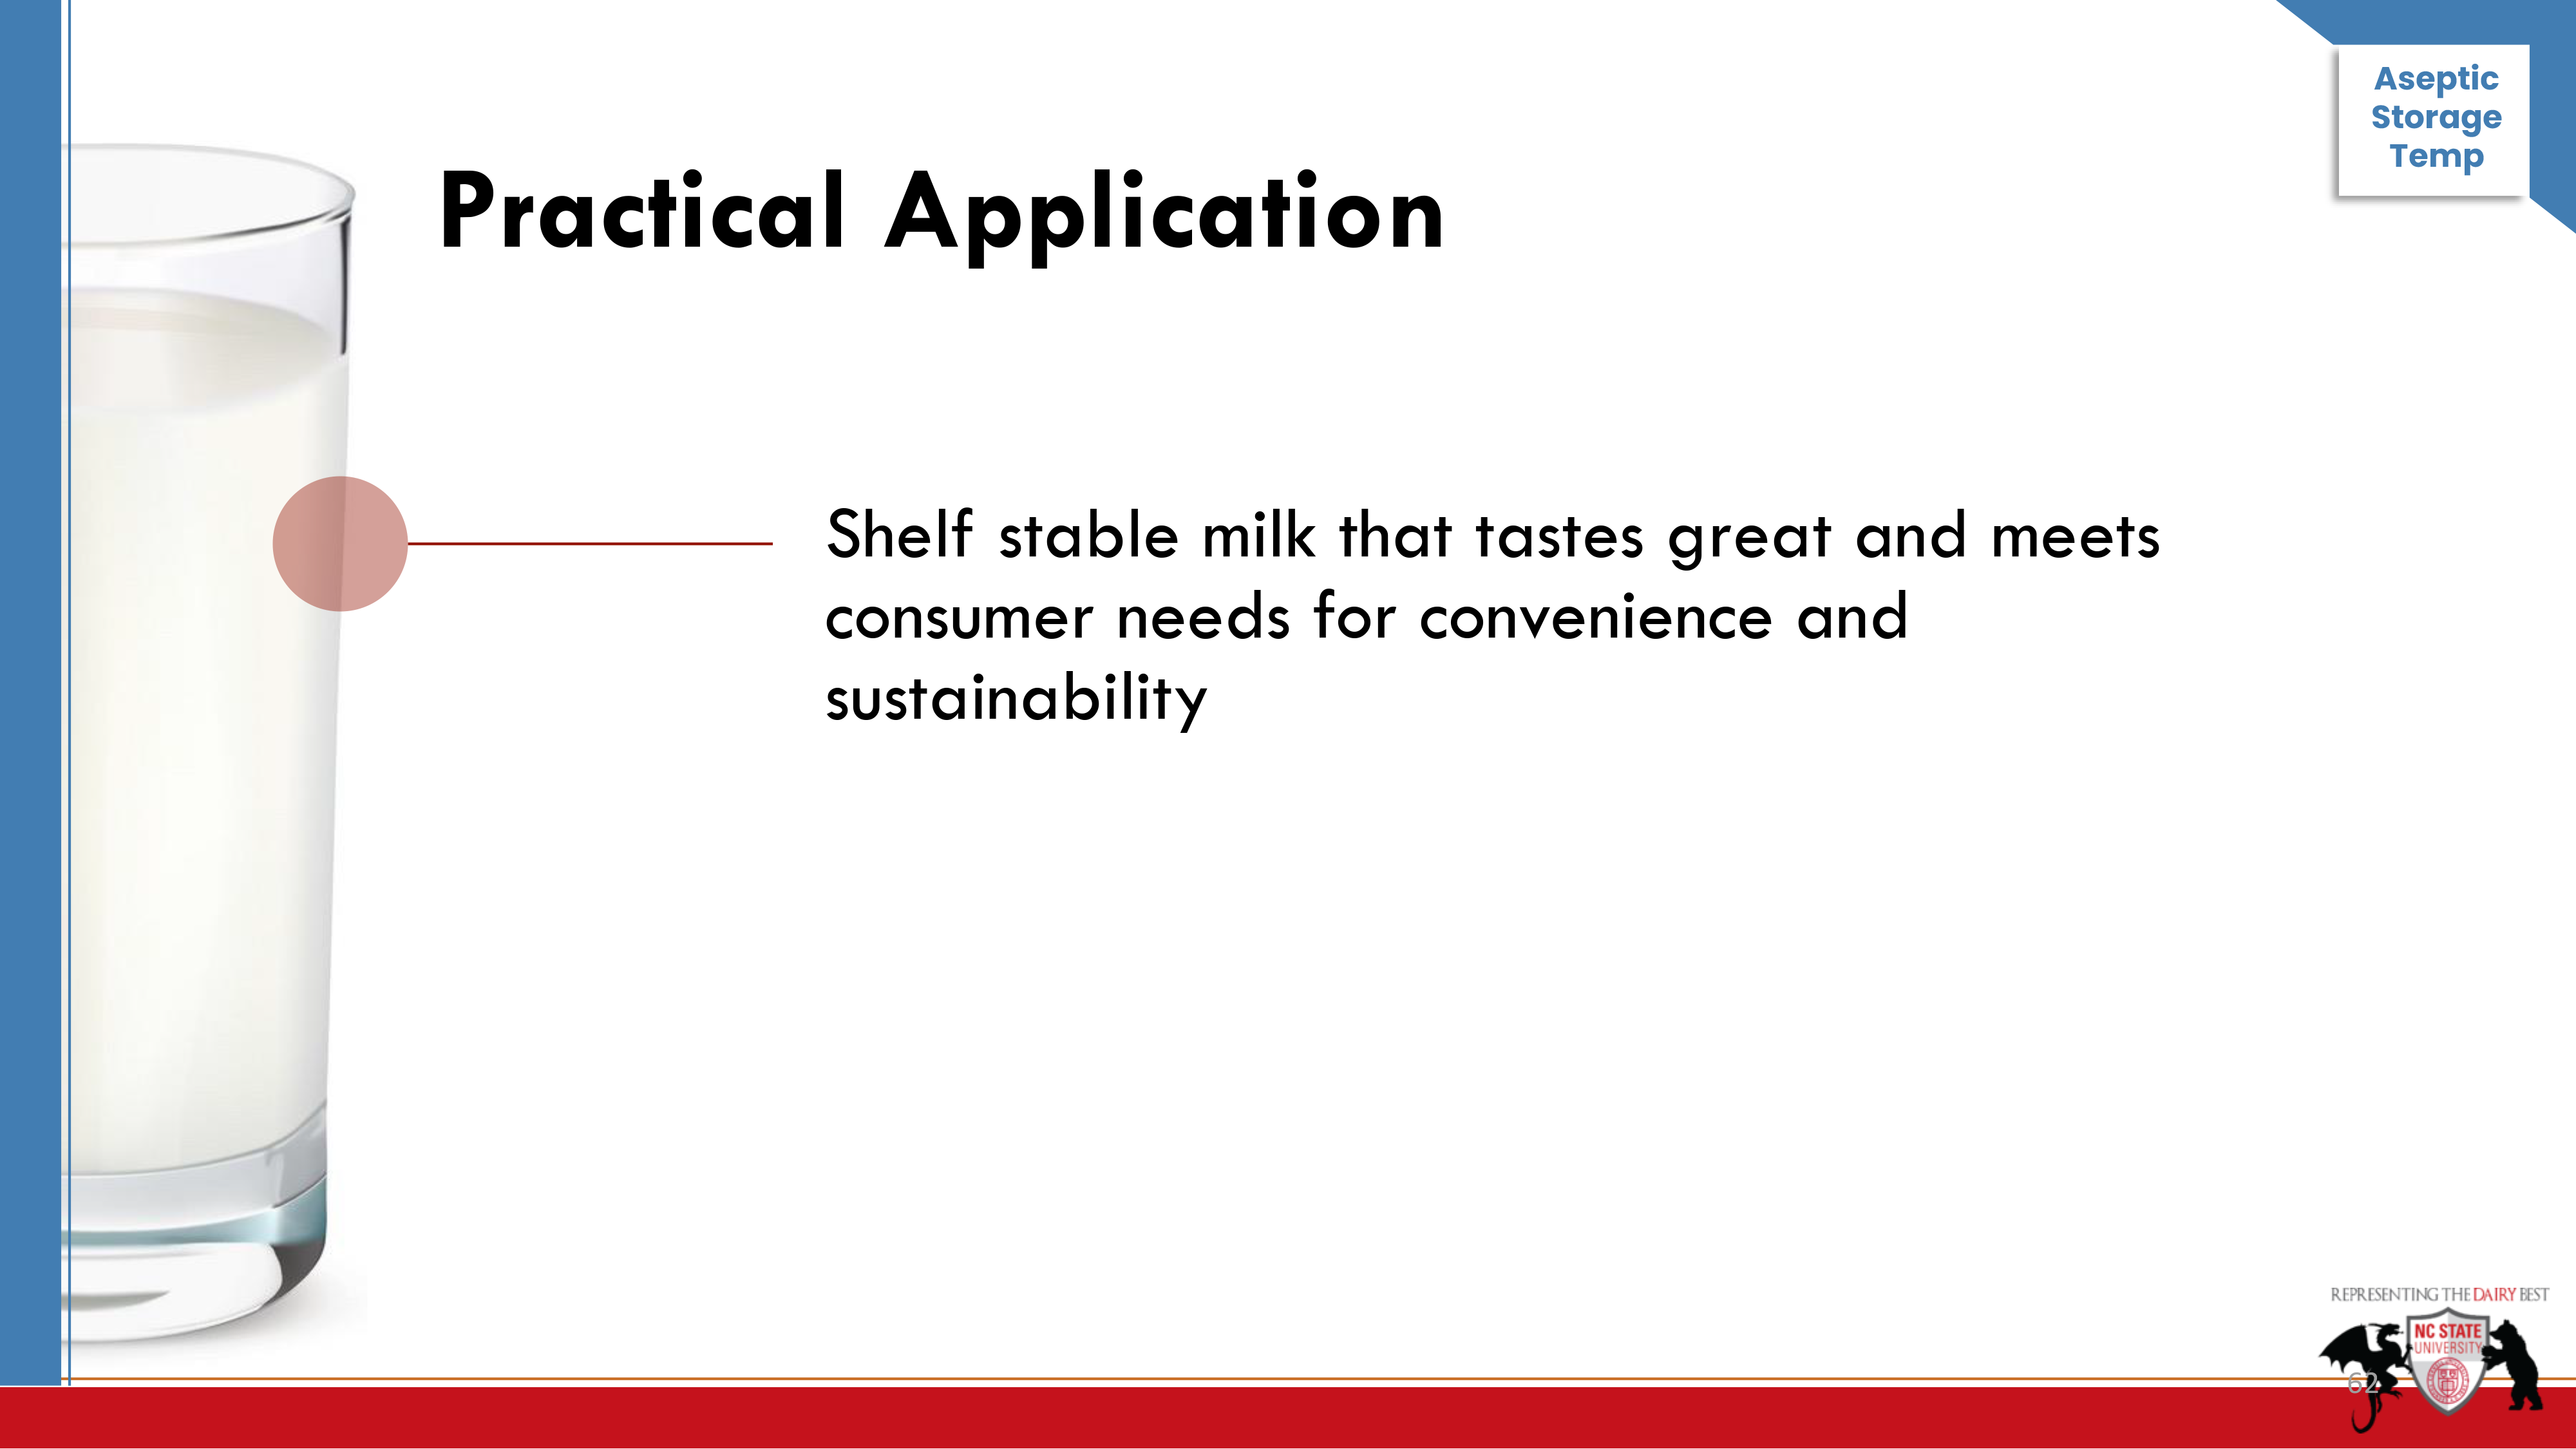
“We are after a shelf-stable milk that tastes great and meets our consumer’s sensory needs and our industry’s sustainability needs,” said Drake about the work of the four university research centers, including North Carolina State and Cornell, that are drilling into milk’s elements to sift, sort, and test different combinations, as part of the checkoff-funded Innovation Center for U.S. Dairy, under the DMI umbrella.
Through processes like membrane technology, ultrafiltration, and aseptic packaging, the physical, nutritional and sensory elements of milk are being isolated at a molecular level to create beverages that aim to deliver this broad list of what consumers say they are looking for.
At the same time, researchers are using interpretive surveys to understand how consumer desires actually translate into purchases, and then work with processors to build relationships with retailers to get these new beverage products into stores.
Reinventing milk
What does all of this mean? Reinventing milk by focusing on the domains in which real milk has a clear advantage for consumers among so many plant-based and now cell-based options.
For example, said Drake: “Consumers want to know from a credible source what the immune-boosting elements are in milk, not what we have added. They tell us they want to know the science. That’s new.”
Drake explained that the findings from their interpretive surveys represent a huge and divergent set of innovations to sort through and capitalize on as part of a new strategy.
“Consumers don’t see the perceived value of animal protein vs. plant protein, so we had them graph what they want and don’t want, what they know and don’t know,” she said, adding that consumers gave the slight edge to plant protein over dairy protein. They rated the top three protein categories as plant protein, whey protein, and milk protein — in that order. (A large percentage believed whey protein is plant protein.)
As their familiarity with the differences between plant and animal protein increased, their liking of dairy protein increased, the researchers learned.
In other words, consumers do not know the science about the nutritional differences between plant and animal protein, and if they knew the differences, they would rank milk protein as number one.
Clearly, this is a failure in consumer education and messaging. Isn’t that the domain of the dairy checkoff?
New strategy
Drake indicated that educating consumers about dairy protein as a ‘complete protein’ is one thing that can help. However, she said, the functionality around dairy protein is the innovation strategy that is being pursued by the industry.
“The number one label claim consumers are looking for in a protein beverage is ‘naturally sweetened.’ We own that, and this is where we can deliver,” Drake declared.
“We own protein functionality. We understand the process parameters that impact flavor and functionality, and we can leverage this over plant proteins on this platform,” she said.
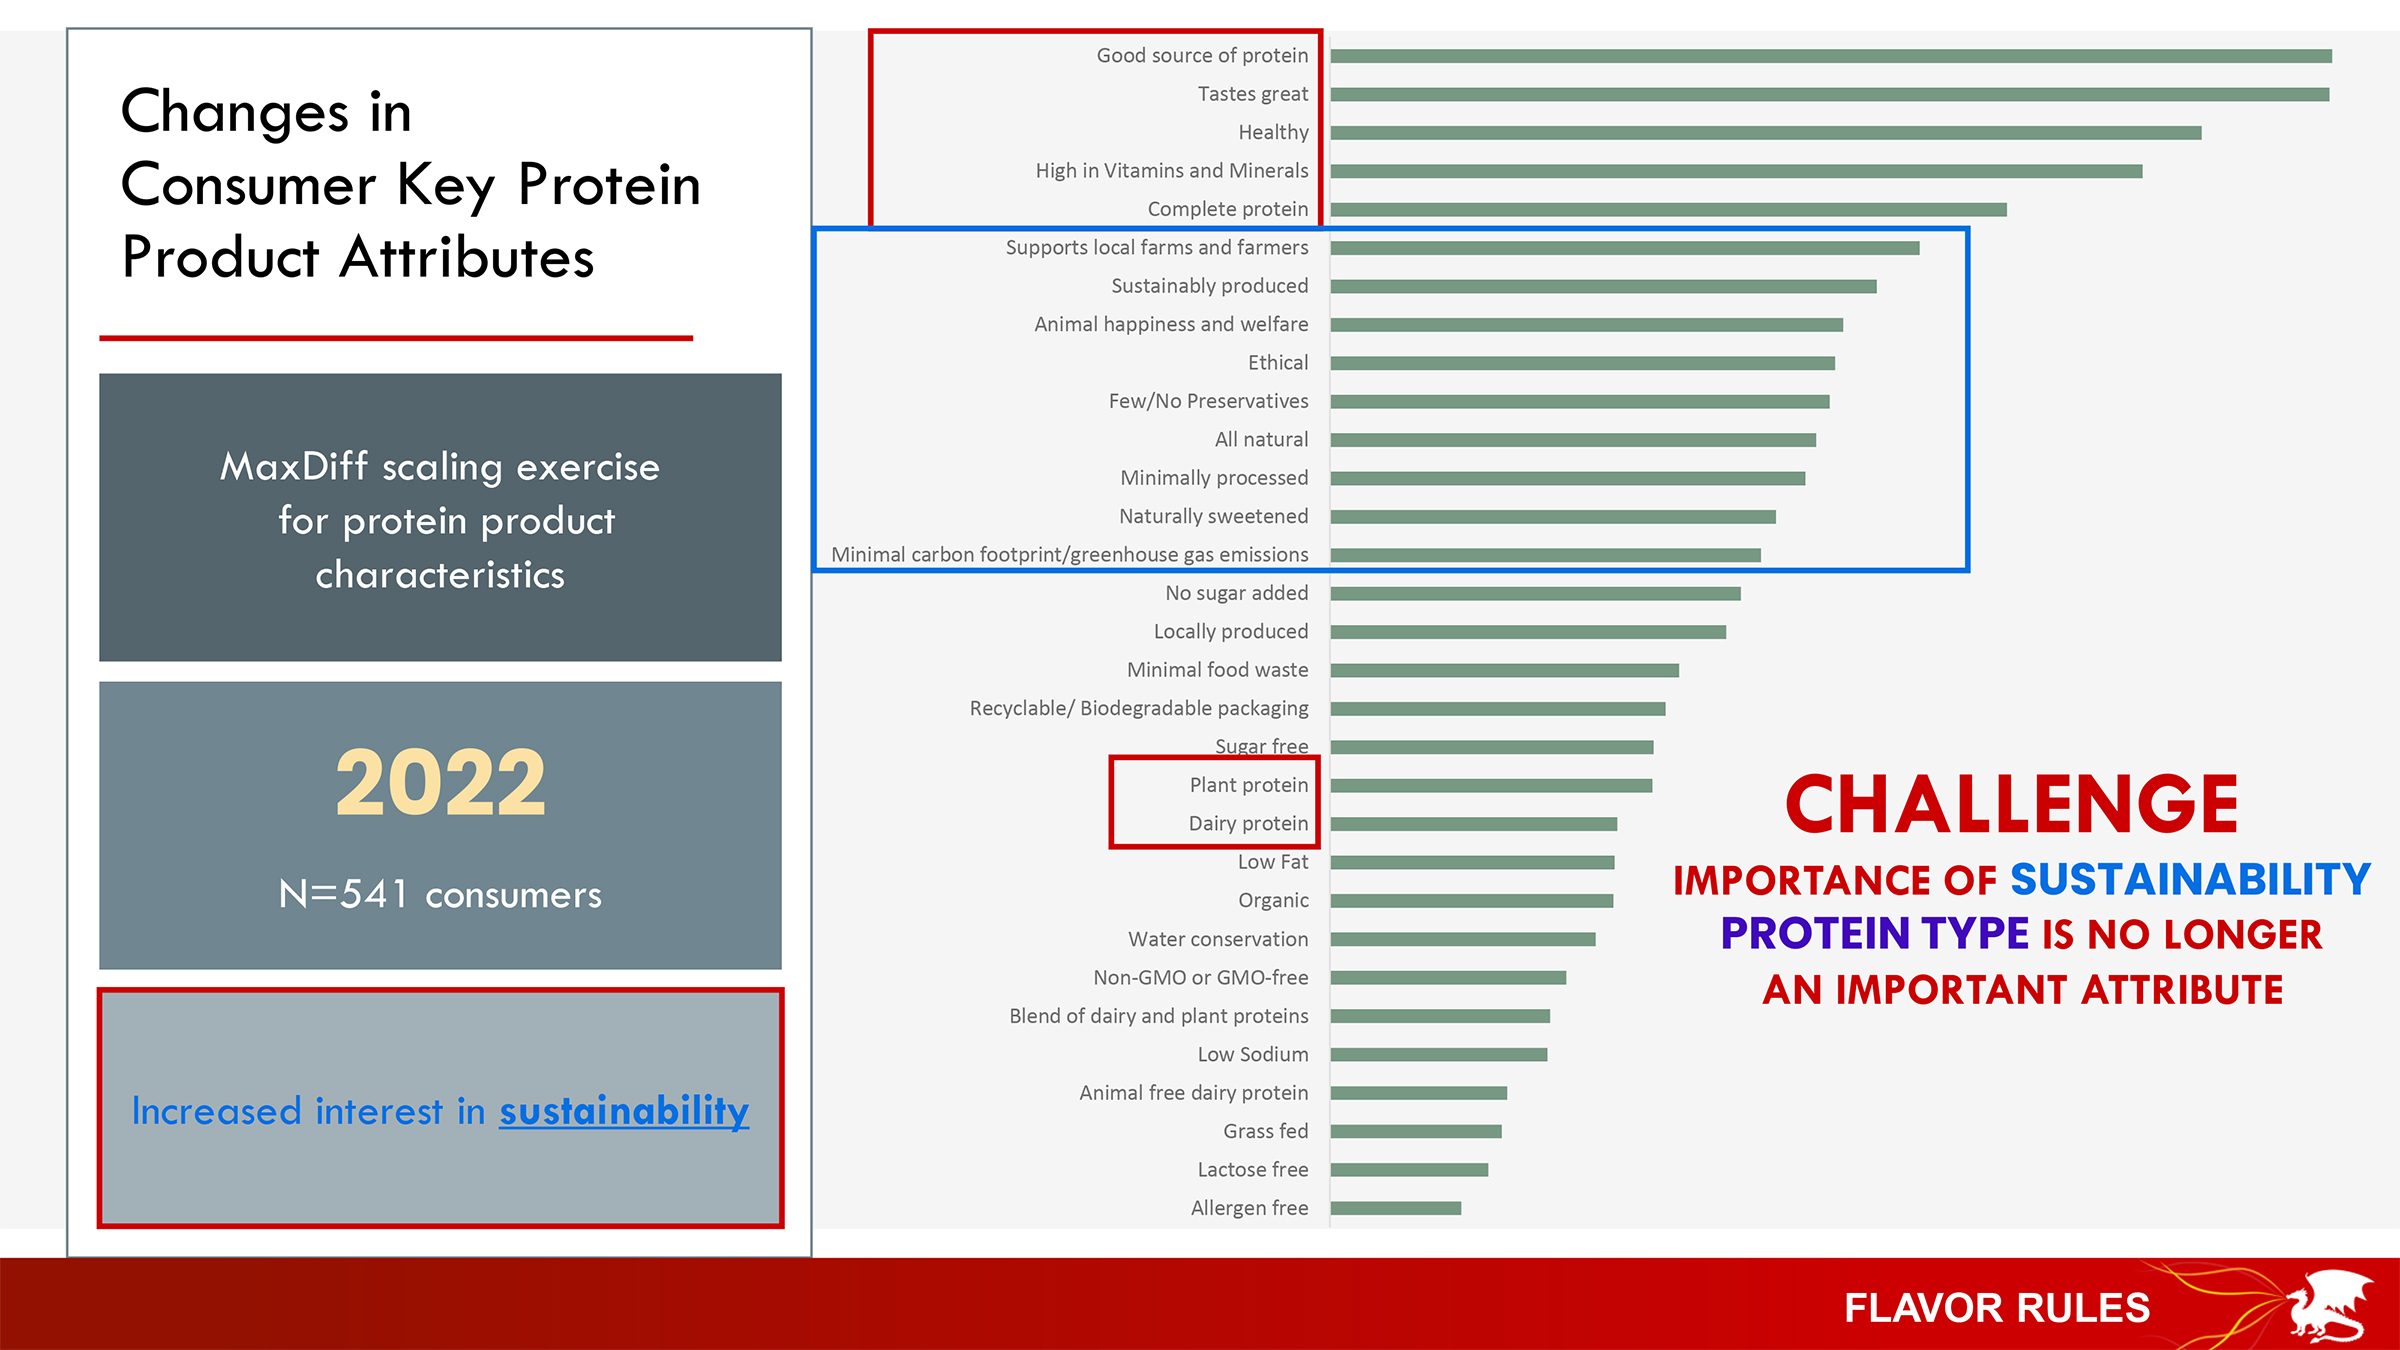
Bottom line: The surveys and flavor panels showed that consumers want “desirable flavor, texture and appearance. They want a protein drink that is nutritious, naturally sweetened, and has a clean label with simple ingredients,” said Drake.
“They also want education, messaging and positioning, and they are looking at sustainability,” she added.
“We are working on what does clean label mean? It’s not what we think it is,” Drake reported. “It’s costing us sales if what they actually want is not on the shelf. We have the opportunity to deliver what consumers still want. We just have to find those things they want — that we have — and be more strategic in how we deliver them.”
Food technology and engineering was a big part of the picture painted for attendees that day.
Diversify processing
Producers were urged to challenge the status quo and to not just add processing, but to diversify it. They were also reminded that the 10 southeastern states had lost eight fluid milk plants in the previous roughly two-year period (2020-22).
During his annual market outlook that year, retired co-op executive Calvin Covington hit the nail on the head with this reminder, saying “that’s done some damage. The major challenge for milk markets in the Southeast is we need more of them,” he said. “A lot of the fluid milk products that are sold in the Southeast are not processed here. If we are going to have a viable dairy industry in the Southeast, we need growing and stable markets for milk produced in the Southeast.”
Covington also differentiated the trends for domestic and export demand, showing that both lagged their respective 5-year-average annual growth in 2022, with domestic demand growing by just 0.5%, while exports grew by 3.5%.
Keeping in mind as exports are expected to top 20% of U.S. milk production on a total solids basis in the next two years and fluid milk sales as a percentage of total milk production have fallen to just under 20%, seismic shifts are already occurring in the heavily fluid milk market of the Southeast.
Transformation brings investors
Geri Berdak, CEO of Dairy Alliance, the Southeast regional checkoff organization, talked about “creating a path forward” with objectives centered on driving milk volume, increasing dairy’s reputation and transforming dairy while building checkoff support.
She said transformation is necessary to “identify high-growth opportunities and stimulate outside investment, technology and innovation.”
The need for processing is big as plants are closing in response to declining fluid milk demand, leaving the the need for more diverse processing assets.
Exports drive innovation
“The biggest thing exports do is to drive value and innovation,” said Patti Smith, a food technology specialist and CEO of DairyAmerica, now wholly-owned by California Dairies Inc. (CDI) milk cooperative. Earlier in her career, Smith held a leadership position with Fonterra and has served at board and officer levels with IDFA and USDEC.
“Exports are a lot more than powder today. Our biggest item is still excess powder,” she said. “But we also export many other products — even UHT (ultra high temperature) and ESL (extended shelf life) fluid milk and cream.”
What Smith sees into the future are “opportunities for the right products and the right product configurations. We have the opportunities to capitalize on them and the technologies to grow them.”
Smith said the biggest benefit of exports to-date is to have a home for milk that grows the dairy industry without relying on core domestic demand for that growth, but that U.S. dairy processing infrastructure is not quite reflective of the new export era.
“We need to make our industry world renown, through a strategic plan that the whole industry will work on together, with digitized supply chains and infrastructure for growth that is reliable and can be consistently demonstrated, and that includes shipping,” said Smith, citing the Innovation Center for U.S. Dairy as the nexus, where the industry’s “strategic plan” for global trade is being built.
Developing ‘new milk beverage platform’
Emanating from the DMI-founded and checkoff-funded Innovation Center for U.S. Dairy is the marketing and promotion arm of new product alliances and the National Dairy Research arm through several universities looking to essentially create a milk beverage platform by drilling into milk’s elements, sifting, sorting and testing different combinations.
Dr. Drake said the new milk beverage platform holds the “keys to the kingdom” as global protein trends were valued at $38.5 million in 2020 and projected to grow. Meanwhile, the nutritional drink markets are growing steadily, with 42% of consumers eating healthy as a higher priority since Covid, and the number of conversations about protein (95% positive) steadily flowing across social media platforms.
Those keys, she said, are membrane technology, ultrafiltration, aseptic packaging and research exploring all of the physical, nutritional and sensory elements of milk at the molecular level to bottle up what consumers say they are looking for, while also gauging through interpretive surveys how this translates to purchases, and then working with processors to build relationships with retailers to get new products into stores.
Drake shared details about the roadmap to play to dairy’s strengths through nutrition, education, capitalizing on calming and immune benefits and using dairy protein functionality to limit added ingredients in beverages to satisfy the clean label trend.
She talked about how elements like fat, protein and lactose at different levels impact milk’s flavor and appearance: “We want to determine the impact of ultrafiltration levels for different concentrations of fat and protein for different sensory or physical experiences.”
She talked about ultrafiltration in conjunction with aseptic packaging for shelf-stable storage using an elaborate diagram of processes.
Bottomline, she said: “The chemistry of these (aseptic) milks is different.”
She described consumer flavor panels where shelf-stable and fresh fluid milk were served cold and compared. The flavor panels evaluated two different storage temperatures for the shelf-stable milk.
The North Carolina researchers worked with their Northeast Dairy Foods Research counterpart at Cornell and with Byrne Dairy, running grad students from North Carolina to Syracuse, New York when batches were available for study. (The Southeast and Northeast as well as Midwest and California Dairy Foods Research Centers all receive funding from checkoff and other sources.)
‘Training consumers’
“Consumer panels still liked the HTST (fresh fluid) milk best overall, but in 14-day and 6-month follow up, we found we can train them,” said Drake, reporting the two best storage temperature options for aseptic milk saw longer-term increase in acceptance.
HTST is the acronym for High Temperature Short Time pasteurization that is basically commodity fresh fluid milk vs. ‘value added’ UHT (ultra high temperature) and ESL (extended shelf life) as well as aseptically-packaged, which is milk processed for longer shelf life and then bottled in a special sterile process and package to last months without refrigeration, but will taste best served cold.
Schools are the gateway
“For 25 years, consumers have not liked aseptic milk,” said Drake, “but we are changing that. Consumers may not like it or want it, yet, but it is great for schools.”
She reported the practical applications to come up with “great tasting school lunch milk that contains no lactose (no natural sugar).” Another practical application is to “determine the impact of storage temperature of 1% aseptic milk on physical and sensory properties.”
This partially checkoff-funded research is also working on “changing the chocolate milk formula to have zero sugar,” she said. “When we think about school milk, the question is how to get the sugar out of it. We want a chocolate milk that tastes great and new government standards on low- or no-added-sugars. Right now, chocolate milk has 8.5 grams of added sugar and 12 grams of natural sugar (lactose).”
In addition to ultrafiltration removing natural sugar, or lactose, they are exploring “non-nutritive” sweeteners like monk fruit and stevia. Additionally, they are looking at “lactose-hydrolized” to boost the flavor profile at much lower levels of sugars or other sweetener.
Whether talking about consumers or children, parents, and schools, the milk beverage platform is tricky “They want to know from a credible source what the immune-boosting elements are in milk, not what we have added. They tell us they want to know the science. That’s new.
“We have a huge and divergent set of innovations to sort through,” said Drake.
-30-


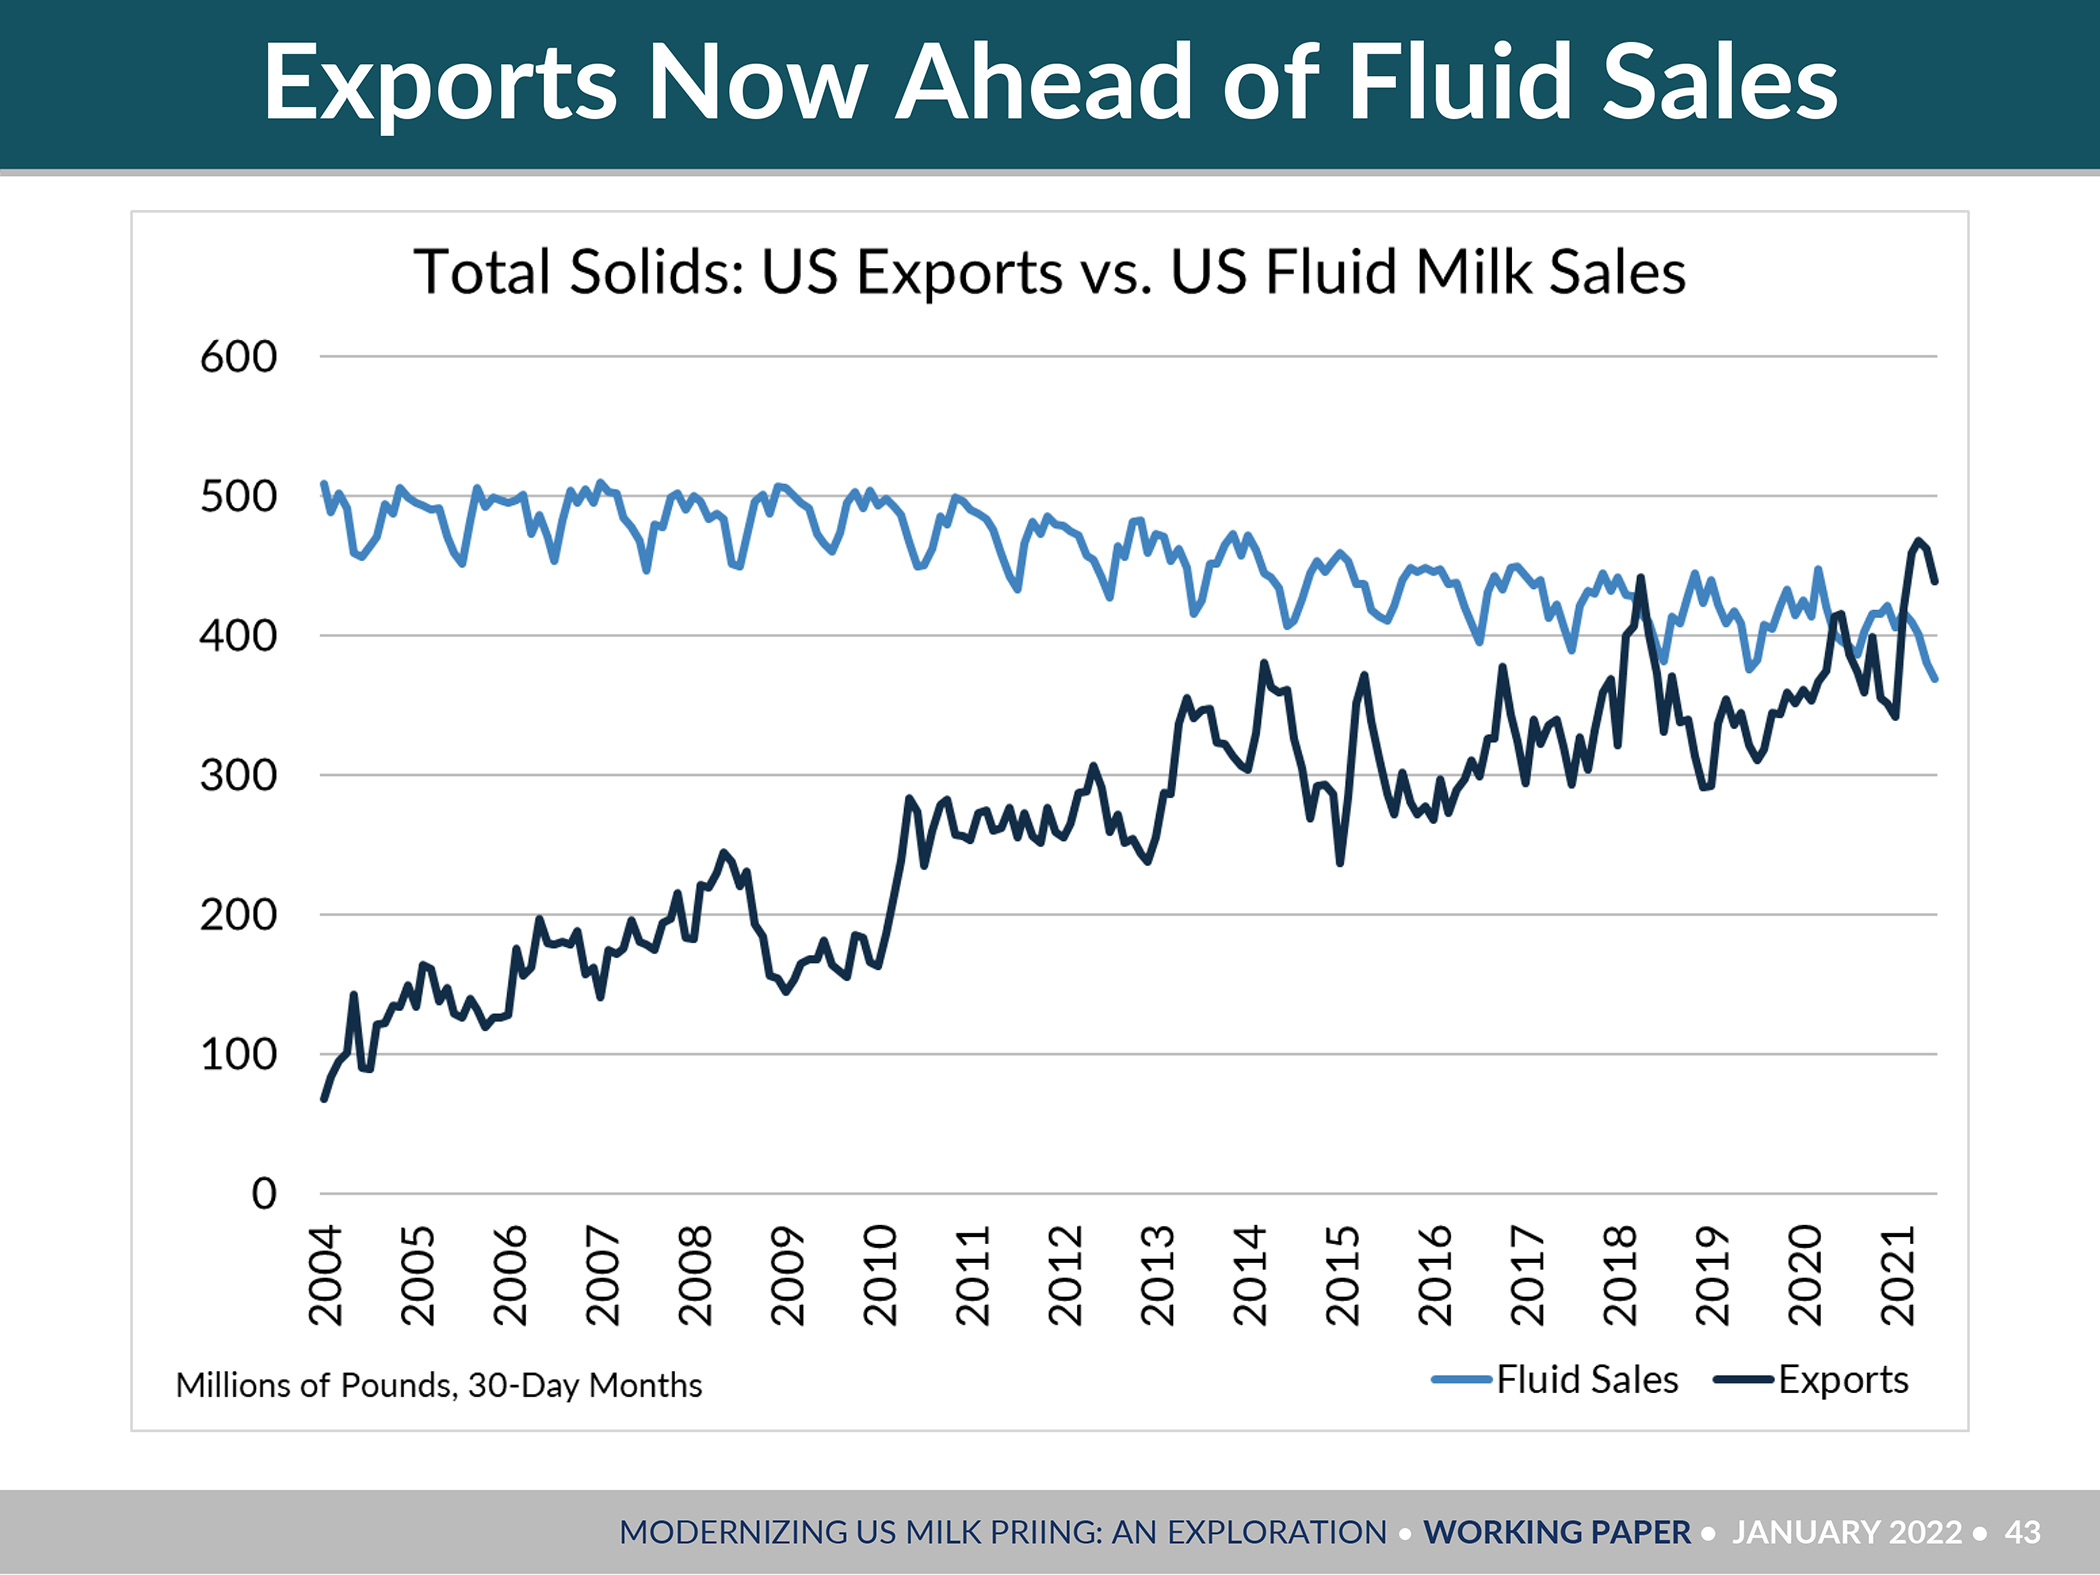
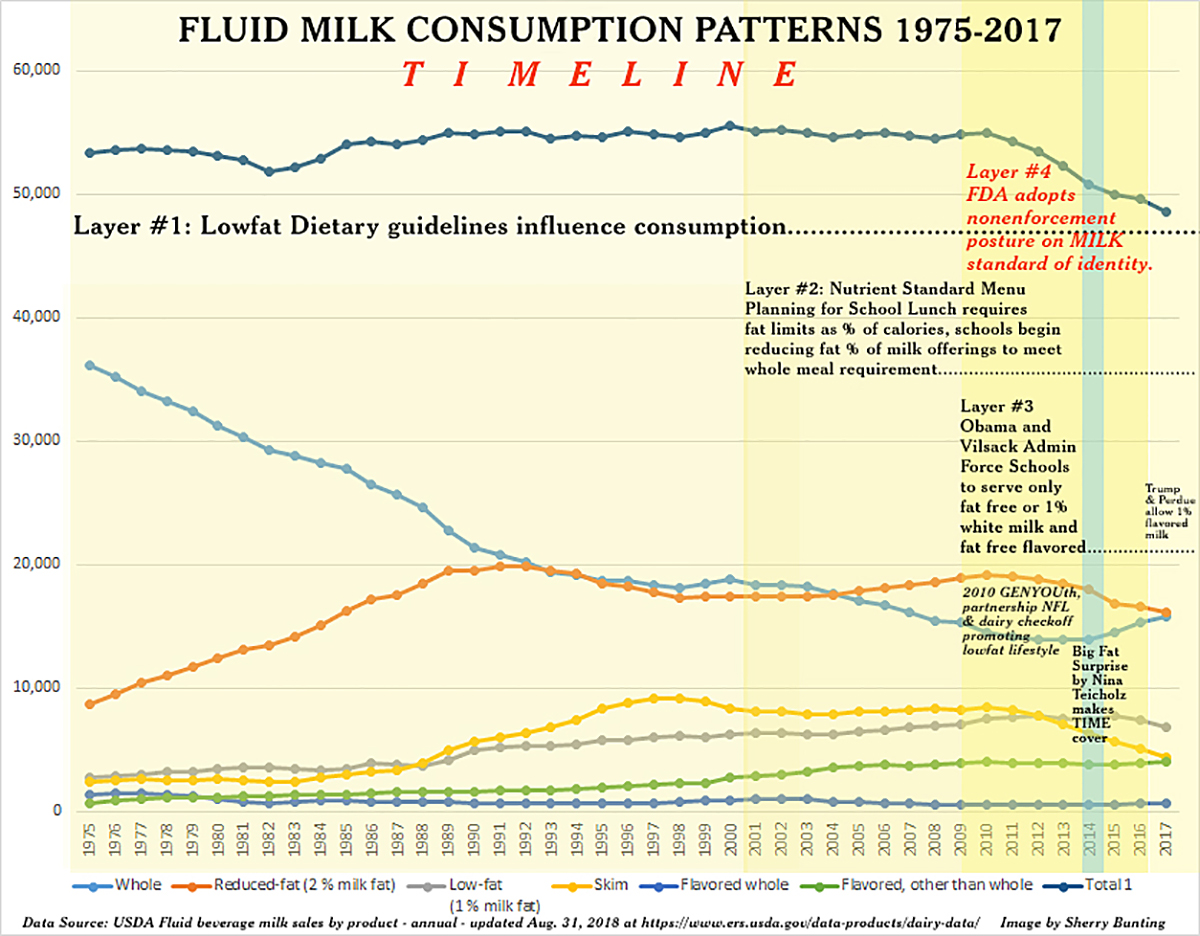 That is, until we hit 2009-10, when the third and fourth layers (see Chart 1 above) were added to the lowfat-push — that consequently pulled total fluid milk sales into the bucket at the same time that exports began their rapid ascent.

 By Sherry Bunting, originally published in Farmshine, June 7, 2018 and examines the utilization of domestic Class I fluid milk vs. exported commodities during the worst three months of pricing at the beginning of 2018, but the trends show how FMMO pricing no longer provides the value to farmers for their milk as exports increase. Read Global Thoughts
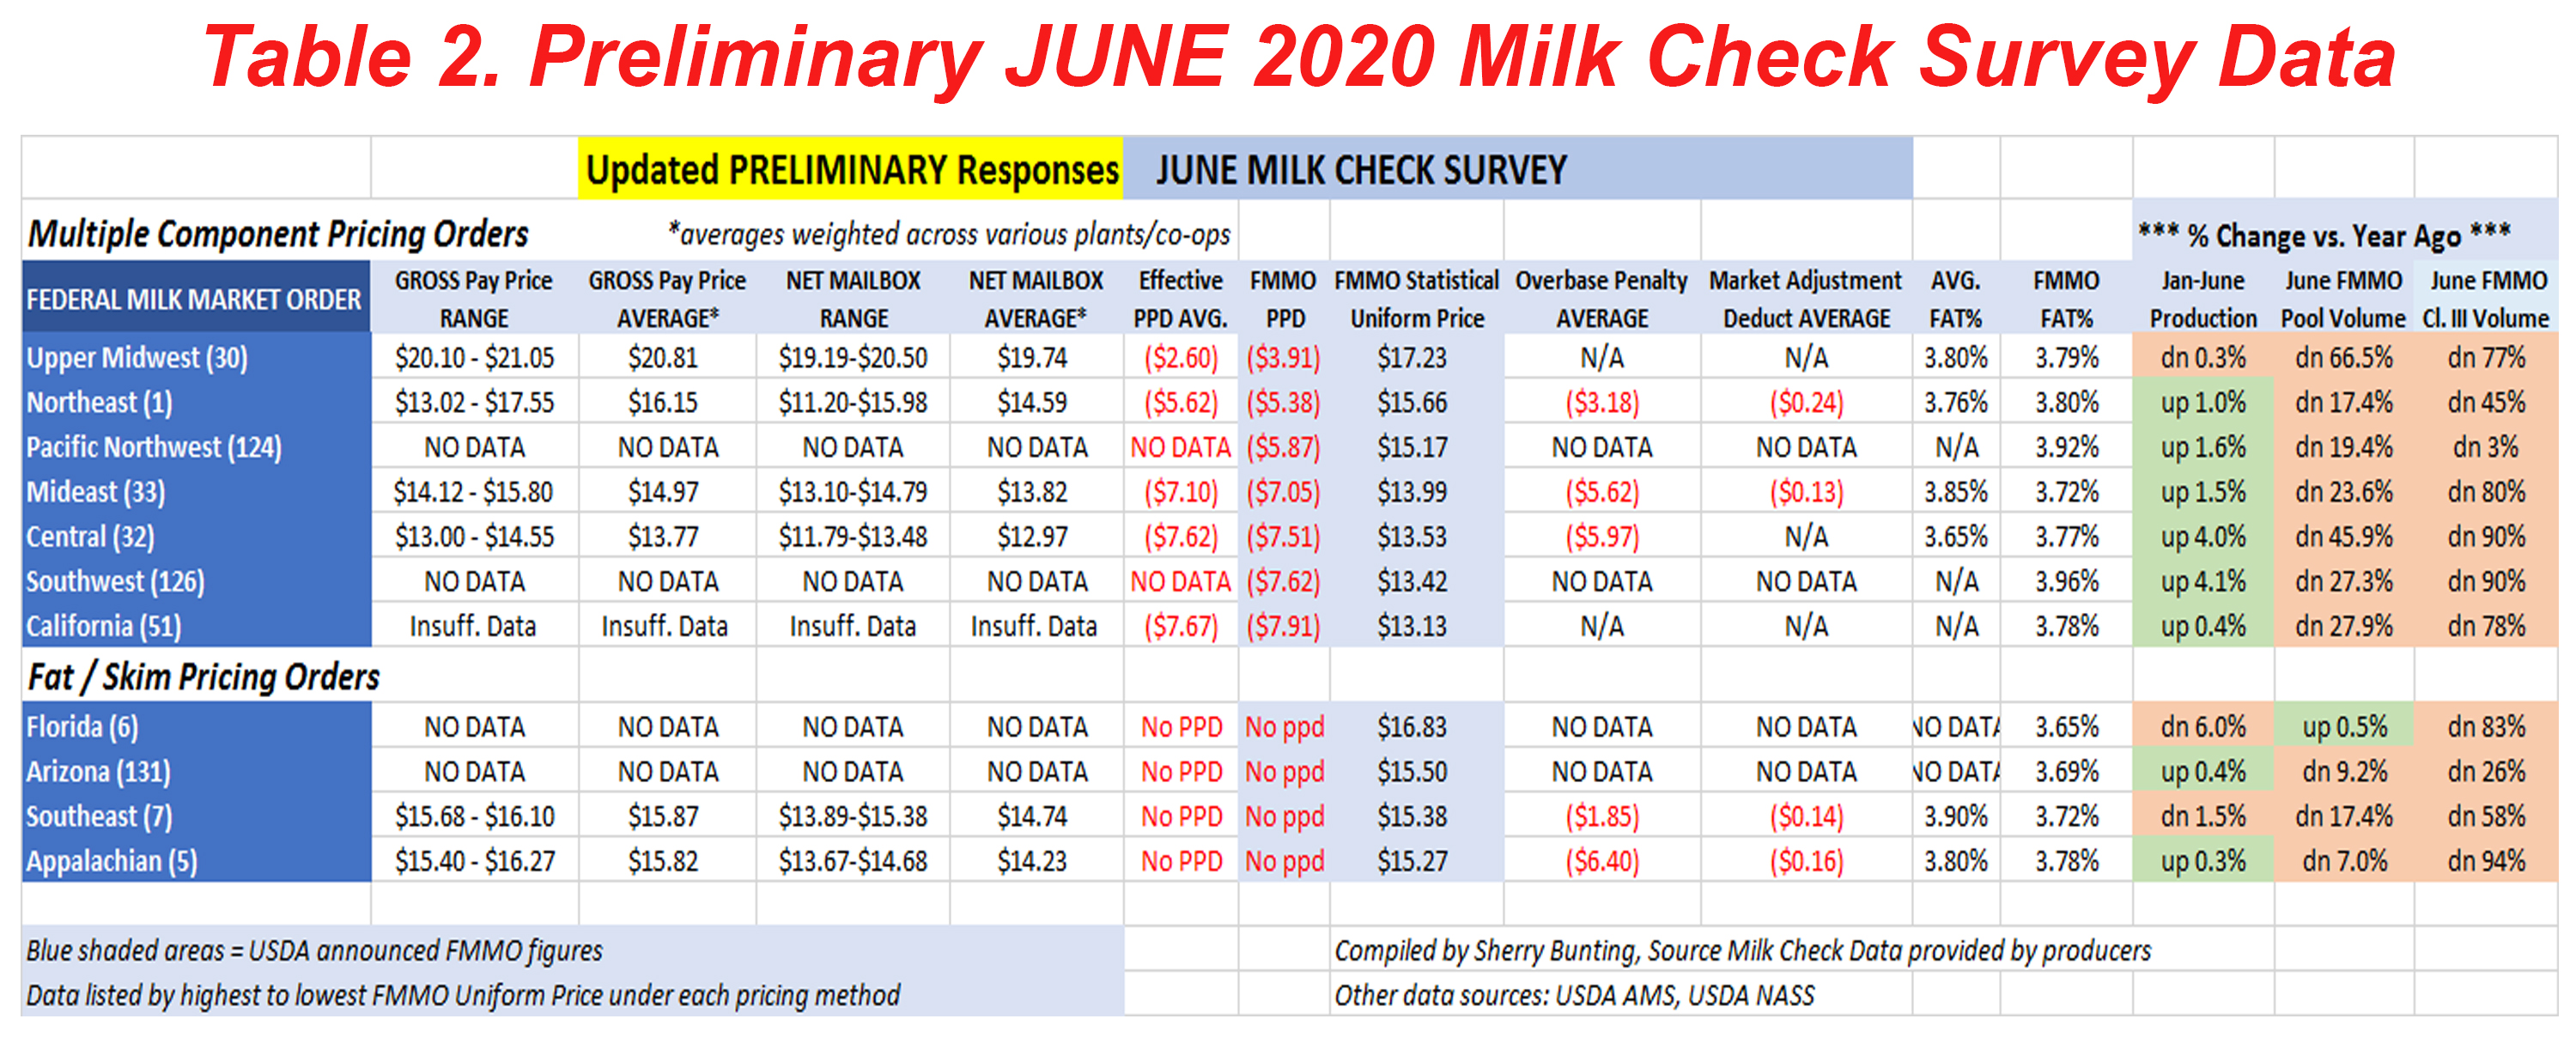
  The total “official” U.S. Class I utilization for 2017 was 26.1%, down nearly 10% from 35.9% in 2009, according to USDA figures.


 Government’s cozy relationship with dairy lobby is problem no. 1
 The storm is brewing. Since the beginning of this year, the financial experts have told us that one-third of producers are selling out or contemplating an exit from dairy, that another one-third are not sure where they even stand, and that another one-third are moving forward with plans for expansion within consolidating industry structures.
 For years we have heard “there’s a place for every size dairy in this industry.” That phrase is how we get small and mid-sized farms to advocate with consumers about modern farming so they will accept a more consolidated dairy farming picture.
 Trade is important, but again, we have reached a point where 2018 is seeing the demise of dairy farms at rapid rates while exports continue to set new records. As of Oct. 5, 2018, U.S. dairy exports for the first 8 months of the year (Jan-Aug) accounted for a record-setting 16.6% of milk production on a solids basis. That’s the largest ever percentage of the largest ever milk production total – more of the more – in the history of the U.S. dairy industry’s recordkeeping.
 ALBANY, N.Y. — “Cycles don’t exist in a supply-managed system,” said Canadian dairy farmer Nick Thurler. He sits on the Dairy Farmers of Ontario (DFO) board and operates a dairy farm of 500 registered Holsteins with his brother and their sons.
 Thurler was a presenter at the Dairy Summit organized by Agri-Mark in Albany, New York on August 13. The summit gathered 350 people, half of them dairy farmers, and many of the producers in attendance being on various U.S. milk cooperative boards.
 A government entity audits the processor stocks, which weighs into the market needs.
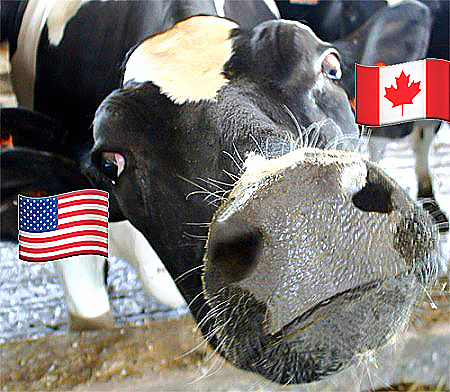 Dairy epicenter of trade friction between leaders