
Timelines show how domestic dietary guidelines, Obama/Vilsack school milk rules and ramped up low-fat and fat-free dairy promotion through GENYOUth and FUTP60 all laid the groundwork for declining Class I fluid milk sales to pave the way for flat pricing and increased exports (now coincidentally under the industry leadership of former Sec Vilsack). Then consumers learned the truth and began coming back to whole milk and butter and full-fat cheeses even while the government turns a deaf ear in regards to the rules about feeding our schoolchildren. So what did U.S. companies and cooperatives do to keep that milk price flat enough for the export market this year? They imported more butter, milk and cream in first half 2018!
By Sherry Bunting, originally published in Farmshine, September 7, 2018
BROWNSTOWN, Pa. — Let’s take a look at the overall global dairy trade balance of the U.S.
In gross numbers, the balance is positive, showing the U.S. is winning new market share on the side of exports over imports. But this tells only part of the story, ignoring the potential milk market impacts of substantial increases in imports of milkfat at this critical time during the first six months of 2018.
In June 2018, Global Dairy Thoughts Part 3 and Part 4 covered some of the Federal Order pricing impacts of rapidly expanding exports alongside a diminishing Class I utilization. While per-capita milk consumption has steadily declined since 1980, the total packaged milk sales held their own due to population growth.
 That is, until we hit 2009-10, when the third and fourth layers (see Chart 1 above) were added to the lowfat-push — that consequently pulled total fluid milk sales into the bucket at the same time that exports began their rapid ascent.
Expanding export utilization hits Class I utilization with a double-whammy: Smaller piece in a bigger pie, even if consumption losses are stabilized. We’ll revisit that in a future part of this series on dairy policy and logistics.
In looking at imports and doing trend comparisons for farm milk prices, fluid milk sales, total exports, total imports and the large increase so far this year in imports of butter and butteroil as well as steady increases in imports of milk and cream (condensed, non-condensed, liquid, powder, sweetened, unsweetened), there are some correlations. (Chart 2 below)
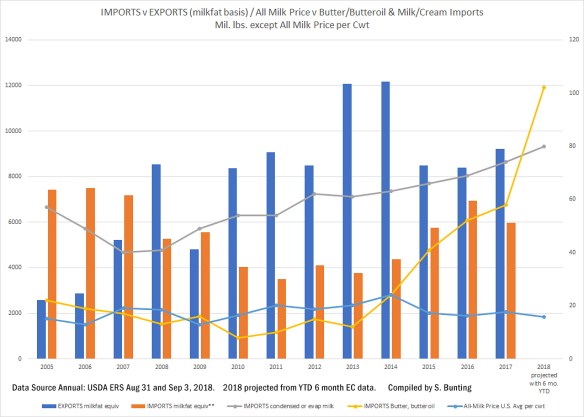
From 2005 forward, the national average all-milk price moved in patterns concave to the corresponding imports of butter/butteroil and milk/cream on the timeline. While the totals are not huge, we all know what “a little more” can mean on the supply side when it comes to milk prices.
In the first-half of 2018, for example, the U.S. imported 12% more butter and butteroil and 11% more condensed milk and cream, according to the European Commission’s Milk Market Observatory published August 14, 2018. (Charts 3 and 4 below)
While the U.S. Dairy Export Council (USDEC) reports that first half 2018 dairy exports of milk powders, cheese, butterfat, whey and lactose topped 1.14 mil. tons to set a new record-high – up 20% from year ago, some interesting things were also happening on the import side.
Even though the USDEC data dashboard continues to show total imports accounting for a flat line at 4% or less of the milk supply on a solids basis, while exports accounted for 16.8% in the first six months of 2018, there are some interesting aspects of the import picture related to ‘what’ and ‘when’.
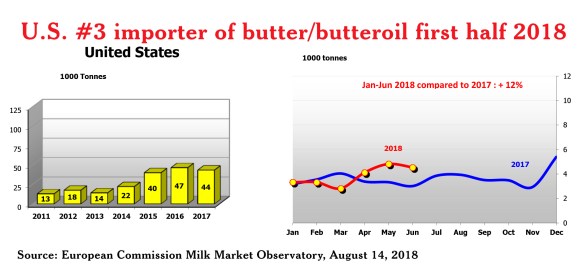
According to the August 14 EC statistical report ranking top-10 importers and exporters of various dairy commodities, the U.S. ranked third in butter and butteroil imports, up 12% from year ago and not far behind China (1) and Russia (2) during the first half of 2018.
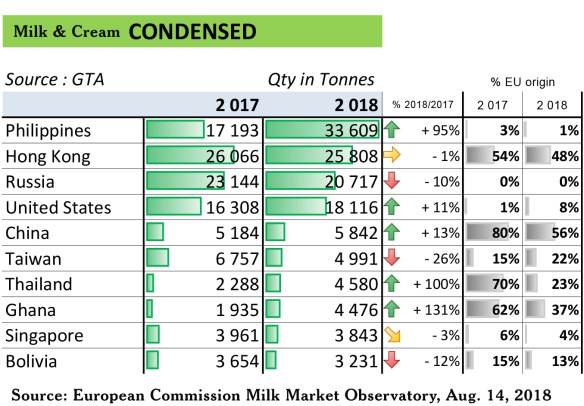
The U.S. also ranked fourth in imports of condensed milk and cream – up 11% compared with a year ago.
When butter substitutes, containing over 45% butterfat, are included in the butter and butteroil import total, as documented at the U.S. International Trade Commission (USITC) import monitoring website, the U.S. butter/butteroil total rises by more than 200% during the past three quarters (Sept. 2017 through June 2018) compared with the same nine months a year ago.
While half of the butter and butteroil imports came to the U.S. from EU countries, a majority of the other half came from Mexico, according to the USITC website listings under various Harmonized Tariff Schedule (HTS) codes.
In the condensed milk and cream category, 8% of U.S. imports came from the EU, according to the EC report.
Sifting through the tedious lists and multiple codes and combinations at the USITC website, it appears the U.S. imported quite a bit of condensed milk and cream from Mexico, a little from Canada (though less from Canada than a year ago), and the remainder from sources scattered around the globe — even China.
For the past nine months, Sept. 2017 through June 2018, the condensed milk and cream, unsweetened, category of imports was up 44% in powder or granular form compared with the same period a year ago, while milk and cream imports, unconcentrated, unsweetened, and still in liquid form, were up 22%.
Imports of sweetened condensed milk and cream were up 7% and mainly from Mexico.
Of course, the U.S. remains the top importer of casein and caseinates, even though those imports were down 15% from a year ago during the first half of 2018, according the EC report.
Doing the math on milk protein concentrate (MPC) imports for the nine months from September 2017 through June 2018 listed at the USITC site, MPC imports in both the 0404 and 3500 HTS codes, combined, were down 1.3% compared with the same period a year earlier.
On the other hand, imports of milk protein isolates (MPI) were up 31% from Sept. 2017 through June 2018 compared with the same three quarters a year ago.
Looking further into other categories, imports of “textured protein substance, including dairy” were up 40% for the past nine months compared with a year ago.
In the significant dairy-containing “food prep” categories — including infant formula and having various percentages of milk solids and butterfat — imports were up 7% during the past nine months compared with a year ago. In this particular category, including confectionary products containing significant milk solids, Canada was a primary source, along with EU countries as well as some of these imports coming from Chile and other South American countries.
Process cheese product imports were up 46% during the past nine months compared with a year earlier.
While U.S. imports of ice cream were down relative to year ago, the total when combined with import categories in other HTS codes for “edible ice containing dairy” tallied an import total that was up collectively by more than 200% over year ago during the past nine months.
To read Parts 1 through 4, click these links: Part 1, Part 2, Part 3, Part 4
And stay tuned for this series to continue as 2019 trends develop abroad and on the homefront.
-30-

Pingback: Who is empowering whom? PART ONE: Dairy check-off’s GENYOUth thin on milk. | Ag Moos "Growing the Land"