AUTHOR’S NOTE: They call it “the dairy farmers’ youth wellness program” because it has been depicted as the brainchild of the National Dairy Council… But GENYOUth — including its flagship Fuel Up to Play 60 (FUTP60) — is thin on milk and threatens to steal even more demand as future milk drinkers are steered away from nutritious whole milk products. Meanwhile, the anti-animal and environmental NGO’s (non-governmental organizations) have been infiltrating new billionaire “sustainability” alliances poised to profit on the main course, while dairy farmers bow-down in hopes of crumbs. This is Part One of an investigative multi-part series.
Depicted above is the illustration used to promote and glorify the 2018 GENYOUth Gala that was held at the Ziegfeld Ballroom in New York City on Nov. 27. The “superheroes” sponsors are listed further down on the 2018 GENYOUth Gala website. PepsiCo was the “hero” sponsor at $150,000. Champion sponsors of $100,000 each were UnitedHealthcare, Corteva Agriscience, Inmar and fairlife. So-called “defender” sponsors included Domino’s, Ecolab, Jamba Juice, Land O’Lakes, NFLPA, SAP, Leprino Foods, Schreiber, Ameritrade, RBC Capital Markets and Omnicom Group, each of which gave $50,000.
By Sherry Bunting, from Farmshine, Friday, January 11, 2019
BROWNSTOWN, Pa. — How serious is the National Dairy Board about improving fluid milk sales? We see some renewed emphasis on this lately, but our most important sales — those to children in school — threaten to steal even more demand from the future as we lose future milk drinkers with the forced service of only fat-free and 1% low-fat milk in the school lunch and breakfast programs.
Recent studies show that children and teenagers in the poorest demographic of the U.S. population are leading the epidemic of obesity and diabetes. One study by University of Michigan Health System, for example, revealed that for every 1% increase in low-income status among school districts, there as a 1.17% increase in rates of overweight/obese students. Researchers used data collected from mandated screenings that began in Massachusetts schools in 2011, and the percentage of overweight/obese students was compared with the percentage of students in each district eligible for free and reduced school lunch, transitional aid or food stamps (SNAP).
The meals these students receive at school are their best two options for nutrition and satiety all day. There are few restrictions for cheap, high-carb, high-fructose-corn-syrup foods and beverages that can be purchased with SNAP cards, so what will they find at the end of the day for their hunger at home? Soda pop and Dollar Store snacks.
What role is the National Dairy Council and its GENYOUth program playing?
The GENYOUth collaboration is aimed at making “a lasting difference in the lives of children.” That sounds great, but what have been both the intended and unintended lasting consequences?
Certainly, there is a long list of dairy research projects funded by the NDC. That’s a good thing.
But where the rubber meets the road, GENYOUth and its flagship program Fuel Up to Play 60 (FUTP60) are aimed at promoting a “healthy lifestyle” that focuses on 60 minutes of physical activity daily and consumption of fruits and vegetables, whole grains and lean protein “including low-fat and fat-free dairy.”
For nearly 10 years, the dairy checkoff has parroted the Dietary Guidelines on dairy service to children (and adults) when it comes to institutional feeding — the largest category of the food economy and the place where seeds are planted for lifelong choices based on nutrition education and flavor.
Let’s look at how GENYOUth was launched in 2010.
At the Nov. 27, 2018 gala in New York City, NFL Commissioner Roger Goodell stated that GENYOUth was the concept of Dairy Management Inc (DMI) CEO Tom Gallagher. Gallagher today serves as chairman of the GENYOUth board.
In a YouTube video of Goodell’s remarks — before handing the coveted 2018 Vanguard Award to PepsiCo CEO Albert Carey — Goodell stated that Gallagher came to him with the idea for GENYOUth 10 years ago, which was then “founded” in 2010 as a partnership between the National Dairy Council (NDC) and the National Football League (NFL).
In fact, in its 2014 Progress Report, GENYOUth’s beginning is described as making “cultural shifts” in school nutrition and exercise, stating further that, “Through signing a six-way Memorandum of Understanding (MOU) between the National Dairy Council, the National Football League, and the U.S. Department of Agriculture, Education, and Health and Human Services, we have created a productive synergy that has made the sky the limit for GENYOUth.”
According to a report at its website, genyouthnow.org, the foundation seeks to “convene leaders in a movement to empower America’s youth to create a healthier future.”
The 2018 GENYOUth Gala in New York City was billed as “honoring America’s everyday superheroes” and the Vanguard Award, as mentioned, went to PepsiCo.
But let’s go back to the second gala on Dec. 7, 2017 aboard the Intrepid in New York City. Former U.S. Secretary of Agriculture Tom Vilsack — who now serves as CEO of dairy checkoff-funded U.S. Dairy Export Council (USDEC) — was presented with the Vanguard Award that year.
The GENYOUth website cited “Vilsack’s accomplishments for dairy farmers” under President Obama — for having “legislated to improve the health of America’s kids.”
More specifically, the Vilsack accolades stated that he partnered with First Lady Michelle Obama on her “Let’s Move!” initiative — “alongside GENYOUth to improve the health of America’s children.”
These words show the partnership the NDC / DMI has had with the Obama / Vilsack administration on shared goals of promoting exercise and low-fat / high carb diets for children and youth.
According to the former GENYOUth foundation website before it was revamped to genyouthnow.org, the Vanguard Award presentation to Vilsack was described in January 2018 as follows:
“Sec. Vilsack helped pass and implement the Healthy, Hunger-Free Kids Act to help combat child hunger and obesity by making the most significant improvements to U.S. school meals in 30 years.”
What was included in these “significant improvements” in 2010?
For starters, America’s schools were forced to offer only fat-free flavored milk and only 1% or fat-free white milk, while the screws were tightened on the requirement that less than 10% of a school meal’s calories could come from saturated fat and by reducing the total number of calories in a meal served to children at school, while at the same time putting both program and promotion emphasis on plant-based meals containing scant lean protein.
This means that not only are dairy producers prohibited from putting their best and most nutritious foot forward with future milk drinkers at school, the schools are forced to serve butter substitutes and imitation cheese or cheeses that are diluted with starch to decrease the amount of calories the students receive from fat).
During the Pennsylvania Dairy Summit in February 2018, keynote speaker Nina Teicholz, author of The Big Fat Surprise — without realizing the significance of her statement — put these USDA / GENYOUth ideas to shame. She stated:
“The fat we eat is not the fat we get. The idea that 60 minutes of exercise can make up for a bad diet is disingenuous. You can’t exercise your way out of a bad diet.”
And Teicholz backed up her statement with facts, studies and charts.
Her 2014 book details her 10-years investigation, revealing the lack of sound science to support low-fat diets. Not only are new studies bearing this out, old studies were found to have been “buried” by the National Institute of Health (NIH) and American Heart Association, because they did not support the fat-heart hypothesis of Ancel Keys.
GENYOUth and FUTP60 not only dutifully “followed” these government guidelines but in reality worked alongside the Obama administration to develop them and further the reach of this low-fat dogma.
The implementation of those school milk rules have cost dairy farmers plenty in lost milk sales. Losses so steep that they drove the gradual declines in fluid milk consumption (see Fluid Milk Timeline chart below) plunging downward like a rock from 2010 through 2017 (most recent full-year figures)
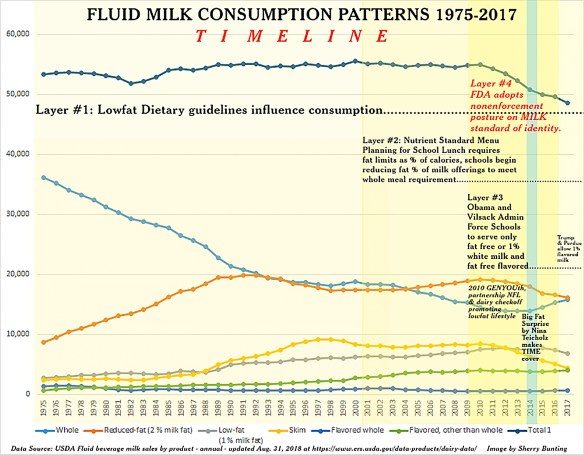
Timelines don’t lie. As we look at this fluid milk timeline, we can see the layered effects of government dietary policy, USDA requirements for fat-free milk (2010), that move occurring alongside the creation of GENYOUth (2010) and some reversal in whole milk trends moving higher after Nina Teicholz’s book Big Fat Surprise made the cover of Time magazine. Meanwhile, the past decade has also been one of FDA non-enforcement of milk’s standard of identity, allowing plant-based alternatives to take hold and proliferate.
Bob Gray for the Northeast Association of Farm Cooperatives addressed these losses on a dairy policy forum panel in Washington exactly one year ago on January 8, 2018. Gray said: “For the last six years (2010 through 2016 data), we have not been able to sell 1% milk in the schools.”
He noted that in just the four years from 2012 to 2015, dairy producers had “lost 288 million half pints of sales to schoolchildren because of this move, alone.” And those losses continued through 2016 and 2017 and into 2018, despite the small move by the Trump administration to allow 1% flavored milk back into schools.
This is an uphill battle to turn around — what with all the fat-free and low-fat promotion and the fact that schools are already aligned with processors that prefer to keep the fat-free pipeline going.
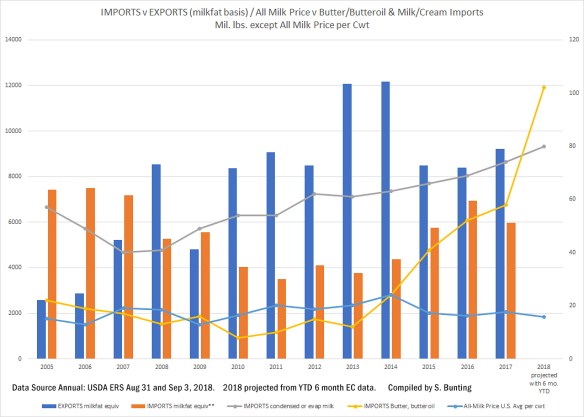
In addition to GENYOUth honoring Secretary Vilsack with the 2017 Vanguard Award, the National Dairy Board provided him a checkoff-funded salaried position as CEO of USDEC, where his rallying cry has been to get export sales to 20% of expanding total milk production while Class I sales as a percentage of total milk production declined to below 20% by the end of 2017.
Remember, experts at various dairy market forums throughout 2018 have made the point that exports do not raise farm-level milk prices because they are “commodity clearing markets.”
But maybe that is the point.
If fluid milk consumption erodes as a percentage of milk production, the cost of milk to processors is reduced for the many other products competing globally for export sales to increase. Meanwhile, a pipeline for fat-free milk sales keeps the cost of milkfat for other products from accelerating in the farm milk check.
The highest-value class under the Federal Order pricing scheme is the shrinking piece of an expanding commodity-dairy-production-for-export pie.
Meanwhile, the past decade has been one of FDA non-enforcement of milk’s standard of identity, allowing plant-based alternatives to take hold and proliferate.
One can argue that the National Dairy Council — whether simply following USDA’s lead or by working alongside USDA to lead — has played right into the hands of GENYOUth ‘friend’ PepsiCo / Quaker.
Remember, Quaker was a company that DMI specifically partnered with a few years back, but the milk part of the Quaker Oatmeal promotion never really materialized, just like we don’t see the milk part promoted in any of the NFL’s Fuel Up to Play 60 spots. But the NFL is joined at the hip to PepsiCo with side-by-side logos during televised games.
Now, just six weeks after receiving the 2018 Vanguard award from GENYOUth, PepsiCo is launching its own Quaker Oat beverage.
In fact, PepsiCo CEO Albert Carey had the audacity to do a brief sales-pitch for what he called “our new oat milk” in his remarks after NFL commissioner Goodell handed him the highest GENYOUth award on behalf of the NFL and the National Dairy Council.
We’ll dig into that in future parts of this investigative series.
-30-
 That is, until we hit 2009-10, when the third and fourth layers (see Chart 1 above) were added to the lowfat-push — that consequently pulled total fluid milk sales into the bucket at the same time that exports began their rapid ascent.