Market Moos is a weekly column in Farmshine by Sherry Bunting
US Apr. milk output off 1%, Georgia surpasses Florida
In its May 18 report, USDA pegged total U.S. milk production at 19.2 billion pounds — down 1% from a year ago. The report tallied 9.4 million milk cows on U.S. farms reflecting a 98,000-head decrease (-1%) from a year ago, with output per cow unchanged.
Among the 24 monthly-reporting states, output per cow fell 0.1%, and cow numbers were off 78,000 (-1.1%), pushing production 0.9% below year ago in those major states.
USDA’s May 18 GAIN report noted an even larger pull-back in Australia’s 2022 output, forecast to be down more than 4% for the year, and New Zealand’s first quarter milk production is reported to be running 6% below year ago and the lowest level since 2013.
Milk collection in the European Union is also running behind first quarter 2021 by a smaller degree, down 0.3%, according to an EU milk situation report delivered in Brussels last week. And, milk deliveries are reported to be 4% below year ago in Great Britain for the first quarter of 2022 — 3.3% below year ago in Ireland in March.
Throughout the world, these reports note that farmers are exiting the dairy industry. “The slump in milk production (in Australia) is largely due to farmers continuing to exit the dairy industry through farm sales, and some dairy farms partially or fully transitioning to less labor-intensive beef cattle production,” the GAIN report said.
In the U.S., the national impact of this trend is being buffered by the large production growth in places like Texas and South Dakota offsetting reduced production almost everywhere else.
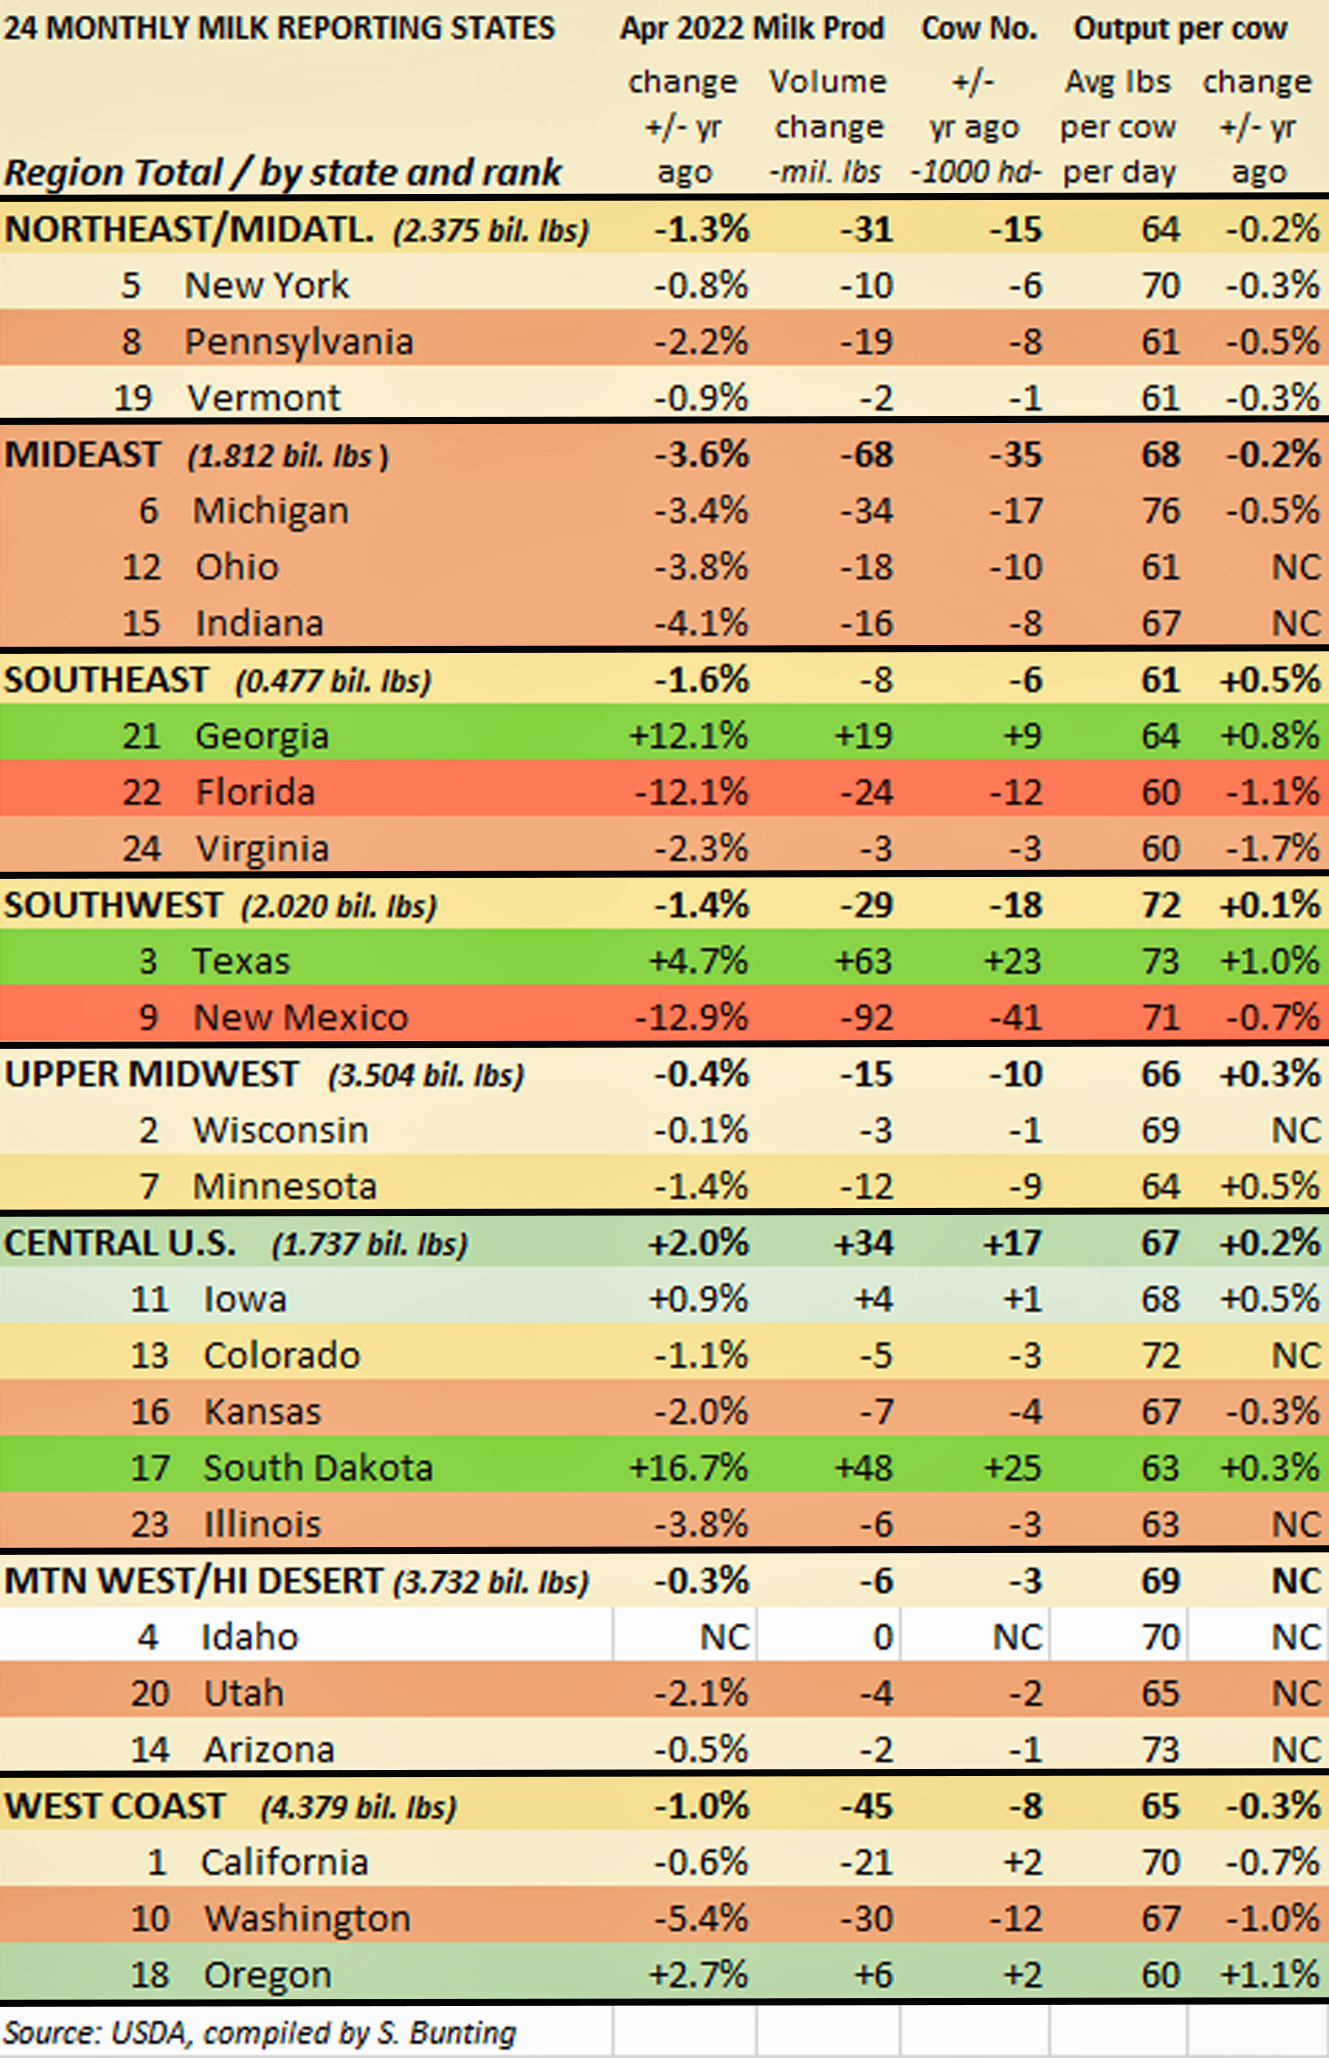
In addition to the U.S. milking 98,000 fewer cows in April compared with a year ago, dramatic movements of cows out of some regions and into others is occurring. Notable shifts are also occurring within regions. (See chart above)
One region — the Mideast — that had been growing rapidly is now going through a substantial pull-back. The Mideast lost 35,000 cows and 68 million pounds of monthly milk production in April compared with a year ago. That is a collective 3.6% year-over-year decline broken down as -3.4% in No. 6 Michigan, -3.8% in No. 12 Ohio and -4.1% in No. 15 Indiana. Technically, western Pennsylvania is included in the Mideast when we look at the Federal Milk Marketing Order map, and the Keystone state, as a whole, recorded a 2.2% decline in milk production in April.
The Northeast and Midatlantic region lost 15,000 cows and 31 million pounds (-1.3%) of milk production with most of the decline coming from No. 8 Pennsylvania, down 8,000 cows and 2.2% in milk output vs. year ago while No. 5 New York (-0.8%) and No. 19 Vermont (-0.9%) were just under the national average.
In the Southeast region, the big news is Georgia’s milk production outpaced Florida for the first time, moving the relative 24-state newbie into 21st place and Florida to 22nd. Georgia and Florida were dead-even in March.
Georgia’s 12.1% year-over-year milk increase in April eclipsed Florida’s 12.1% year-over-year decline, with Georgia producing 1 million more pounds of milk with 7,000 fewer cows compared to Florida. Georgia producers milked 91,000 cows in April — up 9,000 head from a year ago. Florida producers milked 98,000 cows in April — down 12,000 head from a year ago.
As noted last month, Texas surpassed Idaho in March as the No. 3 milk-producing state. However, even the 4.7% increase in year-over-year April production in Texas (up 63 million pounds) could not overcome the 12.9% decline in No. 9 New Mexico’s production (down 92 million pounds), for a net 1.4% loss of 29 million pounds of milk from the Southwest region.
Regions holding steady-ish — lower by less than the national average — are the Upper Midwest down 10,000 cows and -0.4% in milk output and the Mountain States / High Desert down 3,000 cows and -0.3% in production, with No. 4 Idaho unchanged in both cow numbers and production vs. year ago.
In the Upper Midwest, No. 2 Wisconsin was almost steady as production was down just 0.1% with 1,000 fewer cows in April, while No. 7 Minnesota milked 9,000 fewer cows and made 1.4% less milk than a year ago in April.
The West Coast showed a net-loss of 1% just like the U.S. average: No. 1 California had -0.6% production (but milked 2,000 more cows), and the 2.7% production increase in No. 18 Oregon was not enough to make up for the 5.4% loss in No. 10 Washington State.
The Central U.S. was the only region to see a net gain — owing to a 0.9% increase in No. 11 Iowa and the whopping 16.7% (48 million pound) increase in milk production in No. 17 South Dakota, where cow numbers are up by 25,000 head. South Dakota is nipping at the heels of No. 16 Kansas (-2.2%), despite Kansas overtly seeking dairies to fill expanded processing there according to dairy market podcast advertising messages at the International Dairy Foods Association website. Elsewhere in the Central U.S., in addition to production losses in Kansas, declines were also recorded to the east for No. 23 Illinois (-3.8%) and to the west for No. 13 Colorado (-1.1%).
All of this bears note as farmers face escalating costs and milk futures are hesitatingly recovering the past three weeks of losses but under market conditions that are again creating divergence between Class III and IV that could create producer price differentials (PPDs). When milk is de-pooled from Federal Orders in these circumstances, we see inequitable distribution of losses and of value that can contribute even faster to the way the milk production map is changing.
At the same time, the USDA World Agricultural Supply and Demand Estimates for May highlighted an expected increase in fat-basis exports as the world is tight on butterfat, but a decline in skim-basis exports, which could change if China resumes its earlier level of milk powder imports.
On the flip side, the WASDE report forecasts 2022 U.S. dairy imports to run well ahead of previous years’ on both a fat- and skim-solids basis. The WASDE report stated this increase in dairy imports will be boosted by larger than expected importation of products that contain dairy.
WASDE: 2022 imports up
According to the World Agricultural Supply and Demand Estimates (WASDE) last week, the 2022 All Milk price is forecast to average $25.75, down a nickel from April’s forecast.
The May WASDE raised the 2022 milk production forecast on what it says are higher milk cow inventories more than offsetting slower growth in milk per cow. But it is important to realize the April milk production report this week (as reported above) showed otherwise.
Cheese and butter price forecasts are raised from the previous month’s report on strong demand, but non-fat dry milk and whey prices are lowered. The Class III price is unchanged and Class IV is lowered.
Some are suggesting that higher retail prices for butter and cheese and other dairy products are negatively affecting demand and that the food industry can shift from butter to oils. However, recent reports from many sources indicate the global supplies of food oils and butter substitutes are also in reduced supply and rising in price at wholesale and retail levels.
Biden orders Operation Fly Formula via Dept. of Defense
Operation Fly Formula was ordered by President Biden invoking the Defense Production Act on Wed., May 18, sending military planes abroad to bring infant formula home to America’s babies, especially the specialty hypo-allergenic formulas for babies with allergies to milk or special health needs. Parents currently face 45 to 60% out-of-stock shortages in infant formula and two military cargo plane loads of hypoallergenic specialty formula have arrived from Europe and the UK over the past 7 days.
Spot out-of-stock undercurrents in baby formula and specialized milk-based meal replacements have been mentioned in this column several times over the past few months, but the situation has worsened. The USDA announced WIC vouchers allowing participants to buy brands other than sanctioned low-bidders.
By Thurs., May 19, the American Academy of Pediatrics had issued a statement telling parents it is safe to switch to whole cow’s milk for babies over 6 months of age that are not on “special” formula, making sure they are consuming other iron-rich foods or talking to their own pediatricians about supplemental iron.
Discussion is rampant through social media about goat milk as a substitute for formula. There’s something to this because goat’s milk is A2A2 in its protein composition, as is sheep’s milk and human milk. There are A2A2 cow’s milk brands available now also. Parents are urged not to switch to plant-based beverages that do not have the nutrition of whole milk and to be cautioned that lactose free milks may not have sufficient carbohydrate for electrolyte balance since the lactose IS the carbohydrate in milk.
The FDA also struck a deal to get the Abbott plant back up and going by June 4 after product recalls and a plant closure related to bacteria tests occurred in February, in part because of a whistleblower’s report that was delayed for months by a “mail room disruption” according to FDA.
‘Confusion is real’
Anxiously waiting for the expected FDA decision on label standards of identity for milk and dairy, NMPF reported this recent exchange between FDA Commissioner Robert Califf and U.S. Senator Tammy Baldwin of Wisconsin at a recent Ag Appropriations Subcommittee hearing. Baldwin chairs the Senate subcommittee that sets spending levels for FDA. Baldwin asked the Commissioner for his thoughts on how plant-based beverages masquerading as dairy products should be labeled. His response noted that when people think about dairy vs. plant-based beverages, they “are not very equipped to deal with what’s the nutritional value” of the products. Yes, the confusion is real.
Milk futures flip higher, Class III and IV diverge
Green ink the past two weeks replaced three weeks of red ink as milk futures posted back to back gains despite some waffling on the Class III side due to a report this week showing record natural cheese inventories. By Wednesday, May 25, the Class III contract average for the next 12 months was 25-cents higher than the previous week and fully steady compared with the end of April at $22.96. The Class IV milk futures went roaring $1 to $1.50, spots $2 higher — tripling the spread between the two. On the close Wed., May 25, Class IV contracts for the next 12 months averaged $24.05 — up $1.03 from a week ago and 60 cents higher than the end of April. Class IV continues to top Class III, with the average divergence now at $1.10. Aug. through Nov. contracts on the CME futures board now diverge by more than the $1.48 threshold that suppresses the Class I mover value under the new averaging formula.
Dairy products rally higher
CME spot cash dairy product markets have reversed course to move higher for two consecutive weeks, capped by a strong rally on Class IV products (butter and nonfat dry milk) driven by a 22% decline in butter inventories. Compared with the end of April, the May 25 daily spot prices for the four commodities used in federal milk order pricing are: Butter up 28 cents at $2.89/lb after 12 consecutive days of gaining more than 2-pennies per day in active trade volume; Nonfat dry milk up 13 cents at $1.84/lb; Cheese steady compared with a month ago at $2.30/lb, Dry whey firming up the 8-cent loss at 50 cents.
April blend up $1-1.50
The April uniform prices across the 11 Federal Milk Marketing Orders (FMMOs) moved $1 to $1.50 higher, with the Upper Midwest closer to $2 higher than previous month. This is the 6th straight month of gains, reported as follows:
- FMMO 1 (Northeast) SUP $26.07 PPD +$1.65
- FMMO 33 (Mideast) SUP $24.91 PPD +$0.49
- FMMO 32 (Central) SUP $24.65 PPD +$0.23
- FMMO 30 (Upper Midwest) SUP $24.55 PPD +$0.13
- FMMO 126 (Southwest) SUP $25.43 PPD +$1.01
- FMMO 124 (Pacific Northwest) SUP $24.79 PPD +$0.37
- FMMO 51 (California) SUP $25.08 PPD +$0.66
- FMMO 131 (Arizona) uniform price $25.52
- FMMO 5 (Appalachian) uniform price $27.17
- FMMO 7 (Southeast) uniform price $27.35
- FMMO 6 (Florida) uniform price $29.13
June Class I ‘mover’ $25.87
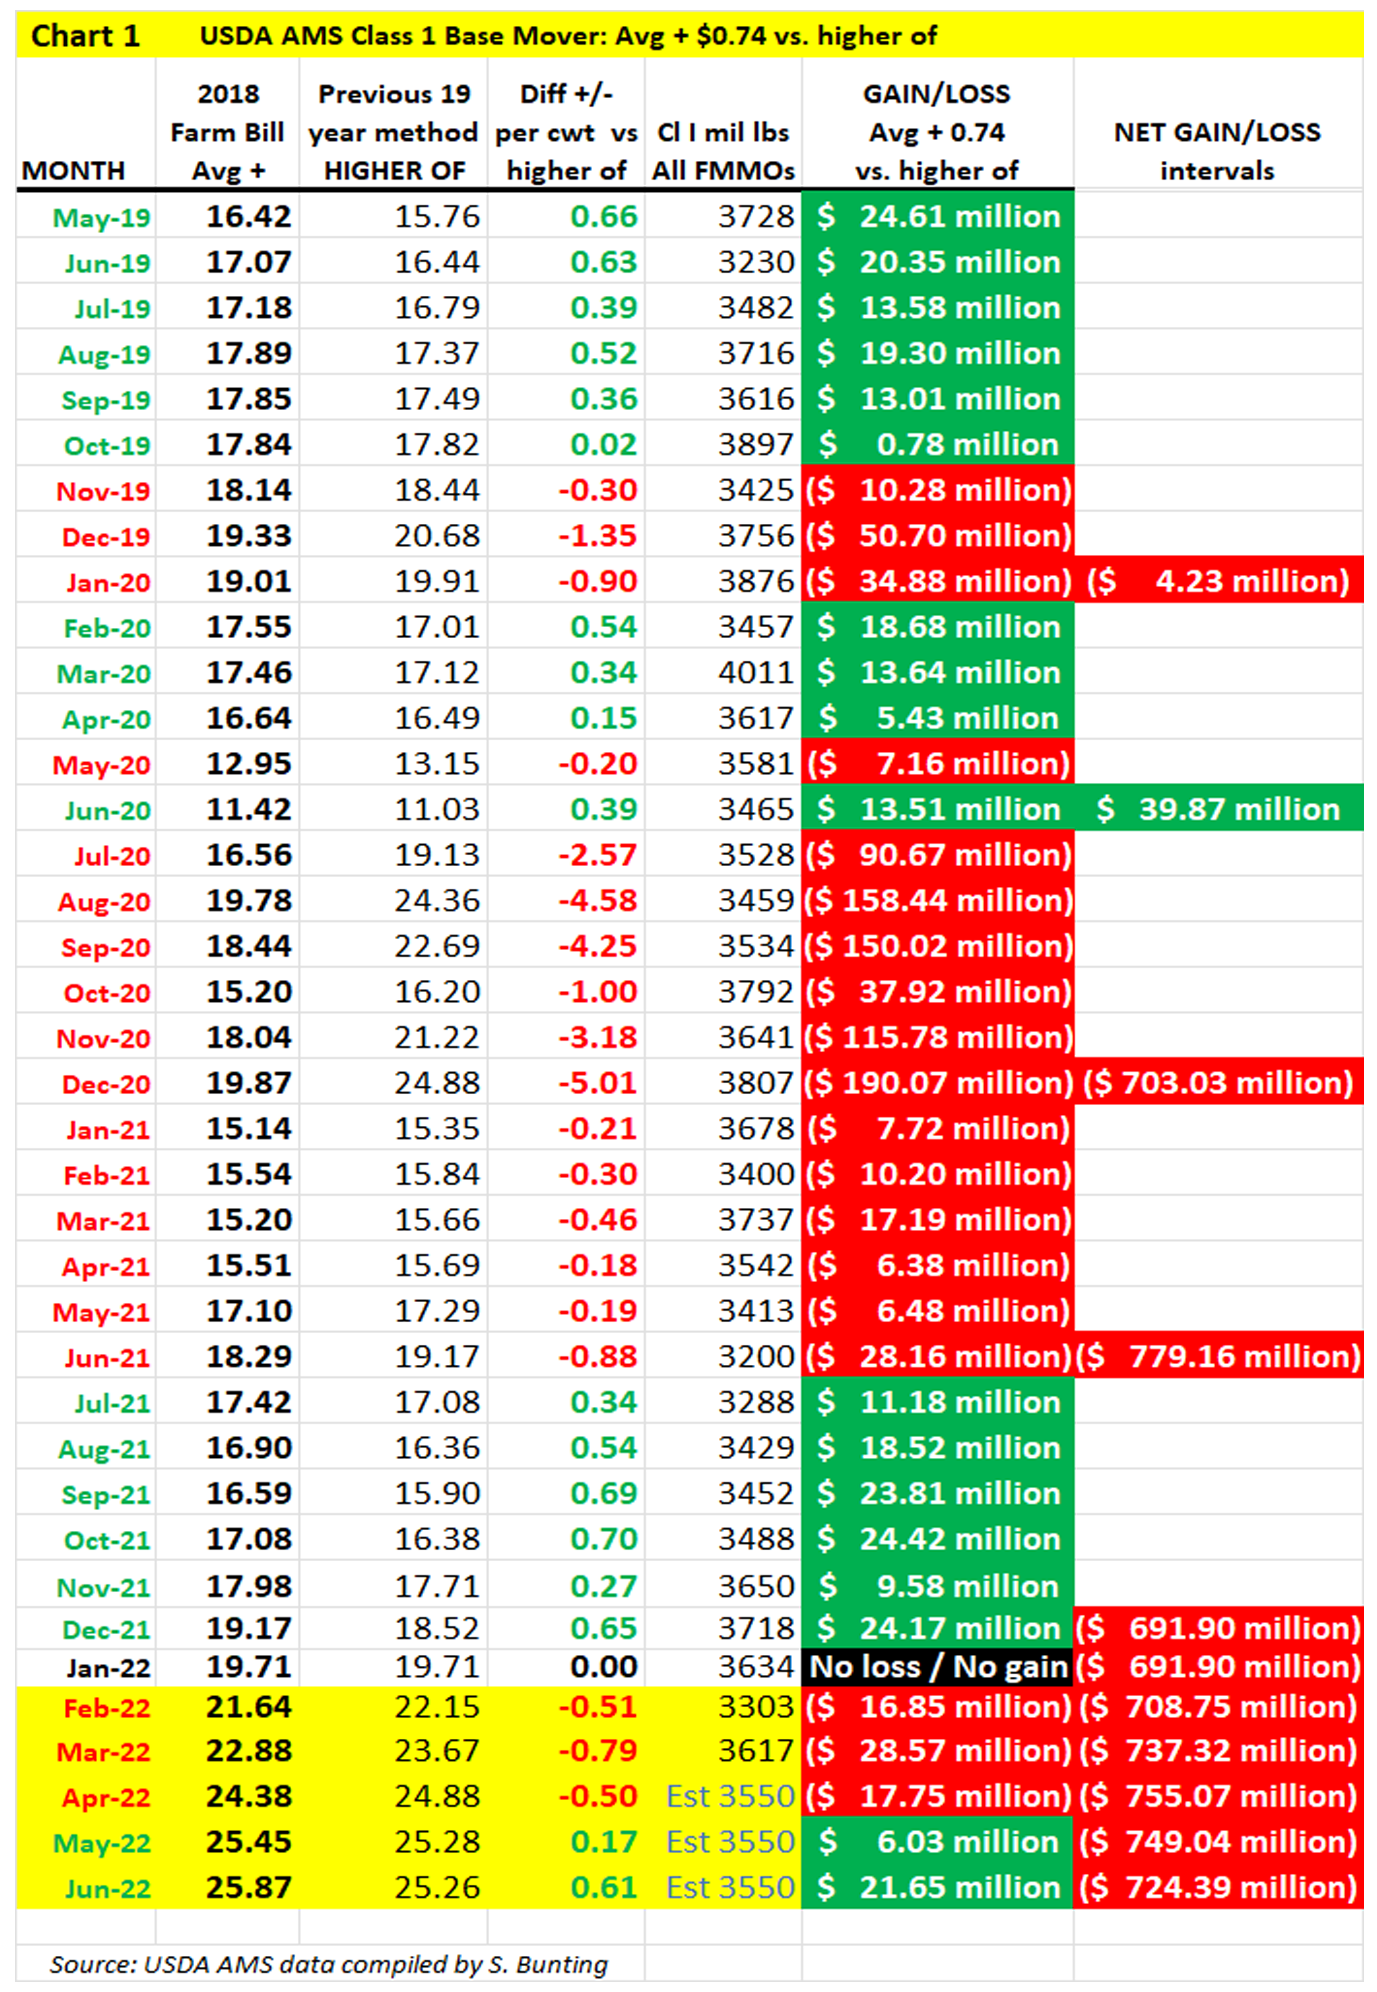
The June Class I base price, or ‘mover’, was announced Wed., May 18 at $25.87. This is 42 cents higher than the May Class I ‘mover’ and $7.58 higher than a year ago. This marks the 9th consecutive month of Class I mover gains.
The June 2022 Class I mover is 61 cents higher under the current average-plus formula than it would have been using the previous ‘higher of’ for the second consecutive month after being a loss under the averaging formula for the previous four consecutive months. In 2022, alone, the average-plus Class I mover formula produced no difference in January and was 51 cents below the ‘higher of’ method for February, 79 cents lower for March and 50 cents lower for April before turning 17 cents higher in May and now 61 cents higher for June.
Since implementation in May 2019, the new formula has been negative more months than positive (18 of 38 months) for a net loss in Class I value of over $725 million from May 2019 through June 2022.