Your milk check and fairness in contracts: Dr. Bozic urges transparency

Dr. Marin Bozic of Bozic LLC talked about his Milk Check Transparency Report at Pennsylvania Dairy Summit in Lancaster on Feb. 2. S.Bunting photo

By Sherry Bunting, published in Farmshine, Feb. 18, 2022

LANCASTER, Pa. — Aside from Federal Milk Marketing Order modifications, Dr. Marin Bozic talked about two other key pillars of reform during his keynote presentation at the Pennsylvania Dairy Summit February 2: Milk check transparency and fairness in milk contracts.

“Everyone prices milk differently depending on what they want you to do,” he said, showing a scattergram of milk check data from various coops and buyers. 

“It’s impossible to compare it,” Bozic declared, noting that in Australia, all milk pricing data are public so anyone can see how everyone compares in payment by region. In Ireland something similar is also done, where each buyer’s protein and butterfat price is published as well as a price for the liquid portion.

“They see what different processors pay. They don’t have Federal Orders. This transparency keeps everyone honest,” said Bozic. 

He knows about pricing around the world because — in addition to being an associate professor of applied economics at the University of Minnesota — Bozic is founder and CEO of Bozic LLC, a global provider of technology for commodity markets analytics and risk management, with around 100 clients on four continents. He is also an advisor to several dairy trade associations.

“While it’s not easy to switch (milk markets) today, milk check transparency would allow producers to hold boards accountable and hold management accountable,” said Bozic. “Having this information, seeing the patterns, a producer can ask the question: Are you doing everything you can to make sure I am successful?”

Bozic announced his new Milk Check Transparency Report, which he said will be a monthly report generated from producers submitting their milk checks to him. The purpose is to make milk checks easier to understand and to benchmark across processors to improve price discovery.

He has been working on this project with 12 processors, mainly in Wisconsin, so far. The first report is due out in the next few weeks, and the goal is to gain more input covering more buyers in more regions.

He said he hopes to have 90 to 95% of the processors included within the next six months to be able to generate a national Milk Check Transparency Report every month.

Specifically, all data is collected from producers’ milk check statements. The collaboration is confidential and a non-disclosure agreement is signed protecting the producer. Bozic and an assistant input the data. No one else sees the individual milk check submissions.

Once enough data are collected to have a high degree of confidence in the estimates, processors are contacted to offer them the opportunity to validate or comment before publishing.

Bozic has a multi-step process for standardizing the information at national average component levels (4.0F and 3.3P). He appreciates having a document describing how premiums are set by the milk buyer. Representative hauling is also incorporated and other formulas so price discovery comparisons can be made.

“Then we can work with any milk check,” said Bozic.

He said a large number of farms from Washington to Florida and from California to New York are or will be participating in this project, and he urged producers to get involved by writing to him at marin@bozic.io

Bozic was quick to point out there are other considerations and benefits a cooperative or private milk market may provide that go outside the scope of the report. He said the Milk Check Transparency Report is not meant for ranking. Instead, it is a way to look comparatively, so producers can have better market price discovery, input and accountability.

Another goal of the report is to eventually have a calculator option, where a producer can slide the pounds of volume or components, even milk quality, and see how it changes the pricing outcome.

“We are then better able to design risk management,” said Bozic, whose proprietary company owns the intellectual property he developed as the infrastructure behind risk management programs like Dairy Revenue Protection (DRP).

He believes with better information, even the Dairy Margin Coverage can be improved, and the calculators and sliders could allow producers to see how they are paid against a national index allowing them to make changes that would improve profitability and better inform how to manage the price risk they have.

Negative PPDs (producer price differentials) made headlines the past two years, Bozic acknowledged. 

“There’s an impression that all this milk was de-pooled and a feeling that processors could have their cake and eat it too,” he said. “The Milk Check Transparency Report puts everyone on notice that whether differentials are positive or negative, they are in there.”

In this way, he said, the report can “promote good behavior in an unregulated way.”

On the variation in how producers are paid, Bozic said a big problem is lack of clarity on how farmers can achieve a better price.

“It’s astonishing to me that processors do not have brochures detailing how their incentives are based so farmers know how to meet them,” said Bozic.

The Milk Check Transparency Report is something Bozic is doing, for free, on his own time. He is not relying on the University of Minnesota. He said he knows he’ll get some ‘hate mail’ but believes it is important. 

When asked why he is doing this, Bozic brought his reply to a personal level. He mentioned his mother, who is ailing, saying that she inspired him all his life to help people. He said it is hard for anyone to do this, but that he is fortunate to have built a technology company over the years and believes he is in a position to do something good.

On contract fairness, Bozic noted that Australia has required structures in their milk contracts, but they do not have regulated pricing.

“It’s their contracts that put them on an even keel,” he said. 

For example, no cooperative or milk buyer should be able to prohibit their producers from doing third-party milk weight and test samples. Contracts should protect farmers from being ‘failed’ in inspections simply because they are ‘prickly’ or ‘vocal’ producers.

He also noted that in countries, like Australia, milk buyers or cooperatives are not allowed to require exclusivity while also doing two-tiered pricing for base and over-base milk at the same time. 

“It’s one or the other,” said Bozic. “When those two lanes cross at the same time, we have a traffic accident.”

“Organizations like ADC and Edge are fighting for some of these interests of farmers, but they need more voices,” said Bozic.

He pointed out that the combination of exclusivity and base programs in the East may be insulating against production growth and surplus.

“That ‘insulation’ may be fine right now,” said Bozic. “But what about 10 years from now?”

What happens to dairy in the Northeast, for example, when processing has been built up everywhere else where production is being allowed, even encouraged, to grow?

 -30-

Milk solids seen as foundation for optimism in 2022

By Sherry Bunting, Farmshine, December 24, 2021

NEW HOLLAND, Pa. — “Milk pricing is backward, but look forward, and focus on components,” said Dr. Normand St-Pierre of Perdue Agribusiness speaking at Homestead Nutrition’s December Dairy Seminar in New Holland, Pennsylvania, where 200 dairy farmers heard from experts about the markets and the all-important goals of modifying milk price by improving components, and improving the milk margin by feeding healthy cows.

St-Pierre urged producers to be smart as they look at their costs — to not cut costs that sacrifice early lactation milk yield. He also pointed out how these higher prices for all components make feeding for components a continued area of focus to help the dairy in the face of milk check deductions related to cuts in base allotments and balancing.

Earlier in the program, Dr. Mike Van Amburgh shared Cornell University research on how to feed cows in a way that optimizes component yield by percentage, not just in total volume pounds. Total component pounds have historically been a function of total milk volume, but today, percentage counts because of per-hundredweight milk check deductions and over-base penalties.

“Milk volume is being discouraged in many regions of the country,” said Van Amburgh. “So the opportunity for producers here is to enhance their milk components, to make components a primary strategy, while still making your milk volume.”

St-Pierre noted that the next six months will be better than the last six months with a better milk price, and the futures markets certainly confirm this — moving even higher over the past four weeks. Global milk production is down 1% year-to-date, global skim milk powder stocks are low, butter production has been down for three months, stocks are low, and the world is getting short on butterfat, he said.

He observed that the Class III price was averaging over $19 and Class IV over $20 looking out six to 12 months in the futures markets. (That was the case on December 8, and now Class III is averaging over $20 and Class IV over $21.)

He sees the milk check butterfat price averaging $2.30 over the next six months; however, he said he believes this average could actually go higher, while protein should average $2.80. 

Another positive he mentioned is the ‘solids nonfat’ are being priced higher, and the ‘other solids’ are priced at almost double the historical average, driven by robust whey sales.

Even the USDA World Supply and Demand Estimates (WASDE) report the day after this meeting (Dec. 9, 2021) revised forecasts higher for butter, cheese and whey with NFDM forecasted at steady prices in 2022. As pointed out by St-Pierre, the current trends suggest this report could revise upward again in January, although much hinges on consumer responses to inflationary pressure in their buying habits.

The 2021 All Milk price average was increased in the WASDE report to $18.60, buoyed by yearend strength, and the 2022 All-Milk price forecast was revised upward to $20.75.

If current futures market levels are realized, these higher trending milk prices should help dairies keep pace with rising input costs, although experts calculate feed costs to be up by around $2.50/cwt for 2022 vs. 2021 and all costs combined could be up by almost $3.50/cwt for 2022 vs. 2021.

St-Pierre dug into this from a milk pricing standpoint, and he shared the good news that negative producer price differentials (PPD) from 2020 and the first half of 2021 have “quieted down.” 

Negative PPDs eat into location adjustments and change the way components are ultimately valued when massive de-pooling of milk occurs in Federal Milk Marketing Orders.

“We have positive PPDs right now because Class III and IV are trading closer together,” he said, noting that the new Class I formula averages the two manufacturing classes and adds 74 cents, so when they trade farther apart, the producer sees the hit in Class I also, dragging down the blend price and leaving smaller or negative producer price differentials (PPD).

The Class I pricing change and negative PPDs are issues St-Pierre has written about.

“Now they are asking the people who made the mess to fix it. That escapes me,” he said, noting the Federal Milk Marketing Orders (FMMO) were created in the 1930s and designed at a time when there were hundreds of cooperatives and milk did not move all over the country and the world.

St-Pierre said FMMOs exist for “orderly marketing,” but the government made a ‘fix’ that is like fixing an old horse. “He’s fixed but not running very fast and may be at the point where the horse has had enough.”

FMMOs were also created at a time when people drank more milk. Today, he said, they eat more cheese.

Showing a graph of per-capita fluid milk sales from 1980 (234 pounds per capita annually) to 2018 (146 pounds per capita annually), St-Pierre asked: “Does that look to you like an area of growth? If that marketer worked for Coca-Cola, he would have long been unemployed.”

While he acknowledged fluid milk has been disadvantaged by “lazy marketing,” he also said promoting milk is very hard because “we are not in the same world as in 1980. We are competing against water — with food in a bottle that we have to keep refrigerated. Cheese is easier to sell.”

The per-capita rise in cheese consumption since 1980 reflects this.

In the past, said St-Pierre, the FMMOs were designed to put the highest price in the bottle because that was the most perishable product. Today, as for the past 20 years, the prices are still based on the surveys of four products at wholesale – cheddar, butter, nonfat dry milk, and whey.

It was designed to have those prices for Classes 1 through 4 go in that order, he explained. “But it doesn’t work that way anymore.”

“As the butter price goes up, just make more butter, right?” he asks. “But it’s hard to make butter in a cheese plant and vice versa.”

“If I’m a processor, and I built a big cheese plant, and it cost me $150 million, I make a lot of cheese,” St-Pierre quipped.

Plus the built-in make allowances encourage single-product, single-class production plants running at full capacity, regardless of what the market is doing.

“It will take a while to change that dynamic,” he said.

“All milk is paid on components, but handlers don’t pay for components in the same way in the (FMMO) pool,” said St-Pierre. He explained that milk handlers pay for components according to how the milk is used, what “class” of products the milk was utilized in.

Class I price is based on butterfat and skim, Class II on butterfat and nonfat solids. Class III, which is 55% of the milk utilization, pays mainly on protein and other solids with an adjustment for butterfat because cheese production also uses a lot of fat. Class IV pays on butterfat and nonfat solids.

“We price things backward. Tell me one thing that you can go out and buy and drive out of the store and a month later tell that store what you will pay for it,” St-Pierre said, noting this is essentially what milk buyers do through the FMMO system, month after month, year after year.

He encouraged producers to be looking ahead three months, which he admitted is hard to do when the pricing for their product is so far behind the transaction. Still, he said following the markets gives a good indication, and there is more reliability in the 3-month window than 6 to 12 months out in the futures markets. 

The Class III price is normally higher than Class IV, but for the next few months, even through the next year, it looks to be flip-flopped.

Using an ‘imaginary’ FMMO, he divided all four classes as 25% utilization, which in reality is not too far off what the Northeast Order can come close to. In that four-class FMMO, the different ways different classes pay for components cause the books to be out of balance after producers are paid their advance check based on protein. Knowing each class pays differently, the class price differences and utilization become the key to how that PPD is either positive, flat or negative.

When Class IV was $6 below Class III, cooperatives and processors de-pooled a lot of milk, St-Pierre observed: “They could just pay 20 cents over that $13.80 price to get the milk and then sell it back at the $20 (Class III) price. That makes the co-op look good but the producer gets shafted,” said St-Pierre.

In FMMO 30, where most of the utilization is already Class III, processors made a lot of cheese in 2020-21, but they didn’t pool a lot of that milk, and they got it cheaper, he explained.

Bottom line, said St-Pierre, the Federal Orders were never designed to operate this way. Then along came the “little change” in the Class I price. In the past, the FMMOs used the ‘higher of’ Class III or IV as the way to set the Class I base.

“If I am a bottler, I don’t like that (higher of) because I don’t know how to hedge it,” said St-Pierre. “I know my price ahead of time anyway (through advance Class I pricing), but I still don’t like the ‘higher of’ so I go and tell Congress to average it and add 74 cents. Then Covid-19 hits, and producers lose over $750 million.”

St-Pierre notes that the industry is trying to fix the system, backwards.

He confirmed that where the negative PPDs kick Northeast producers is in the location adjustments. A smaller than normal positive PPD is a loss, and when it goes negative, it eats into the location adjustment, which is also supposed to be positive.

Working through all of these thoughts about pricing and consumption pattern, St-Pierre left dairy farmers with the good news that for the foreseeable future, the PPDs should be positive, although smaller than normal in some months, and Class III and IV prices are both on the rise. 

Production has slowed, and demand is good, including for milk powders and whey. These positive supply and demand factors are confirmed in the dairy product production and cold storage reports.

With the very reasonable expectation of good prices for milk components, in the face of base penalties, balancing assessments, and other milk check deductions that a dairy producer encounters, the best way to navigate is focusing on component yield because the deductions are a flat amount per hundredweight of total volume, whereas component yield becomes a percentage increase in the value of those milk hundredweights.

Look for more on other interesting nutrition topics and milk quality award winners as this article continues in a future Farmshine.

-30-

Farmers send June milk check data and preliminary review is revealing

MilkCheckSurvey072920

UPDATED! By Sherry Bunting, Updated from the article in July 24 Farmshine print edition

BROWNSTOWN, Pa. — June milk check reports are pouring in after Farmshine’s previous article about negative Producer Price Differentials (PPD) included a request for milk check data from readers. Along with the data, we are receiving many comments.

One producer notes the PPD had typically averaged a positive $1.50 in his area of the Northeast, but for June, it was a negative $5.38, a loss he pegged at $15,000 for the month for his farm.

Another producer in the Mideast area noted a loss of over $60,000 in component value, which would not be covered in the way expected by the Dairy Revenue Protection (DRP) policy he had purchased. The negative PPD loss represents “basis risk”, whereas tools like DRP, forward contracting, even DMC, mitigate “market and margin risk.”

The “markets” did their thing. Demand went up, cheese prices went up, Class III milk contracts gained, but the de-pooling in most Federal Milk Marketing Orders (FMMOs) ate up most of the doubled protein value and other component value gains for farms across most of the country, as reflected in a steeply negative “basis”. There’s really no risk management tool for that, and we’ve received correspondence indicating that producers who opted to manage risk, had losses where they thought they would have coverage.

It’s difficult to make sense of it all, especially when FMMO Market Administrators explain all the workings of PPDs in terms of advance pricing, sudden commodity increases that are complicated by advance pricing of Class I, pooling and de-pooling of milk when Class I milk value is lower than the blend price. But these explanations leave out the fact that Congress changed the way the Class I Mover is calculated at the request of NMPF and IDFA in the 2018 Farm Bill, without holding a milk pricing hearing that so many have requested.

This is a big concern going forward. The spreads between the higher Class III price over the Class I Mover are $9.62 for June and $7.75 (estimated) for July.

From July, forward, the lagtime is less of a factor. However, the new way vs. the old way of calculating Class I is a much bigger factor in predicted negative PPDs because as Class III has been rising, Class IV has been falling, widening the divergence.

The final math equation for the Class I Mover is the same as it was: Class I Mover = (Base Skim Milk Price x 0.965) + Butterfat Price x 3.5). What changed in May 2019 is the way the Base Skim Milk Price is determined before it is placed in that calculation. It used to be simply the higher of the two Advance Pricing Factors — Class III or Class IV — that was plugged into that equation as the “Base Skim Milk Price. Now the two Advance Pricing Factors are added together, divided by 2, and 74 cents is added to that to produce the Base Skim Milk Price for the final equation above.

Under the previous way, using the “higher of,” the August Class I Mover would have been $24.36 — $4.58 higher than the $19.78 Class I Mover announced on July 22 for August. Also, under the previous method, July’s Class I Mover would have been $19.13 — $2.57 higher than the announced July Class I Mover at $16.56.

These new concerns in FMMO pricing bring new variables into how producers manage risk, so the market value that did not make it into milk checks or risk management tools cannot be blamed completely on Covid-19 pandemic disruptions. A convergence of factors have created a situation where the mechanics of risk management like Dairy Margin Coverage (DMC) and Dairy Revenue Protection (DRP) — as well as forward contracting — may not work as intended for all producers in all regions in a time of disrupted markets and extreme risk, with fairly recent changes to certain milk pricing formulas.

This market disruption, and the fallout in negative PPDs, should signal to USDA and the Congress that a National Hearing on Milk Pricing is overdue. Piecemeal changes have consequences. The de-pooling exacerbates the situation. In June, de-pooling contributed to removing hundreds of millions of dollars of value from milk checks across all Federal Orders. As one producer asked, who gets that money? The answer: It depends.

First, if the end-product “market” value found was paid to the plant or cooperative or handler, and if the handler consequently de-pooled the milk and didn’t pass that value back to the farms voluntarily or contractually, then we know who has the money. If the “market” did not pay what we see in the USDA end-product pricing or on the CME spot market and futures markets, then it’s not real money.

Given the wide range in milk check data with most of the nation coming in around $5 to $7 lower than the Upper Midwest — and a $4 range in FMMO uniform prices to begin with — it’s obvious the “market” is paying. But the calculations are not passing through to milk checks, except in the Upper Midwest Order 30 where 50% of pooled milk receipts were utilized as Class III milk, even though Class III volume reductions suggest significant de-pooling occurred.

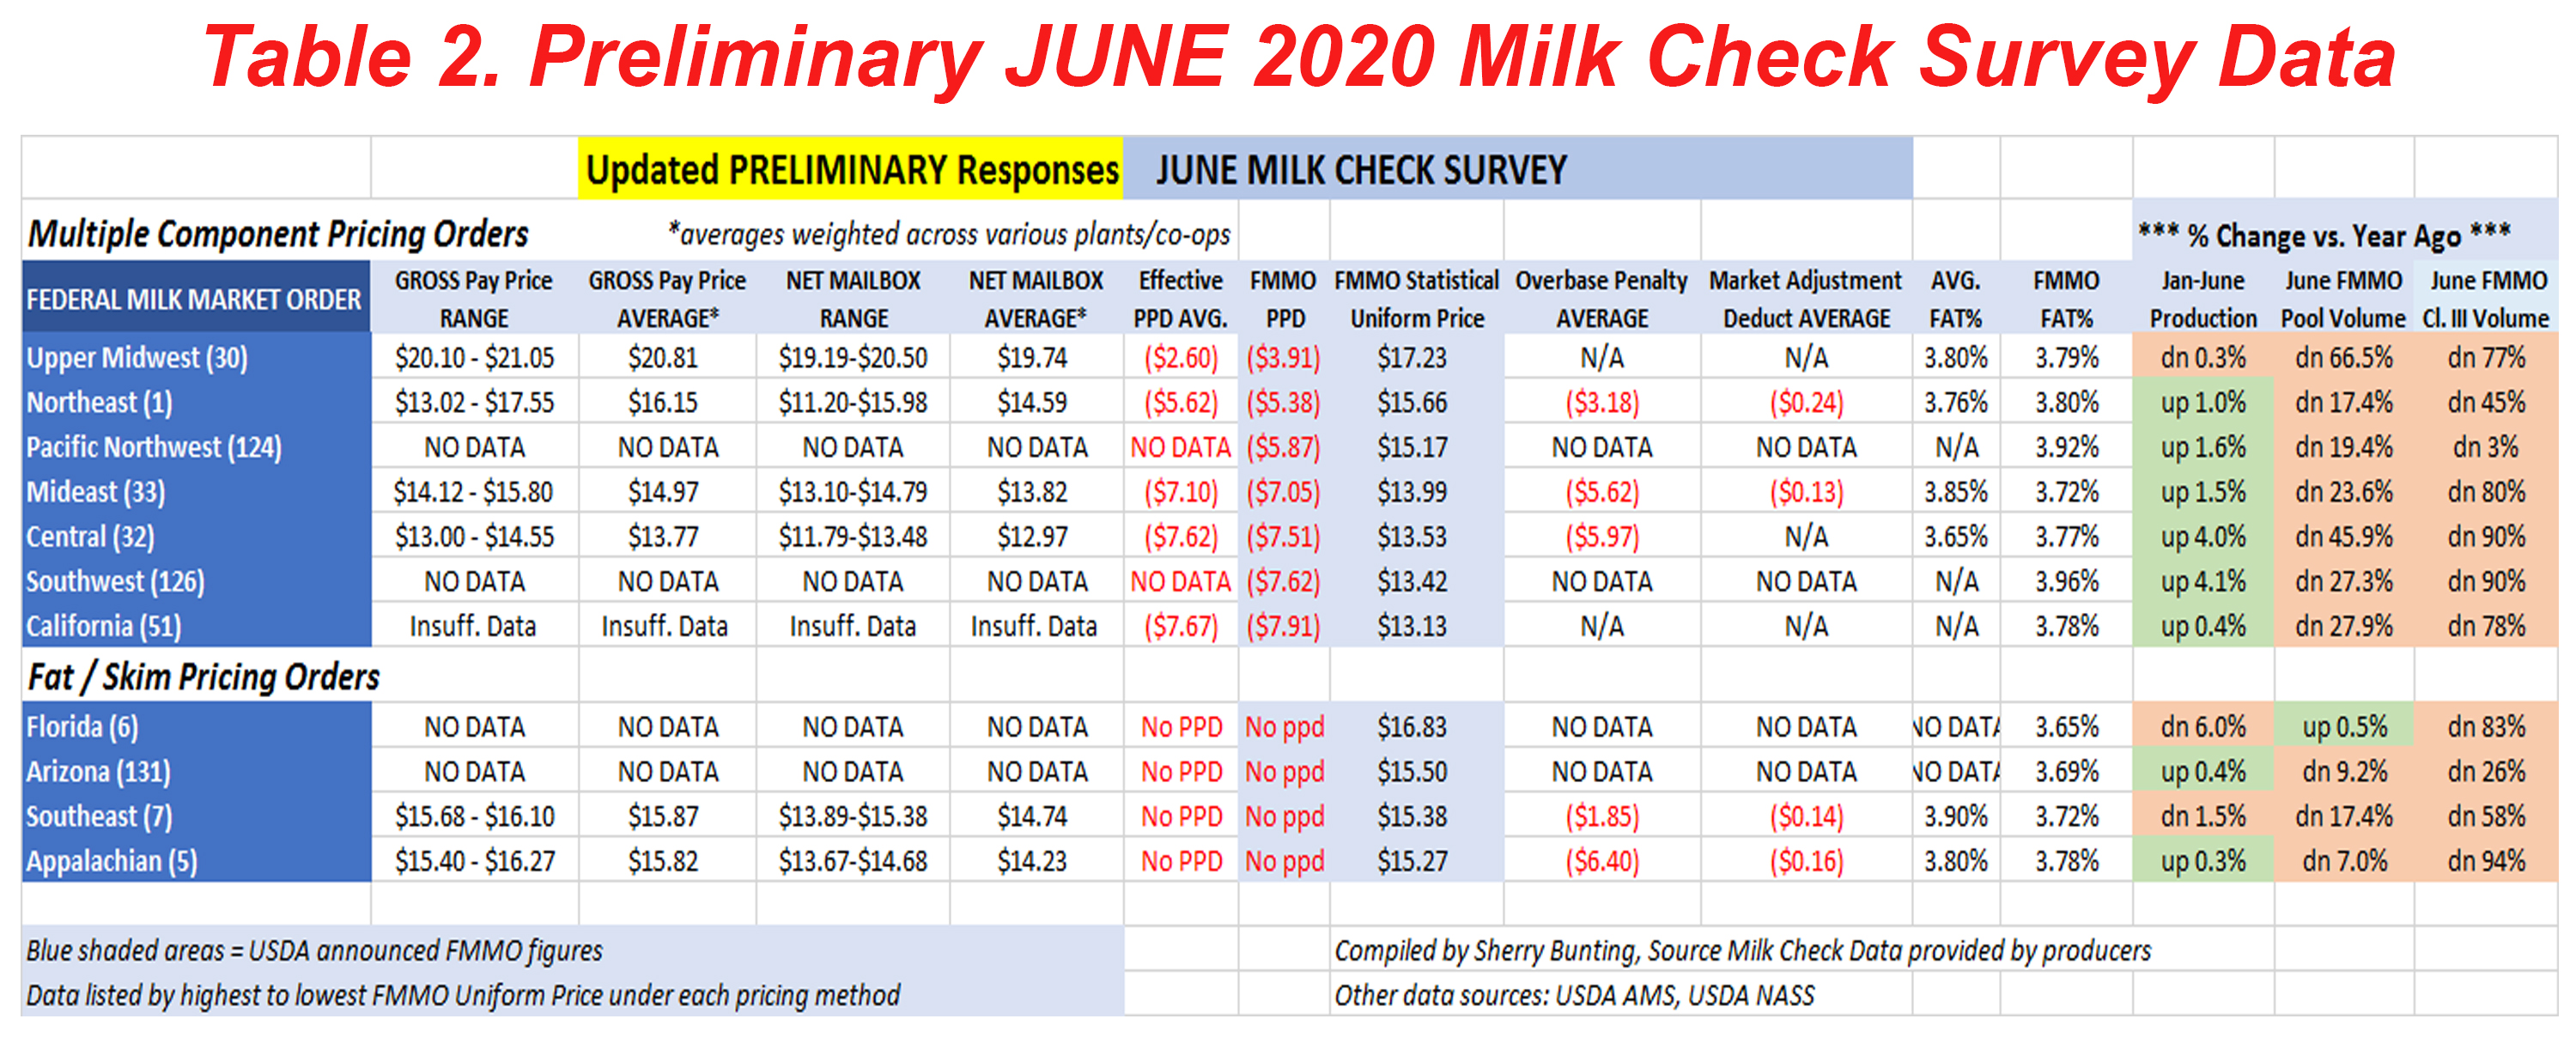
Let’s look at preliminary data from Farmshine readers around the country (Table 2 above).

So far, over 150 Farmshine readers from six of the 11 FMMOs have provided milk check data. Since only a couple responses were received from California, we did not do any math for FMMO 51 yet, until we receive more data. At this writing, we have not received any milk check data from Orders 6 (Florida), 126 (Texas and New Mexico), 124 (Arizona) and 131 (Oregon and Washington).

What is evident in the preliminary review is the significant gap between the highest and lowest gross and net prices paid.

For each of the six FMMOs — where we had enough data to do some math — we see the difference of $7 between the FMMO with the highest average gross price paid (before deductions) of $20.81 in the Upper Midwest (FMMO 30) and the lowest average gross price paid of $13.77 in the Central Order (FMMO 32). When looking at the range of price data, the spread is $8 between some check data as low as $13.02 gross pay price in Pennsylvania to $21.05 in Minnesota.

The other FMMO average data fall into place $4 to $6 below the Upper Midwest with gross pay price averaging between $14.97 and $16.15 before deductions.

On the net mailbox price (after deductions), the difference is almost $7 between the highest mailbox average of $19.74 for FMMO 30 and the lowest average of $12.97 for FMMO 32. Average net mailbox price for FMMOs 1, 33, 5, and 7 trail FMMO 30 by a difference of $5 to $6. (See Table 2.)

Respondents for each of the FMMOs so far are a mix of mostly co-op members, but also some independent shippers, and a range of cooperatives — national and regional — are represented in the data.

In the Upper Midwest FMMO 30 for June, where PPD was least negative and Class III milk utilization was the highest (50%), the Uniform price already reflected the smallest negative PPD in the $3s compared to negative $5s and $7s everywhere else. At the same time, reports indicate the cheese plants and co-ops in that region even shared some of that smaller loss, knocking it back into the negative $2’s.

While large penalties for overbase milk still remain part of the pricing equation, it was not a major factor for most producers in June, perhaps because producers are reducing production as well as dumping, donating or utilizing overbase milk differently to avoid these penalties. This process is continuing into July. In the Northeast and Midatlantic region, reports of milk dumping were confirmed in July. Mostly this was due to producers wanting to avoid overbase penalties, but at least one report involved temporary “plant equipment issues”.

Of the milk check data shared with Farmshine, most showed producers were shipping 93 to 99% of their base for June. But some data includes producers seeing significant assessments on small amounts of overbase milk by both smaller regional cooperatives and larger national footprint cooperatives — except in the Upper Midwest. Also, in pockets of the Southeast, check data show some penalties were waived as a base / overbase blend was shown on checks, but then in another spot, the stub reported “revenues available to pay” a better price. In those instances, it appears the overbase penalty was eliminated and market adjustments reduced, which added 30 to 50 cents to what the location blend would have been.

Elsewhere, producers overbase deductions ranged $1.50 to $6.40.

Another variable was “market adjustments”. No “covid” deductions were seen in June check data, however, many had “market adjustments” deducted to the tune of 13 to 24 cents. In a few cases, the “market adjustment” was described in an earlier letter stating that the “covid” deduction for co-op costs incurred in April and May was being spread out evenly over several months forward.

The averages for the Northeast and Mideast FMMOs belie the wide range in prices. For Pennsylvania, alone, the range in gross pay prices before deductions was more than $4.00/cwt.  Even after adjusting for butterfat, the range was $3.50. The lowest net mailbox prices submitted by anyone in any FMMO came from Pennsylvania producers, with instances as low as $11.20/cwt mailbox for June. Overbase penalties and market adjustment deductions contributed to these lower nets.

In Pennsylvania, the Pa. Milk Marketing Board (PMMB) over-order premium (OOP) was set large for June, but was a small factor on most milk checks. It does appear that the western half of the state in Order 33 received at least some OOP benefit to make up for taking a more significant beating from negative PPDs.

Very few producer milk checks showed numbers other than zero in the PMMB OOP line item. However for Pennsylvania producers shipping directly to some Pennsylvania bottlers in the Mideast order, the benefit was $1.25 to $2.00/cwt listed as a line item and serving to simply pull them up closer to where the Northeast blend price sat. Remember, negative PPDs in the Mideast Order, which includes western Pa., were in the $7s. Negative PPDs in the Northeast Order, which includes eastern Pa., were in the $5s.

Meanwhile, out-of-state bottlers buying Pennsylvania milk and selling into the Pennsylvania minimum retail price market passed on about 10% of this floor-setting OOP in June at about 30 to 50 cents.

June’s PMMB OOP was over $4 per cwt because $3.68 was added to the normal $1 to make the difference between the USDA Class I Mover and a temporary $15 Class I floor. The PMMB used the OOP to temporarily accomplish this, but then became an island as USDA did not follow suit. The USDA had canceled a hearing requested by cooperatives petitioning it do the same nationally.

Looking at the milk check data we have received, it is obvious that USDA would have done well to have followed PMMB’s lead — as they were petitioned to do in April — to set a temporary Class I Mover floor at $15 through August.

At the time that the PMMB took its action, USDA AMS Dairy Programs had indicated in correspondence shared with Farmshine that a date was set to meet with petitioners to hear evidence for a national temporary Class I floor.

But, when word got out, certain dairy economists, such as at the University of Minnesota, along with Minnesota Milk Producers and other entities, including Walmart, protested that this idea of a temporary Class I Mover floor would “decouple” Class I milk and be unfair to the Upper Midwest where Class I utilization is low. Mainly, they complained that a move to stabilize Class I would “disrupt” milk markets and affect the Dairy Margin Coverage.

Well, folks, that disruption happened anyway — in reverse.

What we have seen, in the absence of a Class I floor, is total disruption and instability due to the inherent lagtime in Class I pricing reflecting market trends, and additional severity because of how the Class I Mover calculation was changed by Congress, with no hearing at all, just placed in the 2018 Farm Bill at the direction of National Milk Producers Federation (NMPF) and International Dairy Foods Association (IDFA).

The so-called “markets” have not worked for any of the FMMO’s dairy producers except for the Upper Midwest where the complaints over flooring the Class I Mover arose.

The change in the calculation of the Class I Mover in the 2018 Farm Bill was implemented one year ago in May 2019. By using an average instead of the “higher of” to determine a base value for components or fat/skim, the Class I Mover no longer moves in concert with the highest value of components or fat/skim.

This is a problem because there is no way to assess market value on Class I in an of itself. Class I beverage milk is a designated loss-leader by the 800-lb retailer-processor gorillas like Walmart and Kroger. Also, in a couple states, the retail milk price is regulated to some degree.

Class I’s new “averaging” method is contributing to the removal of hundreds of millions of dollars from Federal Order pools through de-pooling.

It’s hard to predict what “reality” or “alternate reality” the USDA NASS All Milk price and Dairy Margin Coverage milk margin will reflect when they are announced on July 31.

This is a serious problem, given the widening divergence between Classes III and IV on the futures markets. This divergence is a warning that the current four-class system should be re-evaluated. When two manufacturing classes for stored products can be averaged to produce the basis of value for fresh products and beverages, it’s easy to see how large entities in the marketplace can make decisions that affect imports, storage, supply and demand to move one side of an “averaging” equation and create lopsided returns outside of FMMO pools. If milk moved to its highest value use and components were valued on multiple cross-class markets, a stable Class I base could be established as one piece of an overall value mix with less incentive to de-pool lopsided value.

For example, the July Class III contract stood at $24.41 on the futures markets as of July 27 — now $10.76 higher than the Class IV contract at $13.65. August Class III stands at $22.11, $8.39 higher than the Class IV contract at $13.72. September Class III, at $20.49, is $6.34 higher than the $14.15 Class IV contract. October Class III, at $18.90, is $4.51 higher than Class IV at $14.39. November Class III, at $17.53, is $2.95 higher than Class IV at $14.58. The gap narrows for December, but as of July 27, the difference between the two classes is still more than the $1.48 ‘magic number’ with December Class III at $16.60, $1.81 higher than Class IV at $14.79.

Creating even more value loss in every FMMO in June — whether priced by multiple components or fat/skim — is the amount of Class III milk that was de-pooled. Total volume pooled across all Federal Orders was 9.5 billion pounds in June, down 36% from a year ago and down 28% from May (May 2020 was down 13% from year ago).

While June milk production was reported on July 21 at 0.5% above year ago, milk dumpage in June was down considerably in terms of what showed up on FMMO pools. We know farms are dumping and diverting to avoid overbase penalties, but the pooled “other use” milk, including dumpage and animal feed, was down by 44% compared with a year ago in June. The only Federal Order to have more “other use” milk in June than in May was the Appalachian Order 5, and Central Order 32.

Table1_YTD_MilkDumped(Bunting)r
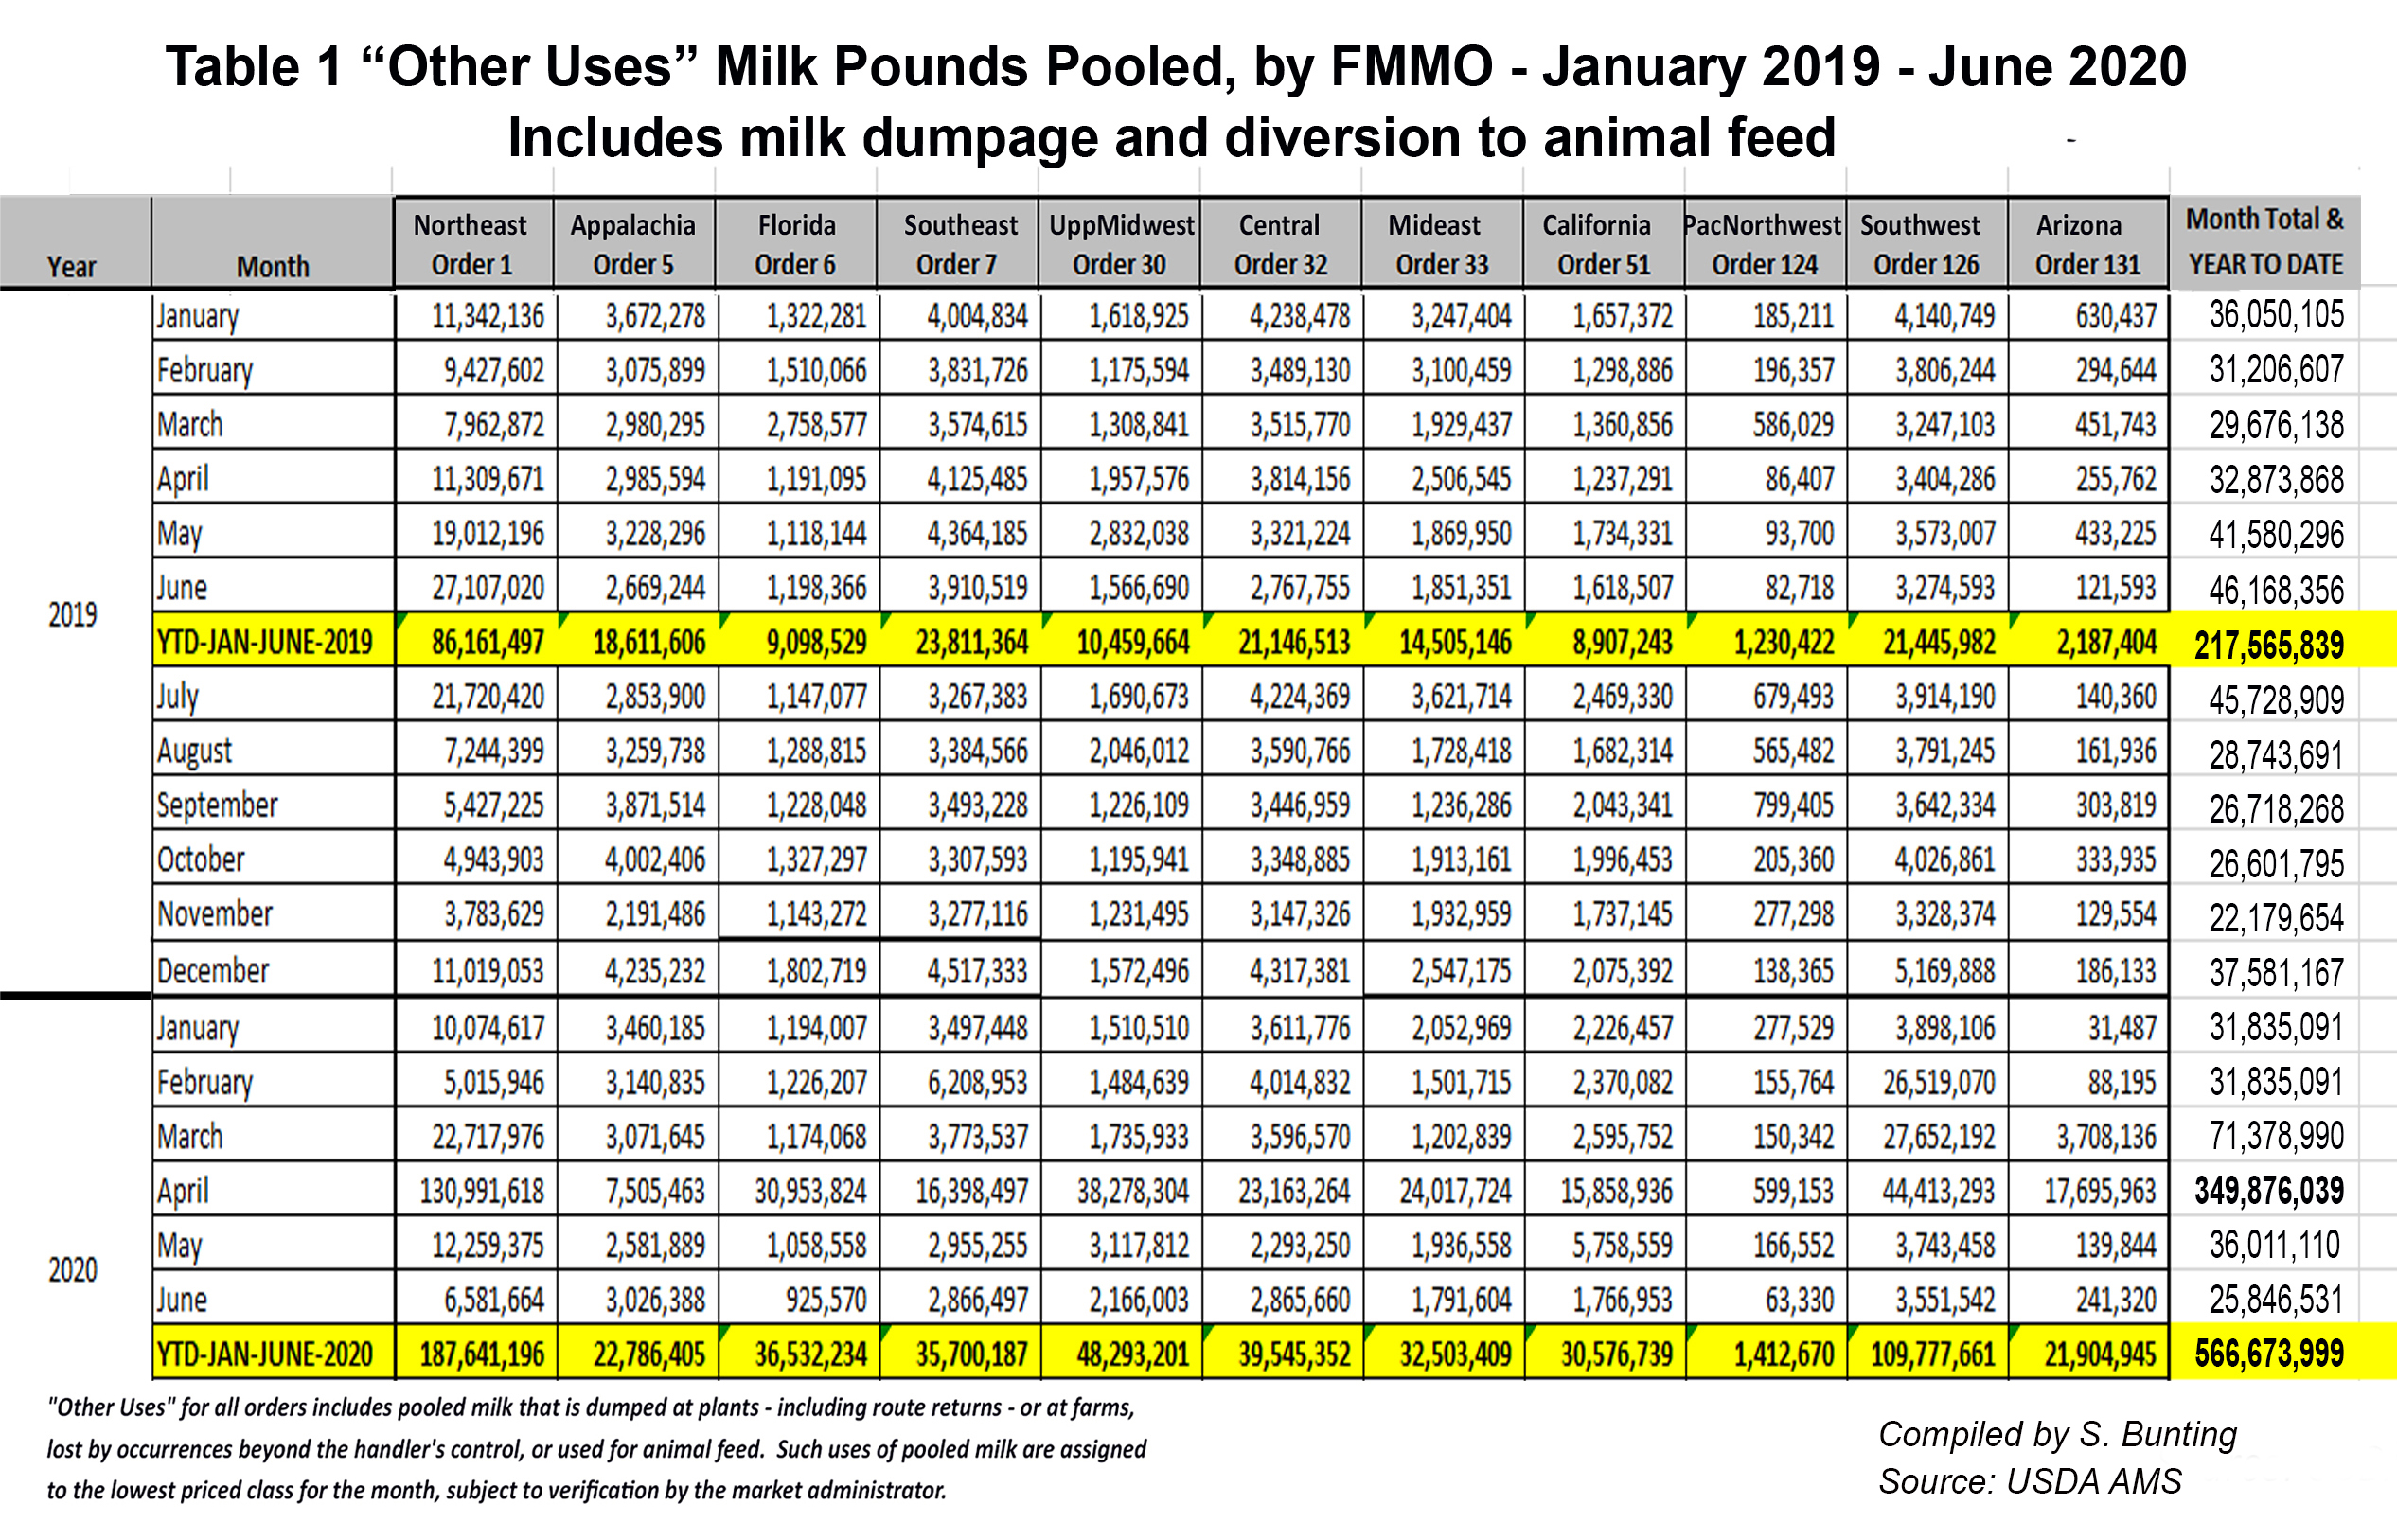
Table 1 (above) shows the “other use / milk dumpage” pooling data. What is mind-boggling is that year-to-date milk dumped totals at 566.7 million pounds for just the first 6 months of 2020, is 125 to 150 million pounds greater than the 12-month annual totals for each of the past five years.

Dairy producers wishing to submit June milk check data as well as next month’s milk check data for July to broaden this survey geographically, please send: Gross price, net mailbox price, PPD, butterfat and protein, other deductions (especially ‘market adjustment’ deductions), overbase penalties if applicable, along with your location or the FMMO in which your milk is marketed and information stating whether you market with a cooperative or as an independent. There is no need to provide your name or your specific co-op or plant affiliation unless you choose to include that.

Please consider emailing me at agrite2011@gmail.com or text/call 717.587.3706. All information is aggregated anonymously by state, region and FMMO.

-30-

Global dairy thoughts Part 3: Do regulated milk checks reflect true value?

KYTour-223w.jpgBy Sherry Bunting, Farmshine, June 1, 2018

BROWNSTOWN, Pa. — To discuss the U.S. role in global dairy trade and the role of global trade in how the value of milk is, or is not, reflected in milk checks at the farm level, we first have to understand our product differences.

For starters, there are subtle differences between global skim milk powder (SMP) and domestic nonfat dry milk (NDFM), traders say they view the two as one market. Global SMP trends translate promptly to CME trends for NFDM.

Product listings describe SMP as a standardized product with a minimum 34% protein, whereas NFDM is variable, ranging as high as 38% protein. The U.S. price for NFDM normally lags the global price for SMP, in part because it lacks the standardized specifications. Thus, the lag is even more significant on a per-protein-unit basis.

The U.S. makes more SMP today than 10 years ago, but NFDM production, typically a byproduct of butter production, remains more than four times larger than SMP. Year-to-date SMP production through March trailed year-ago by 15% while NFDM production was up 15%.

According to the U.S. Dairy Export Council (USDEC), the U.S. exports 50% of its combined production of SMP and NFDM, and the U.S. has about 25% of the total export marketshare for these powders.

Butter is also different. Globally-traded European style butter is fermented (soured) before churning, mostly sold unsalted and contains 82 to 85% butterfat. U.S.-produced butter is churned from sweet cream that is not cultured, contains 80% fat, and is available salted or unsalted.

More European style butter is made today in the U.S. than 10 years ago, and it has curried favor with urban chefs for its cooking and baking properties.

Specialized dairy ingredients, like milk protein concentrate (MPC) and whey protein concentrate (WPC), are also significant globally and rely on specialized technologies and markets. The U.S. makes and exports a lot of whey products, WPC and WPI as byproducts of cheese production. These products have significant value to ingredient markets.

At a meeting in Lebanon, Pennsylvania last fall, Dr. Mark Stephenson, University of Wisconsin-Madison, indicated how some cheese plants view the whey products as primary to the cheese. Specialty plants have also come online to make MPC and MPI for infant formula, sports and geriatric beverages, and other products for dairy ingredient markets.

Another product that is important globally, and traded only on global platforms, is whole milk powder (WMP). It is a market equalizer. The global market performance of WMP gives insight about both the fat and the protein sides of the market.

China’s current demand for WMP may be driving what is now being described as a potential “acute” global shortage of butter.

Like whole fluid milk sales in the U.S., WMP sales globally represent whole milk finding one market rather than being broken down for various markets. Often, this product is purchased by countries that reconstitute it for drinking milk and flavored dairy beverages. The bakery and confection industries also utilize both SMP and WMP.

More U.S. plants are making WMP. Interestingly, USDA’s March Dairy Products Report showed production of WMP at 21.6 mil lbs — up 11% from February and a whopping 93% greater than a year ago. It was the highest level of WMP production since 1993.

GlobalThoughtsPart3_CHART#2
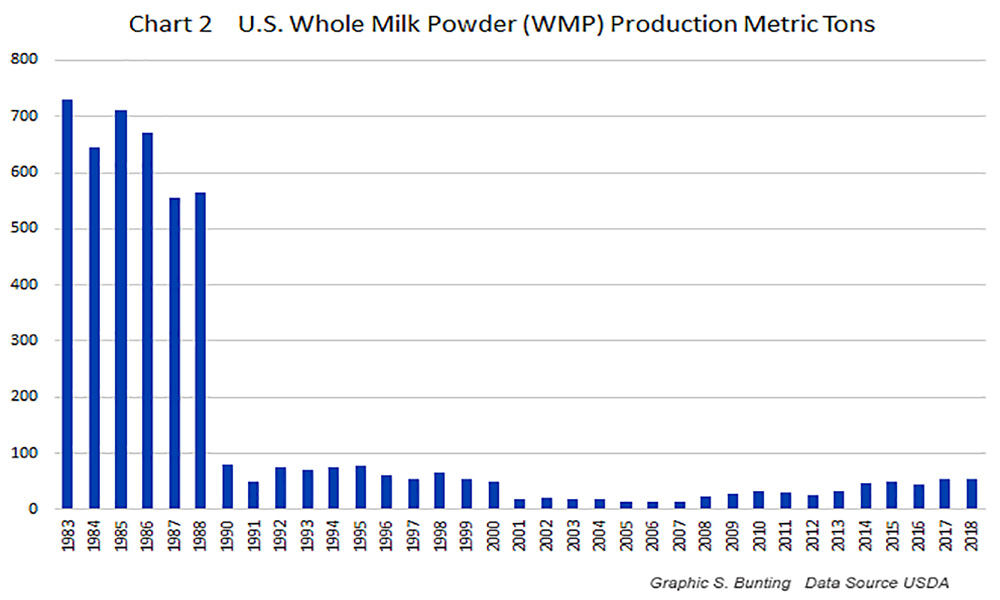
In fact, going back through USDA records to 1983, the U.S. once made up to 700 metric tons of dry whole milk powder (Chart 2). We don’t hear about that.

In the 1980s we also exported a lot of WMP, up to 420 metric tons of it (Chart 3). We don’t hear about that either.

GlobalThoughtsPart3_CHART#3One reason we don’t make more WMP today is we have a large and growing domestic market for cheese and butter and cream products. U.S. manufacturers want to keep the cream and not sell it overseas, whereas other dairy-producing nations — like New Zealand with its much smaller consumer population — make a lot of WMP for Asia.

China is a large, but erratic, buyer of WMP. In first quarter 2018, the U.S. exported 20% more WMP than a year ago, but the amounts are small compared to skim powders.

In fact, the drive of consumers away from margarine has led to greater sales and production of butter in the U.S. As more butter is made, and more cream salvaged for other products, NFDM production also increases as part of that model.

 As fluid milk sales decline in the U.S., more WMP can be made, and as whole fluid milk demand is restricted by dietary guidelines, more fat becomes available as a byproduct to dairy processors.

Right now, China is buying a lot of WMP and paying higher prices. So high, in fact, that Australia is seeing limitations in infant formula sales in their country due to China’s pull on powder stocks from that country.

GlobalThoughtsPart3_CHART_#4
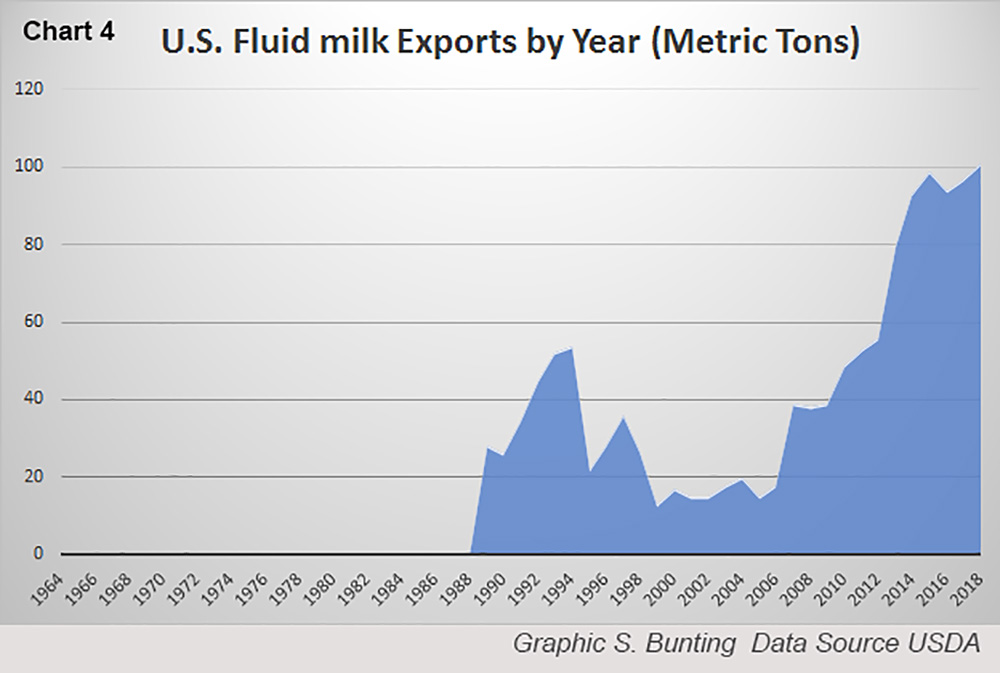
One lesser-known category of exports that grew by 85% in the first three months of 2018 is UHT shelf-stable milk. China is the biggest buyer, and DFA is a primary supplier with its California Gold, a primarily 3.5% fat, shelf-stable drinking milk with a non-refrigerated shelf life of one year. This product is shipped to Walmart and other chains in China. These sales have grown significantly since 2006. (Chart 4)

(Interestingly, here in the U.S. during the first five months of 2018, major supply-chain-related absences of whole milk from supermarket shelves — while fat free and lowfat rows are stocked full — have been observed across a wide swath of the U.S., mainly east of the Mississippi, and across a variety of supermarket chains with a sort of random consistency)

With the U.S. system set to keep the cream and export as much powder as possible, problems arise when geopolitical factors interrupt that export market pipeline. This can have big consequences in a market where demand for cream vs. skim is out of whack — in part because the U.S. dairy industry’s processing, marketing, pricing, promotion and exporting schemes have been designed to work in tandem with 40 years of flawed lowfat government health guidelines.

A national dairy pricing hearing is needed to look at the reality of today’s domestic and global markets.

Are dairy farmers receiving the true value of the milk they produce? If the true value of milk components were passed through the supply-chain to the farm level more accurately, could this help encourage right-sized production growth?

Can the pricing of “growth milk” be more directly aligned to global market growth trends? We’ll explore that in a future part of this series, and it is an important question for the industry to tackle.

In Part Four, we’ll look at the differences in U.S. and global trading platforms and pricing.

 -30-