By Sherry Bunting, published Sept. 14, 2020 in Farmshine
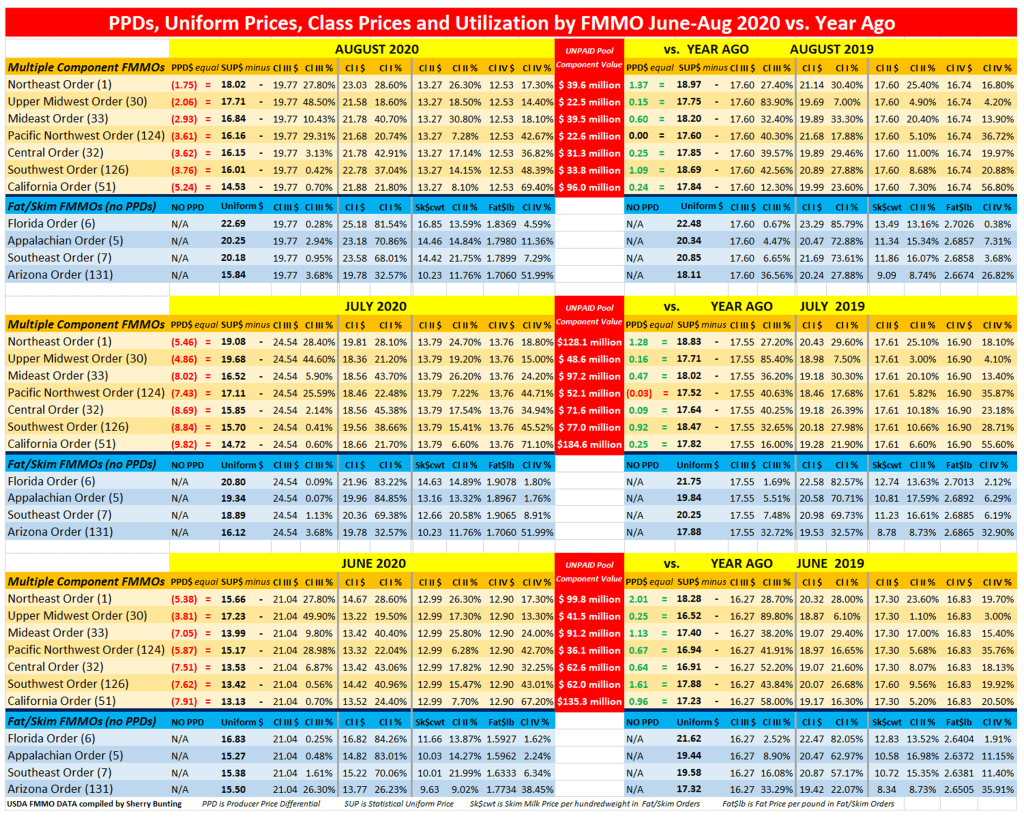
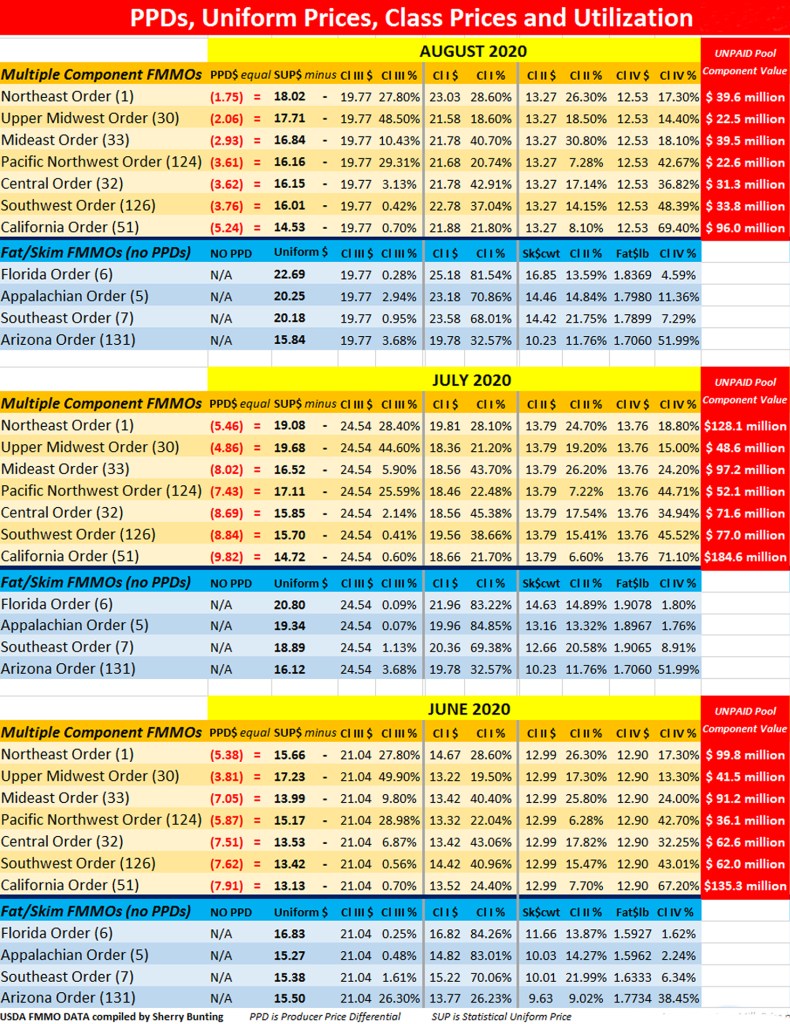
BROWNSTOWN, Pa. — The negative Producer Price Differentials (PPDs) persisted in final payments for August milk received by dairy farmers in mid-Sept., according to uniform prices announced by USDA Federal Milk Marketing Orders September 11 and 12.
This pushed uniform prices lower in some Federal Orders, while others were higher. (See chart above).
The bottom line is a cumulative loss impact of $1.48 billion in UNPAID market value of milk components across the seven Multiple Component Pricing Federal Milk Marketing Orders (FMMOs) — not to mention unquantified losses in the 4 fat/skim pricing FMMOs — after three months of significantly negative PPDs for June, July and August milk as paid in July, August and September 2020.
Losses incurred by the four Fat/Skim Pricing Orders, but are not easily quantified on the FMMO pool balance sheet and were most pronounced in June for those FMMOs.
More losses will be added for September milk, paid in October, and the CME futures indicate loss impacts could continue through yearend.
This unpaid component market value — represented by negative PPDs (the difference between the uniform price and the announced Class III price) — has cost dairy producers using risk management tools even more as such tools utilize primarily the Class III price as a market indicator. When the Class III price rallies, but the milk check doesn’t mirror that, a producer can be left without the higher price in the milk check and without the coverage through the risk management at the same time.
This would be like having a fire and having the adjuster look at a neighbor’s intact house to determine no claim, instead of looking at the house that burned. When the market says ‘no fire here’ but the house burned down just the same, it’s a double-whammy.
Remember, fluid milk does not have a ‘market’ because the Class I price is both regulated at varying degrees by state and federal marketing orders, and at the same time, fluid milk is used as a loss-leader by the nation’s largest supermarkets. Thus, it is impossible to determine the “market value” of fluid milk.
Add to this the restriction of fat content in schools and other institutional feeding by the federal government, and market value of fluid milk – especially whole milk – is further impinged by non-market factors.
This means the value of the components in fluid milk can only be assigned by the value of dairy products made with milk. When that market rallied on Class III, while plummeting on Class IV, the “market” value was pulled instead of pooled.
Several factors are creating the problem.
First, Covid-19 caused disruption in markets that are now heavier on the retail side and lighter on the foodservice side. The industry is adjusting to this.
Second, a ‘band aid’ approach to milk pricing reform in the 2018 Farm Bill changed the Class I relationship to an uptrending manufacturing class market by using an averaging method instead of the “higher of” Class III or IV. This is just one reason a national hearing on milk pricing with report to Congress is long overdue.
Third, the spread between Class III and IV milk futures persists, so even when Class I and Class III were close in price for August, Class IV and II were so far behind that negative PPDs and de-pooling occurred. Current levels show a $4 to $5 spread for September and October and $2 to $3 for November and December.
Fourth, government purchases and import-export factors are affecting storage of Class III and IV products differently, which in turn affects the markets differently.
As mentioned previously in Farmshine, the most recent USDA Cold Storage Report showed butter stocks at the end of July were up 3% compared with June and 13% above year ago. On the other hand, total natural cheese stocks were 2% less than June and up only 2% from a year ago.
On the import side, the difference between cheese and butter is stark. Cheese imports are down 10% below year ago, but the U.S. imported 14% more butter and butterfat in the first seven months of 2020 compared with a year ago.
Is it any wonder butter stocks are accumulating in cold storage to levels 13% above year ago at the end of July — putting a big damper on butter prices and therefore Class IV?
Butter demand is up. Butter imports are up. But the PRICE of butter is at the lowest level since 2013.
Analysts suggest that butter and butterfat imports are higher because U.S. consumer demand for butterfat is higher. But that reasoning doesn’t make sense because the Class IV price and butterfat value is depressed because of “burdensome inventory of butter” in cold storage, holding back butter prices and amplifying the Class III and IV divergence that is at the root of the negative PPDs.
Again, a national hearing on milk pricing is long overdue. Even the risk management tools touted by USDA do not perform as expected due to inverted and divergent price relationships and reduced ability to transfer market value.
On October 5, 2020, American Farm Bureau published its analysis which evaluated a similar loss impact. Read the AFBF analysis here
-30-