— Along with more imports and shifts in cheese production, major manure-driven expansion in cheese-heavy Central U.S. put pressure on region’s ‘disrupted’ processing capacity
By Sherry Bunting, Farmshine, Updated in reflection from original publication in July 7, 2023 Farmshine
EAST EARL, Pa. — What has driven the rockier road for 2023 milk prices? Many things, and manure may be top on the list.
In fact, we’ll cover the ‘manure effect’ in a future article. But are we beginning to see the methane wheel-of-fortune behave with the ‘cobra effect’? (The British government, concerned about the number of venomous cobras in Delhi, offered a bounty for every dead cobra. Eventually, however, enterprising locals bred cobras for the income.)
This happened with greenhouse gases in the past. It happened with a byproduct gas of making refrigeration coolant. In 2005, when the UN Intergovernmental Panel on Climate Change began an incentive scheme. Companies disposing of gases were rewarded with carbon credits, which could eventually get converted into cash. The program set prices according to how serious the environmental damage was of the pollutant. (Like making cow methane seem like new methane when it’s not). As a result, companies began to produce more of the coolant in order to destroy more of the byproduct gas, and collect millions of dollars in credits. This increased production also caused the price of the refrigerant to decrease significantly.
With this prelude, let’s look back in retrospect on what I reported in the July 7, 2023 Farmshine when milk markets were in a tailspin hitting their low for the year — just 10 days before the gradual turnaround began.
As losses in the CME spot cheese markets and Class III milk futures markets continued through July 6, the Federal Order benchmark Class III price for June was pushed down to $14.91 per cwt. and protein down to $1.51/lb, July and August futures went well below the $15 mark, with Class III below $14.
Let’s look at the supply side of the January through June 2023 supply and demand equation.
Looking at the May Milk Production Report that was released in June, it’s hard to believe the bearish response we saw in milk futures and spot cheese markets that occurred based on a mere 13,000 more cows nationwide that month. It was a paltry 0.1% increase over a flat 2022, along with 11 more pounds of milk output per cow for the month (up 0.5% over flat 2022).
This flipped the switch from a gradually lower-than-2022 market to one that plunged sharply and suddently into the dumps – and all the analysts said: ‘We’ve got too much milk for demand.’ (In fact, two months later, processors are pointing to June and July milk dumping and $10 under class spot milk price as proof that USDA is setting Federal Milk Marketing Order minimum prices too high! — I digress).
As noted in Part One of this series that was published in the june 30 edition of Farmshine, other converging supply-and-demand factors plagued cheese markets that month until July 17 — despite basic fundamentals of these milk production reports not being all that bad.
USDA Dairy Market News said spot loads of milk were being discounted in June by as much as $11 below the already abysmal FMMO Class III price in the Midwest. The milk dumping that reportedly began in May in Minnesota moved into Wisconsin through June and into July. The July 5th Milwaukee Journal Sentinel reported “Truckloads of fresh farm milk have been flushed down the drain into Milwaukee’s sewer system recently as dairy plants, filled to the brim, couldn’t accept more.” The story notes this had gone on for weeks, and the amount has declined to 5 trailer loads per week by the time The Milwaukee Journal Sentinel published its report.
For the price and milk dumping fallout, economists and analysts blamed the higher milk production (though it was modest on a national basis but huge in the Central U.S.). They blamed the higher cheddar cheese production (not accompanied by higher inventory), and they blamed the lower volume of exports (modestly below year ago on a year-to-date solids basis).
Globally, milk production was up (it is declining this fall), they said, suggesting U.S. prices needed to get below the falling global prices in order to recover more export volume (instead of dumping in the sewer). Well, they got what they wanted as the U.S. prices dropped like a rock through June until the turnaround on July 17.
Of course, no one (but Farmshine) mentioned the rising imports that were reported in Part One of this series.
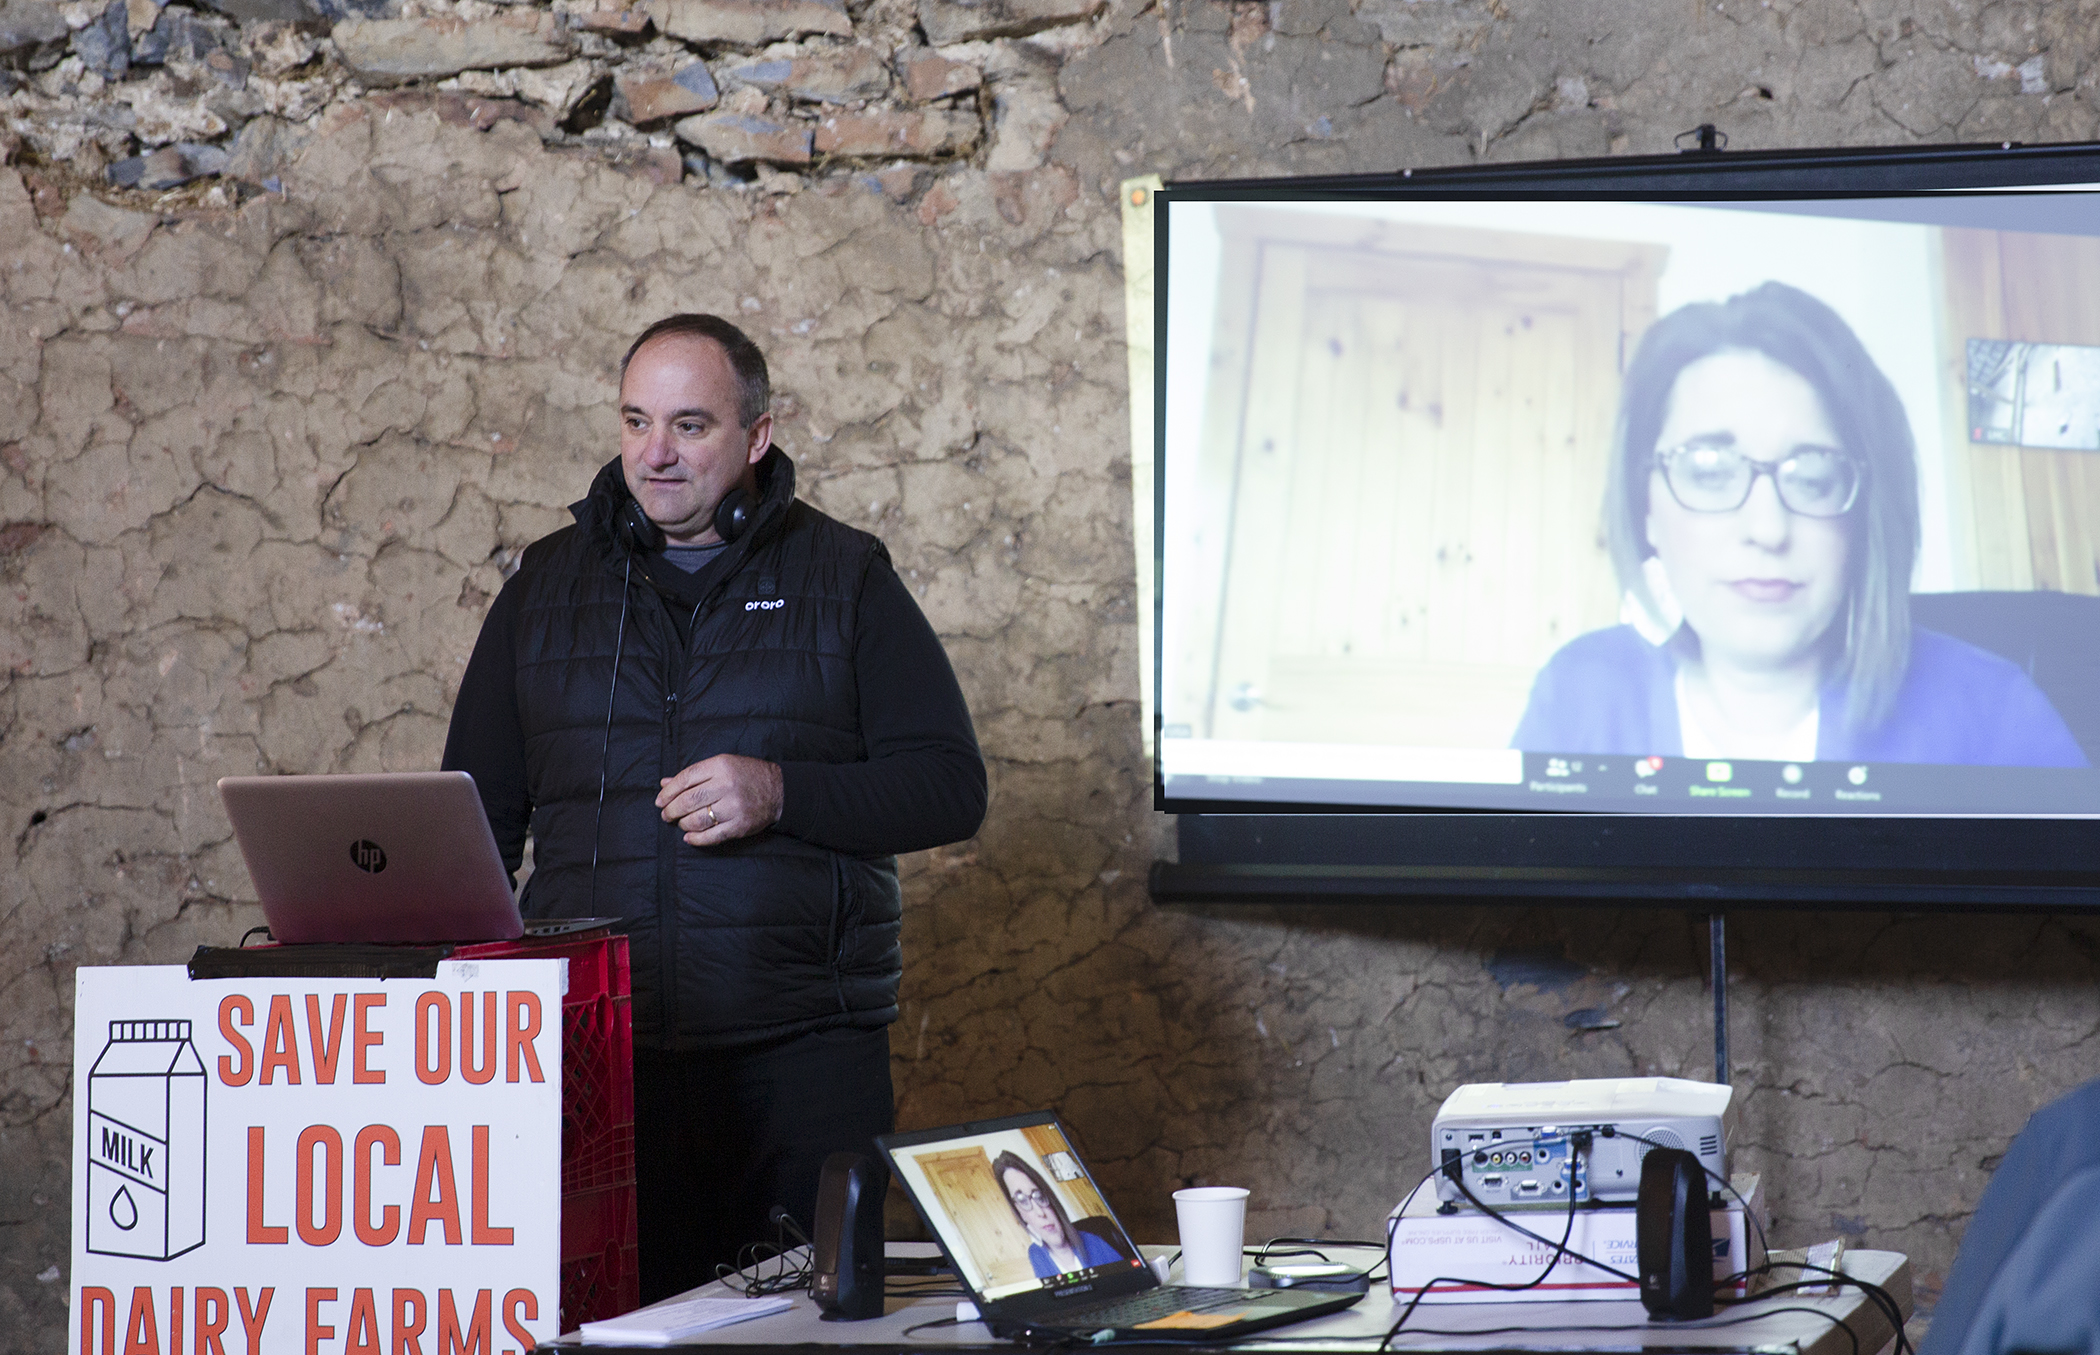
Looking for context on the imports, we reached out to retired cooperative executive Calvin Covington, who follows these things on a total solids basis and has been watching the whey market as a leading milk market indicator. We learned that his calculations on a total solids basis, pegged January through April 2023 imports of dairy products into the U.S. at levels 15% higher than a year ago!
“The 15% equals 39.3 million lbs. more solids,” Covington wrote in an email response to a Farmshine question. “Most of the imports are coming from Europe. Dairy demand is very weak in Europe, consumers have less money to spend. Those milk solids are moving out of Europe.”
Noted Covington in June: “On a total solids basis, ending dairy stocks as of April 30th are 3% higher than last April. The 3% equals 61.5 million lbs. more solids.”
This means the 15% increase in January through April dairy product imports — on a total solids basis — were equal to more than half (63%) of the 3% increase that was reported in April domestic ending stocks of all dairy product inventories on a total solids basis.
Think about that for a minute. Product came in and was inventoried while domestic milk was dumped, and producer prices were crushed so that the domestic price could fall below the global price so then the U.S. dairy exports could increase? It makes the head spin.
Class I sales were down during this time, especially in the Midwest where some fluid plants have closed. Fresh Italian cheese production was down, and that’s a big one for Wisconsin. Together these factors pushed more milk to make more American cheese at that time, some of it delivered to consumers in smaller packages (rationing).
A wrinkle in the market-fabric comes from the dairy foods complex importing higher volumes, and there are the fake bioengineered microorganisms from which excrement is harvested and described as ‘dairy casein or whey protein without the cow.’ These analogs are being heavily marketed to large food manufacturers making dairy and bakery products as carbon-footprint-lowering dairy protein ‘extenders.’
So much so, that National Milk Producers Federation recently sent a letter to FDA asking the agency not to make the same mistake with these fake products as has been made with plant-based frauds.
However, as we look at the modest milk production increase for the first half of 2023, overall, and compare it to 2022, the total comparison was flattish then and it is declining now as we move toward Q3.
But there’s another major twist to this supply-demand equation:
The location and purpose of dairy expansion is undergoing accelerated transformation on a geographic and structural basis. This transformation is part of the “U.S. Dairy transformation” that the national dairy checkoff has promoted in its Pathways to Net Zero Initiative… and it is affecting the milk pricing for all U.S. dairy farmers, everywhere.
Here’s the problem: Milk production in the Central U.S. has expanded by much more than the national average.
Even University of Wisconsin economics professor emeritus Bob Cropp noted in his writing after the May report that growth in the Midwest — where cheese rules the milk check — was outpacing processing capacity, and the existing capacity to process all this milk was being reduced by labor and transportation challenges.
The concentrated expansion of milk production in the Central U.S. has been accelerating since 2018, but a new paradigm is now in effect: New concrete is being poured in the targeted growth areas driven more by manure, than by milk, and new dairy processing plant construction that is completed and in the works is targeting the same areas.
This is creating a production bubble that is a flood within calmer seas.
Some are calling it the California RNG gold-rush as developers construct Renewable Natural Gas (RNG) projects — especially on new large dairies — for the California RNG market and to collect the low-carbon-fuel credits for the California exchange and other exchanges that are and will be emerging, thanks to the USDA Climate Smart wheel-of-fortune.
We’ve heard the national dairy checkoff managers from DMI talk about profitable sustainability, markets for manure, promotion of other revenue streams for dairy farms as part of the mantra the checkoff has assumed for itself as speaker for all-things-dairy for all-dairy-farmers on what is “sustainable” for the industry.
When the Net-Zero Initiative was launched — along with DMI’s industry transformation plan — it was something that had been in the works since 2008 and emerged more prominently in the 2017-21 period when the former and current U.S. Ag Secretary Tom Vilsack did his stint as top-paid DMI executive, presiding over the U.S. Dairy Export Center (USDEC) under DMI’s umbrella and as a top-talker on the Innovation Center for U.S. Dairy, also under DMI’s umbrella.
All three: DMI, USDEC, and Innovation Center for U.S. Dairy are 501c6 non-profit organizations contracted to spend checkoff dollars. A 501c6 is essentially a non-profit that can lobby policymakers, whereas the 501c3 National Dairy Board cannot.
In 2020 and 2021, the Innovation Center — filing tax returns under the name Dairy Center for Strategic Innovation and Collaboration Inc. — doubled its revenue from around $100 to $150 million annually to $300 to $350 million.
We all heard it, read it, thought about it – maybe – that the checkoff was morphing into a facilitator for the transformation of the dairy industry led by manure-promotion, not necessarily milk promotion, with the mantra of feeding the world, being top-dog internationally, and meeting international climate targets with a Net Zero greenhouse gas pledge. (That pledge and the methane calculation are another story Farmshine readers are aware of, but we’ll leave that big driver off the table for this discussion.)
Here we are, now seeing an industry being created from within the broader dairy industry with new production driven by manure, in regions where new or expanding cheese, whey and ingredient plants are being located and potentially displacing production from plants and farms elsewhere that are not tied-into this manure-to-methane wheel-of-fortune using dubious science and math to overpeg a cow’s global warming impact.
While that production bubble is building in targeted growth regions with cheese-heavy milk checks, driven in part by manure-focused expansion, it bursted at the seams this summer due to a processing capacity bottleneck, compounded by supply chain disruptions and a sudden decrease in the production of fresh cheese at other plants and a sudden 18% decline in the amount of milk processed for Class I fluid use in the Upper Midwest.
Here’s the sticky wicket. A review of the 2022 end-of-year milk production report along with reports issued in the first half of 2023, revealed that, indeed, the Central U.S. was “awash in milk.”
Zooming in on the milk production reports, we see South Dakota continuing its fast and uninterrupted growth — up 15.5% for 2022 vs. 2021, and up 7.4% Jan-May 2023 vs. 2022 — having leapfrogged Vermont, Oregon and Kansas and closing in on Indiana in the state rankings.
Neighboring Iowa leapfrogged Ohio in 2022 with a 4.7% gain in milk production Jan-May 2023 vs. 2022. Number 7 Minnesota grew again after taking a breather with a 0.6% decline in 2022, then increasing 2% in production Jan-May 2023.
The tristate I-29 corridor, where cheese processing capacity has been expanding, was up 3.3% in milk production collectively with 19,000 more cows Jan-May 2023. Add to this the 1.3% increase in number 2 Wisconsin’s May milk production, and we saw the quad-state’s collective increase was 203 million pounds of additional milk in the region vs. year ago in May, although Wisconsin’s contribution came from 3000 fewer cows, according to USDA.
Just west in number 3 Idaho, production jumped 3.1% with 7,000 more cows Jan-May 2023.
To the east in the Michigan-Indiana-Ohio tri-state region — where the large new cheese plant in St. John’s, Michigan is fully operational — collective milk output was up 2% over year ago with 11,000 more cows. In 2022, this tri-state region was down 2 to 3% for the year compared with 2021.
Number 5 New York made 2.1% more milk with 7,000 more cows in May vs. year ago, with most of this expansion in the western lake region.
Number 1 California shrank milk production by 0.7% in May with 2000 fewer cows, and number 4 Texas flattened out its multi-year accelerated growth curve to make just 0.8% more milk in May than a year ago with just 1000 more cows, largely affected by the devastating Texas barn April fire resulting in the loss of around 20,000 cows.
Neighboring New Mexico continued its multi-year downward slide, ranked number 9 behind a flat-to-slightly-lower milk output in number 8, Pennsylvania.
Milk production in New Mexico fell 3.8% in May vs. year ago with 10,000 fewer cows. This followed an 8.4% decline in milk production and a 30,000-head cut in cow numbers for the year in 2022. Producers there cite well-access limitations, severe drought, high feed costs with reduced feed availability, as well as receiving the rock-bottom milk price as the reasons dairies in New Mexico are closing or relocating.
With all of these factors in play, the production reports show a clear paradigm shift in how the dairy industry expands via transformation. It is being driven to where feed is available and milk output per cow is higher, and it’s now being driven by a non-milk-related factor: MANURE for the RNG ‘goldrush’
A saving grace is cattle are in short supply, with replacements bringing high prices. This fact is slowing the bubble, production is declining now, and prices are recovering from those unanticipated lows.
-30-