
USDA production and cow number revisions reveal how very small changes in domestic production now have very large and disproportionate impact on milk prices
By Sherry Bunting, Farmshine, November 3, 2023
EAST EARL, Pa. – The editorial opinion/analysis on the cover of the Oct. 27 Farmshine tells only part of the story after reviewing the USDA NASS downward revisions of five months of previous milk production data on Oct. 19 and looking at the monthly USDA Economic Research Service Supply and Utilization Report, released Oct. 16.
From a supply and demand perspective, there have been more positive fundamentals this year than the spring and summer milk prices would have led us to believe.
The graph shows it all.
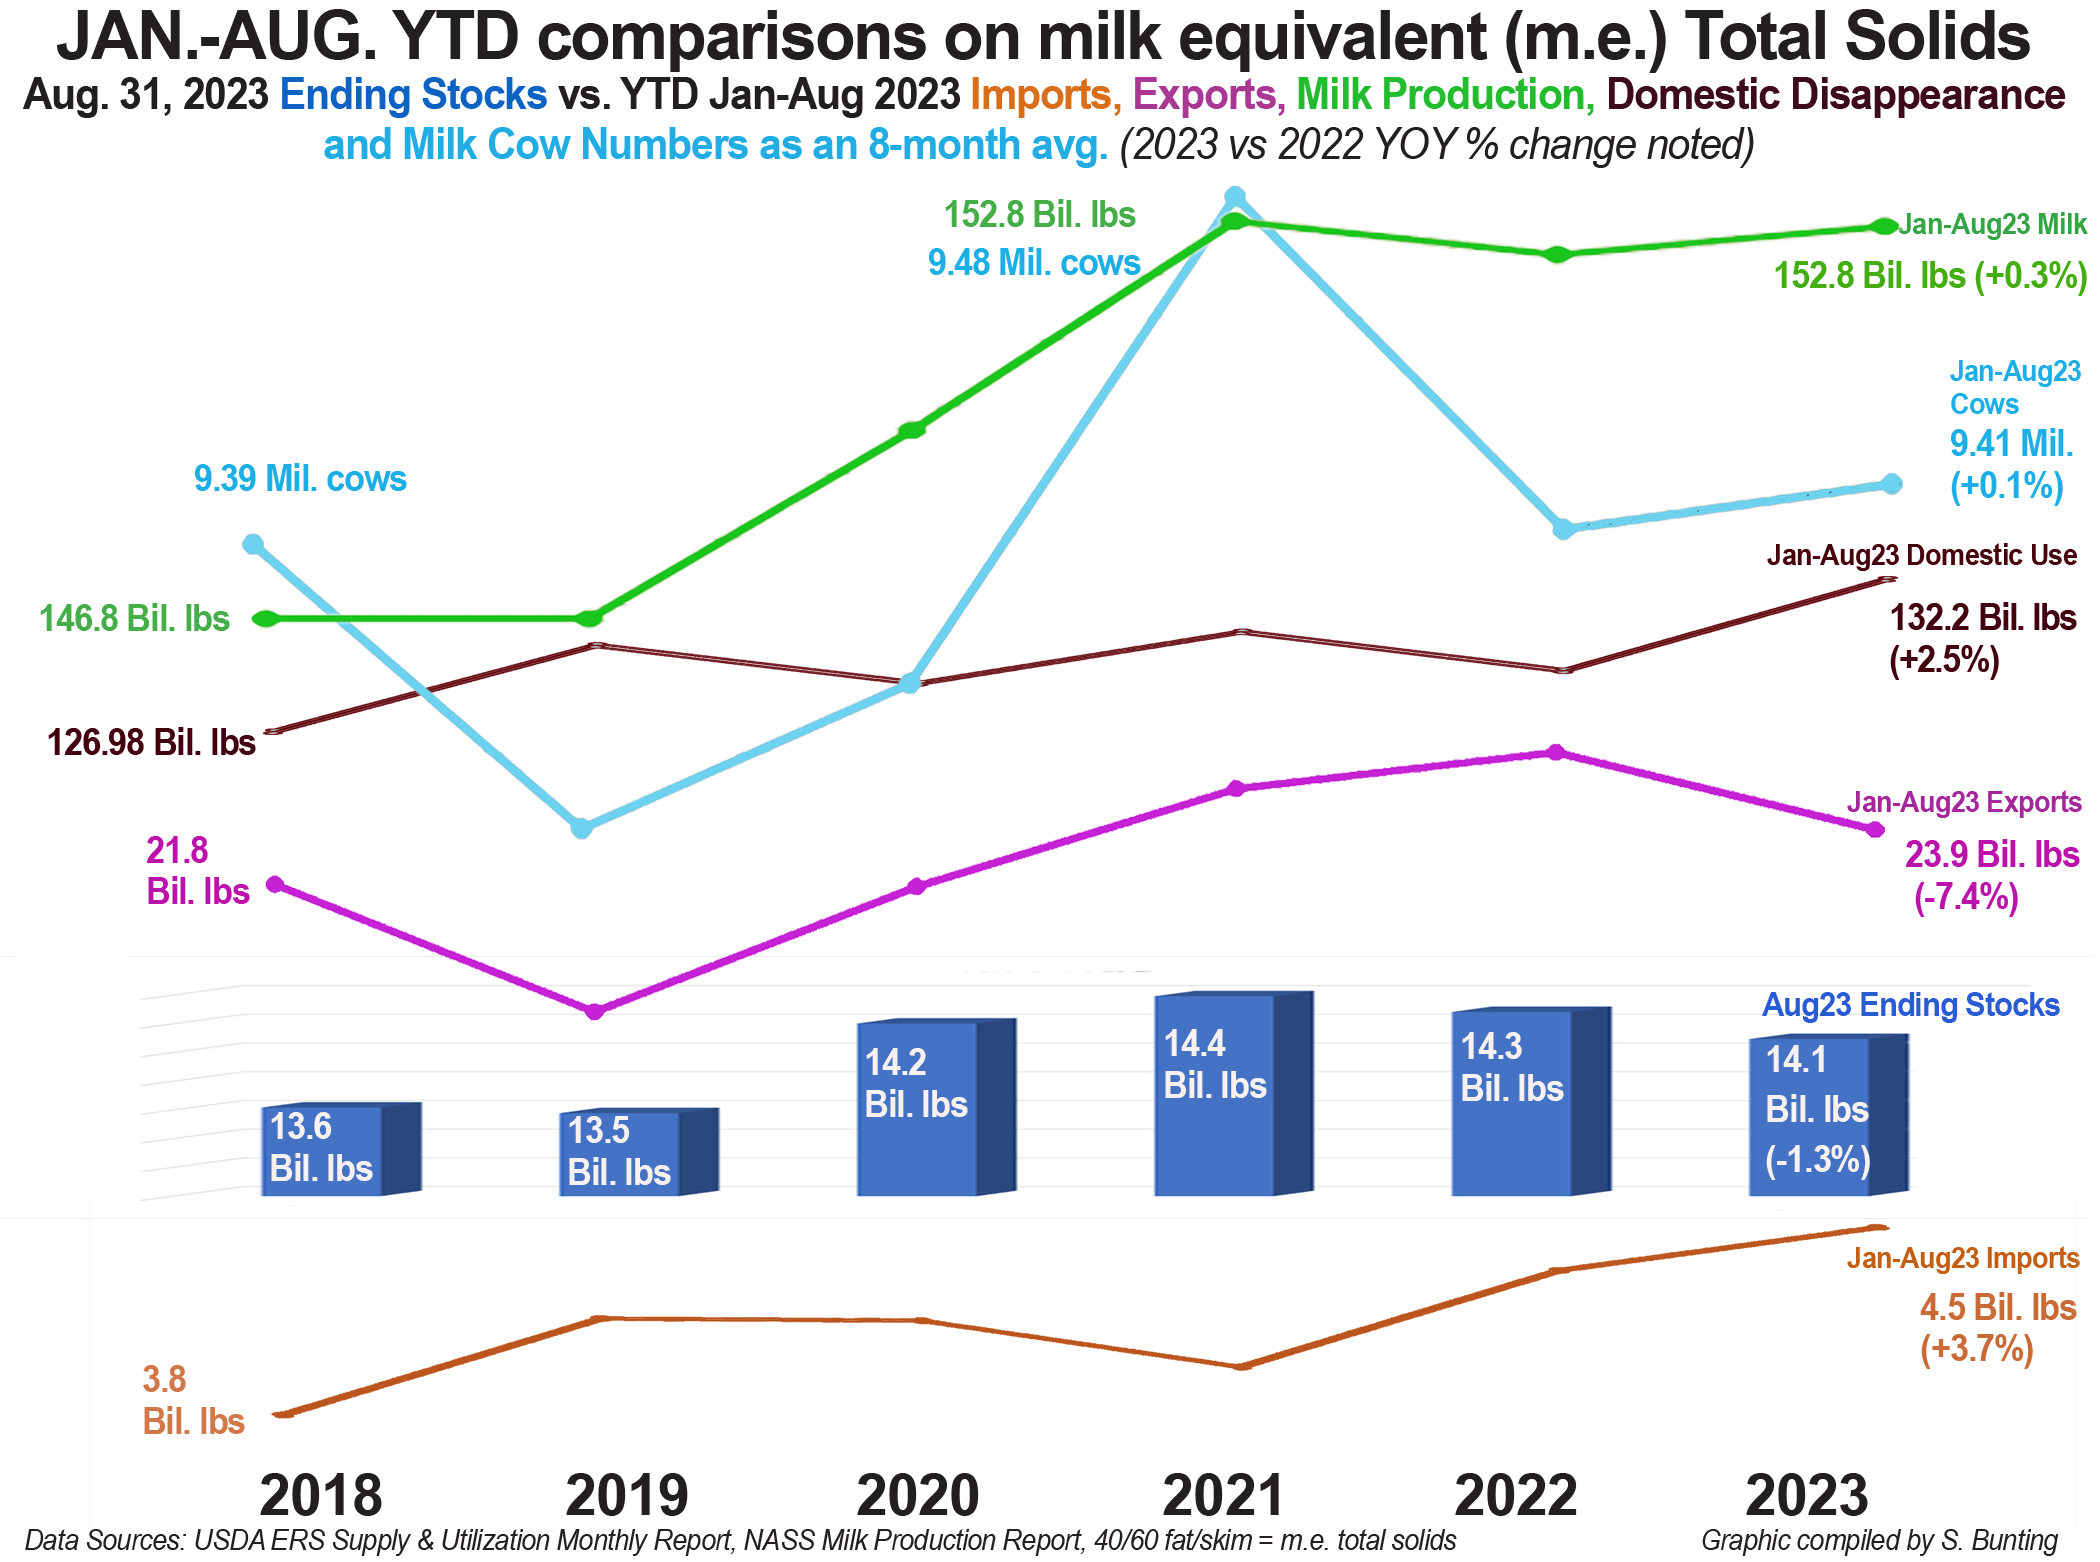
We went back to 2018 to calculate January through August year-to-date (YTD) total solids on a milk equivalent (m.e.) basis for the supply side: milk production, imports, beginning stocks on January 1st and ending stocks on August 31 in each of the six years 2018 through 2023. We also took this approach with the demand side: exports and domestic disappearance.
Here’s what we found:
First and foremost, beginning stocks of dairy products came into January 2023 up 0.5% above year ago. Milk production also came into the first quarter on an upswing of just slightly more than 1%. After the USDA revisions of previously reported April through August data, cumulative milk production Jan-Aug 2023 is 152.8 billion pounds, up 0.3% from Jan-Aug 2022 but unchanged from Jan-Aug 2021.
Meanwhile, exports started the year on a higher note before slipping through the middle months to be down 7.4% as a cumulative total for the Jan.-Aug. period compared with the year-to-date totals for Jan.-Aug. 2022. The cumulative export volume total for those months was also 3.96% lower than Jan-Aug 2021, but nearly 6.5% above 2020 and 2018 and nearly 24% above 2019.
Simultaneously, dairy imports ended the period 3.7% higher than a year ago, and back in the January through April period —precipitating the steep drop in farm level milk prices — we saw cumulative total solids imports up a whopping 15.3% above year ago.
By April 30th, ending stocks had crept 3.3% higher than the previous year, but domestic disappearance was still beating the previous year by 1 to 4%, except January’s domestic disappearance was off 1.5%. For the Jan-Aug 2023 period, domestic disappearance is up 2.5% vs. the same period in 2022.
By August, ending stocks dropped to levels 1.3% below year ago and the lowest August ending stocks on m.e. solids basis since 2019.
Given these numbers, we see precious little space to maneuver in these markets when changes in exports and imports become the tail wagging the entire dog. Combined, they can make such a big difference to the farm-level milk price – even in the face of domestic demand beating year ago every month and what has turned out to be flattish cumulative milk production.
Since April 2023, not only have milk production and cow numbers now declined after several months of disastrous prices, the USDA has now also re-evaluated and revised lower its previously reported numbers. (We said from the beginning the cattle inventory just wasn’t there to support the earlier-reported milk cow numbers, so either USDA under-estimated the biannual inventory or over-estimated the monthly milk cow numbers).
The accelerated imports were a wild card this year from January through April before slowing down in May through August. The cumulative year-to-date total for January through August is 3.7% higher than a year ago after being double-digits higher at the end of April.
Still, when we factor in the 8% gain in imports in 2022 vs. 2021, the total of 4.5 billion pounds (milk equivalent) for the first eight months of 2023 beats the same period in 2021 by 12%. That’s significant.
Ending stocks were higher each month this year until July and August; however, exports were also holding steady to strong through May.
It is the continued year over year increases in domestic disappearance that support the uptrend in milk prices since mid-July.
Bottom line, U.S. dairy producers have just weathered a storm where even though cow numbers were not a whole lot different from a year ago, and even though milk production and beginning stocks were not so out of whack, and even though exports were generally stable until July, we saw prices this spring and summer fall 37% below the previous year, and the DMC margin fell to a record low $3.52 in July, fully 63% below the milk margin of $9.92 the previous year.
This illustrates how tiny the margins are in these supply and demand equations that can make big dents in the farm level milk price.
Increasing the national herd by a mere 5,000 cows deals a much bigger blow when it is coupled with modest gains in milk production per cow. And, even though exports are about four to six times greater in volume than imports, a sudden increase in those imports – even while exports are steady or higher – can bump the market disproportionately lower.
The good news in these graphs is that ending stocks have trended lower through the year, dipping under year ago since July, while domestic use has trended higher than a year ago every month but January. Yes, export volumes have now slowed, but so have import volumes and milk production.
The trouble I see for the future is this: As dairy farmers become more efficient, producing more milk per cow, and against this backdrop of more imports and volatile exports… the risk of extreme volatility becomes even greater whenever a new 5,000 head dairy expansion starts up or a new 10,000 to 20,000 cow dairy is built. Current replacement cattle prices at their highest level since 2015 and record high culling values for beef further push consolidation. Renewable Natural Gas credits push the type of expansions at a minimum 2500 to 7000 cow clip, replacing the diversity of farm sizes in the dairy industry at a more rapid pace.
Against this backdrop of the disproportionate impact of imports and exports on dairy markets today, the entire industry is now disproportionately more vulnerable to small changes in cow numbers. All it takes today is one large-scale business decision to flip the switch and wreck the train and bump more small- and mid-sized family dairies off the track.
It’s to the point where milk production forecasts need a microscope for the minutia, not a telescope to see the planetary alignments.
Most of the information for this report was derived from the USDA Economic Research Service data that are reported around the 16th of every month. The report includes both the dry milk powder and whey stocks as well as cold storage butter and cheese. The monthly ERS Supply and Utilization of Dairy Products by Category reports the imports, exports, and ending stocks on a milk equivalent basis separately for fat and skim solids. Using the 40/60 ratio, we figured the milk equivalence (m.e.) on a total solids basis to generate the graphs. We also updated the milk production totals to reflect the NASS revisions two weeks ago, which were not yet updated in the available ERS reports.
-30-
