

What’s coming and how to prepare
By Sherry Bunting
EAST EARL, Pa. — The June 1 Federal Milk Marketing Order (FMMO) price changes delivered mixed results: modest gains in higher-Class I fluid markets, pain in manufacturing markets, and a flat national all-milk price, despite higher dairy commodity prices in June vs. May.
With more than $8 billion in new U.S. dairy processing investments, supply and demand signals are being reshaped and pool revenues impacted as handlers navigate the pricing changes, including the new and larger make allowance deductions. These are not line items on milk checks but are subtracted from the four base commodity prices — butter, cheddar, nonfat dry milk, and dry whey — used in the class and component prices, including the Class I base mover.
Dr. Chuck Nicholson of UW-Madison noted in a recent PDP Dairy Signal podcast that the changes were not designed to improve dairy farmer income but to preserve the integrity of the FMMO system — a system that is believed to be beneficial to dairy farmer income.
Nicholson expects it will take six months or more for premiums, deductions, and pooling decisions to settle out after the final piece is implemented.
The final piece is the revised skim composition standards that arrive in Dec. 2025. They are expected to be generally positive for dairy farmers, but will have ripple effects in how components are paid, how breakevens are figured for hedging, and in handler pooling strategies.
One thing is clear: The new rules make milk pricing more complicated and milk checks less transparent. Supply and demand market signals are taking a back seat as formula changes, higher make allowances, ESL adjustments, and shifts in Class I differentials reshape how pool revenues are calculated.
As buyers navigate for price advantage; dairy farmers should do the same by understanding what’s here, what’s coming, and adjusting herd, feed, and risk management strategies.
Get ready for December
The skim composition factors will increase for Class I handlers and for the ‘reported’ Class III and IV baseline prices and FMMO statistical uniform prices (SUPs). Protein increases from 3.1% to 3.3%, other solids from 5.9% to 6.0%, and nonfat solids from 9.0 to 9.3%.
Butterfat remains unchanged at 3.5% because all handlers, even Class I, pay pooled butterfat on actual pounds, whereas Class I pays skim components at standard levels.
Producers in multiple component pricing (MCP) Orders will continue to be paid on actual pounds of protein/other solids, but the reported Class III and IV baseline prices will be set higher, along with Class I, to reflect the new skim factors.
Why it matters
Skim composition updates raise the baseline prices for Class III and IV after the higher make allowances have already lowered these baselines prices. Because Dairy Revenue Protection (DRP) “trigger revenues” are tied to these prices, coverage costs and payouts will shift. Hedging breakevens will also need to be reassessed for impacts depending on the farm’s component profile.
High-protein herds above the old standard of 3.1% may see reduced premiums because more of their “extra” protein moves into the baseline Class III price at 3.3% in December, changing how hedges or DRP line up with actual milk checks.
Low-protein herds, below the new standard of 3.3% could face new deductions or discount risk.
With protein up at 3.3% and fat unchanged at 3.5%, the Class III fat-protein ratio tightens, altering potential decisions by handlers on strategic pooling or depooling of producer milk.
As Class III and IV baseline values were lowered in June (via the make allowance increases) and will be raised in December (via the skim composition changes), DRP revenue expectations may misalign unless levels are reassessed.
Nicholson explains that farmers whose milk has been consistently pooled will want to talk with their nutritionists, buyers, co-ops and risk advisors about component levels to ensure risk management strategies align with milk check revenue and consider feeding and management adjustments to minimize negatives and maximize positives.
What can farmers do?
They can’t control formulas, but they can:
- Maximize components: Boosting components remains the surest way to improve milk checks.
- Maintain milk quality: This secures a milk market in the face of processing disruptions and positions the farm for future premiums if they return or improve.
- Scrutinize line items: Marketing or balancing deductions and re-blends may ease as processors benefit from larger make allowance credits. Remember: Class I is the only class of milk that must be pooled, and co-ops are not required to pay pooled members the FMMO minimum blend; they may re-blend with deductions.
- Know your minimum price: Each farm’s FMMO-minimum depends on butterfat plus protein and other solids, making every farm’s baseline unique.
What changed in June?
June milk checks were the first to reflect the larger make allowances that muted market strength that month. This was demonstrated in USDA’s June all-milk price at $21.30/cwt, which was flat vs. May, despite higher prices for all four base commodities used in the FMMO price formulas.
Did return to higher-of help?
The return to higher-of did not help in the first two months, actually cutting the Class I base price by $1.37 and 79¢/cwt in June and July, because the spread between Class III and IV pricing factors was narrow.
For August and September, however, the higher-of method adds 30¢/cwt as Class III and IV price spreads have widened.
ESL adjustment, what is it?
Extended-shelf-life (ESL) Class I products now carry an automatic adjustment, based on a calculated rolling average historical difference between higher-of and average-of methods. This ESL adjustment is applied to the volume of skim used in Class I ultra-pasteurized, aseptic, and micro-filtered products with shelf-life of 60 days or more.
In June, the ESL adjustment at +$1.38/cwt added an estimated $2.2 million to the Northeast pool, which came out to about 9¢/cwt across all pooled milk. For the Mideast pool, it added an estimated $1 million (6¢/cwt). According to USDA, this adjustment can be positive or negative. It has already declined substantially for August at +57¢ and September +53¢/cwt, and it can swing negative.
Differentials vs. location adjustments
Class I differentials were increased nationwide, though larger negative location adjustments puzzled some farmers. The net is still positive. For example, New Holland, Pennsylvania’s Class I differential increased from $2.90 to $4.30/cwt, while its location adjustment shifted from –35¢ to –80¢, netting +95¢/cwt.
The make allowances bite
Processor credits, known as make allowances, increased by 25 to 30%. The June Class III baseline price was $18.82 — about 66¢/cwt lower than under old make allowances. Class IV lost 50¢.

By December, when the final reform piece takes effect, Nicholson estimates pooled producers will see the difference between the old and new make allowances trim 32¢/cwt from the baseline Class III price and 91¢/cwt from Class III component pool value; while trimming 43¢/cwt from baseline Class IV and 74¢/cwt from Class IV component pool value (Table 1).
The impact on non-pooled milk or milk marketed under cooperative re-blends remains uncertain. Nicholson expects some positive offsets — eventually — as premiums return, especially outside the pool.
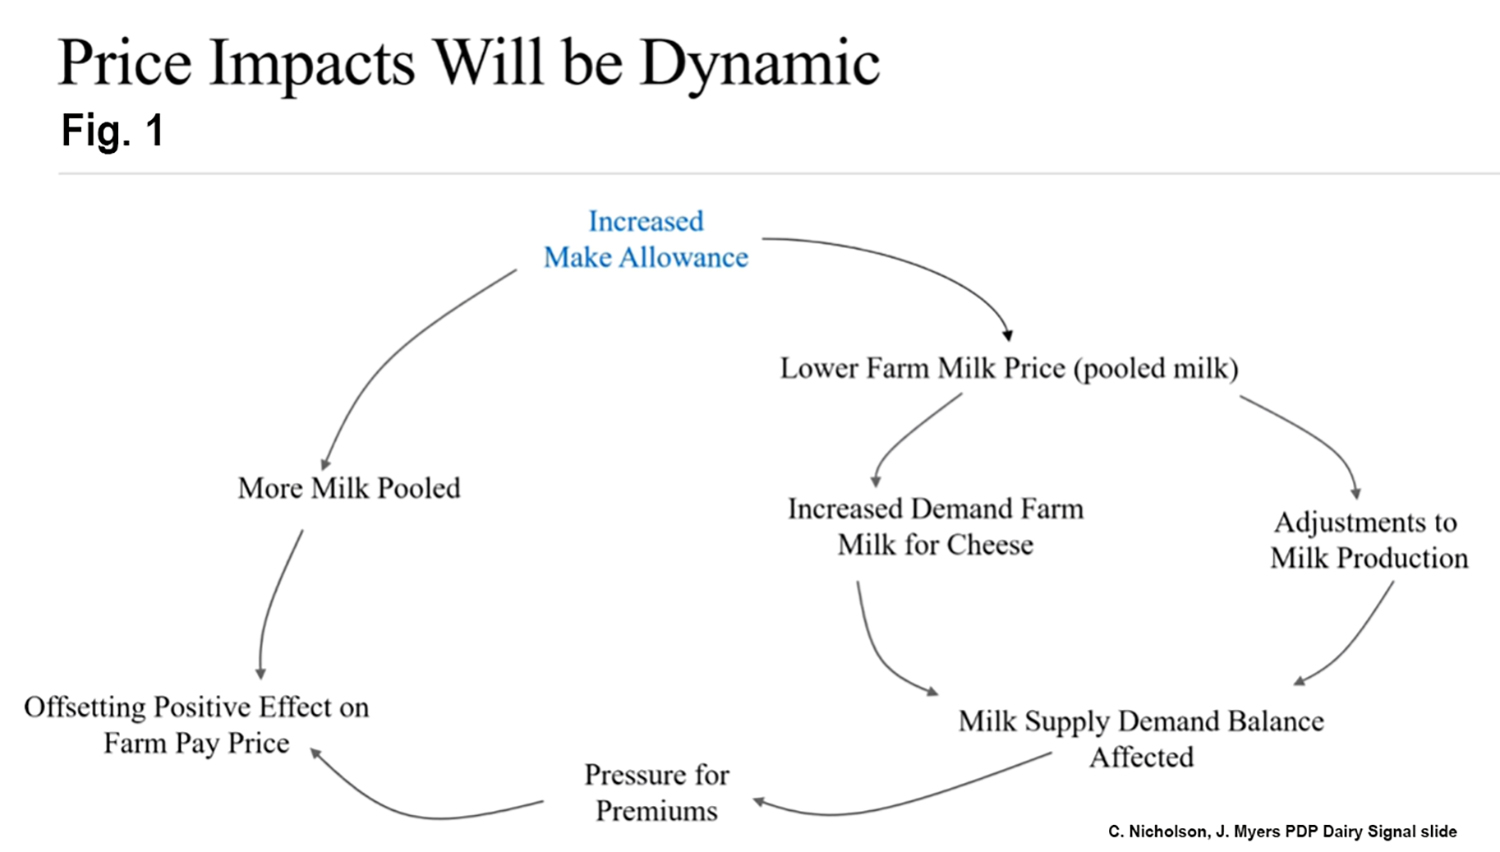
Nicholson and UW-Madison graduate student Jack Myers recently presented national dynamic economic modeling showing how the larger make allowances affect decisions by milk buyers and dairy farmers (Fig. 1) — resulting in a pain-before-gain offsetting effect over time.
Barrel cheese removal
Barrel cheese sales were removed from Class III and protein price formulas. Barrels often weighed down protein by trading below blocks and being adjusted for moisture levels. While seen as positive historically, new block-cheddar capacity in 2025-27 may alter future impacts. Barrels still trade on the CME, but USDA no longer reports them in the weekly National Dairy Product Sales Report (NDPSR), making comparisons impossible.
Regional blend impacts
Revised formulas and higher make allowances converged with new cheese capacity to pressure cheese-milk prices lower, boosting Class III utilization by 60% nationwide. Strategic depooling pulled blend prices lower in cheese-heavy regions.
Meanwhile, fluid-heavy regions dipped initially, despite higher Class I differentials, because advance pricing was based on May’s weaker market and the return to higher-of produced no advantage. July brought recovery.
Market volatility adds complexity
The implementation of new formulas coincides with new cheese processing in 2025, keeping U.S. cheese priced 20 to 35% below global indexes. This supports exports but pressures farm-level income.
CME trading illustrates the see-saw balancing pattern now emerging, with potential impacts for monthly checks. In August, cheese rallied to $1.88/lb by Aug. 13, and then in the next eight days from Aug. 14 through 22, the cheese price dropped to $1.77, rebounded to $1.87, then plunged to $1.75. These swings feed into the 2- to 6-week lag between Class I advance prices and manufacturing class and component announcements.
-30-
