
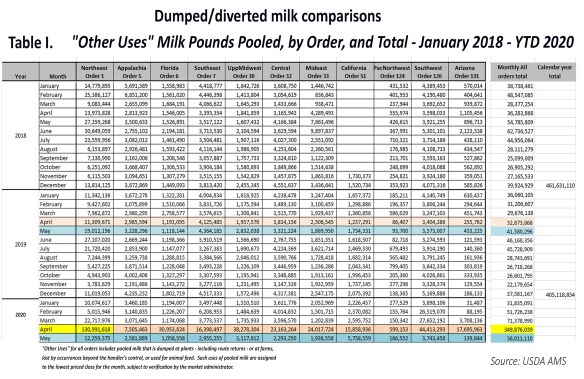
Table 1 showing “other use / milk dumpage” totals by Federal Order includes data for May 2020. The month of May saw 13% less milk pooled on Federal Orders compared with a year ago, and 13% less milk in the “other use / dumpage” category compared with a year ago — down dramatically from the enormous 350 million pounds of “other use” milk pooled in April 2020.
States east of Mississippi cut production, west mainly grow
By Sherry Bunting, Farmshine, June 26, 2020
WASHINGTON, D.C. — As April’s dismal Covid-impacted dairy market spilled into May milk checks, the supply-side of the ship turned in May at the same time as demand was strengthened by dairy donations, retail demand and food-service re-stocking.
USDA Dairy Market News reports each week have signaled progressively tighter milk supplies heading into summer vs. stable to strong demand pushing spot loads to sell above class price in some areas.
In April, cooperatives across the country set base limits on member milk production for May until further notice. Some severely discounted any milk provided that was above 80 to 90% of a member farm’s March marketings. Many producers chose to leave this penalty milk out of the tank.
As these co-op ‘base’ programs went into effect in May, the impact is demonstrated in the USDA May Milk Production report, estimating U.S. output at 18.8 billion pounds, which is 1.1% below year ago for May.
Cow numbers were down 11,000 compared with April, according to USDA, but still 37,000 more milk cows were estimated on farms compared with a year ago.
Nationally, milk output per cow dropped by one pound/cow/day in May compared with a year ago, the report stated.
In addition, Federal Order milk pooling totals and “other use / dumpage” data provided to Farmshine by USDA AMS by request, showed the total volume of milk pooled across all Federal Orders in May dropped like a rock to levels 13% below year ago.
Similarly, the volume pooled as “other use / dumpage” across all Federal Orders fell to levels 13% below year ago nationwide — from the enormous 350 million pounds recorded in April to 36 million pounds in May. (See Table 1.)
What is eyebrow-raising is how the numbers in these reports geographically arrange themselves.
In last Thursday’s Monthly Milk Production Report, the national drop in total output for May masks the fact that among the 24 top milk producing states listed individually in the report, those east of the Mississippi accounted for all of the production decline – plus balancing the accelerated western growth to get the U.S. total a significant 1% below year ago.
States east of the Mississippi saw large decreases in production, while in contrast, the growth states of Texas, Colorado, Idaho, Kansas, Arizona, South Dakota saw increases in production ranging from 1.4 to 9.7% above year ago.
East of the Mississippi, the Northeast milkshed really clamped down on production with Pennsylvania 3% below year ago, New York down 3.7%, and Vermont down 6.4% vs. year ago in May.
Further south, Virginia and Florida were unchanged from a year ago, while Georgia’s production fell 1.4%.
In the Mideast and Midwest, Michigan was off a fraction (0.4%), Minnesota down 1.9% and Wisconsin’s production fell by 3.1% vs. year ago. Indiana, Illinois and Iowa were down 1.7 to 2%. Ohio was the outlier, gaining 0.4% in production over year ago.
In the West, May production was larger than a year ago with South Dakota leading on a percentage basis producing a whopping 9.7% more milk compared with a year ago. Number five Texas grew by 1.9%. Number three Idaho grew by 4.6%, and Colorado grew by 4.8%. Arizona grew by 1.4%, and Kansas by 2.4%.
Three western states were key outliers as California dropped production 1.5% below year ago, Utah was down 3%, and New Mexico fell a whopping 7.2% below year ago. The Pacific Northwest had generally steady production with Oregon unchanged from a year ago and Washington down fractionally.
In Federal Order pooling, the volume pooled nationwide was down a whopping 13% from 15.1 billion pounds in May of 2019 to 13.2 billion pounds this May of 2020.
In the Northeast, total pooled pounds on Federal Order One for April and May of 2020 were essentially equal at 2.3 billion pounds each, but relative to year ago, this was a decline of 1.7% while production on farms in the region fell a whopping 4%, collectively. The difference likely came from elsewhere.
Meanwhile, the amount pooled as “other use / dumpage” in the Northeast Order One dropped abruptly from the enormous 131 million pounds in April to 12.3 million pounds in May, representing a 35% drop in “other use / dumpage” compared with a year ago.
Pooled milk classified as “other use / dumpage” in the Appalachian, Florida and Southeast Orders 5, 6 and 7, also dropped significantly in May compared with April’s large records. In fact “other use” milk in those three Orders fell to levels that were 19% (Appalachian), 9% (Florida) and 32% (Southeast) below year ago. At the same time, total pooled pounds for these three Orders – 5, 6 and 7 – were calculate below year ago in May by 1% in Order 5 (Appalachian), 2.5% less in Order 6 (Florida) and a significant drop of 11.7% less milk pooled compared with a year ago in Order 7 (Southeast).
In a sense, the pull back in production in the Northeast, Mid-Atlantic and Southeast regions, where April’s dumping had been so extreme, helped bring down total pooled pounds in those areas to rein-in the “other use” pounds as well.
Growth areas of the nation showed significantly less “other use / dumpage” pounds in May vs. April. However, in some of the Orders, such as the Southwest (Order 126) and Upper Midwest (Order 30), the “other use / dumpage” category was still above year ago levels by a modest margin, according to the USDA AMS figures.
As the dairy industry right-sizes itself after COVID-19 supply-disruptions that abruptly cut 30 to 40% from producer milk checks, it remains to be seen how states east of the Mississippi can regain their footing as western growth areas kept shipping more milk right on through — without missing a beat.
-30-

Hey! I simply wish to give an enormous thumbs up for the good data you will have right here on this post. I can be coming again to your blog for more soon.
LikeLike
An fascinating dialogue is price comment. I believe that it’s best to write more on this subject, it might not be a taboo subject however usually persons are not enough to speak on such topics. To the next. Cheers
LikeLike