
By Sherry Bunting, Farmshine, December 4, 2020
Where do the life cycle assessments come from that are being used to benchmark progress on U.S. dairy’s impact on climate and environment? How might this “collective” method of measurement affect dairy diversity and geography in the future?
When dairy leaders talk about the Net Zero Initiative goals, they are using analysis by well-known animal scientists comparing data over time to benchmark industrywide collective progress using a determined scope of collective measurement that fits the controlling globalist view.
The idea is to peg dairy’s progress at one value that the global supply chain can then plug into their own brand impact measurements. Yes, this is both simple and complicated.
DMI leaders are quick to point out that this pathway was decided upon by dairy farmers, dairy cooperatives, and dairy processors and that dairy checkoff is simply providing the science. But it is also clear that DMI provides the staff and structure for implementation. The national dairy farmer checkoff organizations provide the science, the staff and the structure so that the entire dairy industry can be described as one unit – not multiple units competing with each other on the aspect of ‘sustainability.’ That’s the point, they say.
Along with the Net Zero carbon neutrality goal by 2050, DMI’s Innovation Center for U.S. Dairy offers this report on a decade of progress: “The effects of improved performance in the U.S. dairy cattle industry on environmental impacts between 2007 and 2017,” was published in the January 2020 edition of the Journal of Animal Science.
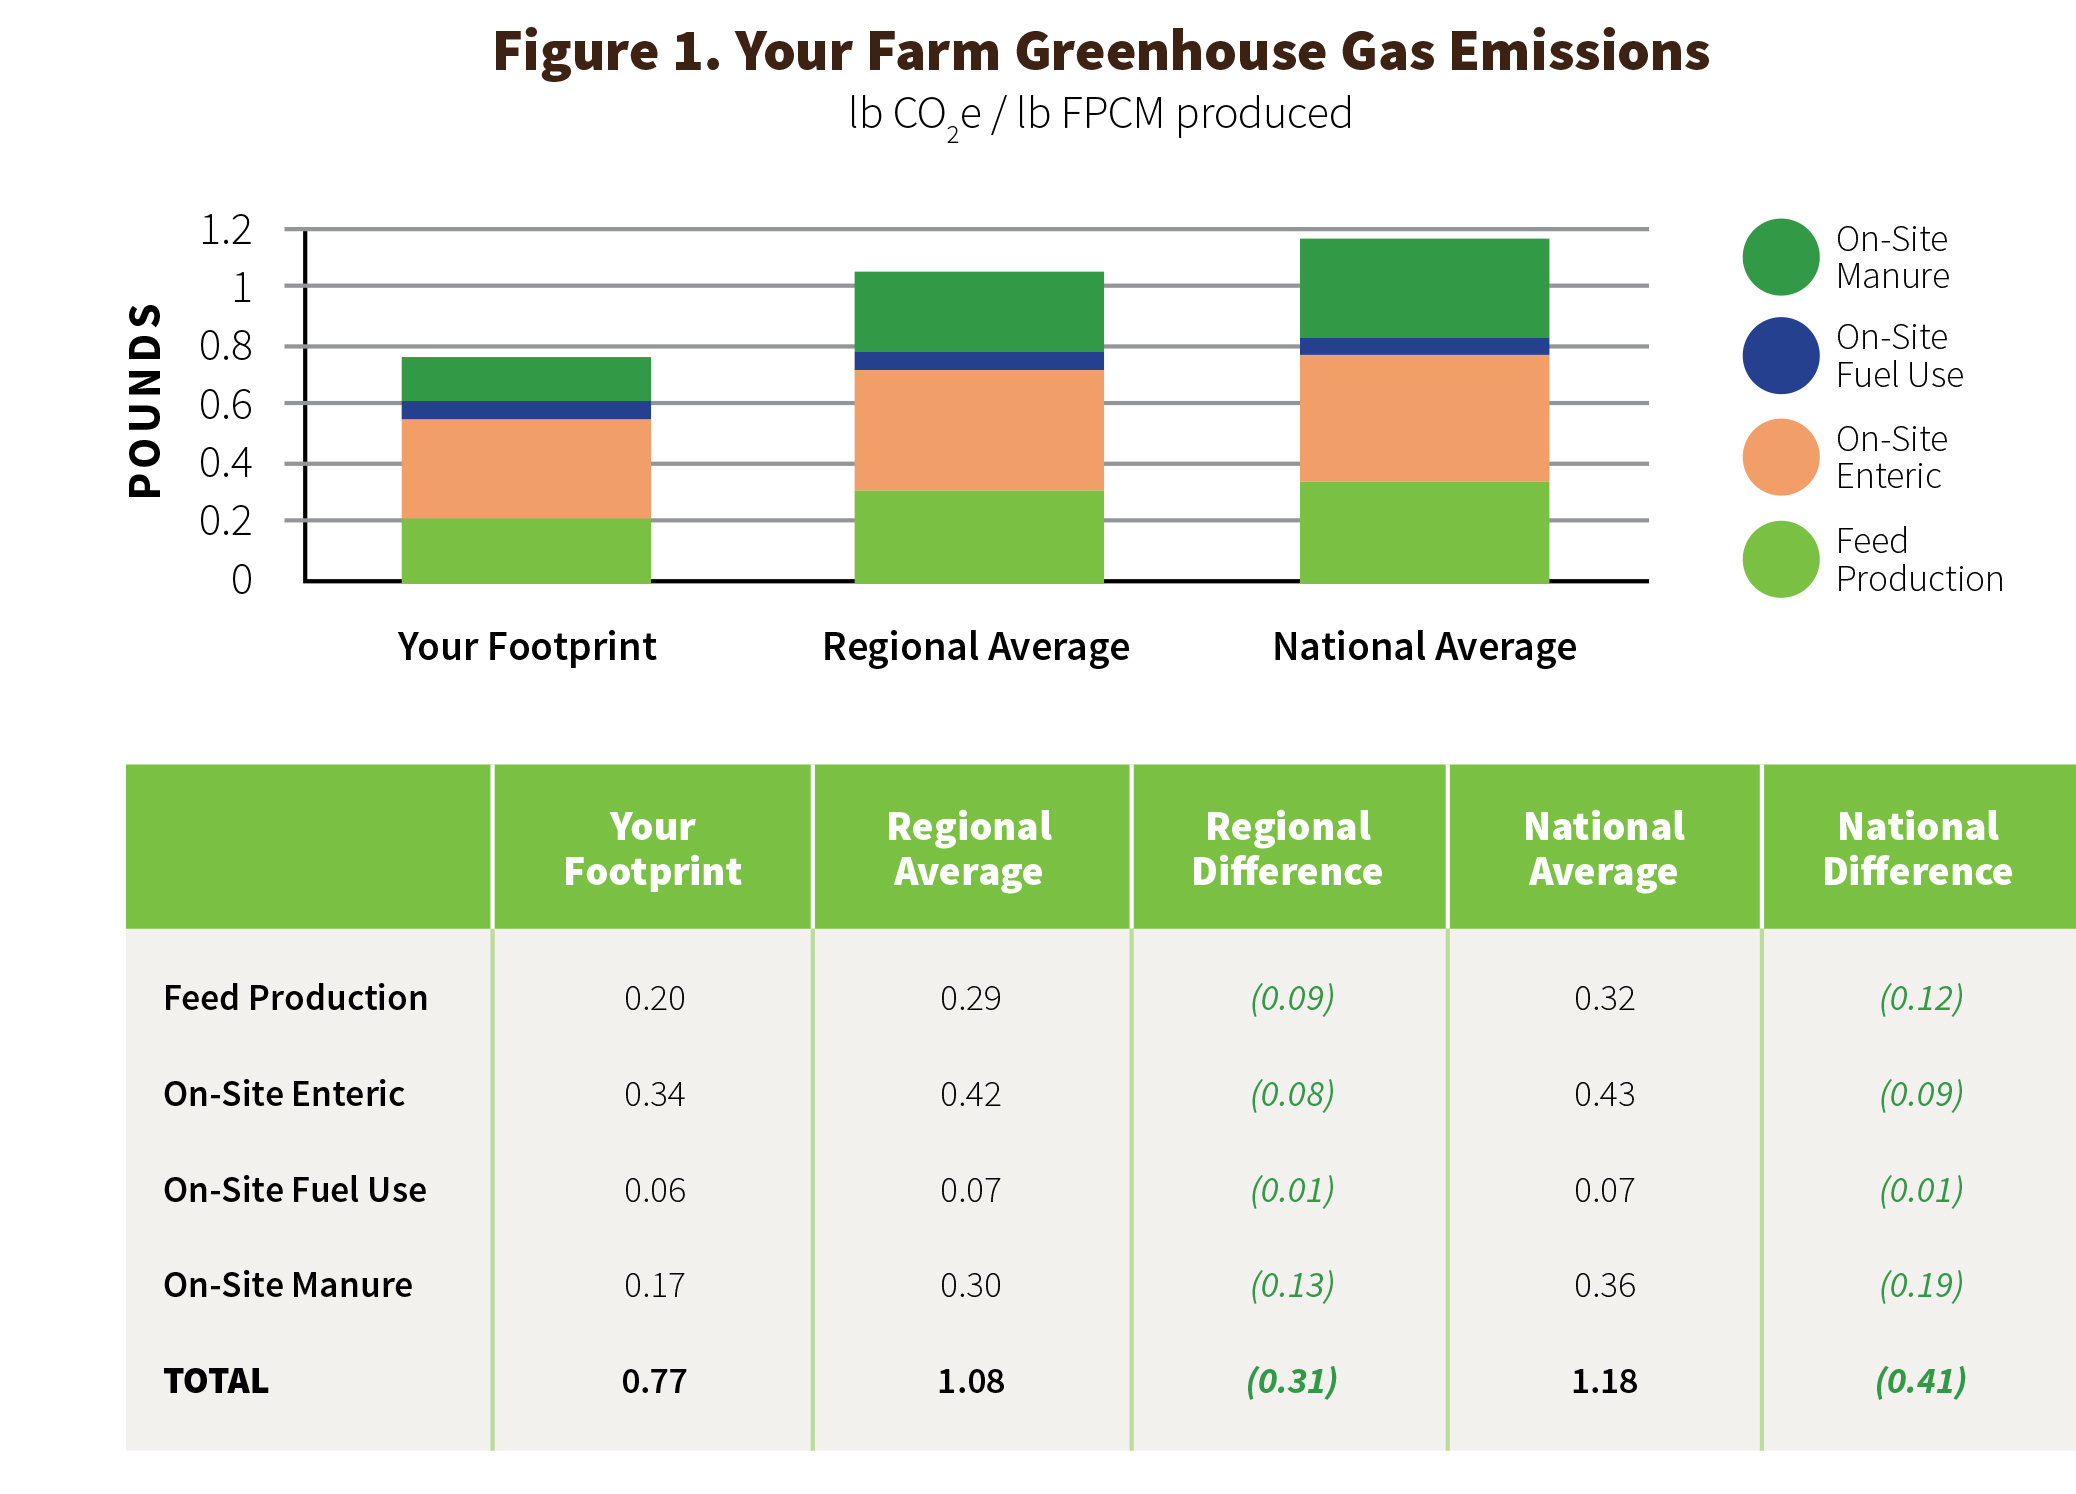
This report showed dairy used 30% less water, 21% less land, produced 21% less manure nutrients and produced 19% less greenhouse gas (GHG) emissions — referred to in press statements as carbon footprint — per metric ton of energy-corrected milk over the decade of 2007 to 2017.
The research by Jude Capper and Roger Cady, along with other animal scientists, observed that, “As dairy systems become more productive, efficiency improves via the dilution of maintenance effect (Bauman, VandeHaar, St. Pierre) and both resource use and GHG emissions are reduced per unit of milk.”
The researchers indicated that monitoring changes in food production processes, yields, and environmental impacts is a time-consuming and expensive undertaking, which they took to a higher level in this study as compared to 2006 and 2009 studies that looked at how efficiency gains reduced the environmental footprint of dairy from 1944 to 2007 based completely on animal productivity gains.
In the 2007 to 2017 study, researchers only looked at dairy’s impact from the manufacture and transport of crop inputs to milk at the farm gate. Excluded from the scope of collective farm progress are the impacts of milk transportation, processing and retail.
Dairy systems were modeled using typical management practices, herd population dynamics and production data from U.S. dairy farms (USDA NASS and Dairy Records Management System-DRMS). Crop data were sourced from national databases, including NASS. Modeling and training ration formulation software was used as well as a host of data from public sources to determine water recycling, electricity and other energy usage, for example.
“The U.S. dairy industry has made remarkable productivity gains and environmental progress over time,” write Capper and Cady. “To maintain this culture of continuous improvement, dairy must build on gains and demonstrate commitment to reducing environmental impacts while improving both economic viability and social acceptability.”
At the same time, Dr. Frank Mitloehner of University of California-Davis CLEAR center has been instrumental, mainly in evaluating – and putting into perspective – accurate greenhouse gas (GHG) emissions for dairy and livestock as well as participating in research on how various technologies could further reduce U.S. dairy’s current contribution of just 2% of total GHG emissions.
Progress to reduce GHGs is measured per unit of milk production, but as Dr. Mitloehner frequently points out, a better way to pinpoint it would be to incorporate the nutrient density of milk and meat in calculating the impact of dairy and livestock industries per nutritive value.
For example, almond beverage might have a smaller footprint, the experts say, but what is the nutritive value of selling water with the equivalent of two almonds per serving? Much of the climate impact discussion around food is not an apples to apples comparison in terms of nutrition and calories delivered.
There are other positive aspects of “environmental impact” at local levels that fall outside of the collective global method of impact measurement. How far food travels within local or regional food systems versus national and global supply chains is not part of the farm-level Net Zero Initiative.
Meanwhile, the Innovation Center for U.S. Dairy is working on product innovations at the processing level from a centralized or global supply chain perspective to reduce environmental impacts on a global scale. How do these ‘global’ vs. ‘local’ pathways intersect in the future in terms of a farm’s real contribution to the surrounding community vs. its contribution to a global impact model?
Where do the 2007 to 2017 gains from this research come from? First off, milk production increased 16% over that decade, and the number of dairy cows increased 2.2%.
Researchers explain the environmental impact was assessed using “a deterministic model based on animal nutrition, metabolism, and herd population parameters founded on life cycle assessment (LCA) principles.”
Those principles first establish the scope (in this case the scope was from crop input to milk output and did not include processing and distribution to consumers). Then inventory is established (input and output). Then the impact is established (input versus unit of output). Then the relative change is figured (improvement or reduction).
The researchers attributed a large portion of the gains to the continued dilution of ‘maintenance’ requirements per head of cattle and milk volume via these measurements:
1) A 22.3% increase in energy-corrected milk production per cow as the 12% increase in fat yield and 10% increase in protein yield were factored in,
2) Lifetime milk yield was figured to have increased 18.7% as a combination of shorter calving interval, shorter dry periods, increased replacement of mature cows with heifers, shortened days of life, and earlier calving age,
3) increased productive-animal-days across the cattle population,
4) reduced SCC as a proxy for reduced milk waste,
5) How animals are fed, how water is used, and how inputs factor into the land and carbon footprint equation, collectively.
The research showed that even though total cattle numbers have increased slightly from 2007 to 2017, the number of productive-animal-days and lifetime milk increased by more during that time due to the way all of these factors combine to show reductions in environmental impact by reducing the inputs for non-productive cattle that are counted against the productive cattle population at points in time.
Life cycle assessment of environmental impact is all about data modeling and allocation. The age at first calving is a prime example. Until a dairy animal calves, she is using resources without delivering a product. Growth rates can improve these impacts in the modeling by getting cattle to production, faster. Once the animal has a calf and begins producing milk, she is now contributing to reducing carbon footprint by supplying milk yield and component yield in the national figures against the resources she is consuming. Length of dry period, calving interval, and other reproductive efficiency also affect this. Longevity, oddly enough, has less of an effect because of how the data are assembled and used.
As for land use and manure production, researchers looked at dairy rations without full consideration of the wide range of commodity byproducts. They included some common byproduct feeds like distillers grain for both 2007 and 2017. More could be done to show the relative feed value vs. environmental impact of many byproduct commodity feedstuffs, particularly if credit could be given for keeping fiber and carbohydrate from the food processing sector out of landfills.
Double-cropping (cover crop forages) are common practice on dairy farms today, which reduce environmental impact of milk production, but are not really quantified in this life cycle assessment research at this point.
In pasture systems, the intensive rotational grazing methods used today reduce the land to milk ratio within the context of grazing-based production, but may have a smaller positive impact on the industrywide collective figure if production per cow is below benchmark. That will need to be considered because there are clear sustainability benefits to these grazing systems that fall outside of this collective model.
All of these factors being analyzed and allocated to one U.S. dairy figure are calculated to paint one picture of reduced environmental footprint. This includes water recycling. Water that is used to cool milk is also used to wash down parlors and milking equipment and in some cases, a third time in manure flush systems before being recaptured as nutrient-rich effluent to irrigate crops. In some regions and some management styles, water recycling is not measured, but natural. Take grazing operations in rainfed rolling hills. Their recycling isn’t measured, but it’s happening.
Unfortunately, when it comes to all of these measurables, including the impact of productive-animal-days vs. animal population vs. energy-corrected milk volume, it is the increased consolidation of milk production to fewer and larger farms from 2007 to 2017 that has had, perhaps, the most significant positive impact on the collective industrywide dairy environmental footprint calculations.
Why? Because as more milk production is brought into heavily controlled confinement environments, it becomes easier to measure to directly influence the model. On the other hand, pasture and drylot systems offer other sustainability and animal care positives that consumers care about but are not as easily measured by this global supply chain model of environmental footprint.
The elite globalist view seeks to control every aspect of food, agriculture, and energy. It’s important to keep sight of other sides of the ‘sustainability’ equation. Local and regional food systems provide benefits to local economies, local land use and local ecosystems that are not reflected when we measure a national or global model.
As the industry moves toward controlled environments where inputs and outputs can be precisely measured, smaller less concentrated dairy farms may not be fully appreciated for what they contribute to a community’s environmental footprint in terms of how far food travels or how local economies and ecosystems are affected. This divergence needs to be addressed.
Remember, Net Zero Initiative fits the globalist view and aligns with World Economic Forum’s Great Reset. It also aligns with language in the Green New Deal.
Viewing footprint progress on a national or global scale across all cattle and all milk volume brings positive messages but also the aforementioned concerns.
It’s important to see ‘industry’ progress, and most dairy farmers welcome the opportunity to talk to consumers about what their industry has done collectively to be good stewards. However, when the dairy leaders at DMI and all of its organized underlings tell us that food safety, sustainability and animal care are NOT areas in which brands should compete, what they are really telling us is that these are areas that will be controlled by one message using their one collective measurement method in scope and calculation.
Farm size and geography will be considered, and they say diversity is a strength, but the bottom line is measurement toward a national model seeking to meet a global goal.
By their own admission, the dairy checkoff has pursued globalization since 2008, implemented FARM to keep animal care from being a marketing factor, and they admit they are implementing Net Zero to be sure dairy comes completely into alignment with the globalist view having collective measurement that fits the United Nations Sustainable Development Goals, while discouraging other forms of ‘sustainability’ marketing between brands.
Case in point, cattle longevity has little if any positive bearing on the life cycle assessment for water use, land use, manure produced and greenhouse gas emissions in the context of total-industry-collective measurement of inventory input vs. output.
In fact, the research cited in this article that is the basis for the DMI Innovation Center life cycle assessment actually shows a benefit for continual throughput of cattle with faster growth rates for calves and earlier age at first calving being more significant on the front end than the age of the cattle on the back end when applied to a collective industrywide measurement.
That’s because the total inventory of cattle in the dairy industry at any given time includes non-productive animals. Research models focus on the collective data about productive animal days vs. total cow numbers vs. milk production for input and output at given points in time — not over the lifetime of animals in the herd. Logic doesn’t always apply in this scenario.
In short, the way the industry looks at collective industrywide progress on environmental impact may differ from how an individual dairy producer or community of producers view their contribution by other equally valid measurements.
Both methods can be supported by sound scientific data, but the industrywide collective method fits the global supply chain perspective. Thus, it is the approach for the Net Zero Initiative embraced by DMI’s Innovation Center for U.S. Dairy and the 27 companies that represent its board and the over 320 companies that are part of its Sustainability Alliance.
The companies at the forefront are the largest global dairy companies and food retailers. They are also positioned as leaders and drivers of the World Economic Forum’s Great Reset, seeking to have food, technology, finance and energy sectors of the global economy work together to transform food, farming, energy, and our lives.
It will be important for individual dairy producer ideas, regional food systems, and their positive impacts on a more local scale to have a voice in how they are measured and evaluated within this truly global agenda. Speak up and stay tuned.
-30-

Pingback: Net Zero Initiative will ‘shape future of dairy,’ say leaders | Ag Moos
Pingback: Transformative words, policies, what will they mean for farms, families? | Ag Moos
Pingback: From DMI to NZI to DS4G: Harper, McCloskey explain how scale will drive dairy to net zero | Ag Moos
Pingback: ‘Carbon-negative milk?’ Northeast, Southeast milksheds can already claim it | Ag Moos