‘Make allowance’ among hot topics ahead of producer vote on USDA’s proposed milk pricing changes

35 dairy farmers, industry representatives, and farm media attended “Winners and Losers: a discussion about USDA’s proposed milk pricing reforms,” hosted by the American Dairy Coalition during the 57th World Dairy Expo in Madison, Wisconsin October 3rd.

By Sherry Bunting, Farmshine, October 11, 2024

MADISON, Wis. – “I’m in Wisconsin, and on the graph (below) it looks like producers in Order 30 are having to decide between less money with an Order or even less money without an Order. Am I wrong and is there a silver lining?”

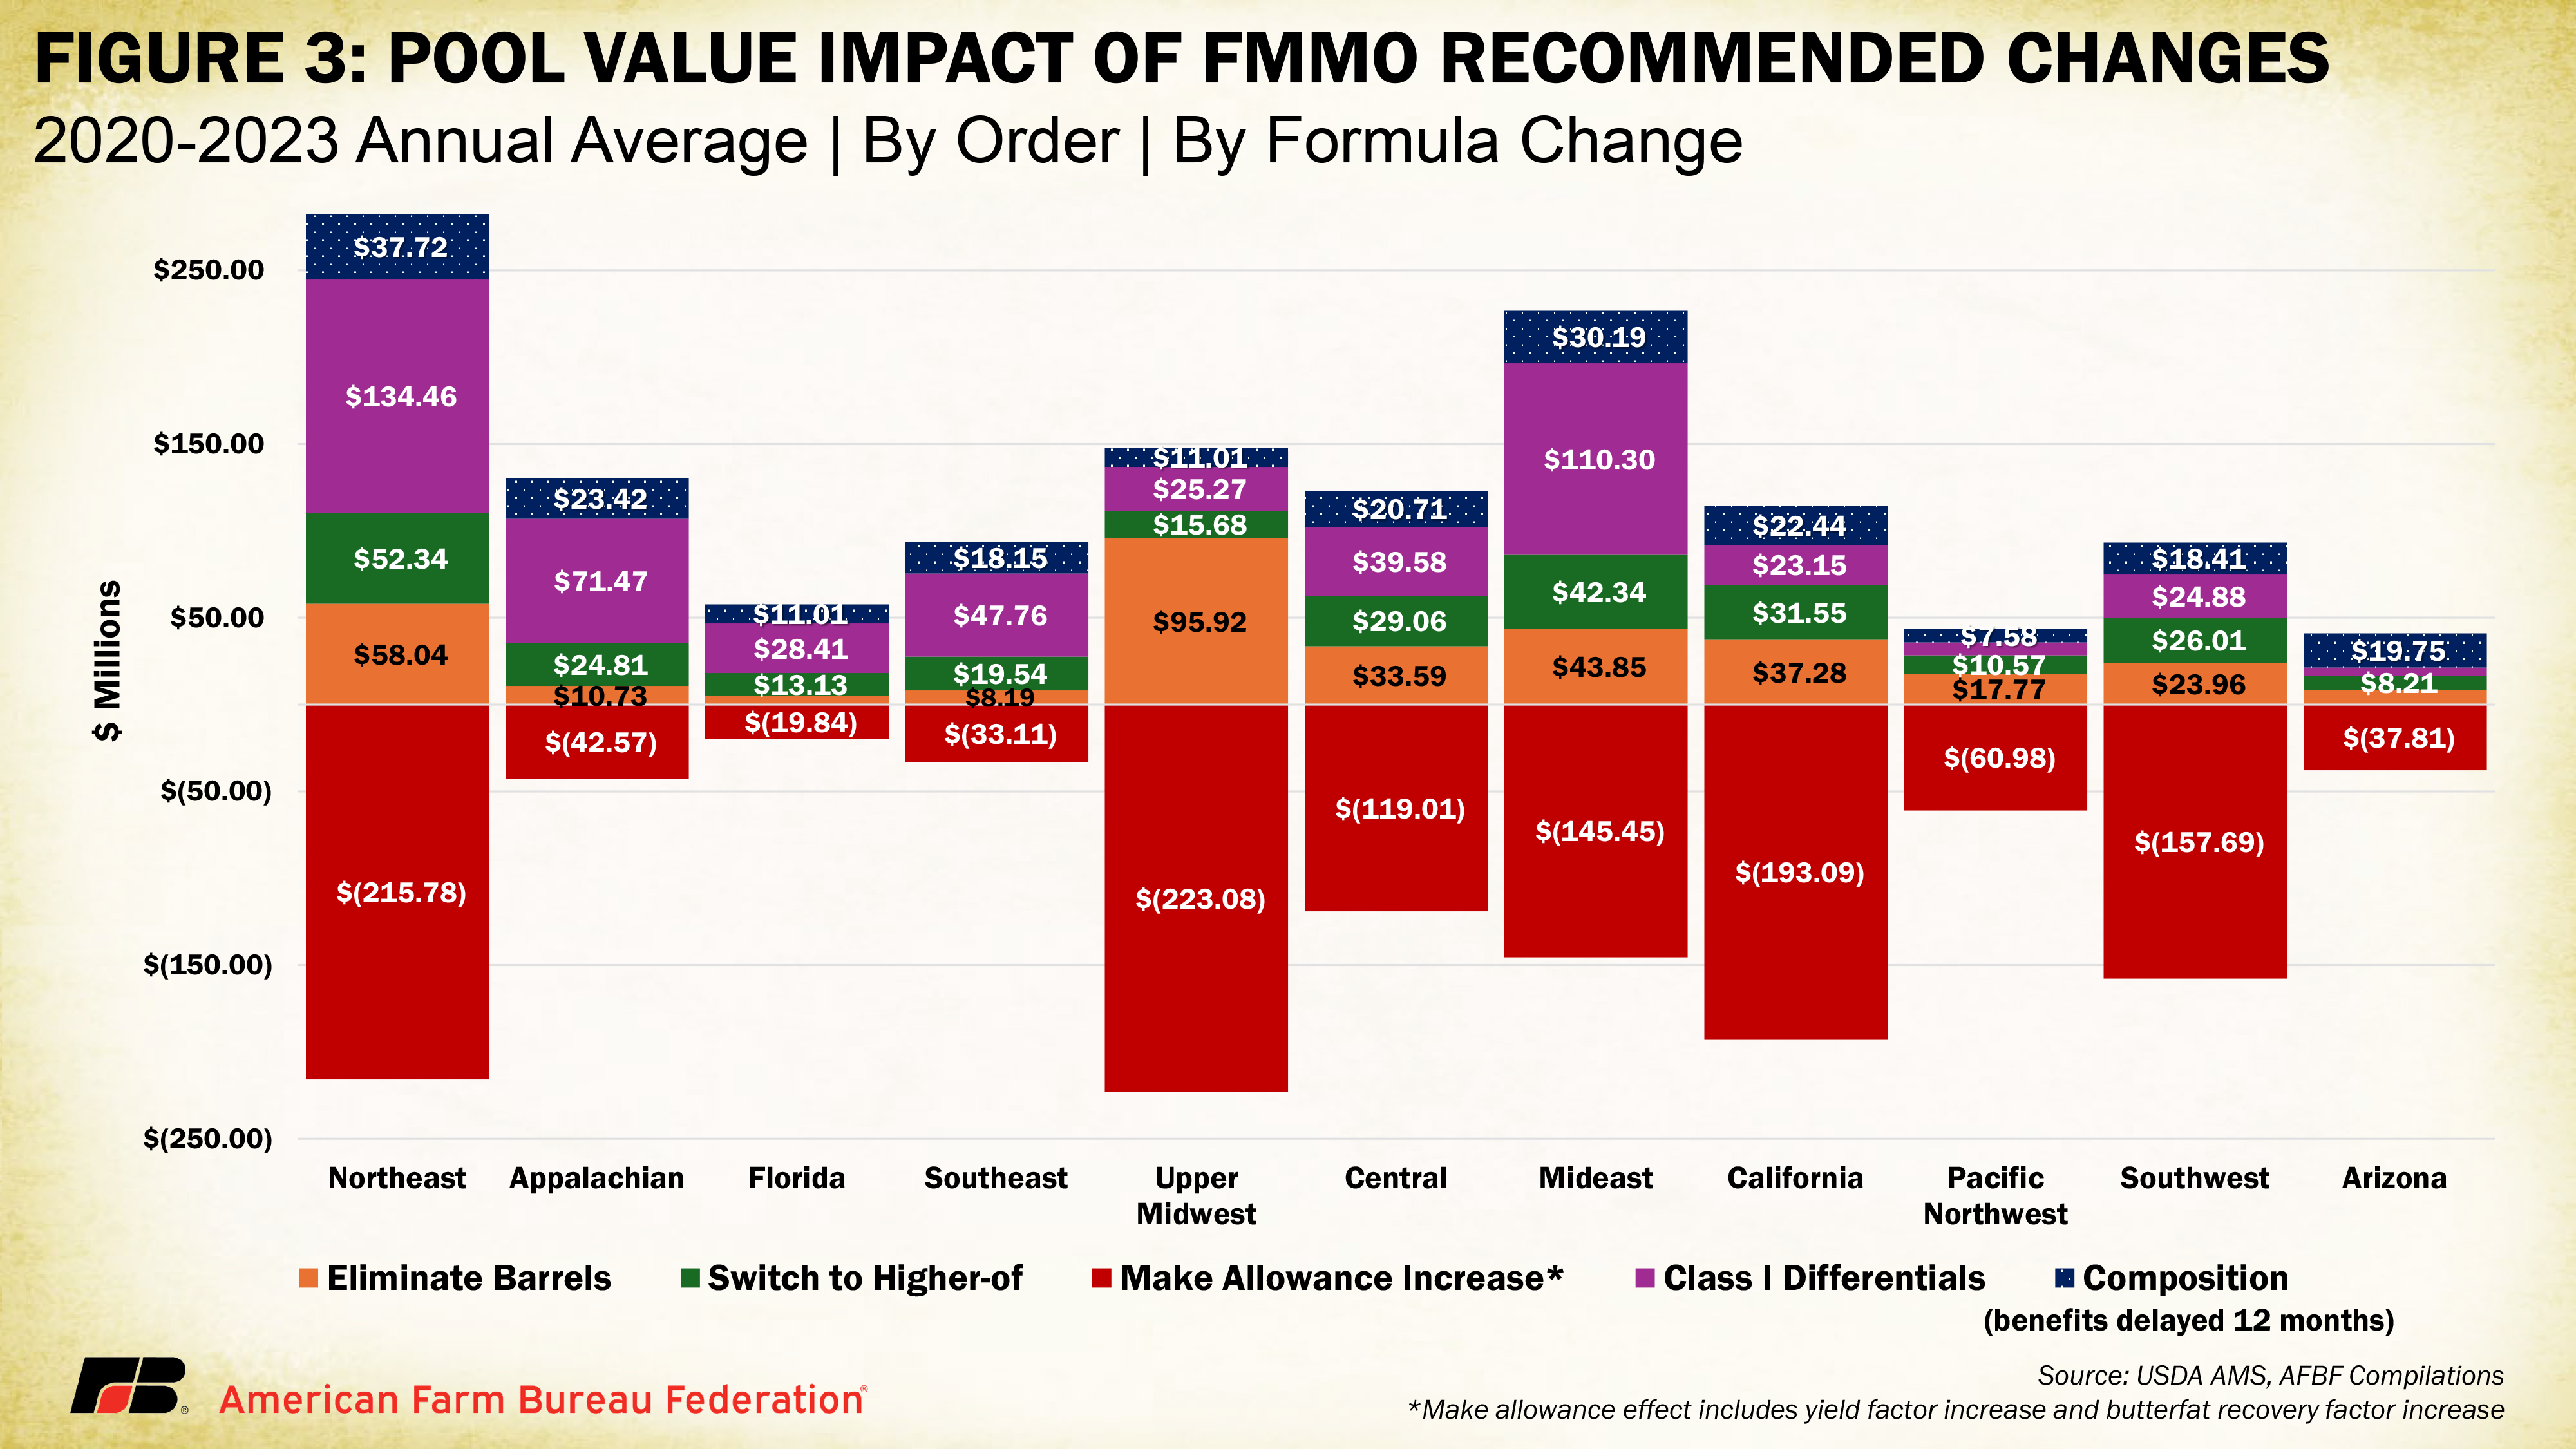
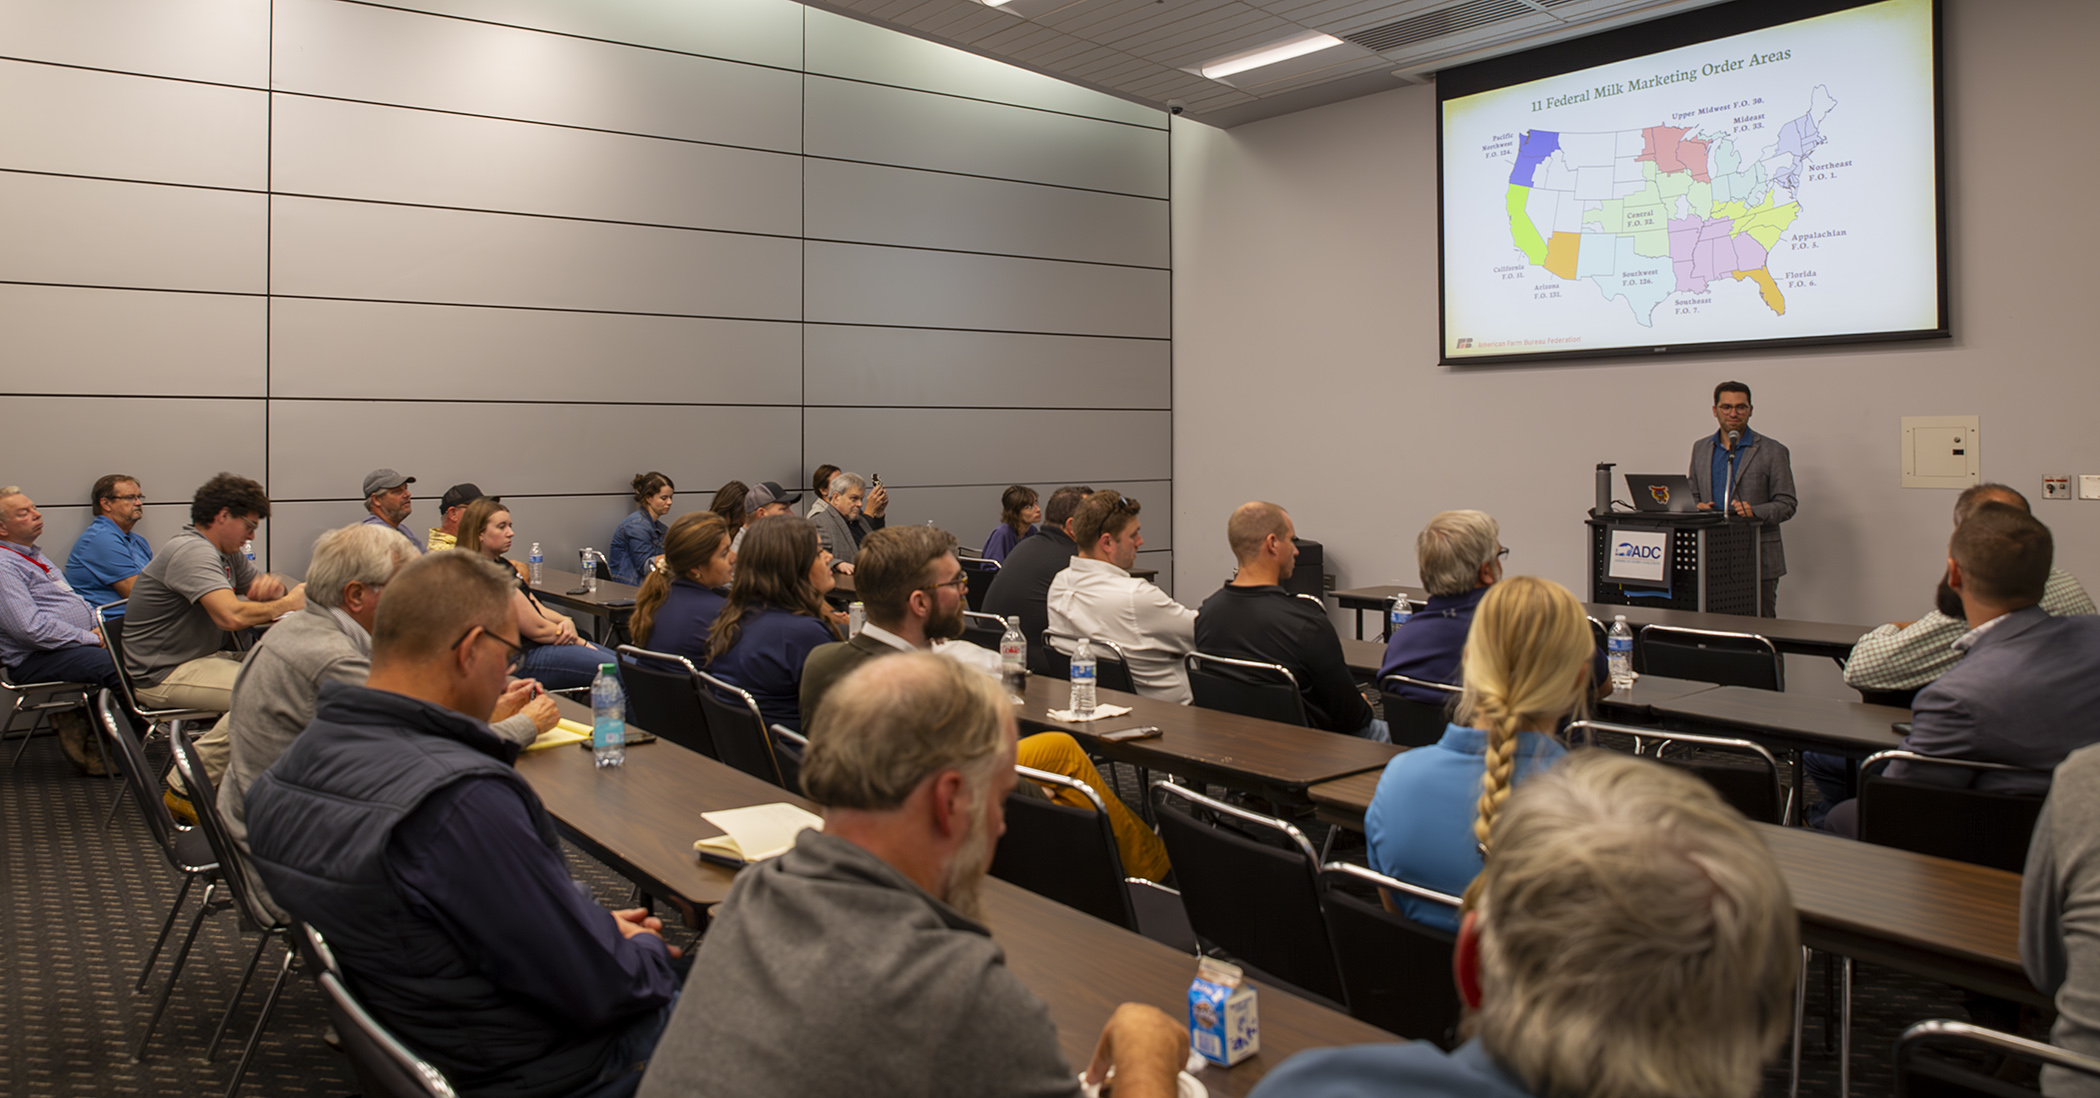
That was the crux of the question one dairywoman asked during the American Dairy Coalition’s (ADC) ‘Winners and Losers’ seminar and press conference Oct. 3 at World Dairy Expo. Over 35 farmers, industry representatives, and media professionals gathered to hear insights about USDA’s recommended decision on changes to Federal Milk Marketing Order (FMMO) price formulas.

American Farm Bureau economist Danny Munch was the invited presenter, followed by time for questions, moderated by Kim Bremmer of Ag Inspirations, and opportunities for networking and farmer-to-media connections during the remainder of the two hours.

Dairy farmers attending ADC’s press conference gave interviews after the discussion on USDA’s proposed milk pricing changes.

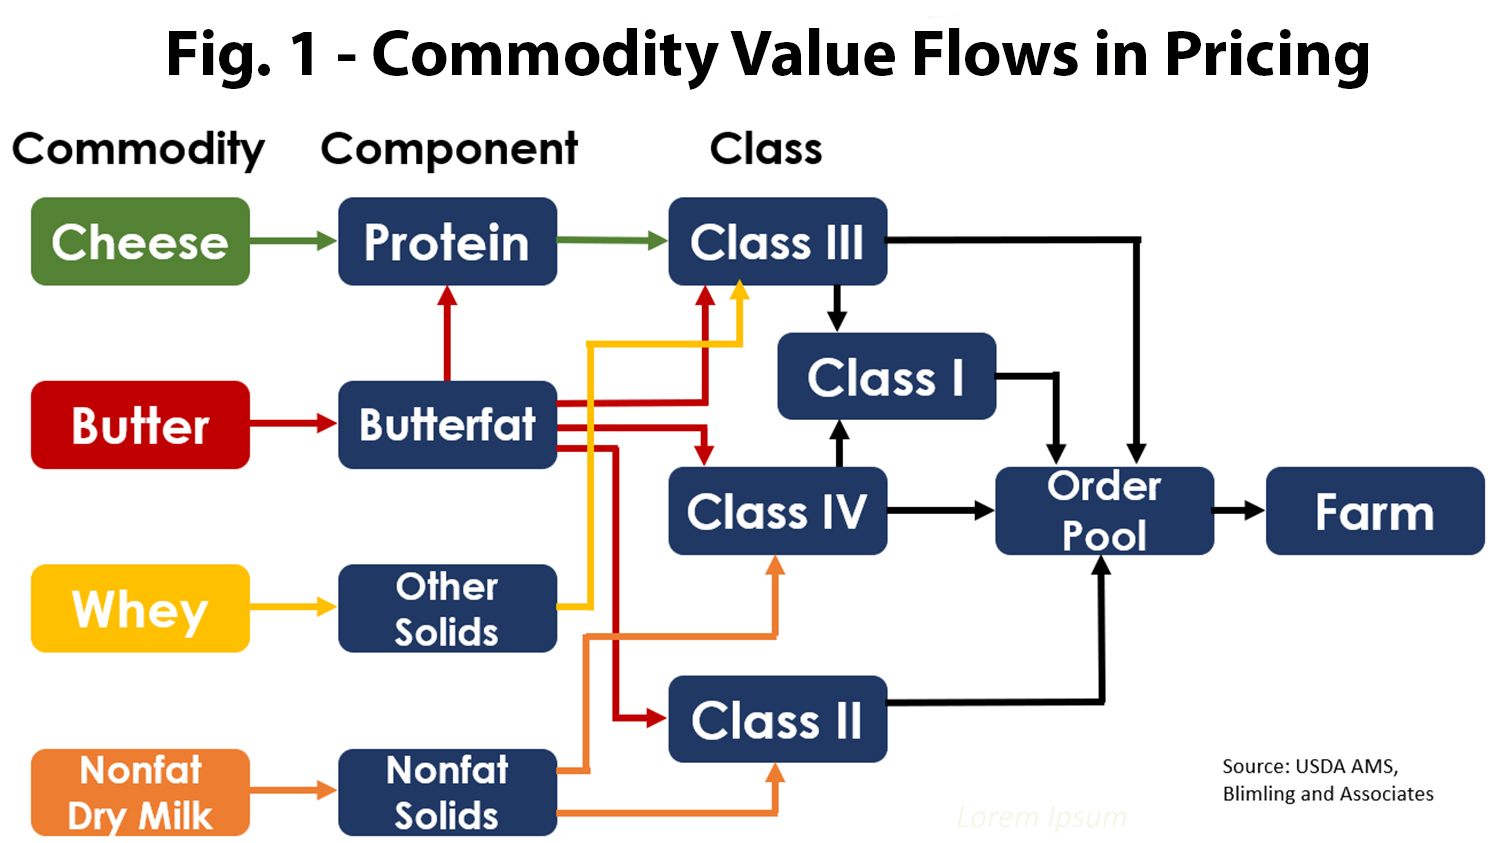
At issue was the impact on FMMOs with more cheese and less fluid milk, that would experience the negative impacts of a proposed hike in processor make allowances without the positive buffer of higher Class I location differentials.

Bremmer said over 126 individuals and organizations provided comments to USDA. The comment period ended Sept. 13. 

During his visit to Expo on Oct. 4, Ag Secretary Tom Vilsack said USDA would issue a final decision in mid-November. Also on Oct. 4, USDA held a webinar explaining the producer referendum expected in January. (Look for more specifics in a future Farmshine, and check out the Farm Bureau recap here)

The short answers to the above question appear to be yes, yes, and yes. With an Order, producers in some regions will see lower FMMO blend prices. Without an Order, they would lose minimum prices altogether and other important FMMO functions.

The silver lining? Munch pointed to better competition currently for milk, and he sees opportunity for milk in the future as consumers focus on protein.

New to the discussion was make allowance data compiled by AFBF for its official comment at the Federal Register showing the average plant size of processors participating voluntarily in the Stephenson Survey relative to the average plant size of processors reporting to the NASS Dairy Product Manufacturing Survey (below)

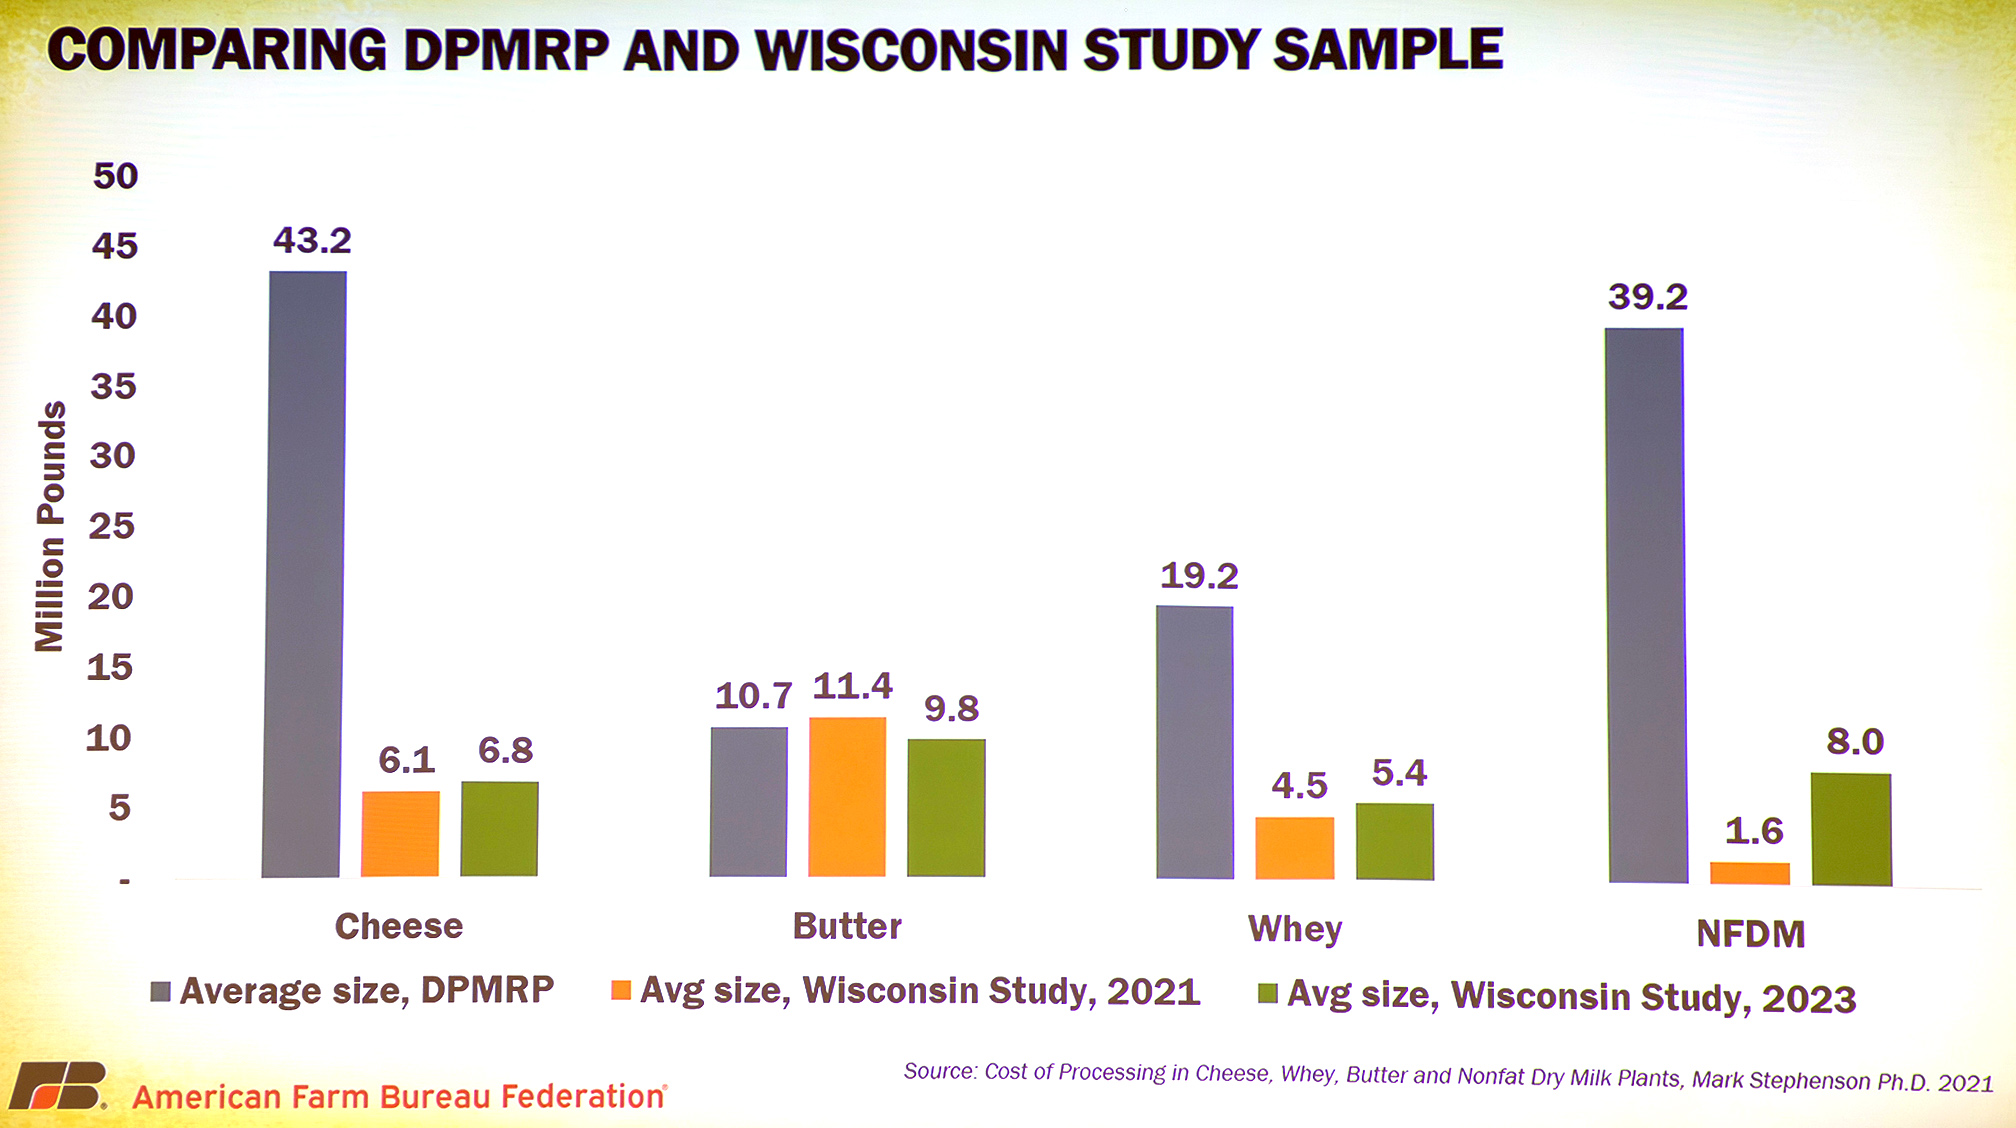
The average size and volume of the plants in the voluntary cost of processing survey is 5 to 20 times smaller than the size and volume of plants reporting to USDA on price and production. This is further evidence that mandatory surveys are the only fair way to examine and set make allowance levels.

ADC reports that farmers have called with questions and concerns about the FMMO changes they will vote on. Part of ADC’s mission is to inform dairy farmers and help them understand factors like this that affect their businesses, said Bremmer.

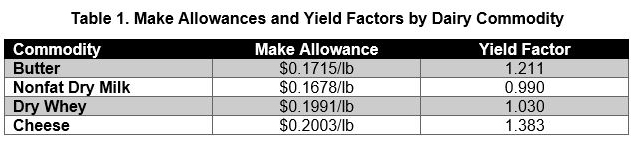
For example, it’s helpful for farmers to realize that current make allowances equate to $2.17 to $3.17 per hundredweight in deductions already in the pricing formulas to cover the cost of converting milk to butter, cheddar cheese, nonfat dry milk, and dry whey. 

The proposed new make allowances add 70 cents to $1.00, depending on class utilization, bringing the total deduction to about $2.89 to $4.07 per hundredweight, maybe more.

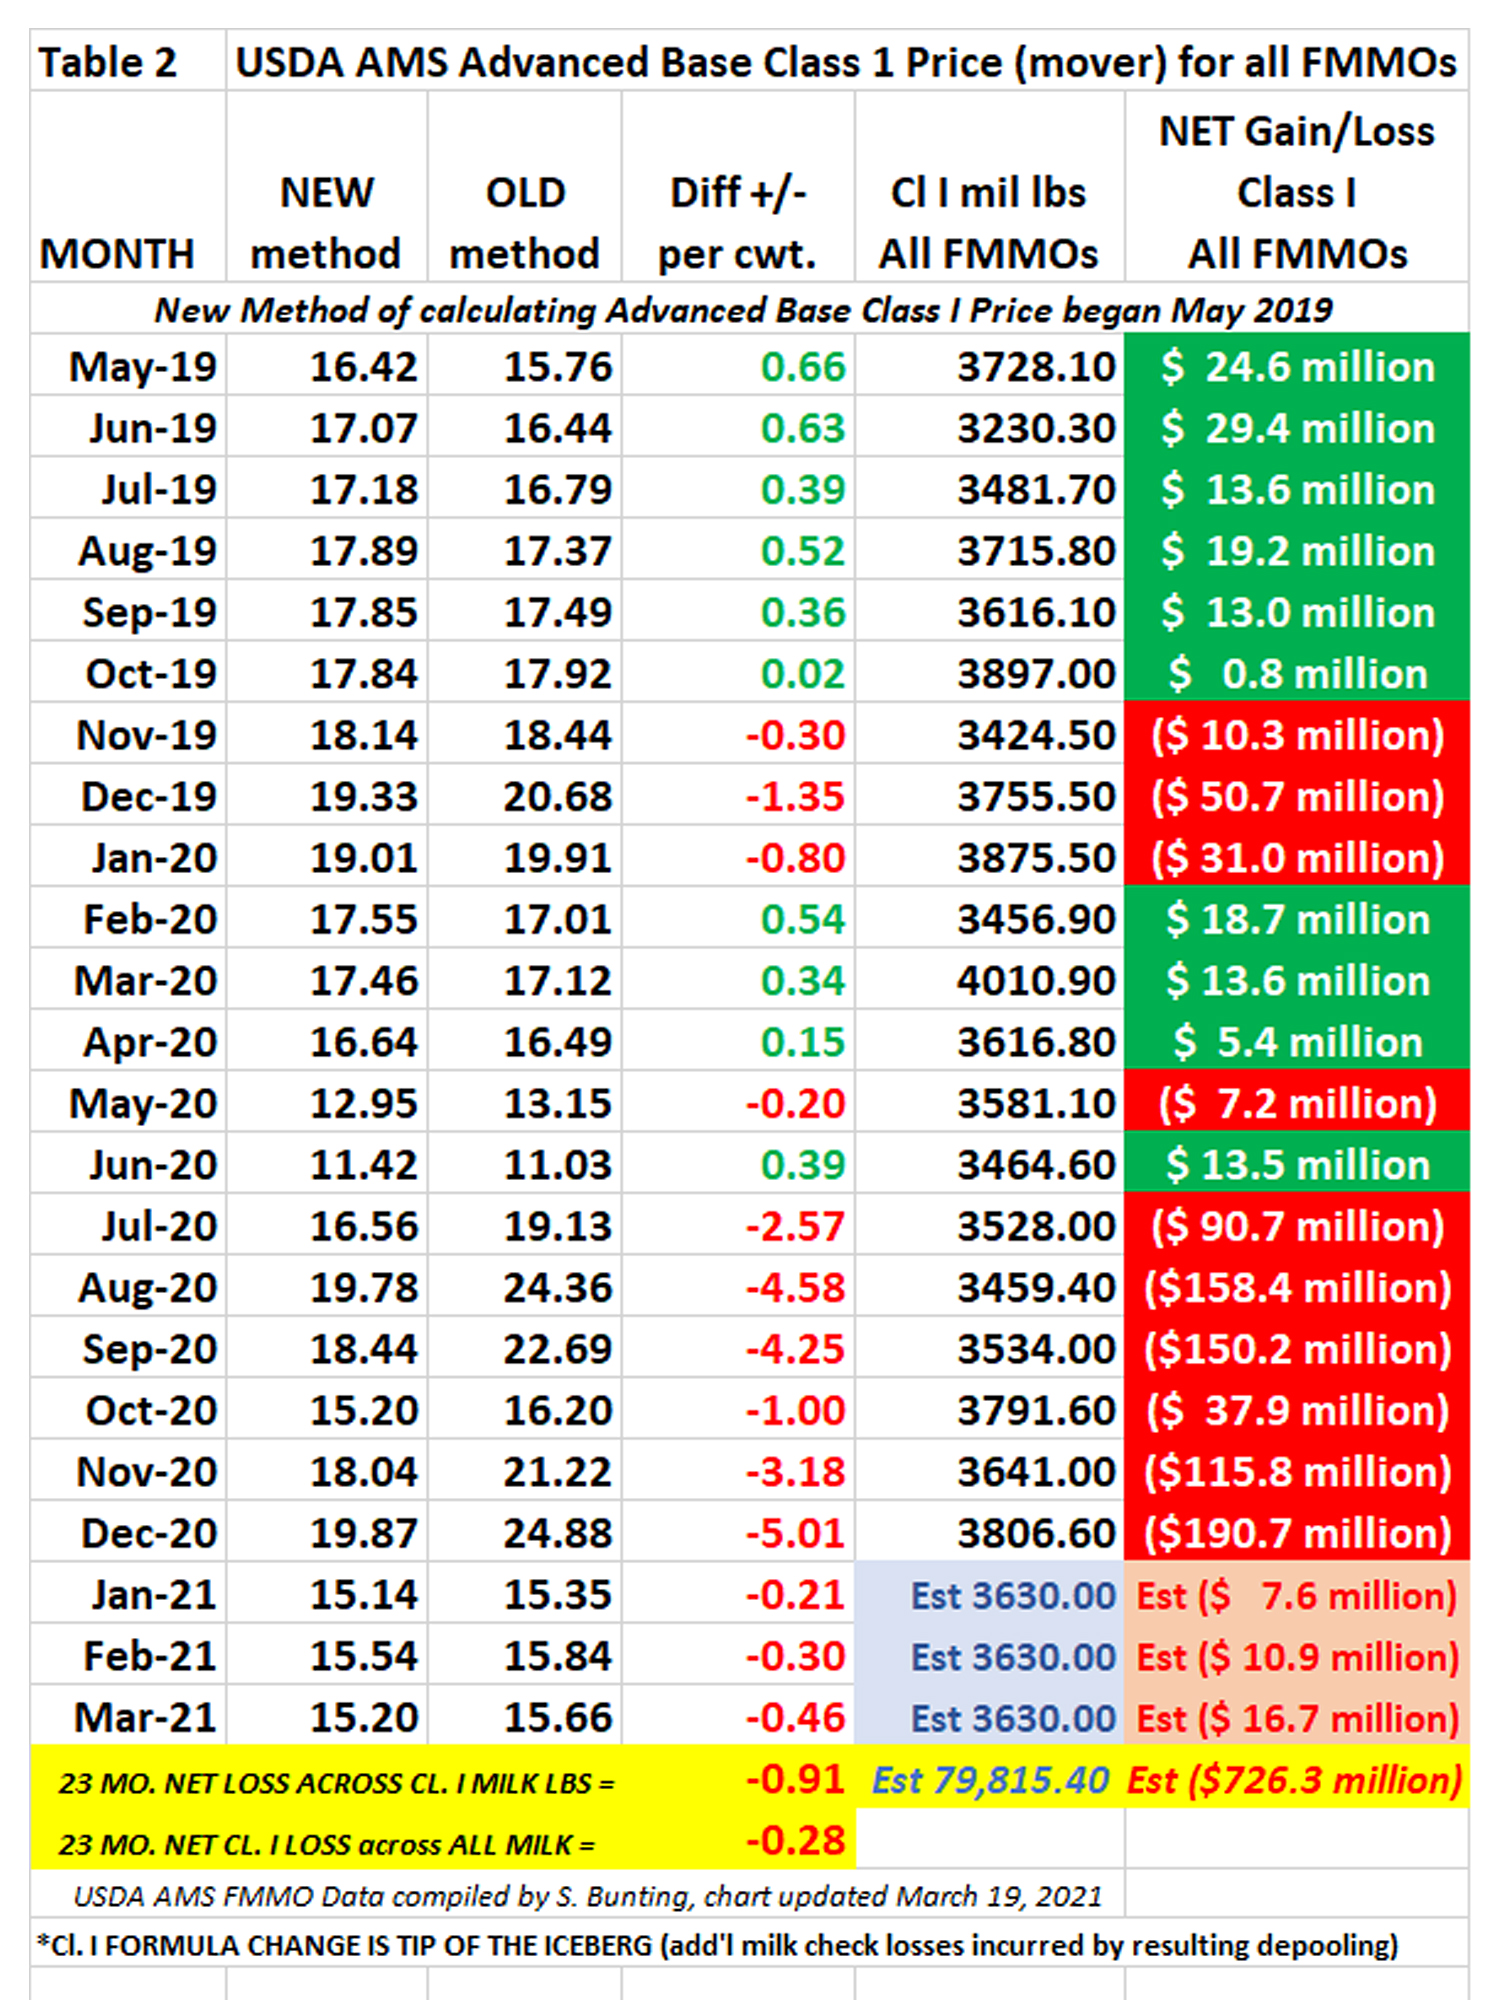
The splitting of Class I into a two-mover pricing system is also causing discontent and concern. On the one hand, USDA would restore the ‘higher-of’ method for conventionally pasteurized fluid milk but use an ‘average-of’ method with a rolling and delayed adjuster for the extended shelf life (ESL) fluid milk products. This new milk class was not vetted nor defined during the hearing.

Also of concern is the delay in implementing positive updates to milk composition standards that have not been updated since Order Reform in 2000.

USDA’s recommended decision applies to all 11 FMMOs nationally but will be voted on by eligible (pooled) producers in each Order, individually.

A two-thirds ‘yes’ vote within each individual Order continues that Order with the changes. If the two-thirds threshold is not met by either producer numbers or volume in an Order, then the result is termination of that Order. 

Producers do not have the option of voting separately on the five pieces of the USDA decision, nor do they have the option of voting to keep the FMMO pricing formulas as they are currently.

Economists with National Milk Producers Federation have stated previously that 65 to 70% of the U.S. milk supply is marketed through cooperatives that tend to bloc vote for their producers, but this percentage can vary on an individual Order basis.

USDA determines voting eligibility, based on whether milk was pooled in the reference period selected by each Market Administrator. 

“When we get down the road to the vote, and if we vote ‘no,’ that will dissolve the Order, right?” asked one dairy farmer. “What opportunity does any geography have to reorganize a new Order to fit what works for them?”

Munch said producers could start a process to create a new Order, but it would still be required to use the same price formula rules because these will apply to ALL Orders uniformly. In contrast, he noted that USDA leaves pooling and depooling rules to be decided individually by each Order.

One member of the media pressed Munch to speculate on what happens if a western Order votes no, but an eastern Order votes yes?

“People always want me to speculate on what happens if California or the Upper Midwest vote out their Order(s). What we’ve seen in the past in unregulated areas, or areas with state orders — they still base a lot of their pricing on the nearby Federal Order system,” he responded.

“If we remove more milk out of the Federal Order system, does that system then play less of a role in pricing milk, and does that unregulated market start to dictate and suck milk out of the regulated areas, if you’ve taken out some of the large milk production states? That’s just some speculation, something to think about in the long term,” he said.

On a more immediate basis, Munch said that if an Order is terminated by this vote, “farmers lose protections like timely payments and component verifications, and the minimum prices. You could end up with a patchwork.”

He pointed out that USDA did not raise make allowances by the full amount requested by processors, but also did not go with the more modest increases requested by the cooperatives.

In their post-hearing comments, processors voiced great unhappiness with the decision, he said, because they didn’t get the multi-year increases to even higher levels.

“We don’t blame USDA for trying to come up with a middle ground… we just don’t have the data. The way hearing processes work is they collect this data brought by stakeholders and try to come up with a compromise that works for everybody,” Munch explained. “Our argument is that the data may not reflect market conditions, and we want to make sure that it does. We can’t get that assurance until there’s an audited, mandatory survey.”

As a standalone piece, AFBF estimates that USDA’s proposed increase in make allowances would remove an additional $1.25 billion annually from producer pool revenue, nationwide, based on past pooling data. However, USDA proposes a one-year delay in implementing the milk composition updates that would contribute $200 million annually in producer pool revenue nationwide.

Munch sees the 12-month delay in implementing the milk composition standards and the splitting of the Class I mover with an ESL adjuster as two things that appear to be “thrown in there,” with a lot of groups voicing discontent and confusion.

When asked by a reporter if the add-ons to Class I will create consumer resistance to what could be a 25-cents-per-gallon increase in retail fluid milk prices, Munch cited the hearing record where economists testified to the relative inelasticity of fluid milk demand.

He also sees great opportunity for milk: “When I go to the gym, I used to see no one drinking milk. Now I see tons of people drinking milk, protein shakes, and other things, and it’s not plant-based products. I think milk can take advantage of marketing the protein benefits that people in my generation are looking for and are willing to pay for.”

Munch was asked if AFBF will recommend how its dairy members should vote.

“We will not make that recommendation. We take positions based on our policy, which includes opposing any make allowance updates until we have mandatory cost of processing surveys, and other aspects related to our policy book,” he replied. “It’s up to our members to make those voting decisions, and there is a regionality to this, so we don’t get involved at that level.”

Florida producers, for example, “will be okay with the new rules” because the over 80% Class I utilization brings with it higher location differentials. The Upper Midwest, on the other hand, has been at roughly 5% Class I and 93% Class III, so there is very little benefit from the Class I changes, but those producers are subjected to the highest make allowance deductions for Class III products, which is 95% of their blend price.

-30-

Hot topic: Understanding milk pricing basics and PPD

Gratitude to Blimling and Associates for this flow chart illustrating the complexity of USDA milk pricing

By Sherry Bunting, Farmshine, March 26, 2021

I challenge anyone to find a pricing system on anything in the universe as complicated as the pricing of a hundred pounds of milk (See Fig. 1).

The Federal Milk Marketing Order (FMMO) system goes back to the 1930s Ag Marketing Law.  In 2000, changes were made to use end-product pricing formulas for four base commodities – Cheese (block and barrel Cheddar average), Butter, Nonfat dry milk (NDFM) and Dry Whey.

Today, these four commodities trade daily on the spot cash market at the Chicago Mercantile Exchange (CME), where less than 1% of volume, closer to 2% on butter, is sold. Since 2018, this 10-minute daily spot auction is done completely as an electronic auction.

The CME spot market sets the pace for actual sales reported weekly to USDA by around 100 processors. From these weekly-reported prices, a weighted average for each of the four commodities is calculated by USDA. The weighted averages are used in formulas that account for yield and deduct specific “make allowances” (See Table 1) to then calculate Class and Component prices.

But first, these weighted price averages for just the first two weeks of each month are plugged into a multi-step formula to determine an Advanced Skim Pricing Factor for Class III (cheese/whey) and Class IV (butter, NFDM). The adjusted butter price is also used to calculate the Advanced Butterfat Pricing Factor.

Effective May 2019 — as a result of a change agreed to by National Milk Producers Federation and International Dairy Foods Association and then passed by Congress in the 2018 Farm Bill — the 2-week Class III and IV Advanced Skim Pricing Factors are averaged together, plus 74 cents to calculate the Base Skim Price.

Prior to May 2019, the Base Skim Price was simply the “higher of” either the Class III or the Class IV Advanced Skim Pricing Factor.

(Author’s Note #1: The previous ‘higher of’ method was the way the FMMOs could make sure Class I always brought the highest price to fulfill the purpose of the Federal Orders – assuring fresh milk supplies – and to keep other handlers invested in pooling their milk. We can’t lose sight of the fact that the fluid milk sales (Class I) have no market transparency as to their value – at all. In some states there are loss-leader laws or minimum pricing provisions, but in most states, Class I fluid milk sales are treated as a base commodity by large retailers like Walmart and Kroger. They loss-lead the retail consumer price of fluid milk to extreme low levels, even as low as $1 per gallon, to win shoppers. They do this because supermarket data show fresh fluid milk is in over 94% of consumer shopping carts! Because it is treated as a loss-leader in some states, and regulated with minimum pricing in other states, it’s impossible to know the real market value of Class I fluid milk apart from the value of its components in making other products.)

Next, the Base Skim Price is multiplied by a yield factor of 0.965 and the Advanced Butterfat Pricing Factor is multiplied by a yield factor of 3.5 and then added together to become the Base Class I Price. This price, known as the Class I ‘mover,’ is announced before the 23rd of each month but is used in the following month.

The various location differentials throughout the 11 FMMOs are next added to this Base Class I Price.

Whew! Now back to those weekly-reported commodity prices, yield factors and make allowances… Announced around the 5th of the next month, the other class prices are a function of the component values based on average weekly prices for the four commodities for four weeks: Component Value = Yield x (Commodity Price – Make Allowance).

In Multiple Component Pricing FMMOs like the Northeast (FMMO 1) and Mideast (FMMO 33), a Statistical Uniform Price (SUP) is calculated from these Class and Component prices according to how the milk in the FMMO was utilized. The SUP is announced around the 11th of the next month before settlement checks are paid for the previous month’s milk.

(Author’s Note#2: Another wrinkle… did you know that an uptrending cheese and butter price can leave producers with a lower protein price? It happened in March 2021. Every end-product — butter, cheddar, nonfat dry milk and dry whey — was higher in March than February, and Class III, IV and II pricing were also higher, but the uptrending butterfat portion of the cheese price creates a ‘snubbing’ effect on the ability of protein to rise within the skim portion. Yes, it’s complicated, and the answer from USDA is a story of its own in the future.)

The FMMO SUPs are based on a 3.5% Butterfat test, but the FMMOs also report for information purposes a uniform price based on the average actual fat test. Your price will differ in your milk check based on your fat, protein, and other factors. In general, producing protein and butterfat above the statistical level nets a higher price, under normal conditions. Lately this has not held out because of negative PPDs.

What are PPDs? Along with the SUP, the FMMO calculates a Producer Price Differential (PPD). This shows how money remaining in the producer settlement fund is divided across the qualified hundredweights of milk, after all components are paid. Sometimes this is a negative number, meaning there was not enough money in the producer settlement fund to pay all of the actual component value after the location differentials on Class I were paid. A negative PPD represents spreading the shortfall across qualified milk in the pool. Severely negative PPDs represent unpaid component value.

The PPD is calculated by subtracting the Class III price from the average of all classes together: PPD = SUP – Class III. In the Northeast and Mideast FMMOs, this PPD has typically been a positive number but has been shrinking in recent years and has been negative for 13 of the past 23 months.

Negative PPDs happen for any or all of four main reasons:

1) When a rapid rise in commodity price(s) is not captured in the 2-week Advanced Pricing Factors.

2) When Class II and IV are far below Class III.

3) When Class I price falls below Class III because of the new averaging method when the spread between III and IV is greater than $1.48/cwt. Half of the months from May 2019 through December 2020 had a lower Class I Base price under the new method, representing a net loss of over $700 million on Class I pounds across all FMMOs. (See Table 2)

4) When handlers de-pool Class III milk because it is higher — to avoid paying into the pool.

Only Class I handlers are required to pool all of their milk. Other handlers can choose what non-Class I milk to pool or not pool based on what is financially advantageous. De-pooling is more likely when multiple months have negative PPDs because of wait times to re-qualify milk for the pool. Some FMMO pool-qualifying requirements are more stringent than others, and the rules have been loosening in recent years because handlers say they need more flexibility to meet fluctuating fluid milk needs.

Occasionally, when cooperatives or plants de-pool Class III milk, some will pass the higher value they withheld from the pool directly to their own producers. In most cases, however, this did not happen in 2020. Additionally, the severity of negative PPDs across FMMOs varied and this created a wide range of milk check pricing of $8 to $10 from top to bottom, when normally this range is $2 to $3, maybe $4. USDA relates that the value is still in the marketplace, so even when the PPD goes negative, some of that value is attributed to the All Milk price used in Dairy Margin Coverage margins because the value is in the market even if it is not in the “pool.”

In addition, for Pennsylvania dairy producers, all Class I milk from Pennsylvania farms that is bottled in Pennsylvania and sold in Pennsylvania stores receives the Pa. Milk Marketing Board (PMMB) over-order premium, which currently stands at $1.00/cwt. Processors can reduce this obligation by selling and sourcing milk from in and out of state as well as other methods.

Cooperatives are producers under the Pennsylvania law, so they collectively receive this premium also, where applicable, and have the ability to disburse the premium to members as they see fit.

Every farm’s mailbox price is further affected by premiums, such as quality bonuses, and deductions, such as trucking cost and marketing fees, which all vary across cooperatives and milk buyers.

This ‘primer’ just scratches the surface of current milk pricing issues. A related topic affecting many producers since May 2019 is how the new Class I pricing method, and the negative PPDs and depooling that can result when Class III and IV are so divergent, affect the way price risk management tools work, creating additional losses in many cases.

(Author’s Note #3: This article has been updated since it was previously published in R&J Dairy Consulting’s customer newsletter.)

-30-