Are we moving toward cow islands and milk deserts?

Opinion/Analysis

By Sherry Bunting, Farmshine (combined 2 part series Aug. 12 and 19, 2022)

In Class I utilization markets, the landscape is rapidly shifting, and we should pay attention, lest we end up with ‘cow islands’ and ‘milk deserts.’

Farmshine readers may recall in November 2019, I wrote in the Market Moos column about comments made Nov. 5 by Randy Mooney, chairman of both the DFA and NMPF boards during the annual convention in New Orleans of National Milk Producers Federation together with the two checkoff boards — National Dairy Board and United Dairy Industry Association. 

Mooney gave a glimpse of the future in his speech that was podcast. (Listen here at 13:37 minutes). He said he had been “looking at a map,” seeing “plants on top of plants,” and he urged the dairy industry to “collectively consolidate,” to target limited resources “toward those plants that are capable of making the new and innovative products.”

One week later, Dean Foods (Southern Foods Group LLC) filed for bankruptcy as talks between Dean and DFA about a DFA purchase were already underway. It was the first domino right on the heels of Mooney’s comments, followed by Borden filing Chapter 11 two months later in January, and followed by three-years of fresh fluid milk plant closings and changes in ownership against the backdrop of declining fluid milk sales and an influx of new dairy-based beverage innovations, ultrafiltered and shelf-stable milk, as well as lookalike alternatives and blends.

The map today looks a lot different from the one described by Mooney in November 2019 when he urged the industry to “collectively consolidate.” The simultaneous investments in extended shelf-life (ESL) and aseptic packaging are also a sign of the direction of ‘innovation’ Mooney may have been referring to.

Two months prior to Mooney issuing that challenge, I was covering a September 2019 industry meeting in Harrisburg, Pennsylvania, where dairy checkoff presenters made it clear that the emphasis of the future is on launching innovative new beverages and dairy-‘based’ products.

Here is an excerpt from my opinion/analysis of the discussion at that time:

“While we are told that consumers are ditching the gallon jug (although it is still by far the largest sector of sales), and we are told consumers are looking for these new products; at the same time, we are also told that it is the dairy checkoff’s innovation and revitalization strategy to ‘work with industry partners to move consumers away from the habit of reaching for the jug and toward looking for these new and innovative products’ that checkoff dollars are launching.”

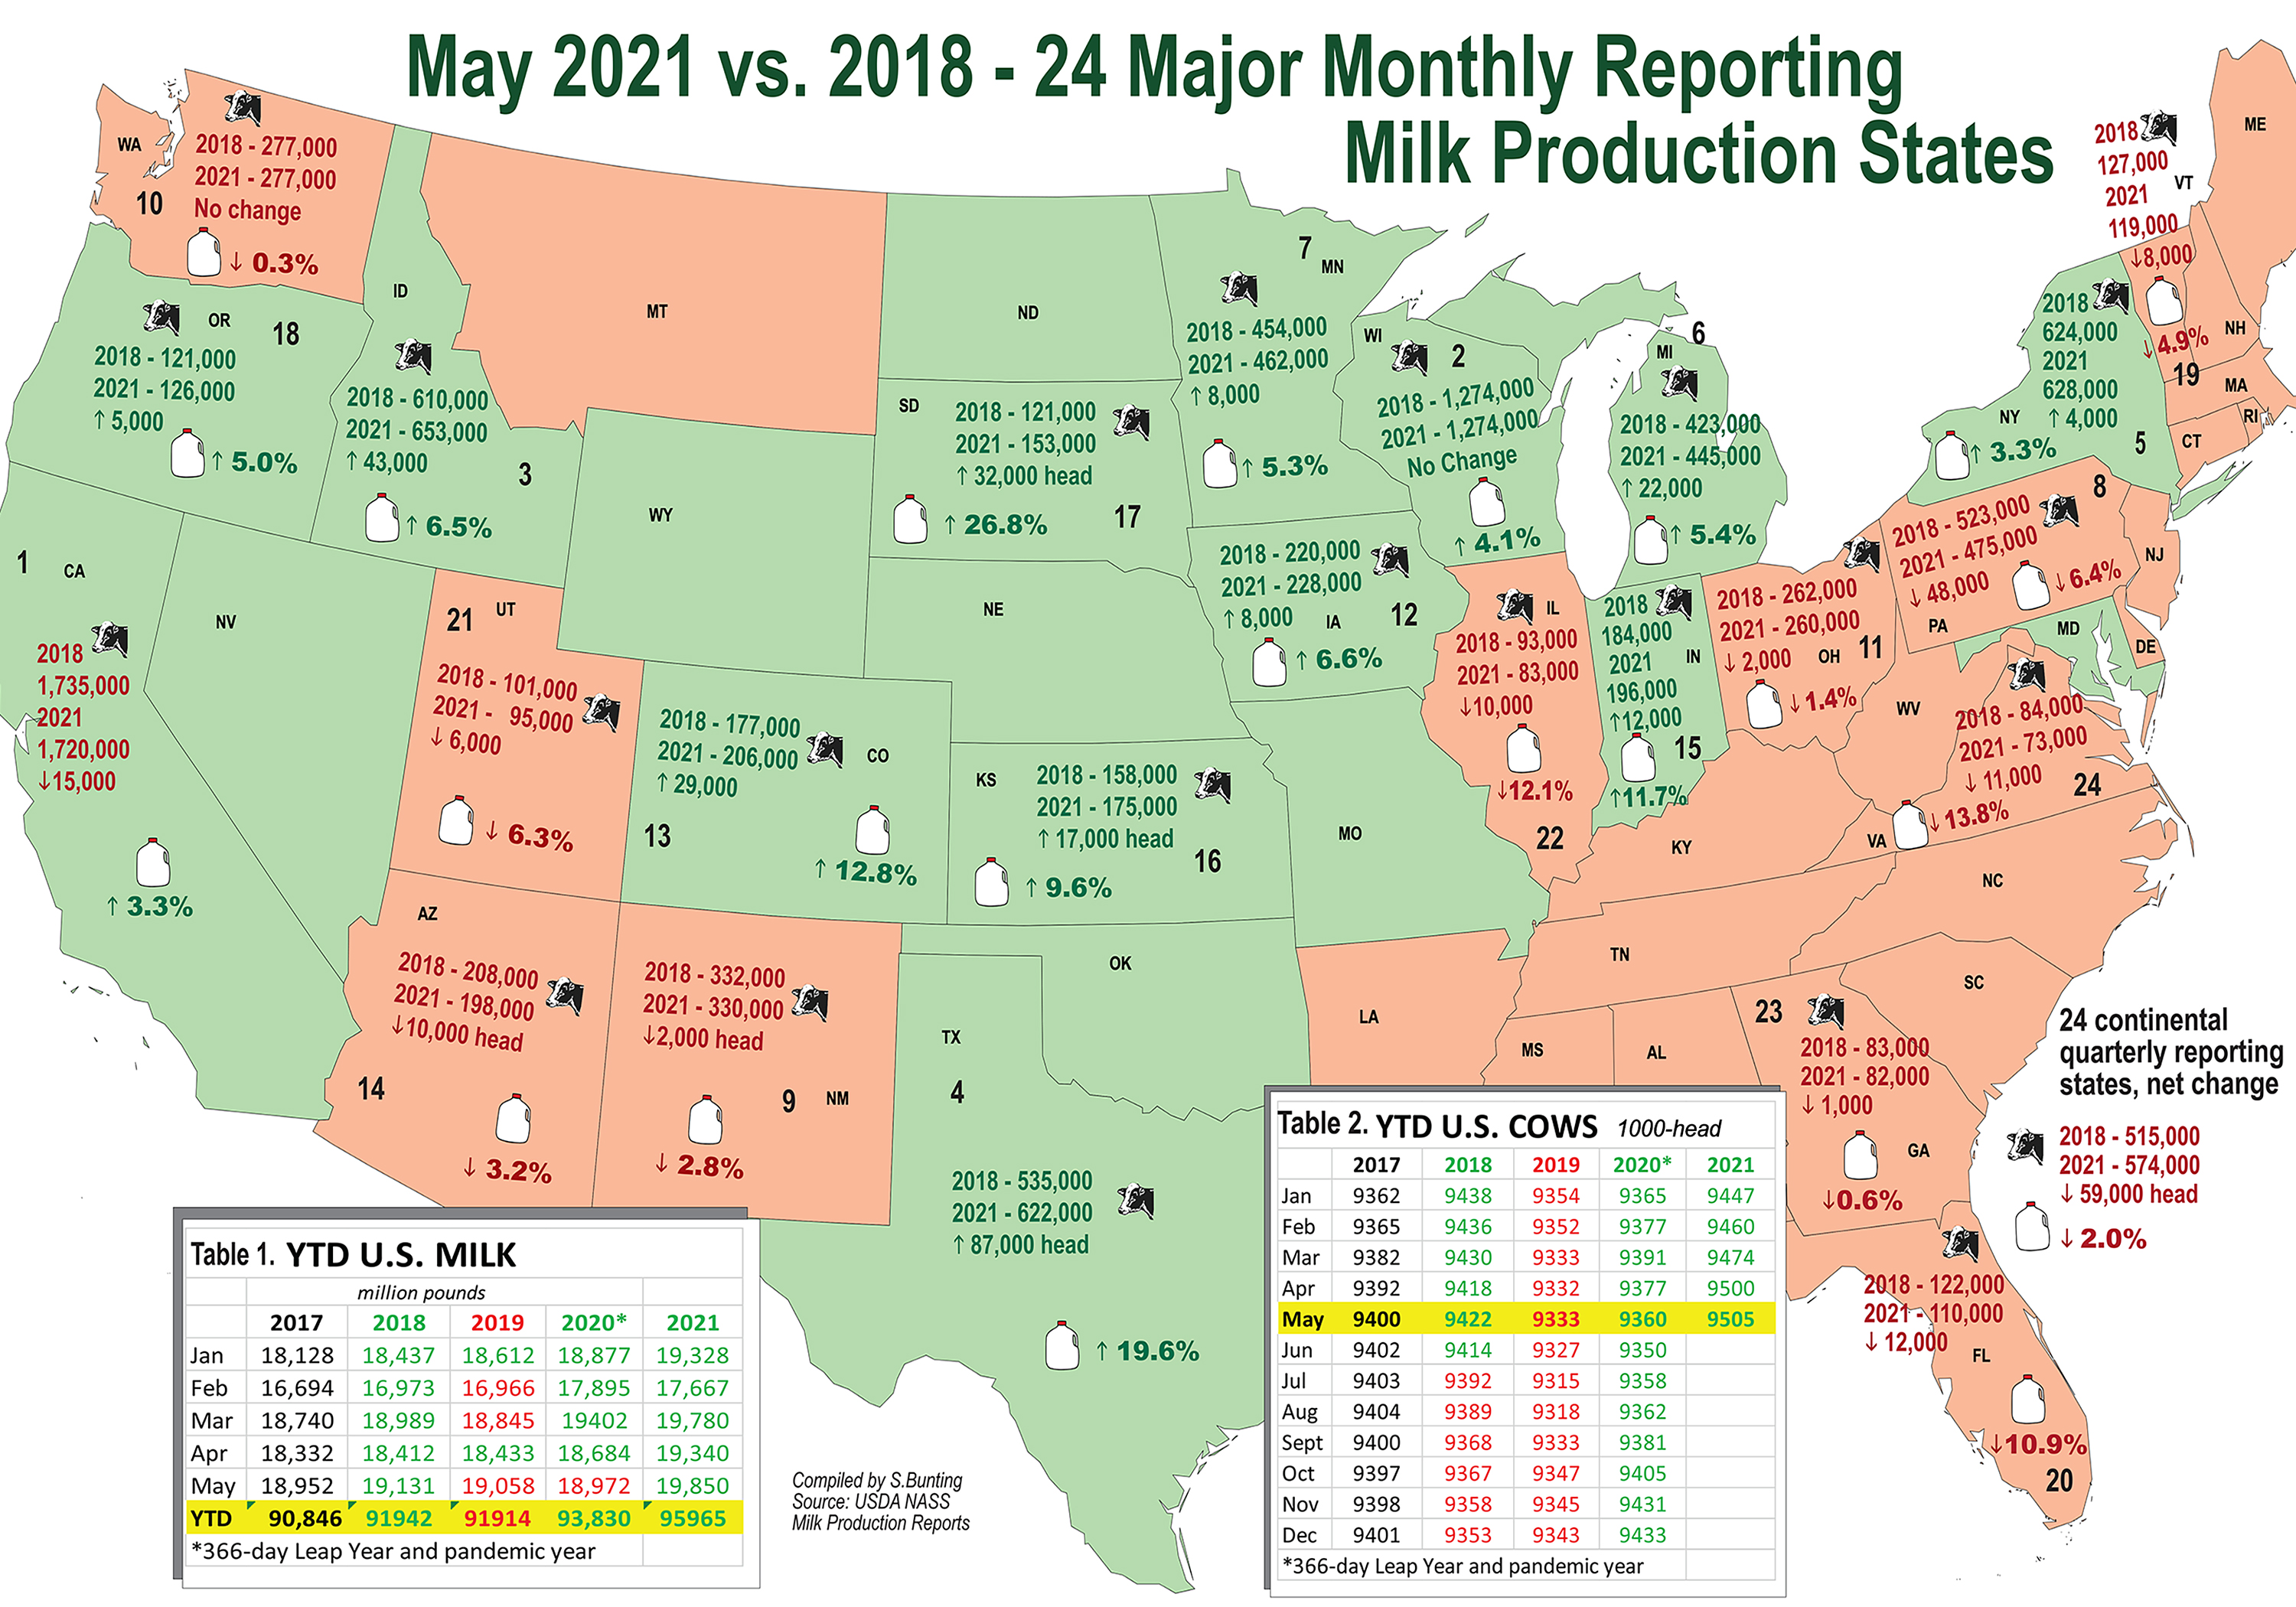
These strategy revelations foreshadowed where the fluid milk markets appear to be heading today, and this is also obvious from recent Farmshine articles showing the shifting landscape in cow, farm, and milk production numbers.

When viewing the picture of the map that is emerging, big questions come to mind:

Are today’s Class I milk markets under threat of becoming ‘milk deserts’ as the dairy industry consolidates into ‘cow islands’?

Would dairy farmers benefit from less regulation of Class I pricing in the future so producers outside of the “collectively consolidating” major-player-complex are freer to seek strategies and alliances of their own, to carve out market spaces with consumers desiring and rediscovering fresh and local, to put their checkoff dollars toward promotion that helps their farms remain viable and keeps their regions from becoming milk deserts? 

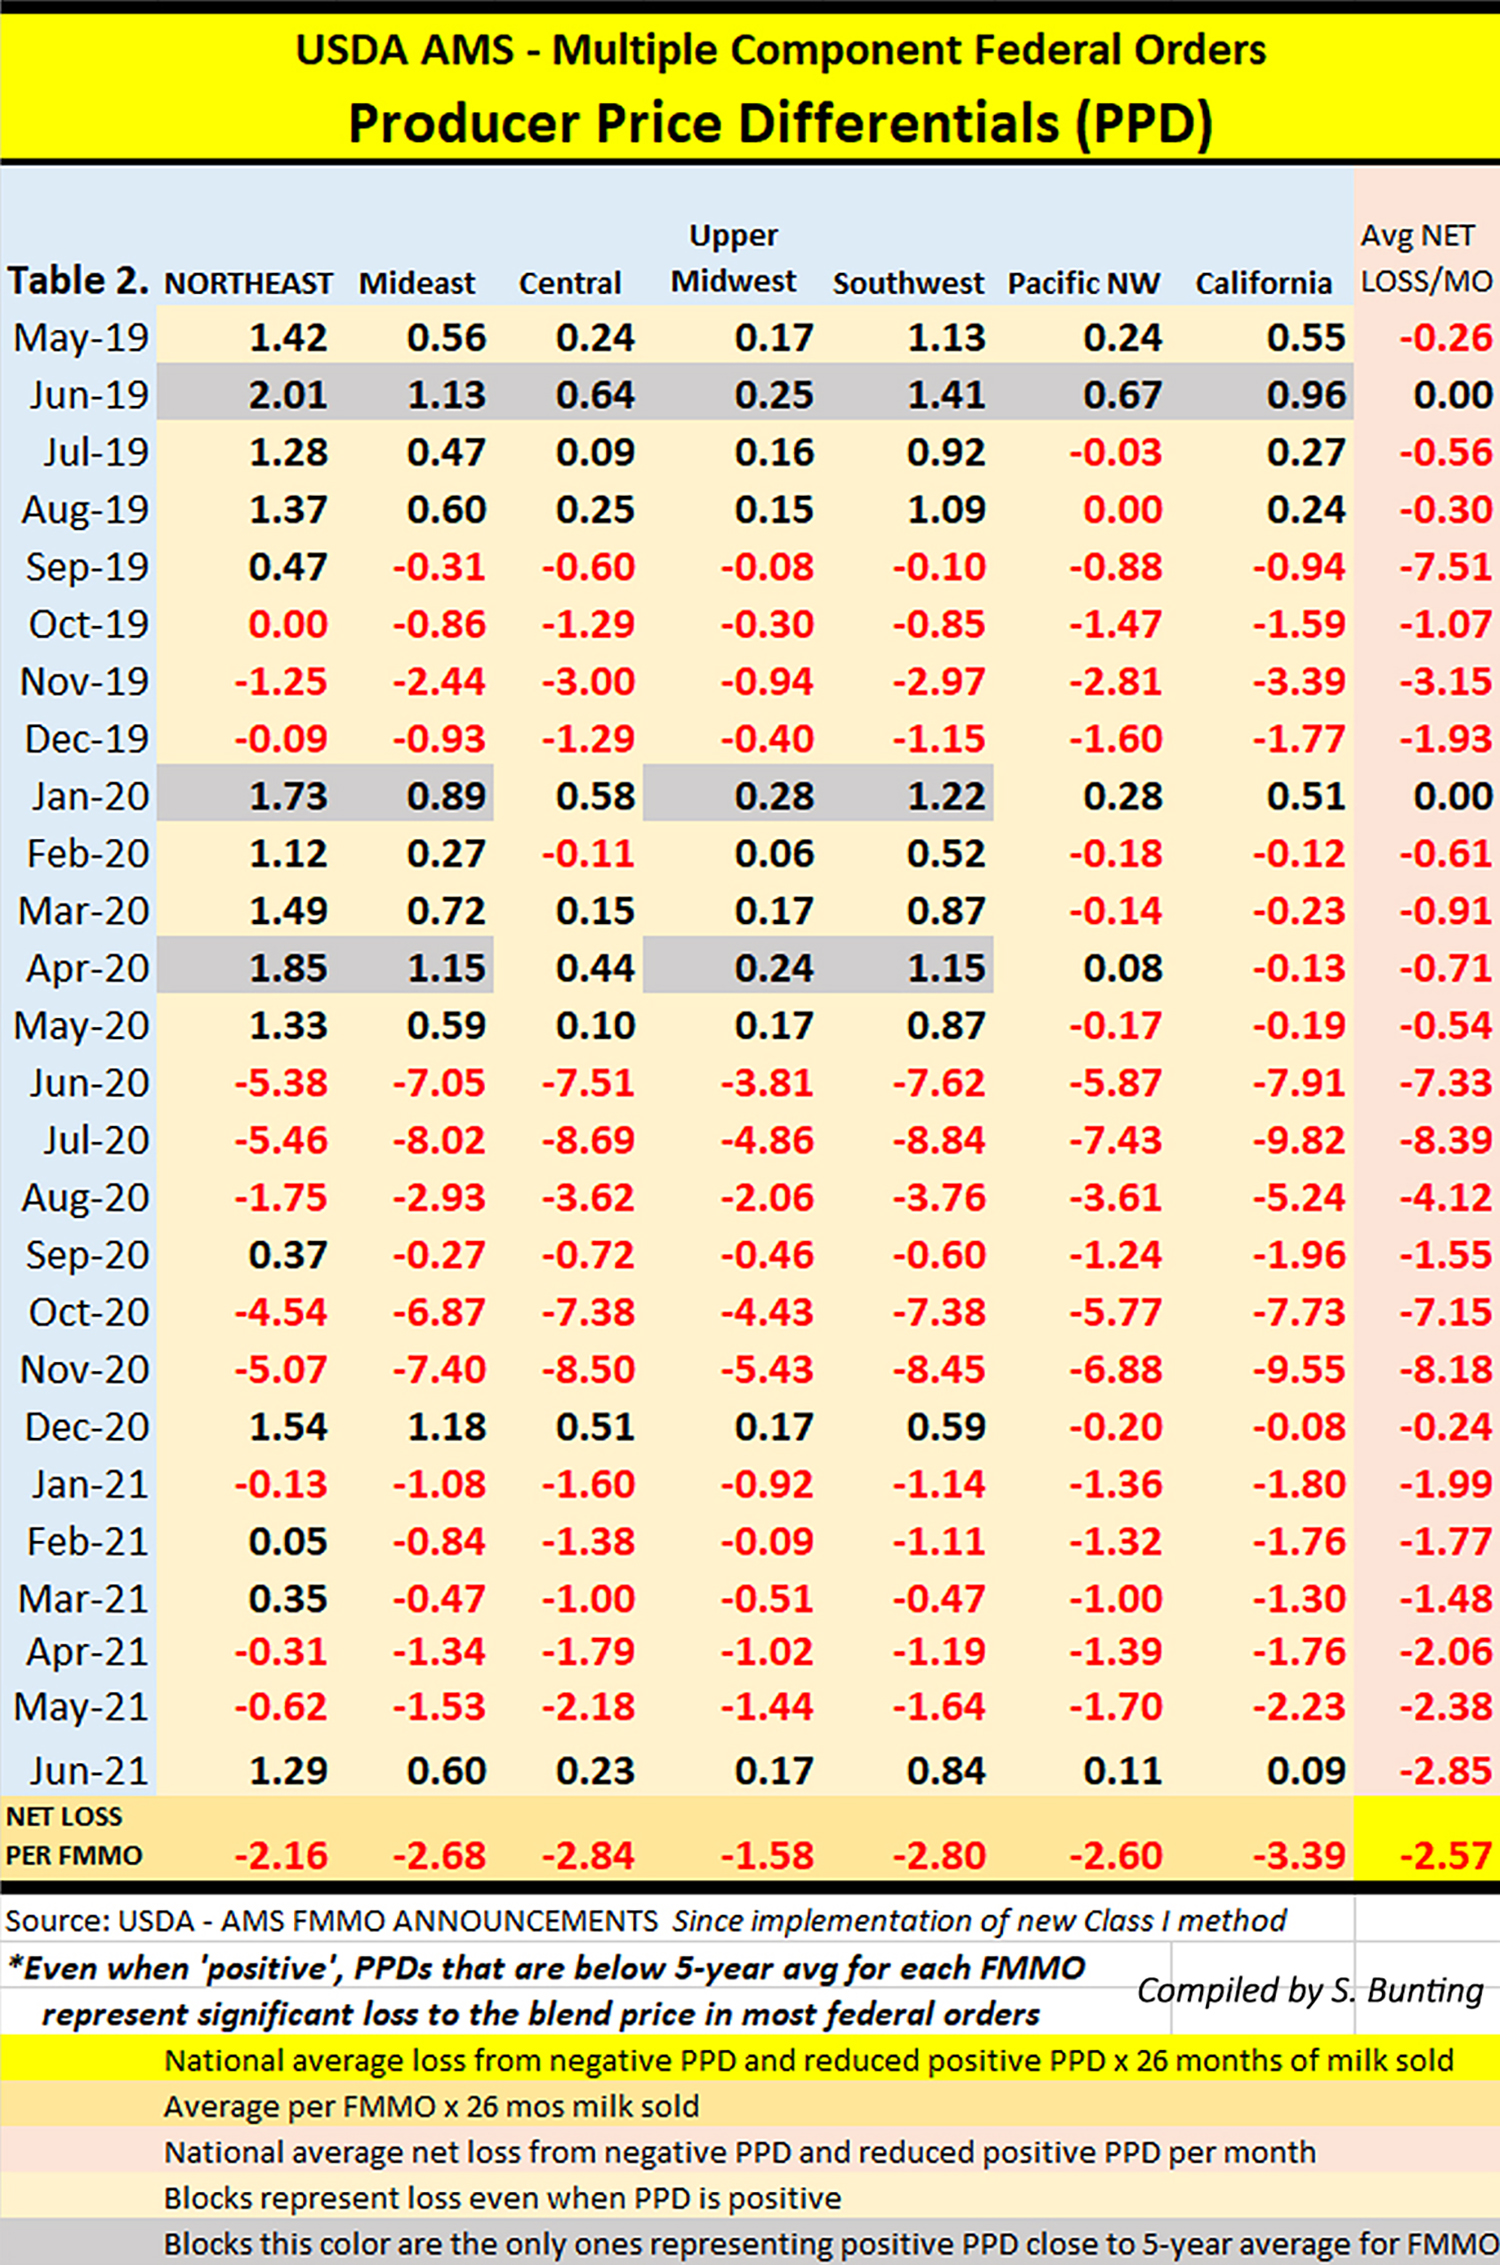
What role is the industry’s Net Zero Initiative playing behind the scenes, the monitoring, scoring, tracking of carbon, the way energy intensity may be viewed for transportation and refrigeration and other factors in Scope 1, 2 and 3 ESG (Environment, Social, Governance) scores? 

Shelf-stable milk may provide solutions for some emerging (or are they self-inflicted?) milk access and distribution dilemmas, and maybe one view of ESG scoring favors it? But ultimately it also means milk can come from cow islands to milk deserts — from anywhere, to anywhere.

It also becomes clearer why the whole milk bill is having so much trouble moving forward. The industry machine gives lip-service support to the notion of whole milk in schools, but the reality is, the industry is chasing other lanes on this highway to ‘improve’ the school milk ‘experience’ and ensure milk ‘access’ through innovations that at the same time pave the road from the ‘cow islands’ to the ‘milk deserts.’ 

It is now clearer — to me — why the Class I mover formula is such a hotly debated topic. 

If major industry-driving consolidators are looking to transition away from turning over cow to consumer fresh, local/regional milk supplies by turning toward beverage stockpiles that can sit in a warehouse ‘Coca-Cola-style’ at ambient temperatures for six to 12 months, it’s no wonder the consolidators want the ‘higher of’ formula to stay buried. What a subversion that was in the 2018 Farm Bill.

In fact, if the industry is pursuing a transition from fresh, fluid milk to a more emphasis on shelf-stable aseptic milk, such a transition would, in effect, turn the federal milk marketing orders’ purpose and structure — that is tied to Class I fresh fluid milk — completely upside down.

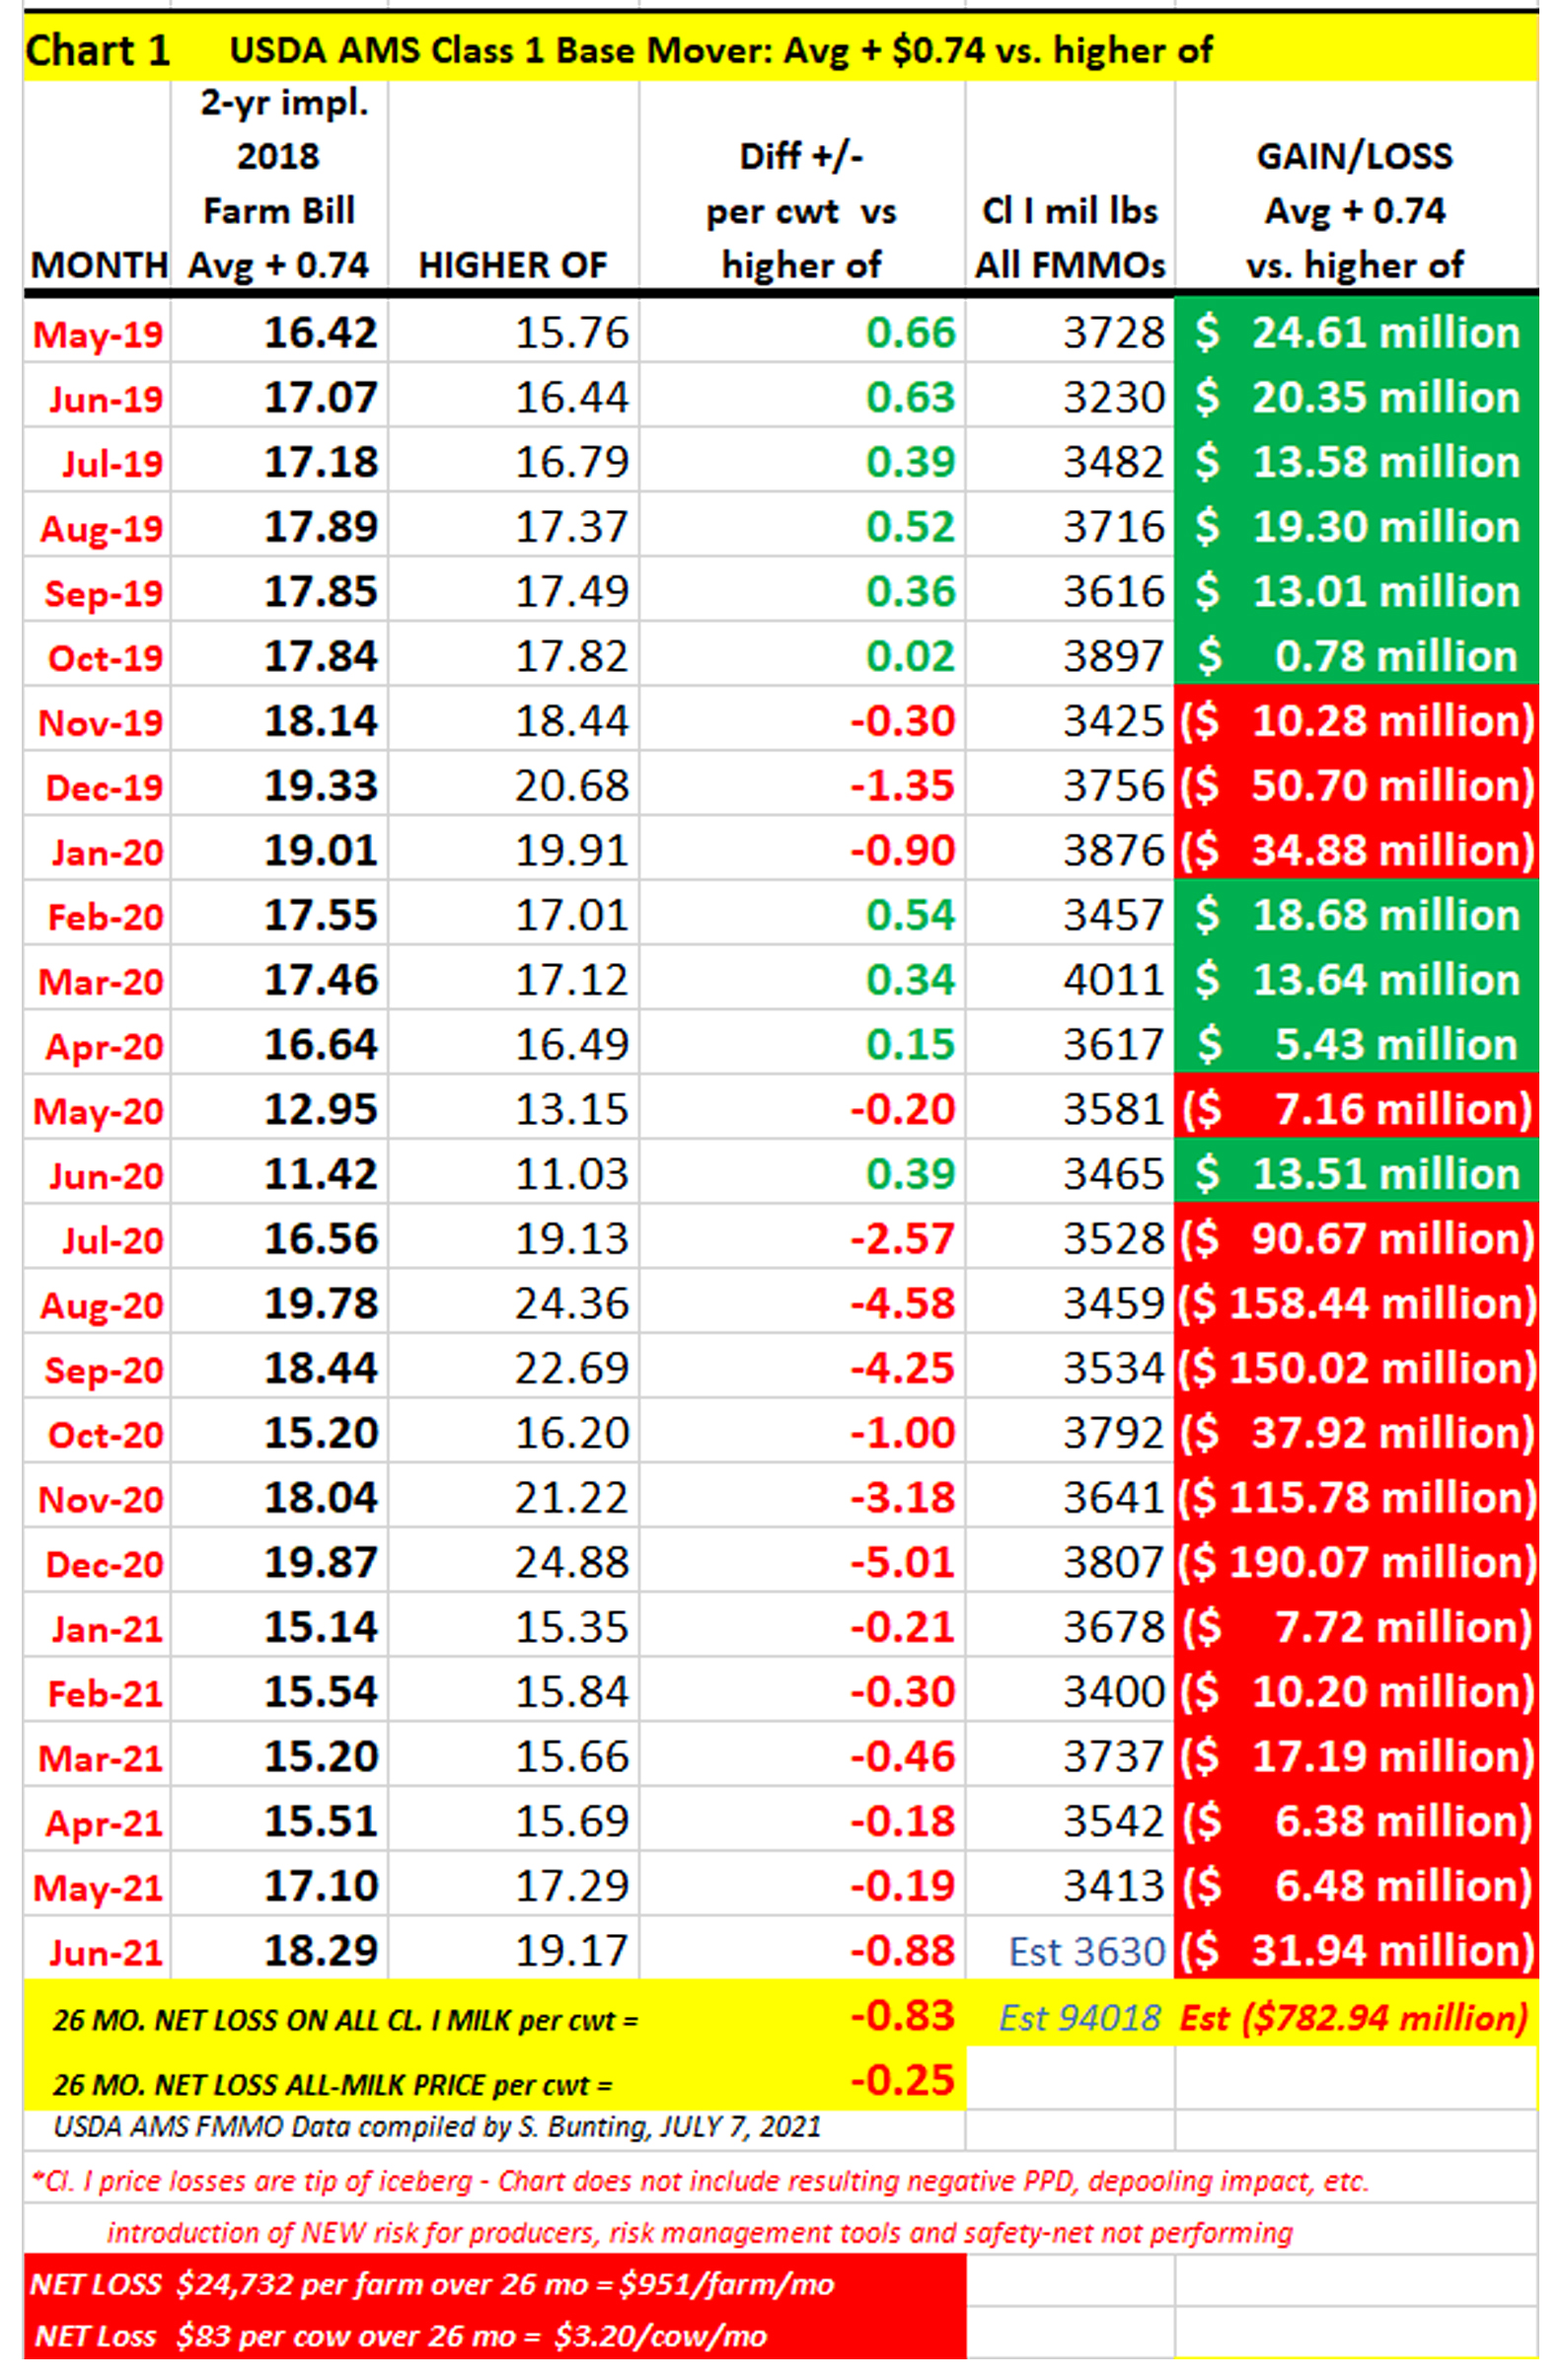
Landscape change has been in motion for years, but let’s look at the past 6 years — Dean had already closed multiple plants and cut producers in the face of Walmart opening it’s own milk bottling plant in Spring 2018. The Class I ‘mover’ formula for pricing fluid milk — the only milk class required to participate in Federal Milk Marketing Orders — was changed in the 2018 Farm Bill that went into effect Sept. 2018. The new Class I mover formula was implemented by USDA in May 2019, resulting in net losses to dairy farmers on their payments for Class I of well over $750 million across 43 months since then.

(Side note: Under the formula change, $436 million of Class I value stayed in processor pockets from May 2019 through October 2019, alone. DFA purchased 44 Dean Foods plants in May 2019 and became by far the largest Class I processor at that time.)

These and other landscape changes were already in motion when Mooney spoke on Nov. 5, 2019 at the convention of NMPF, NDB and UDIA describing the milk map and seeing plants on top of plants and issuing the challenge to “collectively consolidate” to target resources to those plants that can make the innovative new products. 

One week later, Nov. 12, 2019, Dean Foods filed for bankruptcy protection to reorganize and sell assets (mainly to DFA).

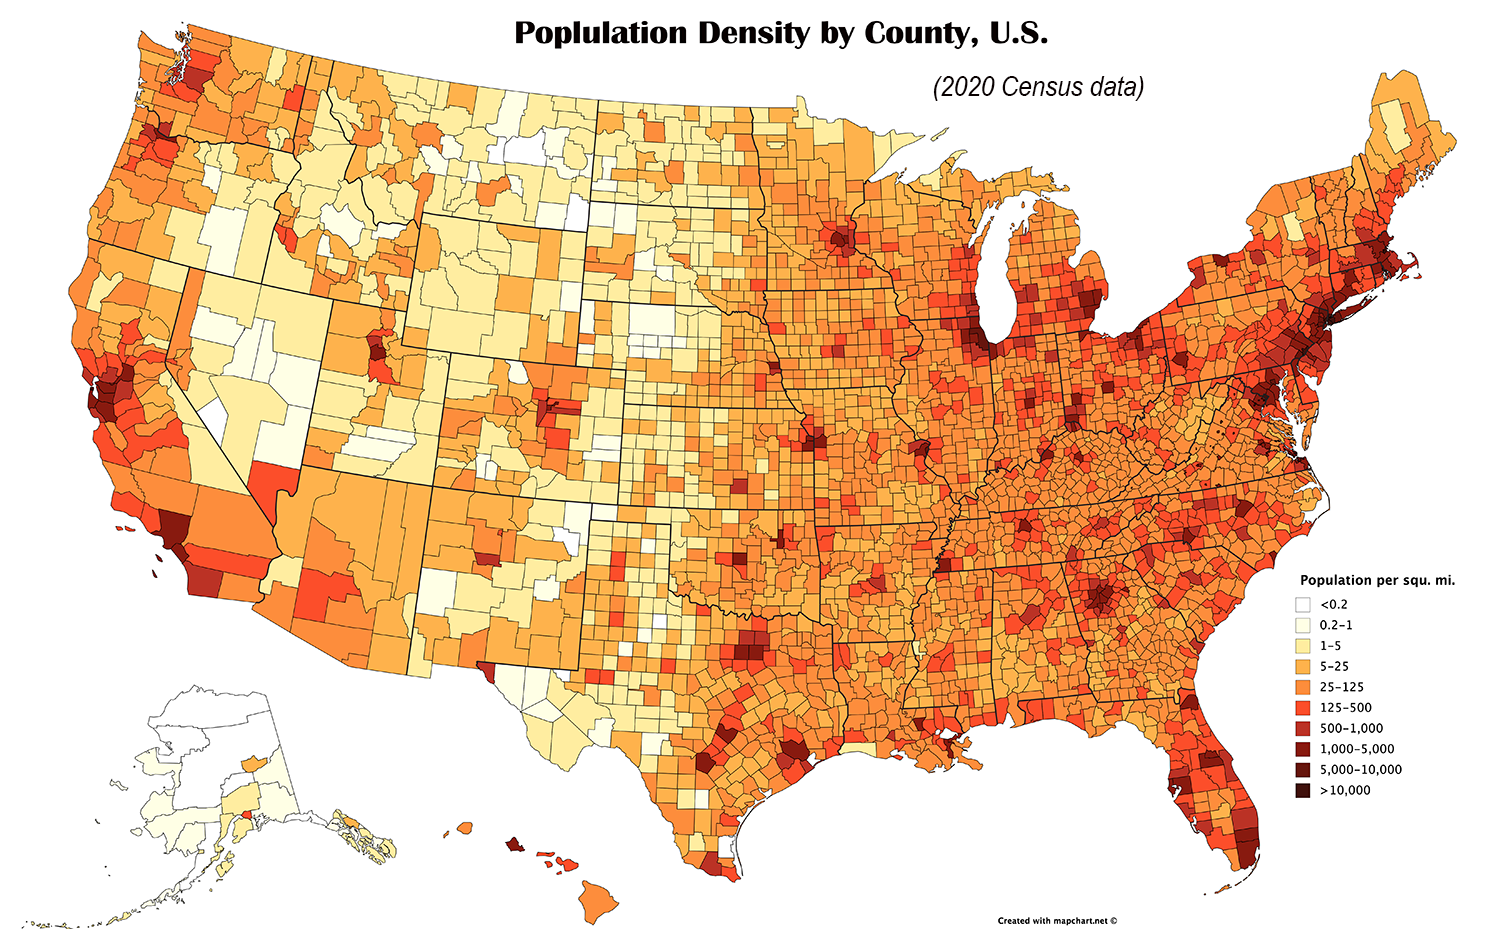
Since 2019, this and other major changes have occurred as consolidation of Class I milk markets tightens substantially around high population swaths, leaving in wake the new concerns about milk access that spur the movement toward ESL and aseptic milk. A chain reaction.

What does Mooney’s map look like today after his 2019 call for “collective consolidation” and the targeting of investments to plants that can make the innovative products, the plants that DMI fluid milk revitalization head Paul Ziemnisky told farmers in a 2021 conference call were going to need to be “dual-purpose” — taking in all sorts of ingredients, making all sorts of beverages and products, blending, ultrafiltering, and, we see it now, aseptically packaging?

In addition to the base of Class I processing it already owned a decade ago, the string of DFA mergers has been massive. The most recent acquisitions, along with exits by competitors, essentially funnel even more of the market around key population centers to DFA with its collective consolidation strategy and investments in ESL and aseptic packaging.

The South —

The 14 Southeast states (Maryland to Florida and west to Arkansas) have 29% of the U.S. population. If you include Texas and Missouri crossover milk flows, we are talking about 37% of the U.S. population. 

The major players in the greater Southeast fluid milk market include DFA enlarged by its Dean purchases, Kroger supplied by Select and DFA, Prairie Farms with its own plants, DFA and Prairie Farms with joint ownership of Hiland Dairy plants, Publix supermarkets with its own plants, an uncertain future for four remaining Borden plants in the region as Borden has exited even the retail market in some of these states, and a handful of other fluid milk processors. 

In Texas, alone, DFA now owns or jointly owns a huge swath of the fluid milk processing plants, having purchased all Dean assets in the Lone Star State in the May 2020 bankruptcy sale and now positioned to gain joint ownership of all Borden Texas holdings through the announced sale to Hiland Dairy

The Midwest — 

Just looking at the greater Chicago, Milwaukee, Green Bay metropolis, the population totals are a lake-clustered 6% of U.S. population. Given the recent closure by Borden of the former Dean plants in Chemung, Illinois and De Pere, Wisconsin, this market is in flux with DFA owning various supply plants including a former Dean plant in Illinois and one in Iowa with Prairie Farms having purchased several of the Dean plants serving the region.

In the Mideast, there is Coca Cola with fairlife, Walmart and Kroger among the supermarkets with their own processing, and DFA owning two former Dean plants in Ohio, two in Indiana, two in Michigan, and a handful of other bottlers. 

In the West: DFA owns a former Dean plant in New Mexico, two in Colorado, two in Montana, one in Idaho, two in Utah, one in Nevada and one in California, as well as other plants, of course. 

The Northeast —

This brings us to the Northeast from Pennsylvania to Maine, where 18% of the U.S. population lives, and where consolidation of Class I markets, especially around the major Boston-NYC-Philadelphia metropolis have consolidated rapidly against the backdrop of declining fluid milk sales and a big push by non-dairy alternative beverage launches from former and current dairy processors.

DFA owns two former Dean plants in Massachusetts, one in New York, all four in Pennsylvania, one in New Jersey. The 2019 merger with St. Alban’s solidified additional New England fluid milk market under DFA. In 2013, DFA had purchased the Dairy Maid plant from the Rona family in Maryland; in 2014, the prominent Oakhurst plant in Maine; and in 2017, the Cumberland Dairy plant in South Jersey.

More recently, DFA struck a 2021 deal with Wakefern Foods to supply their Bowl and Basket and other milk, dairy, and non-dairy brands for the various supermarket chains and convenience stores under the Wakefern umbrella covering the greater New York City metropolis into New Jersey and eastern Pennsylvania. This milk had previously been supplied by independent farms, processed at Wakefern’s own iconic Readington Farms plant in North Jersey, which Wakefern subsequently closed in January 2022.

The long and twisted tale begs additional questions:

As Borden has dwindled in short order from 14 plants to five serving the most populous region of the U.S. – the Southland — what will happen with the remaining five plants in Ohio, Kentucky, Georgia, Louisiana, and Florida? What will become of Elsie the Cow and Borden’s iconic brands and new products?

What percentage of the “collectively consolidated” U.S. fluid milk market does DFA now completely or partially own and/or control?

Will the “collective consolidation” in the form of closures, sales and mergers continue to push shelf-stable ESL and aseptic milk into Class I retail markets and especially schools… and will consumers, especially kids, like this milk and drink it?

What role are rising energy prices, climate ESG-scoring and net-zero pledges and proclamations playing in the plant closures and shifts toward fewer school and retail milk deliveries, less refrigeration, more forward thrust for shelf-stable and lactose-free milk, as well as innovations into evermore non-dairy launches and so-called flexitarian blending and pairing?

Looking ahead at how not only governments around the world, but also corporations, creditors and investors are positioning for climate/carbon tracking, ESG scoring and the so-called Great Reset, the Net Zero economy, there’s little doubt that these factors are driving the direction of fluid milk “innovation” over the 12 years that DMI’s Innovation Center has coordinated the so-called ‘fluid milk revitalization’ initiative — at the same time developing the FARM program and the Net Zero Initiative.

The unloading of nine Borden plants in five months under Gregg Engles, the CEO of “New Borden” and former CEO of “Old Dean” is also not surprising. Engles is referred to in chronicles of dairy history not only as “the great consolidator” but also as “industry transformer.”

In addition to being CEO of Borden, Engles is chairman and managing partner of one of the two private equity investment firms that purchased the Borden assets in bankruptcy in June 2020. Investment firms fancy themselves at the forefront of ESG scoring.

Engles is also one of only two U.S. members of the Danone board of directors. Danone, owner of former Dean’s WhiteWave, including Silk plant-based and Horizon Organic milk, has positioned itself in the forefront on 2030 ESG goals, according to its 2019 ‘one planet, one health’ template that has also driven consolidation and market loss in the Northeast. 

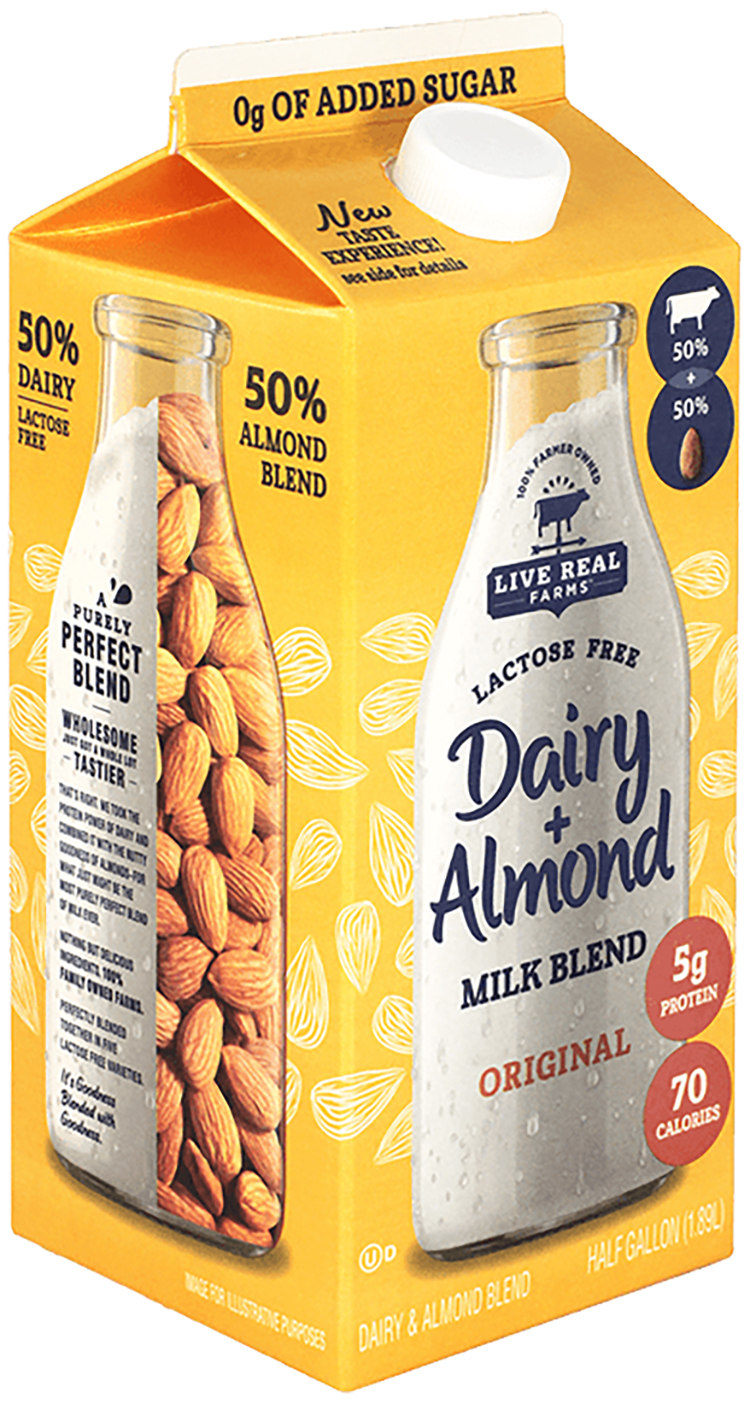
Not only is Danone dumping clusters of its Horizon milk-supplying organic family dairy farms, it continues to heavily invest in non-dairy processing, branding, launching and marketing of alternative lookalike dairy products and beverages, including Next Milk, Not Milk and Wondermilk. 

There is plenty of food-for-thought to chew on here from the positives to the negatives of innovation, consolidation, and climate ESGs hitting full-throttle in tandem. These issues require forward-looking discussion so dairy farmers in areas with substantial reliance on Class I fluid milk sales can navigate the road ahead and examine all lanes on this highway that appears to be leading to cow islands and milk deserts.

-30-

Dairy situation analysis: What’s up with milk production?

Record high milk growth vs. record high losses, dissected

By Sherry Bunting, both parts of a two-part series in Farmshine, July 2021

The dairy industry continues to wait for USDA to provide details on three areas of dairy assistance already approved by Congress or mentioned as “on the way” by Ag Secretary Tom Vilsack.

The fly in the ointment, however, is the record-high 2021 milk production (Table 1) and accelerated growth in cow numbers (Table 2) at a pace the recent USDA World Agriculture Supply and Demand Estimates (WASDE) expect to continue into 2022.

USDA is reportedly looking at production reports — up vs. year ago by 1.9% in March, 3.5% in April, 4.6% in May — to determine how to assist without adding fuel to expansion that could threaten late 2021 milk prices in the face of rising feed costs and a worsening western drought. (The latter two challenges could temper those forecasts in future WASDEs.)

May milk production a stunner

U.S. milk production totaled 19.9 billion pounds in May. This is a whopping 4.6% increase above 2020 and 2018 and a 4.1% increase over May 2019.

Let’s look at year-to-date. For the first five months of 2021, milk totaled 96 billion pounds, up 2.3% vs. the 93.8 billion pounds for Jan-May of 2020, and it is 4.4% greater than the 91.9 billion pounds of Jan-May milk produced in pre-pandemic 2018 and 2019. Of the four years, only 2020 had the extra production day as a Leap Year.

Milk per cow was up 3% over year ago in May. Compared with 2019, output per cow is up 2.2%, according to USDA.

Cow numbers vs. 2018 tell the story

Milk cows on U.S. dairies in May 2021 totaled 9.5 million head, up 145,000 from May 2020’s 9.36 million, up 172,000 from 2019’s 9.33 million, and up 83,000 head from 2018’s 9.42 million.

Counter to the national trend, Pennsylvania had 48,000 fewer milk cows than May 2018 — dropping 30,000 into 2019; 10,000 into 2020, and 8,000 into 2021.

Elsewhere in the Northeast and Southeast milksheds, among the 24 major monthly-reported states, New York had 4000 more milk cows in May 2021 than 2018, Vermont 8000 fewer. Georgia dropped 1000, Florida 12,000, and Virginia 11,000. In the Central states, Illinois was down 10,000 head.

The total decline in cow numbers for the 24 lesser quarterly-reported states, the collective loss in cow numbers is 59,000 head from May 2018 to May 2021

Accelerated growth is coming from three key areas where major new processing assets have been built or expanded.

In the Mideast, where the new Glanbia-DFA-Select plant became fully operational in Michigan this spring, there is a net gain of 32,000 cows for 2021 vs. 2018, Ohio’s cow numbers that had been declining 2018-19, began recovering in 2020-21. Indiana had 18 months of substantial growth, and Michigan returned to its growth pattern in 2020. Taken together, the Indiana-Ohio-Michigan region had a loss of 8,000 cows heading into 2020, but gained a whopping 40,000 cows over the past year.

In the Central Plains, where new plant capacity is starting up this spring and summer — Minnesota, South Dakota and Iowa, combined, added 40,000 cows May 2018 to May 2021.

In the Southern Plains, where joint-venture processing capacity continues to grow, Texas has continued full-steam-ahead, gaining 87,000 cows from 2018 to 2021, along with 29,000 added in Colorado and 17,000 in Kansas. New Mexico regained earlier losses to be 2000-head shy of 2018.

The growth patterns in these regions somewhat mirrored dairy exits from other areas — until Jan. 2020 (Table 2). The past 17 consecutive months of year-over-year increases in cow numbers leave the U.S. herd at its largest number in 26 years (1995).

However, the assumption that ‘dairy producers are okay because the industry is expanding’ ignores several essential factors. The playing field has become more complicated and inequitable. There are four main factors at play. We’ll look at them one at a time.

Ben Butler of South Florida posted this photo that went viral on Twitter April 2, 2020 of milk being dumped in Florida because there was no home for it. A few days later, he tweeted photos of milk gallons also being donated to Palm Beach County families in need. Challenges abound in the dairy supply chain. The unofficial tally of milk dumped in the Northeast and Mid-Atlantic region the first week of April 2020 was north of 200 loads, with additional reports of 130 loads dumped in the Southeast. Meanwhile, stores were not well stocked, most were limiting purchases and foodbanks were getting more requests as over 10 million people were newly out of work.

Factor #1 — Milk dumping and base programs 

A year ago in April and May 2020 — at the height of the Coronavirus pandemic disruptions — the dairy industry saw dumping of milk, stricter base programs and bigger milk check deductions. Producers culled cows, dried cows off early, changed their feeding programs, even fed milk in dairy rations.

But milk production still grew, according to the USDA data.

Some cooperatives and milk buyers, like Land O’Lakes, had base programs already in place and triggered them. Others made changes to prior programs or implemented new ones.

Dairy Farmers of America — the nation’s largest milk cooperative, largest North American dairy processor and third-ranked globally by Rabobank — quickly implemented a new base program in May 2020, seeking 10 to 15% in production cuts from members, varying by region, with overage priced on ‘market conditions.’

It is difficult to assess the ‘equity’ in these base programs and the cross-layers among producers between and within regions, or to know how these ‘bases’ are being handled presently. When questioned, spokespersons say base decisions are set by regional boards.

Meanwhile, product inventory and pricing schemes affect all regions, and milk rides between FMMOs in tankers and packages — with ease.

According to USDA, the 11 FMMOs dumped and diverted 541 million pounds of milk pooled as ‘other use’, priced at Class IV, during the first five months of 2020, of which 350 million pounds were in April alone. This is more than three times the ‘other use’ milk reported by FMMOs during the first five months of pre-pandemic 2019 (171.4 million pounds). By June, the amounts were double previous years.

Of this, the largest amount, by far, was the 181 million pounds of ‘other use’ milk in the Northeast FMMO 1 during Jan-May 2020, comprising one-third of all the dumped and diverted milk pooled across all 11 FMMOs in that 5-month period.

In the Southeast milkshed, the Appalachian, Florida and Southeast FMMOs 5, 6 and 7, together pooled 88 million pounds of ‘other use’ milk in the first five months of 2020. The Southwest FMMO 126 had 106.2 million pounds of ‘other use’ milk; Upper Midwest FMMO 30 had 46.1 million pounds; Central FMMO 32 had 36.7 million pounds; Mideast FMMO 33 had 30.7 million pounds; California FMMO 51 had 28.9 million pounds; Arizona FMMO 131 had 21.7 million pounds; and Pacific Northwest FMMO 124 had 1.3 million pounds.

The dumping had begun the last week of March 2020 and was heaviest in the month of April. Producers also saw deductions as high as $2/cwt. for balancing costs, lost quality premiums, and increased milk hauling costs. Unaccounted for, were the pounds of milk that had reportedly been dumped on farms without being pooled on FMMOs.

All of this against a backdrop of pandemic bottlenecks and record-high March-through-August imports of butter, butteroil, milkfat powder, and blends — adding to record-high U.S. butter inventories and contributing to the plunging Class IV, II and I prices vs. Class III (PPD).

Meanwhile, not only did production growth in key areas move ahead, so did strategic global partnerships. Just one puzzling example in October 2020, after eight months of deflated producer milk checks, depressed butterfat value, burdensome butter inventory, record butterfat imports, and a plunging Class IV milk price that contributed to negative producer price differential (PPD) losses, Land O’Lakes inked a deal to market and distribute cooking creams and cream cheeses — Class II and IV products that use butterfat — from New Zealand’s Fonterra into United States foodservice accounts.

The New Zealand press reports were gleeful, citing this as a big breakthrough that could be followed by other of their cheeses entering the “huge” U.S. foodservice market through the Land O’Lakes distribution.

Factor #2 — Class price wars and de-pooling

As reported in Farmshine last summer, dairy farmers found themselves in uncharted waters. As Class IV prices tumbled from the get-go with all of the ‘other use’ dumping and diverting, butter inventory building as butter/powder plants tried to keep up with diverted loads at a disruptive time, the USDA Food Box program started drawing products in the second half of May, and really got going by July 2020. 

Cheese, a Class III product, was a big Food Box winner. The cheese-driven Class III milk price rallied $7 to $10 above Class IV, and massive volumes of milk were de-pooled by Class III handlers, which has continued through May 2021.

Reviewing the class utilization reports, an estimated 80 billion pounds of Class III milk normally associated with FMMOs has been de-pooled over the past 26 months.

At the start of this ‘inequitable’ situation, academic webinars sought to explain it.

“We’re seeing milk class wars,” said economist Dan Basse of AgResource Company, a domestic and international ag research firm in Chicago, during a PDPW Dairy Signal webinar a year ago. 

He noted that under the current four-class pricing system, and the new way of calculating the Class I Mover, dairy farmers found themselves “living on the edge, not knowing what the PPD (Producer Price Differential) will be” (and wondering where that market revenue goes).

“A $7.00 per hundredweight discount is a lot of capital, a lot of income and a lot of margin to lose with no way to hedge for it, no way to protect it, when the losses are not being made up at home as reflected in the PPD,” Basse said in that summer 2020 webinar.

What does this have to do with year-over-year milk production comparisons?

Two words: Winners. Losers. 

Some handlers, and producers won, others lost — between and within regions.

Here’s why all of this matters from a production comparison standpoint: Dairy economists — Dr. Mark Stephenson, University of Wisconsin, and Dr. Marin Bozic, University of Minnesota — are both on record acknowledging that USDA NASS uses FMMO settlement data, along with producer surveys, to benchmark monthly milk production.

So, on the one hand: How accurate are these data for comparison over the past 26 months, given the inconsistent FMMO data from dumping, diverting and de-pooling? 

On the other hand: Did the negative PPDs and de-pooling, resulting in part from the 2018 Farm Bill change in the Class I Mover, allow Class III handlers to capture all of that additional market value and use it to fuel the 2020-21 accelerated milk growth for regions and entities connected to the new Class III processing assets?

Factor #3 — New dual-processing concentrates growth

Accelerated growth in cow numbers is fueling record production in 2021. It is patterned around ‘waves’ of major new processing investments in some areas, while other areas — largely fluid milk regions — are withering on the vine or growing by smaller margins with fewer cows. 

In the 24 major milk states, production growth was even greater than the All-U.S. total — up 4.9% vs. year ago. In part one, the breakdown was shown vs. 2018.

Here’s the breakdown for just the 12 months from May 2020 to May 2021 — a time in which the industry dealt divergences that created steep losses for some and big gains for others, while FMMOs became dysfunctional. 

In just one year, over 40,000 cows were added in Indiana, Ohio, and Michigan, combined, and milk production was up in May 2021 by 12.6, 3.2 and 5.1%, respectively. The draw is the massive new Glanbia-DFA-Select joint-venture cheese and ingredient plant that began operations late last year in St. Johns, Michigan. Sources indicate it reached full capacity this spring. Add to this the 2018 Walmart fluid milk plant in Fort Wayne, Indiana and other expansions in Ohio and Michigan.

Ditto for the Central Plains, where new cheese and ingredient line capacity became operational this spring and summer. Supplying these investments, Minnesota grew production 6%, South Dakota 14.6%, and Iowa 6.2% over year ago. 

Number two Wisconsin grew by 5.6% in May 2021 vs. year ago.

Milk production was up 5% in number one California, even though cow numbers were down by 1000 head, and dairy farmers in a referendum voted recently by a slim margin to keep their quota system. They are also dealing with a devastating drought that news reports indicate is now impacting both the dairies and the almond growers.

Then there’s Texas, where growth continues to be a double-digit steamroller, up 10.8% in May 2021 vs. 2020 — pushing New York (up 4.2%) to fifth rank. 

The Southern Plains has had several strategic investments, starting in Texas and New Mexico (up 6% vs. year ago).

In Colorado, where production was up 5.3% in May, DFA’s joint ventures and strategic partnerships with Leprino, Kroger and others have fueled growth.

Kansas grew milk production 7.3% vs. year ago. In 2018, a state-of-the-art whole milk powder and ingredient plant became fully operational in Garden City, Kansas. The plant was to be a joint-venture between DFA and the Chinese company Yili but ended up as a joint-venture between DFA and 12 of its member farms that are among the 21 Kansas dairies shipping milk to it.

DFA’s Ed Gallagher gave some insights on this during a May 2021 Hoards webinar. He said, “We went through a period of investing in powder plants in the U.S. It seems like there is a follow-the-leader approach when deciding on investments, and it goes in waves. The industry just completed a wave of a lot of investment in Class IV manufacturing plants, and now… it’s flipping to Class III.”

Looking back on the Class IV ‘wave’ 2013 through 2018, there were several times in those years that Class IV beat Class III, leading to FMMO de-pooling, but not to the extreme extent seen in the past 12 months as Class III now beats all other classes, including Class I, leading to negative producer price differentials (PPDs).

Gallagher sees Class III and IV prices “coming together” in the “next period of years” because the ‘wave’ of capacity investment has flipped from Class IV to III. He predicted more Class III capacity will be added.

Are these past 26 months of PPD net losses for producers the industry’s answer to, in effect, increasing processor ‘make allowances’ without a hearing?

The average PPD value loss (see chart) across the seven multiple component pricing FMMOs was $2.57 per hundredweight for 26 months, which began with implementation of the new Class I pricing method May 2019 through the most recent uniform price announcements for June 2021 milk. 

Applying a conservative 5-year average PPD (prior to Class I change) for each FMMO, only the few gray blocks on the chart represent ‘normal.’

This means even positive-PPDs show margin loss for farm milk pooled on FMMOs. In fact, the CME futures markets as of July 14 show August through December divergence between Class III and IV above the $1.48 mark, indicating Class I value loss and negative PPDs or smaller positive PPDs could return after barely a two-month reprieve.

Many handlers that don’t pool on FMMOs also use the uniform prices as a benchmark.

This $2.57 net loss for seven MCP FMMOs across 26 months represents almost a doubling of the current make allowance levels.

Current USDA make allowances and yield factors add up to a processor credit of $3.17 per hundredweight on Class III and $2.17 on Class IV. This already represents 11 to 25% of farm milk value, according to 2018 analysis by John Newton, when he was Farm Bureau’s chief economist.

Why is this important? Because we are already seeing additional margin transfer from Class I to Class IV as the industry moves to blended beverages that mostly use ultrafiltered (UF) milk solids. Blends using whey would fall under Class III.

Looking ahead, DFA now owns most of the former Dean Foods’ Class I fluid milk plants since May 2020. New manufacturing synergies are undeniable, considering the direction of dairy checkoff’s fluid milk revitalization plan emphasizing these dairy-based-and-blended beverages and ‘dual-purpose’ processing facilities. 

Dairy + Almond is a Live Real Farms beverage made by DFA and was launched through DMI’s Innovation Center with checkoff funds paid by all dairy farmers. The milk in this beverage is not priced as Class I, though it competes in the dairy case and is being promoted as a “Purely Perfect Blend.”

As low-fat UF milk solids are blended with other ingredients in a manufacturing process to make new combined beverages, the result is a competing beverage, and the milk in the beverage drops from Class I to Class IV.

Meanwhile, these beverages cost more at the grocery store, and the ingredients are not part of the USDA end-product pricing ‘circle’. Therefore, no new make allowances should be requested because processors are already getting a reduced class value, and a higher margin.

DMI’ vice president of global innovation partnerships, Paul Ziemnisky, gave some insights into this “future of dairy beverages” — and how it ties into new processing plants investments during the virtual Pennsylvania Dairy Summit in February.

Ziemnisky went so far as to say new processing facilities will “need to be built as beverage plants able to handle all kinds of ingredients” for the blended products of the future. In essence, he said, the future of fluid milk is “dual purpose” processing plants.

DMI’s usdairy.com website touts the checkoff launches of ‘blended’ dairy-‘based’ beverages — key to DMI’s fluid milk revitalization plan. Not flavorings, these blends dilute milk out of Class I, the highest farm-level pricing, and mainly into Class IV, the lowest. The resulting beverages compete in the dairy cooler with Class I fluid milk. Screen view

While 11 of the top 24 states had milk production increases of 5% or more in May, the 13 states with increases below 5%, or negative, are mainly located within traditional Class I fluid milk marketing areas: Florida, up 0.5%, Georgia up 2%, Virginia down 2.3%, Illinois up 1.9%, Arizona, down 0.5%, Washington, down 0.9%, Pennsylvania and Vermont both up 1.8%, and New York up 4.2%. 

Idaho and Utah, up 2% and unchanged, are outliers and largely unregulated by FMMOs. Some beverage assets are coming to that region in the form of ultra-filtration and aseptic packaging, including a plant renovation to make Darigold’s FIT beverage. Additionally, a new Fairlife filtration membrane plant was opened near Phoenix, Arizona in March, and Kroger is doing filtration and aseptic packaging in Colorado.

Meanwhile, Pennsylvania is often described as a ‘fluid milk state’ with a Milk Marketing Board setting minimum prices for fluid milk, and a string of independent milk bottlers that figure prominently in their communities.

Ranked fourth in milk production in 2006, Pennsylvania was passed by Idaho in 2007. By 2016, Michigan had pushed Pennsylvania to sixth. The very next year, in 2017, Texas leapfrogged both Pennsylvania and Michigan. Now, Minnesota has pushed the Keystone State to eighth.

How does the future of dairy affect traditionally ‘fluid milk’ states like Pennsylvania, or the Southeast for that matter?

New dairy-‘based’ beverage innovations can be made anywhere and delivered anywhere, often as shelf-stable products. Most are not Class I products unless they meet the strict FMMO definition which was last spelled out in the USDA AMS 2010 final rule. 

For now, this also includes the Pa. Milk Marketing Board. Executive secretary Carol Hardbarger confirms that the 50/50 drinks are not regulated under PMMB, which generally uses federal classification, but that a legal interpretation of the Milk Marketing Law with regard to blends may be in order.

The 50/50 blends are already in some Pennsylvania stores and elsewhere in the Northeast, which is the second phase of the ‘undeniably, purely perfect’ marketing plan for fluid milk revitalization.

Factor #4 — USDA, industry coalesce around climate

Ag Secretary Tom Vilsack has been outspoken from the outset about using and aiming every available USDA program dollar in a way that also addresses the Biden administration’s strategies for equity, supply chain resiliency, and climate action.

Speculating a bit as to why USDA is taking so long to announce details about already funded dairy assistance, it could be that Sec. Vilsack is looking at the fit for ‘climate impact.’

Paid around a million a year in dairy checkoff funds to serve 4 four years as CEO of the U.S. Dairy Export Council — between prior and current Ag Secretary posts — Vilsack understands the future plans of the dairy industry’s checkoff-funded proprietary precompetitive alliances on a global scale. 

Vilsack has been privy to the DMI Innovation Center’s discussions of fluid milk revitalization through ‘dual purpose’ plants and blended beverages. He is no doubt looking at the accelerating growth in milk production that is occurring right now for ways to tie dairy assistance to measured climate impacts in the net-zero file.

Producers on the coasts and fringes of identified growth areas have a target — fresh fluid milk and other dairy products produced in regional food systems for consumers who have a renewed zeal for ‘local.’ Fresh fluid milk will have to find a path outside of the consolidating system and cut through the global climate-marketing to directly communicate fresh, local, sustainable messages about a region’s farms, animals, environments, businesses, economies, jobs and community fabric.

-30-