
By Sherry Bunting, Farmshine, August 26, 2022
WASHINGTON — Against the backdrop of declining fluid milk sales, declining Federal Milk Marketing Order (FMMO) participation, coinciding with the accelerated pace of plant mergers, acquisitions and closures in the fluid milk sector, farm bill milk pricing reform discussions are bubbling up.
The two main issues are the negative impact from the Class I price formula change in the last farm bill, and how to ‘fix it,’ as well as how to handle or update processor ‘make allowances’ that are embedded within the Class III and IV price formulas.
Other issues are also surfacing regarding the pricing, marketing, and contracting of milk within and outside of FMMOs as historical pricing relationships become more dysfunctional — in part because of the Class I change.
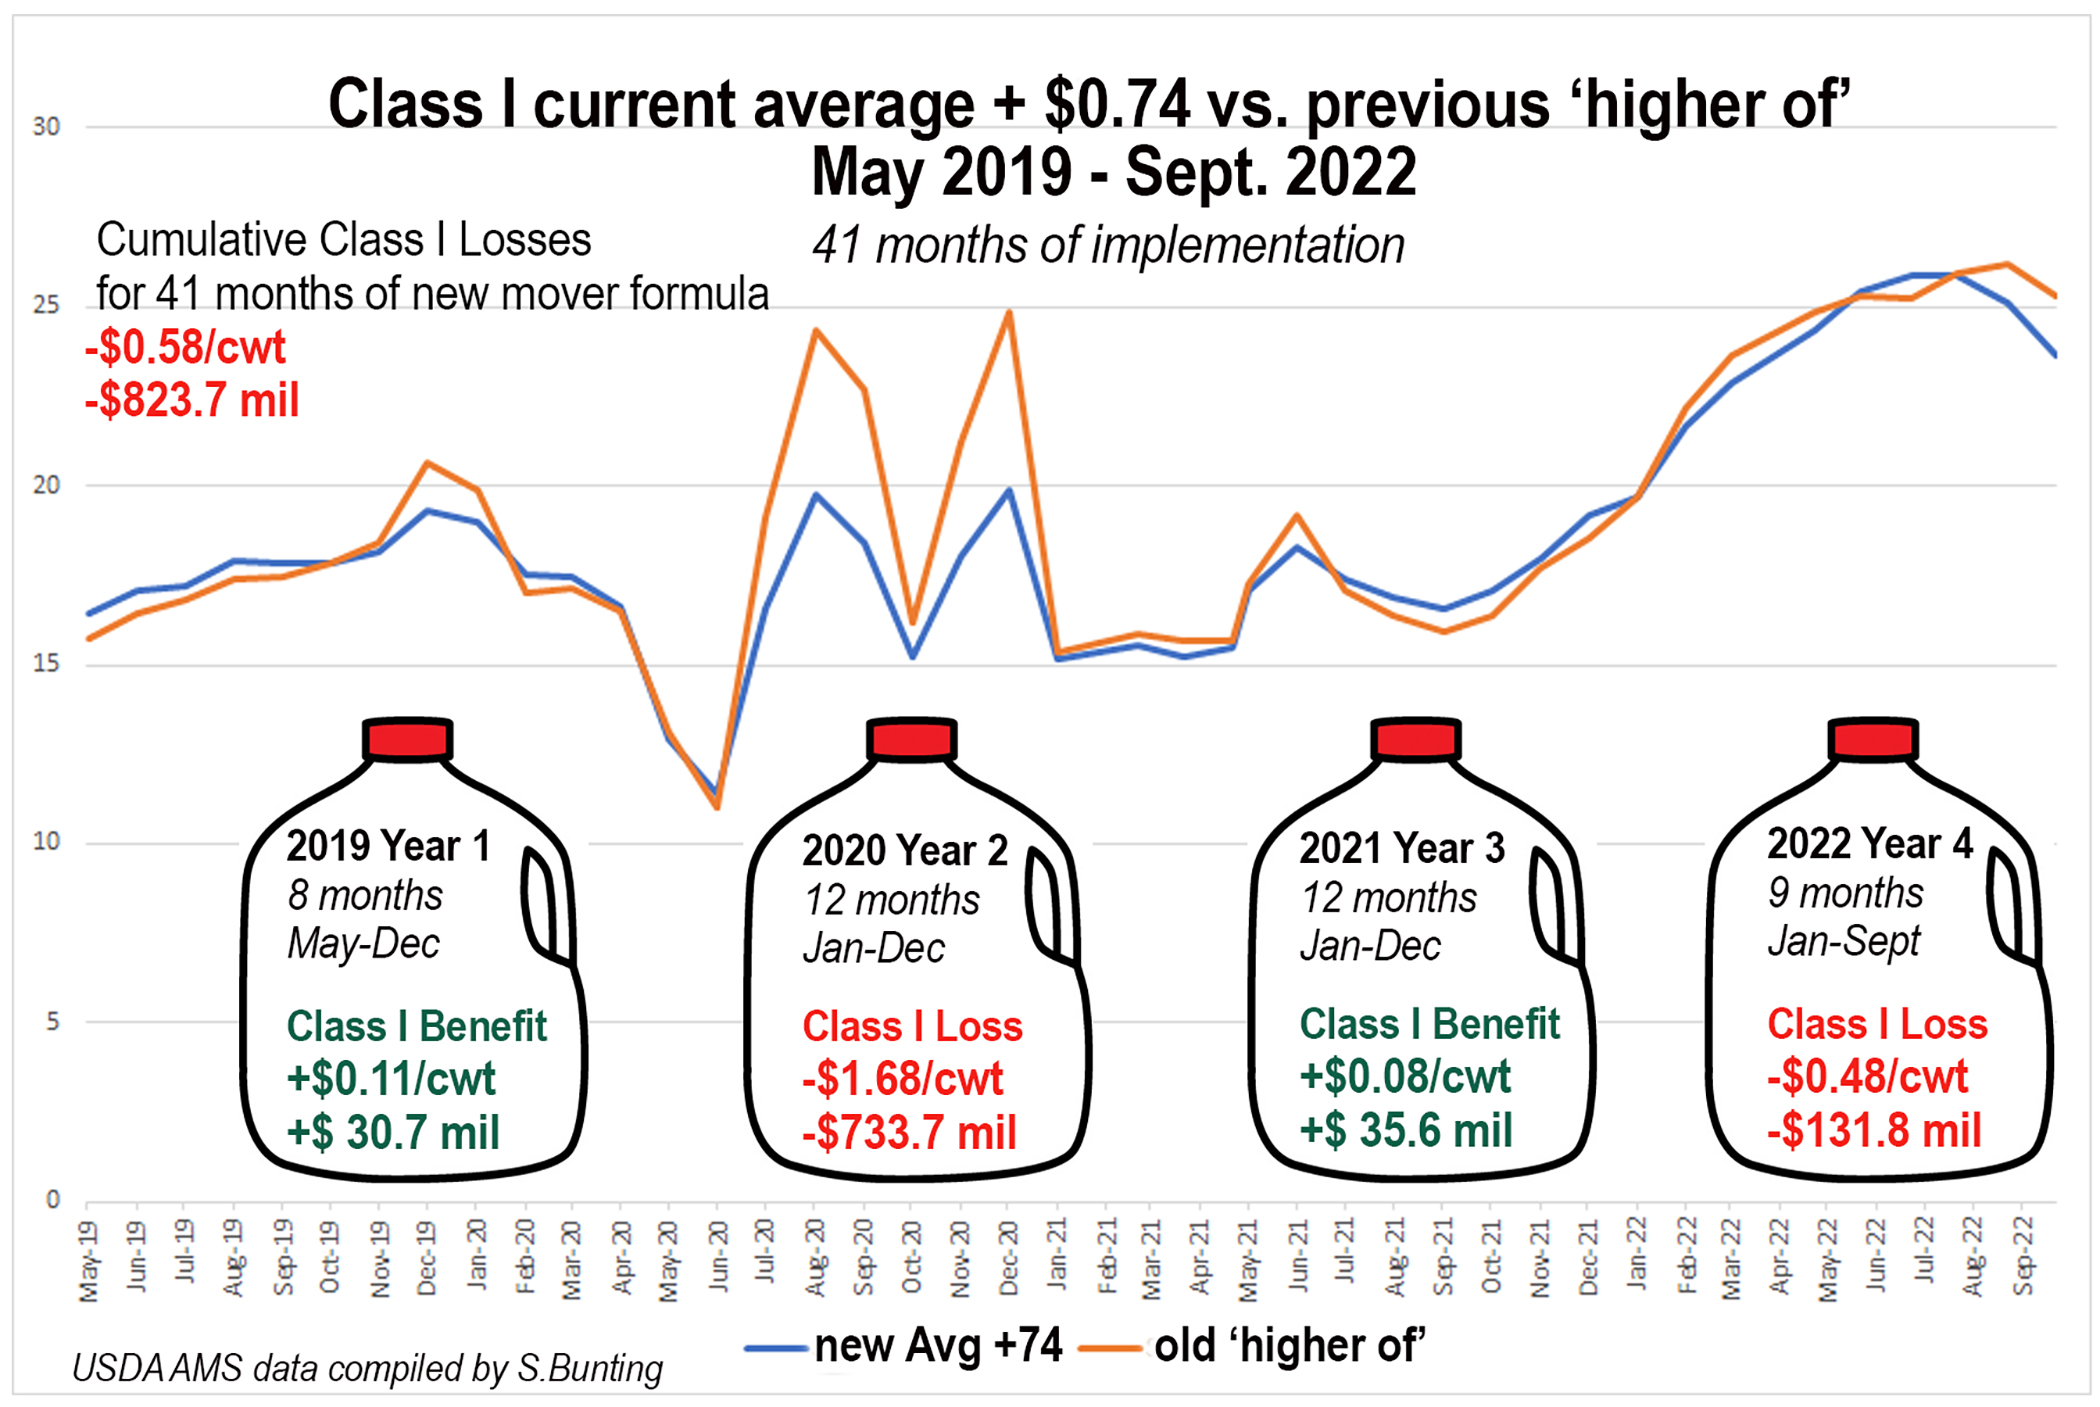
The change in the Class I price mover formula was made in the 2018 farm bill and implemented in May 2019. It has cost dairy farmers an estimated $132 million in lost revenue so far in 2022 — increasing the accumulated net loss to $824 million over these 41 months that the new average-plus-74-cents method has replaced 19 years of using the vetted ‘higher of’ formula.
The change was made by Congress in the last farm bill in the belief that this averaging method would allow processors, retailers and non-traditional milk beverage companies to manage their price risk through hedging while expecting the change to be revenue-neutral to farmers. No hearings or referendums were conducted for this change.
Instead of being revenue-neutral for farmers, the new method has significantly shaved off the tops of the price peaks (graph) and only minimally softened the depth of the price valleys, while returning net lower proceeds to farmers and disrupting pricing relationships to cause further farm mailbox milk check losses in reduced or negative producer price differentials (PPD), reduced FMMO participation (de-pooling) as well as disruption in the way purchased price risk management tools perform against these losses.
In 2022, we are seeing this Class I ‘averaging’ method produce even more concerning results. It is now undervaluing Class I in a way that increases the depth of the valley the milk markets have entered in the past few months (graph), and as the Class IV milk price turned substantially higher this week against a flat-to-lower Class III price, the extent of the market improvement will be shaved in the blend price by the impact on Class I from what is now a $2 to $5 gap between Class III and Class IV milk futures through at least November.
During the height of the Covid pandemic in 2020, the most glaring flaw in the Class I formula change was revealed. Tracking the gains and losses over these 41 months, it’s easy to see the problem. This new formula puts a 74-cents-per-cwt ceiling on how much farmers can benefit from the change, but it fails to put a floor on how much farmers can lose from the change.
The bottomless pit was sorely tested in the second half of 2020, when the Class III and IV prices diverged by as much as $10, creating Class I value losses under the new formula as high as $5.00/cwt.
The bottomless pit is being tested again in 2022. The most recent Class I mover announcements for August and September are undervalued by $1.04 and $1.69, respectively, as Class IV and III have diverged by as much as $4 this year.
In fact, 6 of the first 9 months of 2022 have had a lower Class I milk price as compared to the previous formula. The September 2022 advance Class I mover announced at $23.82 last week would have been $25.31 under the previous ‘higher of’ formula.
This is the largest loss in value between the two methods since December 2020, when pandemic disruptions and government cheese purchases were blamed for the poor functionality of the new Class I formula.
No such blame can be attributed for the 2022 mover price failure that will have cost farmers $132 million in the first 9 months of 2022 on Class I value, alone, as well as leading to further impacts from reduced or negative PPDs and de-pooling.
The graph tells the story. The pandemic was blamed for 2020’s largest annual formula-based loss of $733 million. This came out to an average loss of $1.68/cwt on all Class I milk shipped in 2020.
These losses continued into the first half of 2021, followed by six months of gains. In 2021, the net gain for the year was $35 million, or 8 cents/cwt., making only a small dent in recovering those prior losses.
Gains from the averaging formula were expected to continue into 2022, but instead, Class IV diverged higher than Class III in most months by more than the $1.48 threshold. Only 2 months in 2022 have shown modest Class I mover gains under the new formula, with the other 7 months racking up increasingly significant value losses – a situation that is expected to continue at least until November, based on current futures markets.
Bottomline, the months of limited gains are not capable of making up for the months of limitless loss, and now the hole is being dug deeper.
True, USDA made pandemic volatility payments to account for some of the 2020 FMMO class price relationship losses. Those payments were calculated by AMS staff working with milk co-ops and handlers using FMMO payment data.
However, USDA only intended to cover up to $350 million of what are now $824 million in cumulative losses attributed directly to the formula change.
Furthermore, USDA capped the amount of compensation an individual farm could receive, even though there was no cap on the amount the new formula may have cost that farm, especially if it led to reduced or negative PPDs, de-pooling, and as a result, negatively impacted the performance price risk management tools the farm may have purchased.
The estimated $824 million net loss over 41 months equates to an estimated average of 58 cents/cwt loss on every hundredweight of Class I milk shipped in those 41 months.
Using the national average FMMO Class I utilization of 28%, this value loss translates to an average loss to the blend price of 16 cents/cwt for all milk shipped over the 41 months, but some FMMOs have seen steeper impacts where Class I utilization is greater.
This 16-cent average impact on blend price may not sound like much, but over a 41-month period it has hit mailbox milk prices in large chunks of losses and smaller pieces of gains, which impact cash flow and performance of risk management in a domino effect.
The 2022 divergence has been different from 2020 because this year it is Class IV that has been higher than Class III. During the pandemic, it was the other way around.
Because cheese milk is such a driver of dairy sales nationwide, the FMMO class and component pricing is set up so that protein is paid to farmers in the first advance check based on the higher method for valuation of protein in Class III. Meanwhile, other class processors pay into the pool using a lower protein valuation method, so the differences are adjusted based on utilization in the second monthly milk check.
This means when Class III is substantially higher than Class IV, as was the case in 2020-21, there is even more incentive for manufacturers to de-pool milk out of FMMOs compared to when Class IV is higher than Class III.
The PPD, in fact, is defined mathematically as Class III price minus the FMMO statistical uniform blend. Usually that number is positive. In the last half of 2020 and first half of 2021, it was negative for all 7 multiple component pricing FMMOs, while the 4 fat/skim Orders saw skim price eroded by the variance.
Now, the situation is different because Class III has been the lowest priced class in all but one month so far in 2022. The milk being de-pooled — significantly in some orders and less so in others — is the higher-priced Class II and IV milk. The Class II price has surpassed the Class I mover in every settled month of 2022 so far — January through July — and the Class IV price also surpassed the Class I mover in 2 of those 7 months.
-30-
