

By Sherry Bunting, Farmshine Weekly Column
Carrot… and stick?
Opening the Feb. 14th House Ag Committee hearing with USDA Secretary Tom Vilsack, Committee Chairman G.T. Thompson of Pennsylvania said the clear message he has heard as he has traveled across the country on farm bill listening sessions is that, “Agriculture needs government to work for them, not against them.”
Vilsack was pressed at least 8 times by 8 different members of the Committee for clarity and details on the Climate Smart deal. Representatives wanted an update on how the billions of dollars in Inflation Reduction Act (IRA) funds for conservation programs and Climate Smart Partnerships are making it directly to farmers.
Rep. Mary Miller of Illinois went so far to say the climate cult is a scam and pointed to what is happening in Europe, airing her concerns about incentives for solar panels on good farmland pricing farms out of rented acres. She expressed concern about getting farmers reliant on “environmental payments” instead of a food system that allows farms to succeed producing food, and she wondered about being beholden to the global climate-cult, which means (I’m paraphrasing) she is concerned about the stick that follows the climate-smart carrot.
While the purpose of these conservation and Climate-Smart IRA funds, said Vilsack, is to ‘get money to farmers,’ his update acknowledged that, “There’s a lot of work to do. We’re assisting and guiding (farmers) into participating,” he said.
“We’ve increased the number of people working at NRCS (1500 new hires, total 4000 new hires planned). We’ve entered into cooperative agreements so we have a broader reach (hire estimated 3000 technical staff through conservation partners), so that those who might not be able to understand that they qualify for the program are finding out,” Vilsack explained, noting that this is necessary in order to actually implement the Inflation Reduction Act.
(Translation: Money hasn’t gone directly to farmers so much as it has gone to program infrastructure, such as more USDA staff, partnership staff, and developing the herding routines to get farmers ‘guided’ on board for Climate Smart data collection and monitoring. In contrast, the IRA funds going to traditional and oversubscribed conservation program EQIP have largely been obligated to farmers at this point.)
“Roughly 85 to 88% of farmers in this country today require off farm income to be able to keep the farm. It’s about people who love what they’re doing and frankly want to do more of it, but they don’t have the income streams to support it, so they have to have an off farm job,” said Vilsack, defending the deal.
“To me, the key here is to create opportunities for that farm to generate more revenue,” he added.
Rep. Marie Gluesenkamp Perez of Washington State made the point that, “Farmers should not have to rely on value added ventures to survive, like agro-tourism or solar panel installations. These are ventures in their own right and should not be necessary for farmers to continue and pass on their farms to the next generation,” she said.
Rep. Doug LaMalfa of California pushed the point that farmers like the traditional conservation programs, like EQIP, but the IRA-funded Climate-Smart Partnerships deal for “tying up carbon is going to require them to jump through hoops,” he said, noting that no-till and cover crops aren’t possible on some types of farms, like rice production.
Vilsack countered: “It’s voluntary. It gives us the opportunity to figure out what works and what doesn’t work, and it doesn’t necessarily put people at a competitive disadvantage.”
He maintains that these projects “do not require farms to go through hoops and in some cases, it’s actually paying them for what they’re already doing.
“The idea here is to measure, monitor and verify the results so that we know what works and what doesn’t work, so that we don’t invest in what doesn’t work,” said Vilsack.
Congresswoman Abigail Spanberger of Virginia gave the example of a farmer in her district doing no-till and cover crops. Vilsack nodded and replied: “There is an opportunity, potentially, for that farm to qualify for ecosystem market payments. So, now, instead of just a crop, they’re going to get an environmental payment.”
That’s the carrot, where are they hiding the stick?
40% decline and a loss of 15,866 dairy farms in 5 years.
The number of dairy farms in the U.S. declined by 40%. That’s 4 in 10 dairies lost over 5 years. The 2022 Census of Agriculture Report released Tues., Feb. 13 held a bit of a surprise not seen on available summaries. Clicking through the ‘quick stats’, we learn that the number of dairy farms with milk sales on December 31, 2022 totaled 24,082, and the number of farms with milk sales but no milk cows or calves in inventory at the end of 2022 was 388 for a total 24,470 dairy farms with milk sales in the U.S. at the end of 2022.
It’s also 3,462 fewer dairy farms than the 27,932 licensed dairies reported as an average number for 2022 last February as part of the January 2023 milk production report.
(Note: The 2023 annual average dairy data that was included in the January 2024 Monthly Milk Production Report Feb. 21 pegged the average number of licensed dairies in the U.S. in 2023 at 26,290, down 6% from the annual report filed for 2022. The Census and NASS Milk Production Reports count some types of multi-site dairies under the same ownership differently. By the way, USDA revised the entire 2023 year of production lower yet for the fourth time, now revising 11 of the 12 months of prior data reported for milk production, cattle numbers, and output per cow. We questioned the figures all last year, asking where the cattle were coming from, pointing to cattle inventory numbers on heifer replacements a year ago indicating a shortage of freshening 2-year-olds, etc., and pointing to the substantial increase in Whole Milk Powder Imports into the U.S. and other factors USDA may have left unaccounted for in prior estimations.)
In Pennsylvania, dairy farm numbers declined from 6,914 on Dec. 31, 2017 to 4,027 on Dec. 31, 2022, that’s a 42% decline over 5 years. It’s also 973 short of the average number of licensed dairies reported by USDA NASS for the 2022 year.
The 2022 Census of Ag also shows that of the 24,470 farms with milk sales, 3,439 accounted for 59% of milk sales and 1012 accounted for 46%. This compares with the 2017 Census, which reported 3819 farms accounted for 55% of milk sales and 793 farms accounted for 43%.
We will dig into the national and state by state 2022 Census data relative to dairy in a future report.
In agriculture, overall, the 2022 Census of Ag shows a loss of 142,000 farms (down 7%) and a loss 20 million farm acres (down 3%) in the past 5 years.
Between 2017 and 2022, the number of U.S. agricultural producers held steady at 3.4 million, while the number of farms continued to decline at 1.9 million covering 880.1 million acres that generated food, fiber and fuel. Average age of farmers was up at 58 years. But the number of beginning farmers (over 1 million), increased also, according to the Report.
The number of small and mid-sized farms across all commodities declined between 2017 and 2022. Large (sales $1-5 million) and very large farms (sales of $5 million or more) increased in number. The 105,384 farms in those top two categories (sales of $1 million or more) represented fewer than 6% of all U.S. farms and sold more than 75% of all agricultural products. The largest farming operations and a small number of states accounted for the majority of agricultural production and sales.
The overall value of agricultural production and income increased between 2017 and 2022, according to the Ag Census. 2022 was a high year in agricultural price cycles, and government payments were still part of the economic calculus through prior CFAP and Pandemic Assistance. Milk made it into the top 5 commodities (at No. 5). Combined, the top 5 — accounted for two-thirds of the value of all agricultural production.
The value of crop production was $281 billion, up 45% in 2022 vs. 2017, while the value of livestock production (including dairy) was $262 billion, up 35% over the same period.
Shrinkflation this, shrinkflation that
The January Consumer Price Index (CPI) released Tues., Feb. 13 increased 0.3% on a seasonally adjusted basis. Over the last 12 months, the all items index increased 3.1% before seasonal adjustment. The food index, up 0.4% in January, increased 2.6% over the last 12 months. The food at home index was up 0.4% in January, and up 1.2% over 12 months, while the food away from home index rose 0.5% over the month and 5.1% over 12 months. The dairy and related products index is up 0.2% in January, down 1.1% over 12 months.
In contrast, the energy index fell 0.9% over the month, down 4.6% on the year due mainly to the decline in the gasoline index.
The Biden Administration announced intentions to investigate supermarkets for over-charging as the food index has not followed energy lower. What further complicates the food inflation indexes is that food commodities like milk and eggs have moderated while processed consumer packaged goods continue to inflate.
Another ripple is captured in the new term coined by food, ag, and business analysts — “shrinkflation” — meaning smaller packages, same price.
For farmers, shrinkflation is a good way to describe what is happening to milk margins. Yes the central feed and energy costs are moderating, but many other fixed and adjustable costs — from interest rates and insurance to supplies and services — continue to move higher, shrinkflating profit margins.
Meanwhile, the Census of Ag data showed big gains for farm revenue and net income in 2022 vs. 2017, but this unique comparison does not factor in the margin-squeeze in 2023, nor the impact of losing the last of the CFAP and Covid pandemic assistance payments that were still trickling into 2022.
In the dairy sector, the milk markets send mixed messages as the Class IV milk price sits $4 above Class III, with cheese being the market dog for the past 12 months. Yet milk is not moving from Class III manufacturing (cheese/whey) to Class IV (butter/powder). Why? New Class III manufacturing capacity has come online and will continue, needing to run full to turn a profit.
At the recent Pennsylvania Dairy Summit in a presentation about navigating the future, Phil Plourde of Ever.Ag highlighted the critical importance of exports to the industry. “Export or perish!” he said, focusing the admonition on the opportunities to export more cheese, including mozzarella.
IDFA CEO Michael Dykes in a presentation in January, issued the challenge to producers to fill the production gap that $7 billion in planned processing investments will bring online in the next three to five years.
Meanwhile, U.S. dairy farmers are seeing price pressure from a buildup of cheese via lackluster exports suffering from what are seen as inadequate trade policies and lack of new trade agreements.
Reflecting on the recently concluded FMMO hearing of 21 milk pricing proposals — some of which seek to reduce regulated minimum milk prices — we see processors are focused on a shrinkflated milk pricing system, shrink prices and inflate capacity because growth has got to happen.
They say USDA sets the regulated minimum prices too high, which must be reduced to ‘market clearing’ levels so they can have the freedom and band width to then be able to pay market premiums to their farmers.
On the eve of the Pennsylvania Dairy Summit Feb. 6, Cornell economist Dr. Chris Wolf talked about the recent FMMO hearing, noting that, “Regulated minimum prices are the whole deal right now. Premiums are gone.”
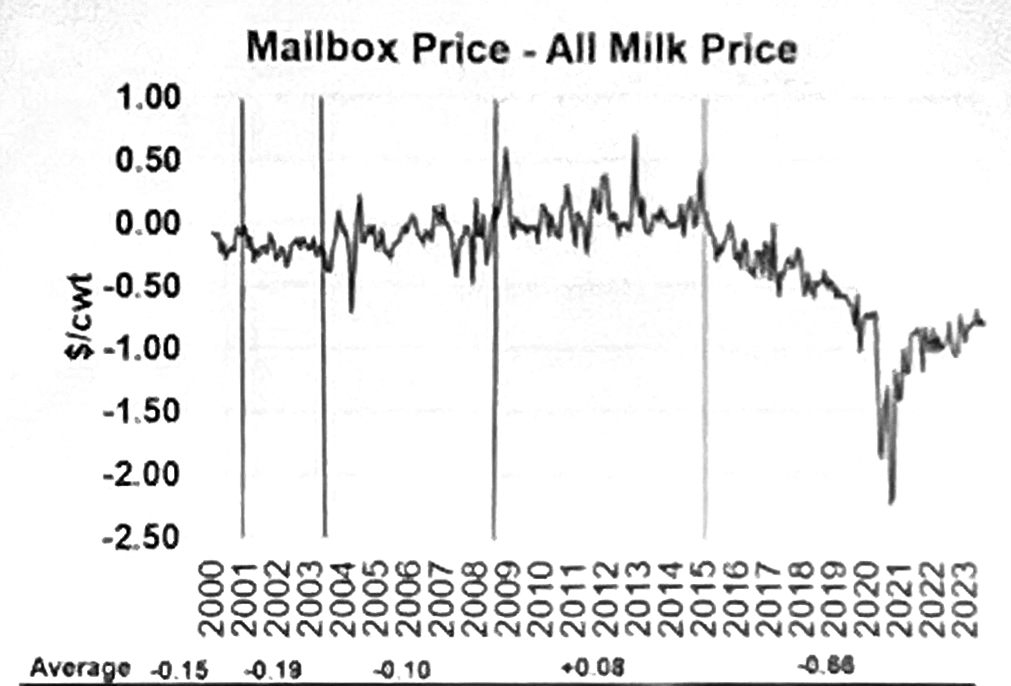
He showed charts tracking the difference between the All Milk price and Mailbox price (above), progressively negative since 2015, reflecting higher transportation costs and evaporation of over-order premiums, not to mention milk check assessments, marketing adjustments, balancing fees.
If regulated minimum prices are reduced, will processors voluntarily fill that gap by paying more premiums so producers have the financial wherewithal to fill the production gap?
Things are pretty bad for farmers right now in the milk markets that are based on cheese, where capacity has ramped up in the Central U.S., and where tough discussions are being had around kitchen tables about operating margins and the future.
Milk futures move lower
Milk futures were unevenly lower this week, with most of the downward pressure on first-half 2024 contracts for both Class III and IV milk. The spread between Class III and IV milk — according to this week’s CME futures markets continues to be range between $2.20 and $4.00 per cwt in every single month of 2024, well above the $1.48 mark where the ‘averaging’ formula is a loser for orderly marketing compared with the ‘higher of.’ On the close Wed., Feb. 14, Class III milk futures for the next 12 months averaged $17.91, down 10 cents from the previous Wednesday. Class IV milk contracts average was $20.57 — down 7 cents.
Back on the see-saw
The daily CME spot market for dairy products was mixed and mostly lower this week, except dry whey was higher and barrel cheese fully steady. Spot butter was pegged at $2.7175/lb, down a nickel from a week ago with zero loads trading. Grade A nonfat dry milk was $1.18/lb, down 4 cents with a single load changing hands. On the Class III side, 40-lb block Cheddar gave up 7 cents in Wednesday’s session, alone, when declining bids with no trades left the spot price pegged at $1.5150/lb, down 11 cents from the previous week. Barrel trade had moved higher earlier in the week, but a 2-penny loss Wednesday left the spot price firm on the week at $1.5750/lb with 2 loads trading. Dry whey at 52 cents/lb was 3 cents higher than a week ago with no trades.
-30-
