
Industry trends explored at Georgia Dairy Conference
By Sherry Bunting, published in Farmshine, Feb. 11, 2022
SAVANNAH, Ga. – “Everything is going up, and quickly. Class IV is driving milk prices, with good demand for both butter and powder, especially for exporting,” said Calvin Covington as he presented the Southeast dairy outlook during the 2022 Georgia Dairy Conference, attended by around 300 dairy producers and industry members in Savannah in January.
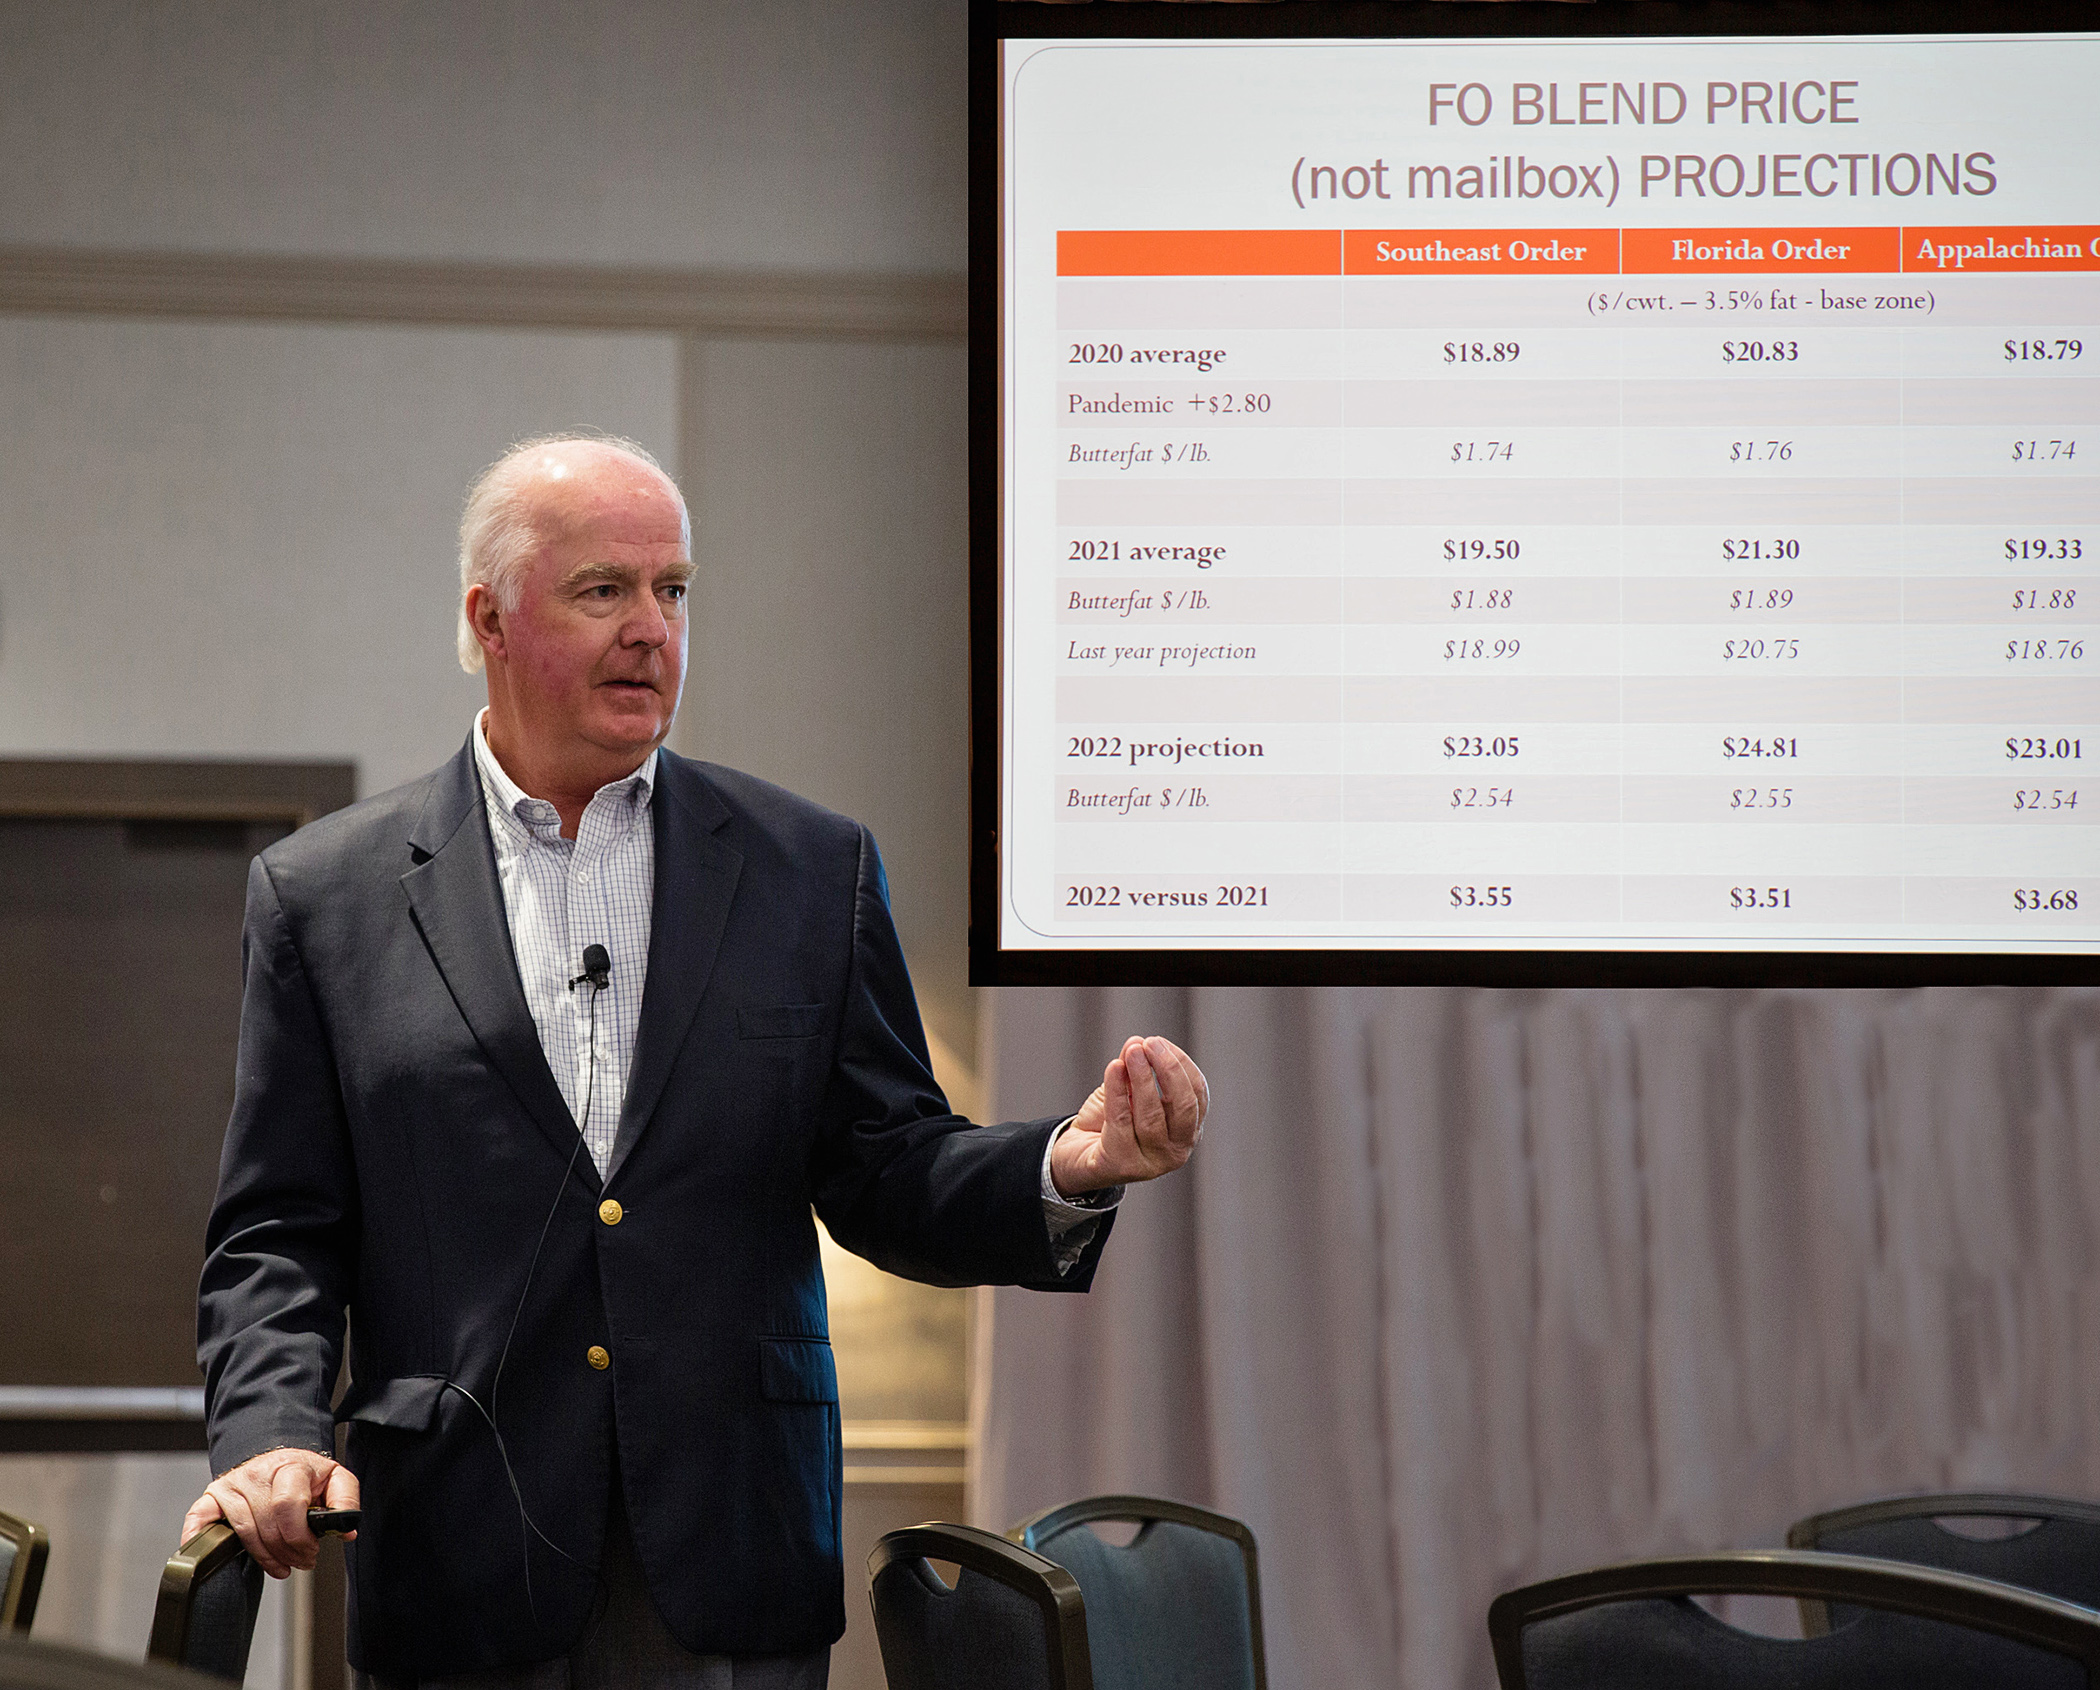
He forecast the 2022 Federal Order blend price average (not mailbox price) for the Southeast region will be up $3.50, with most of that increase on higher butterfat, predicted to average $2.54/lb.
Covington’s 2022 blend price projections range from $23.01 in the Appalachian Order 5 and $23.05 in the Southeast Order 7 to $24.81 in Florida Order 6.
He noted that the market beat his conservative 2021 projections by 50 cents to the good.
“I’m still on the conservative side this year because prices can decrease as quickly as they increase,” Covinton said. “A small change in supply or demand makes a larger change – up or down – in your milk price.”
Covington went through the numbers for 2021, noting reduced milk production, reduced product inventories, reduced Class I sales, a narrowing of the Southeast milk deficit, expanded exports, and expanded domestic demand as trends that are expected to persist into 2022 – especially on the milk production side as supply programs, production cost increases and limits on available labor keep a lid on milk growth nationwide, even worldwide.
Come 2023-24, Covington sees production “jumping up” because of new cheese capacity coming on line in the next two to three years.
“Texas and the I-29 corridor (Central Plains) are bringing cows to where the plants are growing. We can see this in the production numbers,” he said.
As the milk supply in 2022 is likely to be restrained, Covington looks to the signs that domestic and export demand will continue strong, but questioned how inflation will affect consumer buying power.
The availability and consistency of labor also continues to challenge the dairy supply chain and its customers on the foodservice side.
Be prepared for the unexpected, he cautioned, reminding producers that 2020 was forecast to be a good year, and then the unexpected happened – Coronavirus – so all bets were off.
Exports play bigger role in milk price
“Export demand has become very important to your milk price,” said Covington. “We are seeing the strongest demand yet… and look how dependent the industry is on the export market, sending a record 17.1% of supply overseas — up from 15.8% in 2020.”
Using the available figures for the first 11 months of 2021 to gauge it, Covington said overall export demand is up 11.5% for 2021. Over the past decade, the year over year export demand gains averaged 4.3% by comparison.
Add to this the increase in domestic demand, up 1.4% in 2021, and the net gain in dairy demand for 2021 is more than 3% — almost double the 10-year average year over year demand increase of 1.7%.
Unfortunately, on the fluid milk side, USDA reports sales are down over 4% in 2021 vs. 2020, according to Covington.
“Exports are having a bigger part in your milk price,” he said, noting that global milk production in major dairy exporting countries is flat to lower, pushing global dairy prices higher. “Our prices are well below the world prices, making us very competitive. We’re exporting twice as much butter, and 75% of our nonfat dry milk is being exported.”
That’s positive for the skim price, and the doubling of butterfat exports along with domestic demand push the other side of the fat/skim equation higher.
Milk production trends
Even though 2021 milk production will clock in at around 1% over 2020, Covington honed into the production and cow losses on the back half of the year, using July through November data.
Cow losses at 124,000 head in those five months “are the biggest drop since 2009,” he said.
At the same time, milk per cow had been increasing the first part of the year but flattened in the second half as cost of production caught up to milk prices.
“Production is lower now because of less milk per cow and fewer cows,” said Covington.
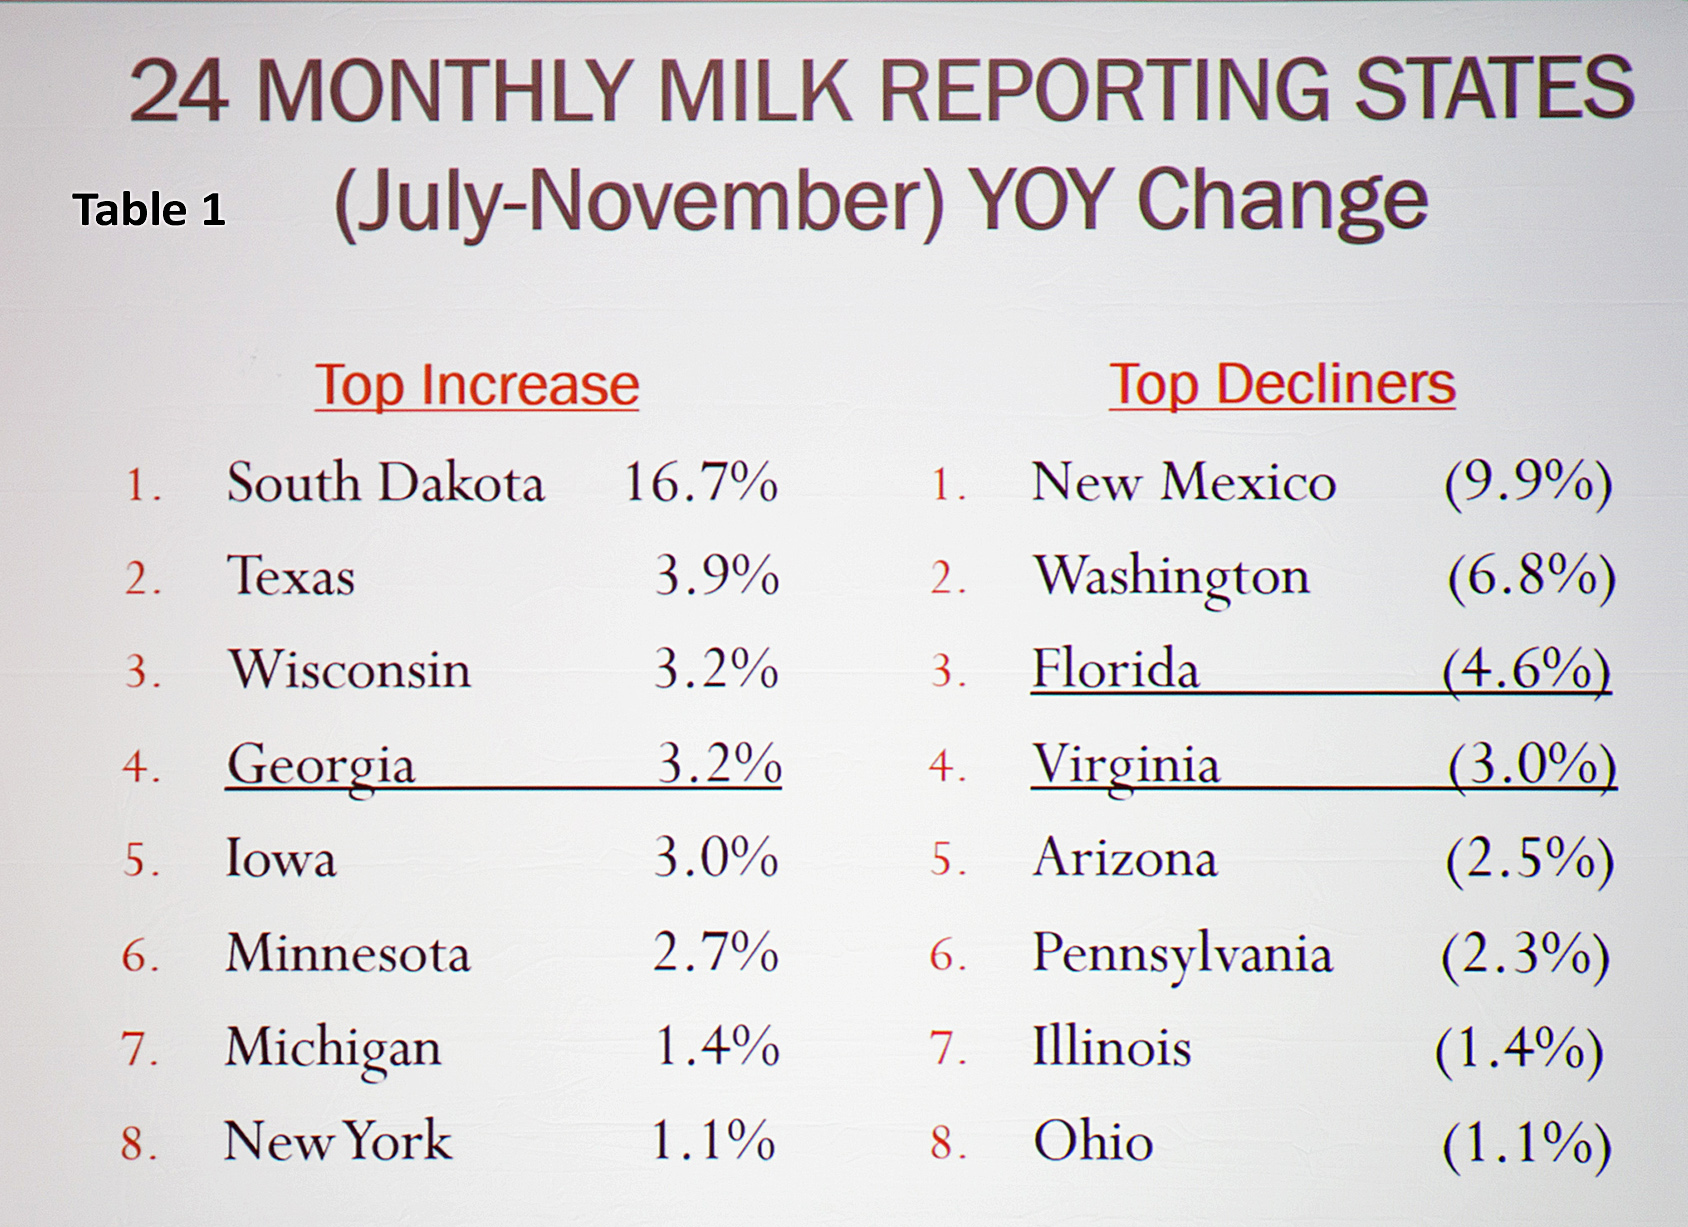
Looking at just the back half of 2021, Covington broke the 24 monthly milk reporting states into thirds and showed the geographic shifts (Table 1, above): 8 states were up more than 1% in production, 8 states had reduced production and 8 states were in between.
Significant in the gaining top-third is Georgia, with July through November 2021 production up 3.2% over the same period in 2020.
“Georgia added more cows and increased milk per cow,” said Covington. He said as Florida is losing production, Georgia is gaining and getting closer to Florida.
On the bottom third, the back half 2021 milk production decreases were 4.6% in Florida and 3% in Virginia.
“Florida lost 6000 head and Virginia 3000,” said Covington. “This tells me people are going out of business.”
Looking at the three major milk states of the Southeast region for the year, Covington noted that Florida is down 4.8%, Virginia down 3.3% and Georgia up 1.1%. The other seven states of the Southeast are collectively down about a billion pounds over the past few years.
In the Northeast, Covington’s chart showed New York’s production for those months was up 1.1%, barely putting it in the gaining third, while Pennsylvania’s production was 2.3% lower and Ohio of 1.1%.
In the West, the chart showed Texas up 3.9%, but New Mexico down 9.9%; Wisconsin and Minnesota up 3.2 and 2.7% and Illinois down 1.4%; South Dakota continues as the largest percentage gainer, up 16.7% on the back half of 2021.
“South Dakota tops the list with expansion in cheese capacity,” said Covington. “Cheese expansion is also underway in Texas, and milk production is growing there too.”
Dairy inventories and commodity production are down
Dairy inventories are down. “One of the best barometers for milk prices is looking at inventories, to see if they are building or declining,” said Covington. They are declining with butter inventory down 16%, powder down 21%, whey down almost 9%.
Cheese inventories are up 9.6%, which isn’t bad, according to Covington.
“We’re going into 2022 with really no challenge of inventory,” he said.
On the commodity production side, Covington observed that, “We do not have excess cream. Butter production is lower and powder production is lower. Fluid milk consumption is lower, but the fat percentage is higher, decreasing the cream supply. Demand for other cream products has also been good.”
With cheese production up 1.3% overall, Covington said the real positive here is Italian cheese production up 5.6% is the bulk of the increase.
“This tells you the product is moving,” he said, “because it’s the fresh cheese production that is higher. They don’t usually make Italian cheese without a sale for it.”
Southeast fluid milk changes
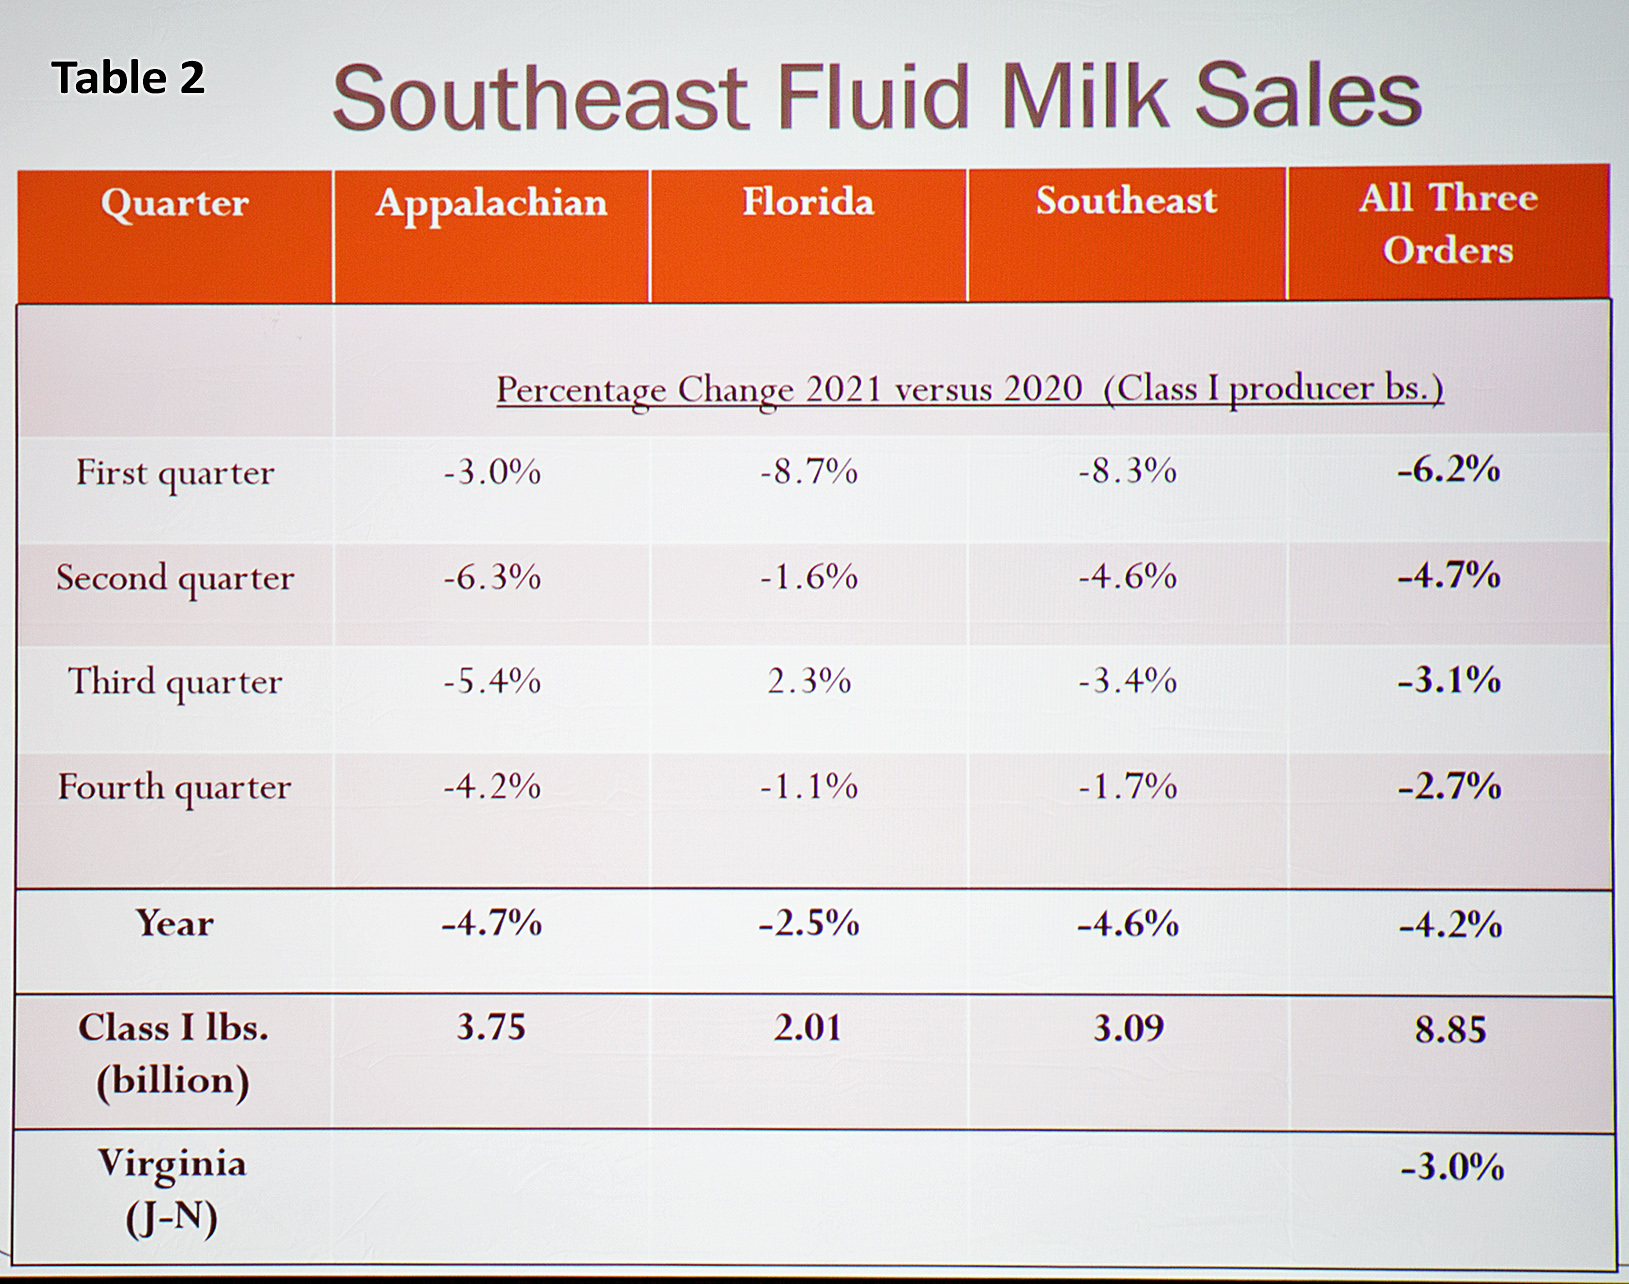
Together, all three southeastern FMMOs had 4.2% less milk going into Class I in 2021. (Table 2, above)
“2021 was a poor year for Class I in the Southeast, but we are comparing to when the food box program was in effect, and that program gave quite a lift to fluid milk in 2020,” said Covington. This loss translates to about one million pounds per day.
Utilization percentage has remained about the same at a little over 72% across the three FMMOs. As Class I sales have declined (4.2%), Southeast production has also declined (3%), so there is little change in utilization percent.
The structure of Class I pool distributing plant ownership has also changed in the Southeast, post-Dean, with 9 of the 44 plants supermarket owned and 19 cooperative owned.
The Southeast region is producing 103 pounds of milk per capita annually, down 20 pounds while fluid milk sales per capita, at 134 pounds, are off by 7 pounds – putting Southeast per capita production 31 pounds below fluid milk per capita consumption.
“The size of the deficit gap is smaller than it was in 2010 due to sales declining more than the production declines over the past decade,” said Covington.
Looking ahead to questions asked about FMMO reform and the Class I mover calculation, Covington said he “would hope we can get back to the ‘higher of’ – realizing what it costs to serve a fluid milk market.”
He shared concern about what happens to orderly marketing when Class I is underpriced vs. the other milk classes.
“Fuel cost estimates are a big concern, and there are other costs,” said Covington. “The cost to serve Class I markets keeps going up. The biggest issue is the FMMO system started when fluid milk was king, and now it is becoming a minority, especially in some areas of the country where processors will wonder, why be in the Federal Order?”
-30-
