Editorial Analysis: Tumultuous 2024 spills over into 2025 – Part Three
By Sherry Bunting, Farmshine, February 7, 2025 (updated with additional information after print edition published)
EAST EARL, Pa. – A tumultuous dairy and beef market in 2024 is bound to be even more so in 2025. The long-awaited Jan. 1 Cattle Inventory Report is in, and we all saw the kerfuffle about tariffs and trade this week.
The bottom lines are…
— The U.S. beef cow herd continues to shrink, while both the beef and dairy heifer replacement numbers are notably smaller, signaling less domestic beef production and stable, if not reduced milk production in the face of strong domestic demand for beef and dairy products.
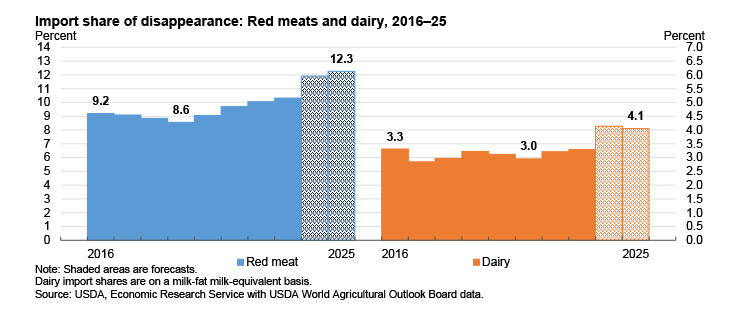
— U.S. import volumes of live feeder cattle as well as beef and dairy products have climbed over the past five years.
— Uncertainty prevails about U.S. trade policy, but export volumes of beef and dairy have leveled off already in the past several years. Dairy exports are bound to get a boost in the short-term as U.S. prices are mostly trailing current global prices. Tariffs on Canada and Mexico and potential retaliations are paused.
— Will the dairy herd continue maintaining itself at these shrinking heifer ratios now that we are five years out from the time of plentiful heifers.
Report highlights include…
Milk cow inventory has remained relatively stable over the past five years, ranging from 9.34 million head on Jan. 1, 2020 to the 5-year high of 9.45 million head on Jan. 1, 2021, then back down to just shy of 9.35 million head on Jan. 1, 2024 and Jan. 1, 2025. However, the number of dairy replacement heifers has dropped by 16% over the past five years from 4.61 million head on Jan. 1, 2020 to 3.91 million head on Jan. 1, 2025. This number is down almost 20% — or nearly 1 million head — from the record high 4.81 million dairy replacement heifers recorded on Jan. 1, 2016.
Are milk cows milking longer? Is the average dairy cow getting 16 to 20% more productive life (an additional half lactation)? Is the age at first calving continuing to decline, and are herd culling rates also declining significantly enough to maintain the current cowherd size on 16 to 20% fewer heifers expected to calve vs. 5 and 10 years ago?
According to the Jan. 1, 2025 Cattle Inventory Report, there are not quite 27 heifers expected to calve this year for every 100 cows in the current U.S. dairy herd, and a national cull rate of 29% based on January through December 2024 dairy cow slaughter totals. Five years ago, there were just over 31 heifers expected to calve for every 100 milk cows in the similarly-sized U.S. dairy herd.
Will these trends collide at the 5-year mark this year, given the average productive life of a dairy cow based on the most recent data (2020) is not quite three lactations or roughly 5 years of age? How will the $5 to $10 billion in new processing capacity be filled, or will we see existing plant closures in their stead? Are the investor dairies that put up 10, 20, and 30,000 cow facilities each year filling new barns with milking animals raised on their own calf ranches coming in under the reporting-radar of USDA NASS? Or is the pace of dairies exiting the business on one end mirroring the growth on the other end?
One inescapable conclusion is that the milk cow herd remains relatively stable, while the dairy replacement heifer numbers have shrunk by 16% vs. five years ago and by 20% vs. 10 years ago, and the record-high prices paid for dairy replacements is proof of tight supplies.
This is part three in a four-part series. Part one was published Jan. 3, 2025; Part two on Jan. 17, 2025.
U.S. cattle herd down… again
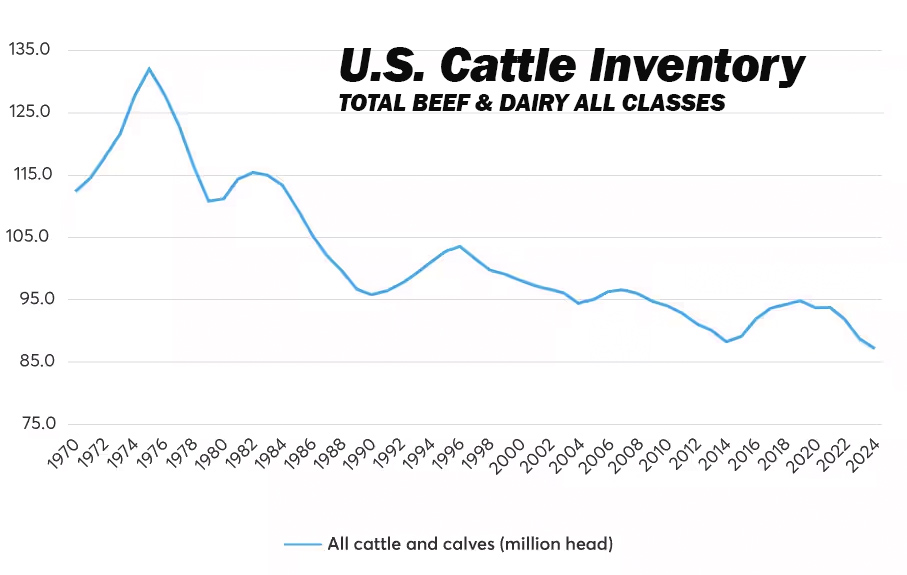
U.S. total cattle numbers on Jan. 1, 2025 are down 1% year-over-year (YOY), according to the All Cattle and Calf Inventory Report released by USDA on Fri., Jan. 31st.
At 86.66 million, the report counted 500,000 fewer head than last year’s total, which was already the smallest in 74 years (Jan. 1, 1951).
The total number of all cows and heifers that calved is down 0.4% YOY at 37.21 million head. That is 147,000 fewer beef and dairy cows on farms as compared with the revised-lower totals a year ago, which were already the smallest in 84 years (Jan. 1, 1941).
The total number of all heifers over 500 pounds on Jan. 1, 2025 (including heifers destined to become beef) was down 1% YOY at 18.18 million head. That’s 140,000 fewer head counted than on Jan. 1, 2024, which was already the smallest total heifer number in 34 years (Jan. 1, 1991).
In the Jan. 1, 2025 report, USDA NASS revised-lower its Jan. 1, 2024 and July 1, 2023 estimates of total animals that had calved, as well as the calf crop in those 12 to 18 month prior Inventory Reports. Statisticians went back and compared the prior estimates to the official slaughter data, the import and export data, and the relationship of this new survey information to the prior surveys.
This means the Jan. 1, 2025 numbers are now estimated at levels below the revised-lower prior reports that had already set records! (A mid-year 2024 inventory would have been helpful, but was canceled by former Ag Secretary Tom Vilsack, claiming insufficient USDA funds).

Milk cows flat, heifers shrink
The number of milk cows on Jan. 1, 2025 was essentially unchanged vs. year earlier, up only 2,500 to just shy of 9.35 million head.
However, the dairy replacement heifer total is down 1% YOY at 3.91 million head. At this rate, the number of heifers heading to careers as milk cows is 16% below the 5-year comparison on Jan. 1, 2020.
At 3.91 million head, there are 37,000 fewer dairy replacement heifers than a year ago, which was already the smallest number of dairy replacement heifers in 47 years (Jan. 1, 1978).
As the graph above illustrates, milk cow numbers have held relatively stable over the past five years, while the number of dairy replacement heifers has significantly declined. Are cows experiencing longer productive life? Or are the multi-site investor dairies filling their own expansion sites via their own calf ranches, and escaping the USDA reporting radar?
According to the most recent data (2020), average dairy cow productive life in the U.S. is just shy of three lactations, roughly five years of age. With the number of dairy replacement heifers declining 16% over the past five years, will these two trends collide in the next 12 to 24 months to reduce the U.S. milking herd while escalating the already record high dairy replacement cattle prices? And, what role might HPAI H5N1 play as longer term impacts emerge?
USDA NASS reports that the average auction value of ‘average’ milking cows has increased by nearly $800 per head to $2650 for 2024 vs. $1890 for 2023; $1100 per head higher vs. the $1720 average for 2022; and double (+$1300) the average value reported at $1350 and $1300 per head four and five years ago for 2021 and 2020, respectively.
The average cost to raise dairy replacements has been estimated at $1700 to $2400 per head, which means the value of ‘average’ replacement heifers at $1720 to $2660 from 2022 to 2024 is finally starting to mirror the cost to raise them — on average.
Many dairy producers continue producing only the heifers they need, which is reducing the availability of heifers in the marketplace for those wanting to expand.
Producers continue to respond to the lure of the 3-day-old dairy-on-beef crossbred calves offering substantial margins of $800 to $1000 per head — with no investment, no rearing, no revenue-wait, and no risk.
Basically, a dairy cow can produce $800 to $1000 in revenue for the dairy as soon as she drops a live crossbred calf, no matter what the milk price or margins are doing, and with her whole lactation in front of her.
The Jan. 1 Inventory Report shows the U.S. beef herd continues to shrink, suggesting beef-on-dairy crossbreds will continue to offer bigger per-head margins than growing extra dairy heifers to sell as herd replacements — unless they are premium dairy heifers.
Expanding dairies are having to really plan ahead to raise the animals they need for growth or scramble to get them. Additional upward price momentum may be seen on dairy replacements in the next 12 to 24 months as the more abundant heifers available five years ago ‘age-out’ of the system, statistically speaking, at five years old, which is the industry average age of a milking cow in the U.S.
With the Jan. 1, 2025 U.S. milking herd holding steady at a level that is 1.1% smaller than it was in 2021, the expanding dairies are buying up the herds of the exiting dairies at high prices that make dairy farmers think about selling the cows and hanging on to the heifers, for now, if they do not have a next generation to continue the dairy.
Turnover of existing Holstein herds to include other breeds is also occurring, along with genetic improvement within the Holstein breed, as producers work to raise heifers that calve into the milking herd at younger ages, produce more component yield per hundredweight of milk, have improved productive life traits and fewer days open for a tighter average calving interval.
With a 2024 national dairy herd of 9.35 million milk cows and a 2024 national dairy cow slaughter of 2.726 million, the national culling rate last year was 29%. At that rate, even if the average age at first calving is 22-months, the U.S. dairy industry would need 28 dairy heifers to calve successfully in the next 12 months for every 100 milk cows — just to maintain the current size of the U.S. dairy herd.
According to the Jan. 1 Inventory Report, there are 2.5 million dairy heifers expected to calve in 2025 (down 0.4% or -9000 head). This calculates to 27 (actually 26.75) dairy replacement heifers expected to calve in 2025 for every 100 cows in the U.S. dairy herd as of Jan. 1st.
In 2016, when dairy replacement heifer numbers reached their peak at 4.81 million head, 3.11 million head were expected to calve that year, and the total U.S. dairy cow inventory was 9.31 million head, meaning there were 31 heifers expected to calve for every 100 cows in 2016. This has steadily eroded in part because dairy producers have stopped spending the money to grow extra heifers that were worth less than the cost to grow them until this year. They also worked to reduce age at first-calving, days open across the herd, higher component levels in the milk, reduced death loss, longevity, and began gradually re-introducing beef crossbreeding, which has become a pretty big deal over the past five years.
Some parts of the country are down significantly in heifer replacements as of Jan. 1, 2025, while others are up. For example, Pennsylvania has 15% more dairy replacement heifers on farms vs. year ago.
These estimates indicate milk production will be flat to lower for the next 12 to 24 months.
What this does not account for is the increasing milk component levels generating more dairy products per 100 pounds of milk and the increasing volume of dairy imports, particularly cheese, butter, and whole milk powder. But those increases can only do so much in the face of $5 to $10 billion in new processing assets coming online in the next 6 to 18 months.
Beef herd shrinks more
The Jan. 1 Inventory shows the U.S. beef herd continues to shrink. At the national level, there are no signs of rebuilding, as the total number of heifers heading to careers as beef mama cows is down 1% YOY. However, in some parts of the country, such as Virginia, more heifers were retained as beef cow replacements and fewer were earmarked for feedlots.
At 4.67 million head, there are 46,000 fewer beef replacement heifers in the U.S. vs. year ago, setting another record low as the smallest number since 1948.
Even more striking is the beef replacement heifers that are expected to calve in 2025 are down a whopping 2% YOY (-50,000) nationally.
Meanwhile, the beef-on-dairy feedlot placements, while a growing segment of the beef industry, are not enough to reverse the downward beef production trend as evidenced by declines in the number of animals over 500 pounds on Jan. 1st heading to feedlots: Steers and bulls are both down 1% (-157,000 and -21,000 head YOY, respectively). Heifers over 500 pounds heading to feedlots are down 0.6%, and the number of cattle on feed as of Jan. 1, 2025 is down 1% YOY at 14.3 million head (-130,000 head).
The Inventory Report came on the heels of the January Cattle on Feed Report, which showed 3% fewer feedlot placements as of Jan. 1, perhaps because of the Mexican border closure to the live cattle imports, due to concerns about transmission of the screw-worm parasite.
Even the total number of all calves (heifers, bulls and steers) weighing under 500 pounds dropped 1% lower YOY at 13.46 million head (-30,000).
These estimates suggest domestic beef production will decline for at least the next 12 to 24 months, maybe longer.
What this does not account for are the number of live cattle crossing the border into U.S. feedlots from Mexico and Canada and the increasing amounts of beef the U.S. imports from other countries, including from Canada, Mexico and South America.
Significant geographic dairy shifts
Breaking the dairy inventory numbers apart, we see big geographic shifts.
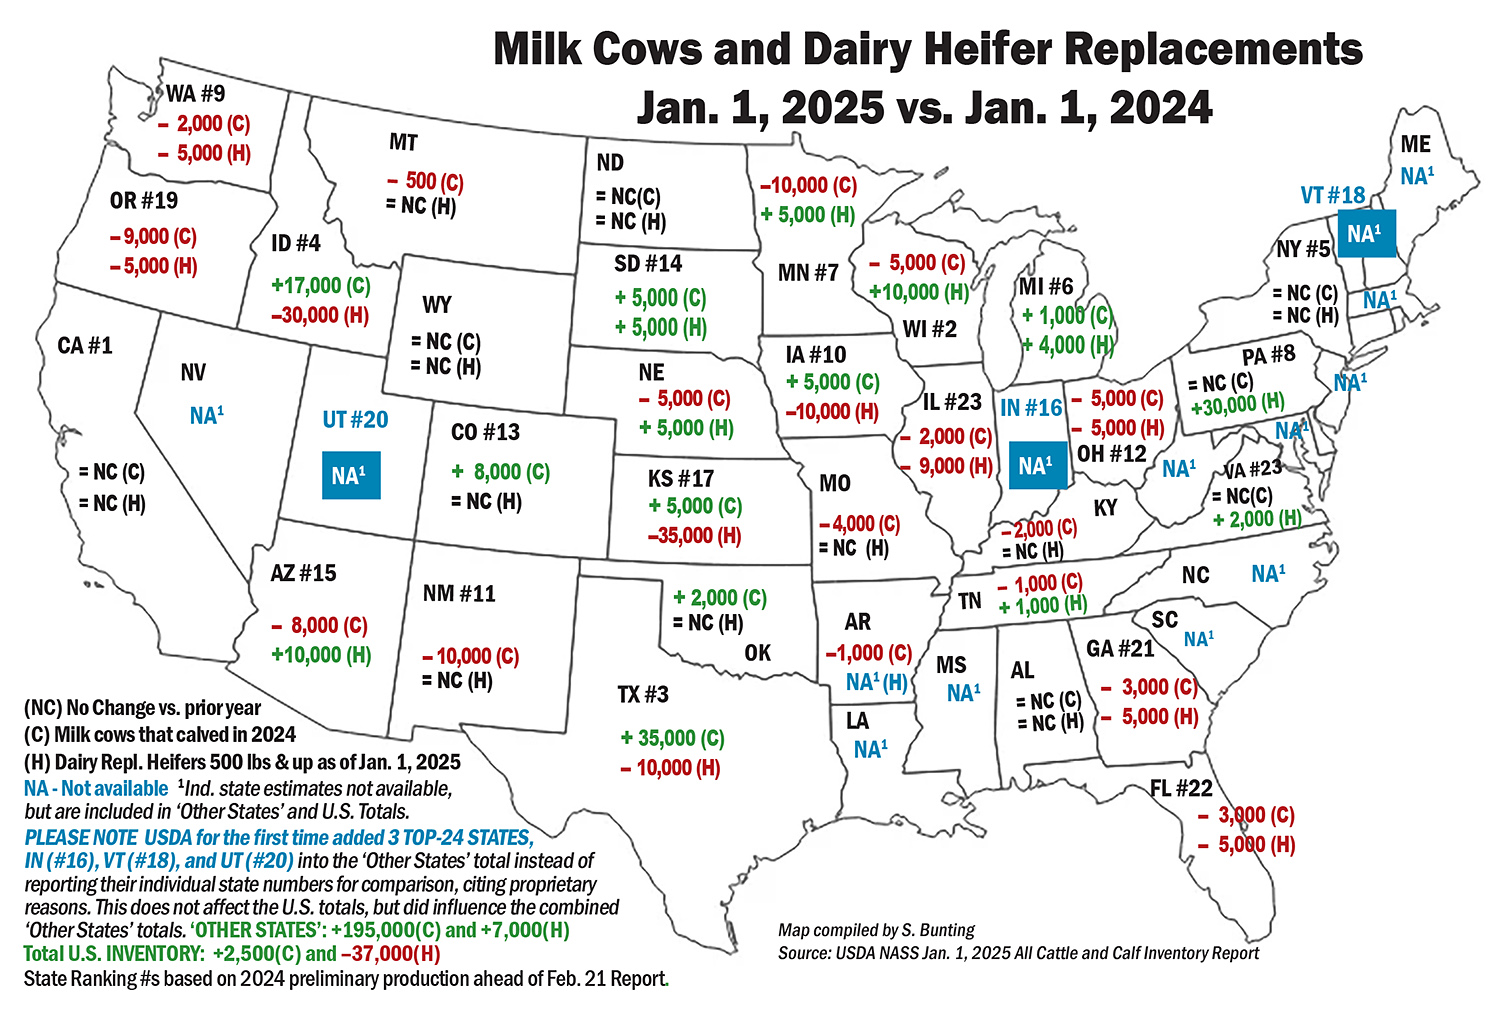
The West added 78,000 more milk cows in 2024 vs. 2023, except for California’s numbers being unchanged. On the other hand, the East and Upper Midwest had equal or fewer milk cows, down collectively more than 75,000 head YOY, except Michigan was up just 1000 head.
The biggest 2024 gains were tallied in Texas, up 35,000 head, and Idaho, up 17,000 head. Colorado grew by 8,000 head; Iowa, Kansas and South Dakota by 5,000 each; and Oklahoma by 2,000.
The biggest milk cow declines were in Minnesota and New Mexico, down by 10,000 head each; Oregon down by 9,000; Arizona by 8,000. Wisconsin, Ohio, and Nebraska by 5,000 each; Missouri by 4,000; Florida and Georgia by 3,000 each; Illinois, Kentucky, and Washington by 2,000 each; and Tennessee by 1,000. Smaller unranked states collectively accounted for the remainder of milk cow losses.
Interestingly, USDA pulled three Top-24 Milk Production States into the ‘Other States’ category, choosing not to report their cow and heifer numbers for proprietary reasons. They are Indiana (#16), Vermont (#18) and Utah (#20). Thus the ‘Other States’ category saw an increase of 195,000 cows simply because these three Top-24 states were included anonymously in the total.
The geographic breakdown is interesting when it comes to dairy replacement heifers as the growth is noted in the areas where the cow numbers have declined and vice versa. These shifts could reflect changes in the way heifers have tended to move across state lines for rearing, especially in light of the dairy-adapted B3.13 strain of HPAI H5N1.
Pennsylvania is the biggest outlier as the cow numbers are unchanged YOY, but farmers reported 30,000 more dairy heifers in the Commonwealth on Jan. 1, 2025 vs. year ago.
Elsewhere in the East, Virginia dairy heifer replacements are up 2,000 head; Tennessee up 1,000 head; New York and Kentucky unchanged; Georgia and Florida down 5,000 head each. Again, the ranked states of Indiana, Vermont and Utah had their replacement heifer numbers lumped into the ‘Other States’ category, which consequently showed a gain of 7,000 heifers vs. year earlier when those states were not included in that category.
Beef replacement heifers and feedlot heifers are down a combined 10,000 head in Pennsylvania, while Virginia showed signs of beef herd rebuilding, reporting 4,000 more beef replacement heifers and 4,000 fewer heifers heading to feedyards.
Looking at the Mideast, Michigan had 5,000 more dairy heifer replacements, while Indiana’s numbers were unreported. Ohio is down in dairy heifers by 5,000 head. Beef replacement heifers in that region are up by 7,000 head and feedlot heifers are up by 3,000 head.
The Upper Midwest grew their dairy replacement heifer numbers, while the West significantly decreased them. Wisconsin is up by 10,000 head YOY; while Minnesota and South Dakota grew by 5,000 head each.
In the West, the following states with significant growth in milk cow numbers had significant losses in dairy replacement heifer numbers: Kansas down a whopping 35,000 head in dairy replacement heifers; Idaho down by 30,000 head; Texas, Pacific Northwest and Iowa down 10,000 each. Dairies in Kansas, Idaho, Texas, and Iowa contended with avian influenza in 2024.
Meanwhile, in California, New Mexico, and Colorado (all three having dealt with H5N1) the number of dairy replacement heifers was reported as unchanged YOY, but Arizona, which has not had H5N1, grew its dairy heifer numbers by 10,000 head.
Trade is uncertain (Imports up, Exports leveling off)
Dairy and beef imports are growing, and the industry is responding to ‘tariff talk’ with statements showing fear of trade wars harming farmers or possibly gaining concessions in the context of Agriculture’s current annual trade deficit of $45.5 billion.
On Friday, Jan. 31, the spot cheese and Class III milk futures markets plunged lower in response to U.S. tariff announcements of 25% on goods from Canada and Mexico and 10% on goods from China.
This fear was short-lived, however, because the planned tariffs on goods from Canada and Mexico were promptly paused three days later on Monday, Feb. 3, when leaders agreed to support and combine efforts on U.S. border security, while putting teams together with the pledge to work through U.S. trade issues over the next 30 days.
The announced 10% tariffs on China went into effect Feb. 4, but discussions between the U.S. and China are said to be resuming for phase one of the trade deal struck in the prior Trump Administration just before the Covid pandemic hit globally.
Meanwhile, the total volume (not value) of dairy exports has leveled off on a total solids basis in the past two to three years as the U.S. exports more cheese and less skim milk powder and much less whey – the latter because we domestically produced less commodity SMP and far less commodity dry whey in 2024. Inventories are down for both, meaning domestic demand is using what is produced.
On the flip-side, the U.S. imported more cheese, butterfat, and whole milk powder during the first 11 months of 2024 YOY.
We will take a closer look at the trends in U.S. dairy farm numbers, production, and trade after final 2024 trade and production data are released in late February, and with more information, perhaps, on how U.S. agricultural trade policy may be shaping up for 2025.
-30-