Federal milk price hearing heats up over ‘make allowances’ and Class I ‘mover’

Farmers testify, Farm Bureau stands firm, USDA asks good questions, wants to hear from farmers

Bryan Henrichs, an Illinois dairy farmer, included a chart in his testimony showing these PPD swings in his milk marketing area (Order 32) from January through December 2019, before and after the Class I mover change — a year BEFORE the pandemic hit. 

Sherry Bunting, Farmshine, September 22, 2023

CARMEL, Ind. – The controversial “make allowances” took center stage for the past 10 days at the USDA federal milk price hearing in Carmel, Indiana. Witness testimony and attorney cross examinations — as well as follow up questions by USDA staff — have been particularly revealing. To-date there are nearly 300 exhibits, and the hearing is two-thirds of the way through its 21 proposals in five categories. The hearing can be followed daily at the live stream link: https://www.zoomgov.com/j/1604805748&nbsp

American Farm Bureau Federation economists Danny Munch and Roger Cryan have been exemplary in the way they are bringing their grassroots policy to the USDA hearing setting and standing up to heavy cross examination by attorneys for the processors as they seek to undermine AFBF’s position that no make allowance increases should be granted by USDA without a mandatory, audited cost survey, and that the Class I mover should go back to the ‘higher of’ calculation.

Entering its fifth week on Tues., Sept. 19, the emphasis has shifted to the various proposals on how to calculate the Class I base price ‘mover’ – whether to return to the ‘higher of’ or to use one of several proposals from processor groups that want to keep the ‘average of’ method but propose complicated ‘look-back’ adjusters to incrementally ‘pay back’ future Class I value losses incurred by farmers over a distant multi-year time frame.

Last Friday, September 15, several dairy farmers testified. In this week’s hearing update, we’ll focus on one farmer’s illustrative testimony in support of National Milk Producers Federation’s proposal 13 to return to the ‘higher of’ for the Class I mover calculation. 

While several testified, it was dairy farmer Bryan Henrichs, of Breeze, Illinois who best described the impact of the Class I mover change made legislatively five years ago on farmers’ ability to do risk management and on the FMMO mandate for ‘orderly marketing’ and service of the Class I fluid milk markets.

“With some classes having the ability to depool, this has created disorderly marketing as there isn’t the incentive to serve the Class I market,” said Henrichs. “I am unable to have my cooperative depool my milk due to my milk serving the Class I market. I have heard from some in the industry that the negative Producer Price Differentials (PPDs) (and resulting losses to dairy farmers) were caused by the USDA food box program.  I would disagree as the negative PPDs began not too long after the industry moved to the ‘average of’ in May 2019.”

Henrichs operates a 300-cow dairy farm, is on the Prairie Farms board, the American Dairy Coalition board, and was part of the American Farm Bureau Federation (AFBF) dairy task force. He saw first hand the devastating consequences to farmers from the Class I pricing change.

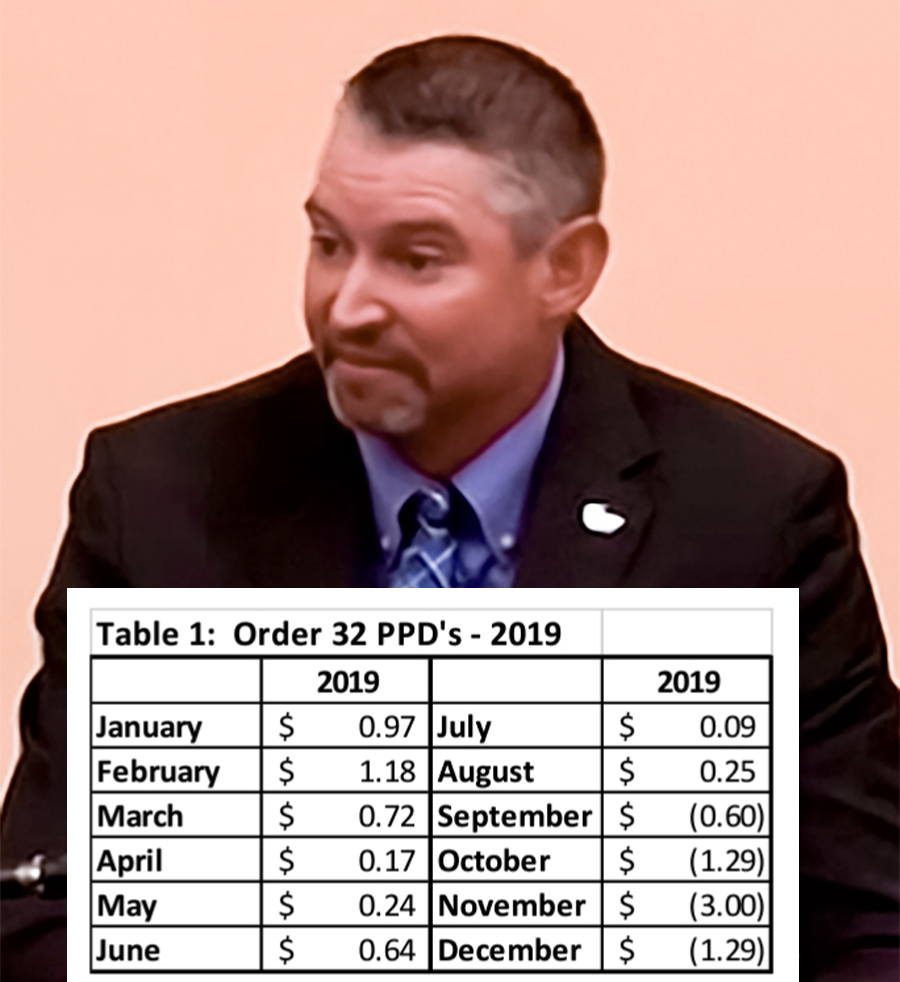
Henrichs included a chart in his testimony showing these PPD swings in his milk marketing area (Order 32) from January through December 2019, before and after the Class I mover change a year before the pandemic hit. 

He noted the industry has well documented the severity of losses much larger than this during the 2020-21 pandemic as well as the continuation of Class I value losses and depooling to farmers, even when it doesn’t show up as negative PPD — when Class IV is higher than Class III as has been the case in 2022 and 2023.

Henrichs expressed appreciation to USDA for the Pandemic Market Volatility Adjustment Program (PMVAP) payments that were aimed at covering just a fraction of these losses.

However, Henrichs duly noted the problem with “support” after-the-fact and the problem with “rolling adjusters” that try to make up for these losses later. They don’t help much if the large losses — the large negative basis that can’t be managed — hits cash flow so hard that farms are out of business by the time it’s “made up” to them and then only “made up” partly or quite gradually.

“I know some dairy producers that needed that money at that time — not 12 to 18 months later. I know of some that are no longer in business when they received the (PMVAP) payments,” said Henrichs. “The ‘higher of’ will ensure that the dairy producer is compensated at the time of the sale instead of later by some other form of support… and I worry if the USDA will always have the funds to provide such support.”

Henrichs pointed out that risk management doesn’t help in this scenario.

“We have used risk management tools in the past such as forward-contracting and DRP to help manage the price volatility of the dairy markets. With the ‘average of,’ we see the higher level of negative PPDs, which acts as ‘negative basis’,” Henrichs testified.

“We are familiar with ‘negative basis’ with corn as that indicates what the market values the commodity at the time of sale. At least with corn, I can call the elevator and find out what the basis is and decide if I want to ship to market,” he explained, adding that as dairy farmers, “we produce and ship a perishable product. With a negative PPD, we don’t know until two weeks after we are done shipping for the entire month whether or not there is a negative basis.”

Henrichs noted that he was shown a check from a neighbor who forward contracted in July 2020. 

“He shared with me his check as he locked in $18.00/cwt. milk in a Class III futures contract. He lost on the futures contract — as he would expect when the market rises — but due to the negative basis or negative PPD, he ended up with a net check of around $9.00/cwt. I continue to evaluate the amount of negative PPDs since going to the ‘average of,’ and I am reluctant to use forward contracting or DRP as part of my farm’s risk management program,” said Henrichs.

He stood his ground as attorney Steve Rosenbaum for IDFA made several attempts to trip him up on cross-examination. Rosenbaum tried to ‘cherry pick’ a few months in 2019 when the ‘average of’ yielded a slightly higher Class I mover compared to what it would have been under the ‘higher of.’

Henrichs’ matter-of-fact answers left the IDFA attorney unable to break him down. Rosenbaum asked if Henrichs had done monthly analysis of the ‘average of’ vs. the ‘higher of’ to see the months when it was positive. Henrichs replied: “Yes, we’re always watching.”

“No one questions, obviously, that when it comes to 2020 and the pandemic, Class III and IV started diverging substantially, and you ended up with less… but do you agree with me that until that happened, you weren’t experiencing this kind of ‘anomalous’ result, were you?” queried attorney Rosenbaum for IDFA.

“Not at that point, but once we started receiving the negative PPDs, they got extremely large, as you can see,” Henrichs replied, referring to Table I in his testimony. “It was way more of the negative than what the positives were prior to that.”

(Table I shows the PPD in Order 32 for all 12 months of 2019 — before and after the Class I formula change, which was implemented in May of 2019. This was a year before the pandemic. In fact, going forward it is still “way more negative than positive.” Farmshine has also been watching this accumulation of over $1 billion in cumulative net losses to farmers across 53 months, a graph that has been updated and published several times in Market Moos.)

Erin Taylor, acting director of USDA AMS Dairy Programs, questioned Henrichs about risk management: “So is this ‘negative basis’ the reason you are not using risk management tools currently?”

“Yes,” Henrichs replied, adding that, “as a custom operator putting silage up for a lot of dairy farmers, a lot of questions on dairy pricing get sent to me. We’ve had producers that bought DRP contracts, and in the months of April, May and June 2020, they were set to receive a pretty large sum, but because of depooling, with around a $20 to $21 Class III price in June of 2020, farmers in our area — because of  depooling — were unable to receive that (higher price) in their milk checks, but they were also not able to receive the DRP payments that were set to come to them. 

“They were kicked out because the price on the futures was higher than their contract that they purchased – that they bought for an $18 coverage for example – well that $20 (Class III price) kicked them into being above that ($18) they purchased, and they didn’t get a payment. So, even though on the Board of Trade, they may have looked good, that’s not what we received on our dairy farms,” Henrichs shared.

“Because that Class III milk wasn’t pooled?” Taylor picked up his the thought train in the form of a question.

“Yes, In Order 32 only 6% of Class III milk was pooled that month, so our price was around $12 to $13 per hundredweight for our dairy farms, but their contract for ($18) was set to pay them but did not because of that $20 Class III price on the Board of Trade (which became the announced FMMO price that led to Class III depooling).” 

(Put simply: That higher price the DRP contract ‘saw’ meant no DRP payment for the farmer, but that price wasn’t realized by the farmer. This is similar to having your barn burn down, and your insurance adjuster saying ‘well, because your neighbor’s barn didn’t burn down or something on paper says your barn should not have burned down, you are not entitled to a payment for your barn that in fact burned down.)

Taylor also asked what disorderly marketing looks like to dairy farmers. Henrichs gave perhaps the best explanation yet on this hearing record. He explained how the upside-down pricing — the misalignments that have been brought on by the switch from ‘higher of’ to ‘average of’ — caused pooled farmers to have ‘uniform prices’ vastly different within miles of each other due to depooling incentives on some Orders.

“Going back to the months of June 2020, and July, we saw large Class III prices, whereas in the ‘average of’, we saw Class I and Class IV were much lower, and you had farmers in Wisconsin, in Order 30, getting $4 a hundredweight more per the FMMO website, on the uniform price. We have producers that are within miles of 30, shipping in FMMO 32, who were $4 different, and their milk was being produced not far from each other. That’s disorderly marketing in my opinion,” said Henrichs.

“When you have guys not wanting to go to a Class I plant because the Class III price is so much higher, that is what I consider disorderly marketing — where you would have people jumping in and out of which product they want to sell their milk to that day because of the pricing disparity amongst the classes. Part of the class pricing in the FMMOs are to stabilize pricing to producers in each Order to be pretty similar.”

“So you’re saying that you see class prices being in typical historical alignment as orderly?” asked Taylor.

“Yes,” said Henrichs.

“Because then the incentive is there to service the Class I plants?” Taylor asked further.

“Yes, service the Class I first… make sure those are full for the fluid industry because they’re not able to store product like the powder and cheese plants,” Henrichs added.

Throughout this hearing, attorneys for IDFA and Milk Innovation Group scoffed at the idea that Class I plants could have any trouble getting milk for fluid use because the country has more than enough milk to go around. 

They avoided the question of what does it cost or how do they attract the milk to the Class I plant when the historical alignments are out of whack. 

They put forward witnesses from very large international processors saying that the FMMO minimum prices are set too high, that they must be lowered by raising make allowances and keeping the ‘average of’ mover and cutting Class I differentials and all sorts of changes. 

They pointed to the dumping of milk this spring in the Central U.S. as proof that FMMO minimum prices are set too high and must be lowered so that processors can pay premiums if they want to and can invest in plant capacity to soak it up so it doesn’t go to the sewer.

USDA’s Taylor went so far as to ask these processor witnesses what other factors affected the milk dumping this spring, what other factors affect milk production growth (in the Central U.S.). 

Processor witnesses stammered around on these capacity and innovation questions. They weren’t sure how to answer some of the very direct USDA questions over why they are so fast to make sure every bit of their cost is covered in that make allowance and yet balk at the idea of being asked to account for more of the pricing or value side.

Henrichs is just one example of farmers who are testifying in person on various days or virtually via Zoom on Friday afternoons. It is obvious that USDA AMS personnel want to hear from farmers – what they have to say, how all of this affects them. 

Farmers are the only ones who can show up at the hearing venue on any day, let an official know they are there to testify, and be worked into the schedule without sending written testimony or notice ahead of time. USDA merely asks that farmers bring their written testimony with them and make copies to hand out.

Virtual testimony must be pre-registered, but in-person testimony can happen any day.

Those farmers wanting to testify virtually have one more scheduled opportunity on Friday, Sept. 29. To get one of the available slots for that day, go to the hearing page on Monday, Sept. 25 at noon to look for the signup link. Be quick about it, because last Monday, the slots for Sept. 15 filled up within less than two hours. If the hearing continues into October, go to the webpage on subsequent Mondays to sign up for any slots offered on subsequent Fridays.

The hearing page is at https://www.ams.usda.gov/rules-regulations/moa/dairy/hearings/national-fmmo-pricing-hearing


For technical difficulties, email FMMOHearing@usda.gov

USDA’s Taylor brings the department’s questions for every witness. She has done a noteworthy job of this, pressing industry witnesses for details and bringing the deeper levels of farmer testimony to the fore.

Remember, when this is all over, and the t’s are crossed and i’s dotted on a USDA final decision, farmers will vote ‘yes’ to accept these changes or ‘no’ to dissolve their Federal Milk Marketing Order. This means even if co-ops bloc vote for their members, the co-ops and farmers have the final say.

There is an obvious concern among some in the processing sector that the FMMO system could be dissolved. One may believe that processors want the FMMOs to end because more and more of the cheese and other dairy products are being manufactured and sold outside of the FMMO system and outside of the pooling process.

However, processors have an interest in seeing the FMMO system continue because they rely on the pricing data, the benchmarking, and a built-in make allowance. 

The existence of FMMOs and those announced prices actually settle Class III and IV milk futures on the CME. Even if processors hedge risk by using dairy product futures contracts — instead of the milk futures contracts — they still rely on the USDA price survey every week that yields an official weighted average price for the four FMMO commodities that are traded on the CME to come up with the weighted average price of those commodities at the end of each month to settle butter, nonfat dry milk, 40-lb block and 500-lb barrel cheese and dry whey futures contracts.

Some argue that the daily CME spot cash markets for these products could be simply used. However, just think what this would mean if the CME became the only market to look to for futures and cash. Milk doesn’t have a real cash market reported every day on the farmer or processing sides like beef and other commodities. 

Furthermore farmers ship milk for four to six weeks before ever knowing what they’re going to get paid for what they shipped, or what the basis is going to be. They can’t look at a market and make decisions. They can’t call an elevator. They can’t hold their product for a week or a month… or even a day.

-30-

FMMO hearing update: ‘We made it to the moon, we can figure out this little equation’

Milk pricing formulas and ‘make allowances’ can feel like rocket science, farmers point out the pitfalls in ignoring the impact of mozzarella and the rising costs on dairy farms. Georgia and California producers among those testifying on make allowances, along with economists, including Dr. Mark Stephenson

Previous FMMO hearing updates can be found here and here

By Sherry Bunting, Farmshine, September 15, 2023

CARMEL, Ind. — “It’s really simple. We made it to the moon back in the late 60s… if you tell me that we can’t figure this little (mozzarella) equation out, we got something wrong,” said Joaquin Contente, the son of Portugese immigrants and a lifelong dairy farmer near Hanford, California as he gave virtual testimony Friday, Sept. 8 during the ongoing USDA Federal Milk Market Order (FMMO) hearing in Carmel, Indiana.

Contente serves on the California Dairy Campaign (CDC) board, which is a member of California Farmers Union (CFU) and National Farmers Union (NFU) as well as Organization for Competitive Markets (OCM). His son and daughter today run the 1100-cow multi-generational dairy farm in California’s San Joaquin Valley.

“Mozzarella should no longer be ignored. This issue was raised in 2000, and the volume and demand have grown dramatically since then,” he said, referencing CDC’s proposal and citing USDA data showing mozzarella production last year was nearly 5 billion pounds while cheddar was short of 4 billion pounds, and all cheeses totaled just over 14 billion pounds.

“I represent myself and many other producers who are reluctant to step up and speak out in opposition to what is being said by milk handlers, out of fear of retribution,” he reported. “It is essential to include the largest cheese category – mozzarella. The volume has significantly exceeded cheddar, and the Class III price should be modified to reflect these market conditions.”

Contente noted comments about the change in the Class I base price from ‘higher of’ to ‘average of’ costing farmers $1 billion over four years’ time.

“This mozzarella issue, if you understand the formulas and yield factors, is costing dairy farmers more, annually, well over $1 billion — and that’s a conservative number I am using,” he said.

“We have situations where the milk price drops dramatically, 30 or 38%, so you have to look at this discrepancy going on over a couple of decades. Nobody is talking about it… you’ve got to be a little bit quiet about mozzarella because you don’t want to upset ‘the mozzarella people,’” said Contente, noting that mozzarella production is 12% larger than cheddar with very high yields. 

“There is information that needs to be collected, and that is the roadblock right now. It’s the largest category, and yet there is no reference to it, and the yields are so high that these cheesemakers are making product that they’re not getting charged for. It’s for free — off our backs,” he said. “We are in a system that requires price discovery of the uses of milk, and here we have the highest (volume of cheese) use in mozzarella, and we just turn the other way… why?”

The past two weeks of the daily 8 to 5 hearing sessions have been quagmired in the nuts and bolts of multiple proposals on what’s included or excluded from the pricing surveys as well as the corresponding make allowances as the hearing moved into its fourth week Wednesday (Sept. 13).

Like other producers testifying so far, Contente detailed the loss of dairy farms around him and the discrepancy between milk prices and cost of production leading to mass exodus of dairy farms currently. 

Economists from academia and from cooperatives later showed numbers revealing the hard reality that the farm-well for pulling out more processor investment money is running dry.

In fact, Contente pointed out that the processor make allowance cost surveys include “return on investment,” something he said is lacking for dairy farmers in their milk prices. This was corroborated in later testimony by Cornell’s Dr. Chris Wolf and DFA’s Ed Gallagher.

During Dr. Mark Stephenson’s testimony Tuesday (Sept. 12), we learned that the current voluntary make allowance cost surveys include “opportunity cost” for plant assets used to make the products included in the survey.

“As farmers, we don’t get a return on investment,” said Contente. (And the numbers put up by expert witnesses show farmers don’t get ‘opportunity cost’ either.)

In fact, Gallagher said it’s important for USDA to consider the impact of its hearing decisions on farmers because if they can’t reinvest in their operations, it affects the infrastructure, the lending and the farmers’ access to capital — putting the milk supply at risk.

While Contente’s testimony focused on the mozzarella proposal supported by CDC, CFU, NFU and OCM, he also voiced their opposition to any increase in make allowances for processors.

On the latter, American Farm Bureau Federation agrees. AFBF also opposes any increase in make allowances based on voluntary surveys without first seeing results of a mandatory and audited processing cost survey. 

AFBF’s chief economist Roger Cryan on cross-examination asked Contente if NFU opposes the make allowance increases due to the voluntary and unaudited nature of the cost surveys. “Yes,” was his response. “Very good,” said Cryan.

The IDFA make allowance proposal would reduce farm milk prices by $1.25 per hundredweight initially and even more down the road.

For Class I producers, the net result is an embedded make allowance deduct as large as $3.60/cwt at current make allowance levels, which could rise above $5.00 in a few years if the IDFA proposal is approved. 

This producer loss is embedded in the Class I price even though Class I processors are not even asked by USDA to provide their cost data. 

Georgia milk producer Matt Johnson testified in support of NMPF’s various proposals, which include returning to the ‘higher-of’ Class I base price and increasing the differentials. On the issue of make allowances, he said the NMPF proposal is preferred because it makes smaller adjustments.

“I understand that make allowances are an important aspect in determining Federal Order class prices, and from time to time, there is a regulatory need to adjust them,” said Johnson; however, “my milk price will go down when make allowances go up. I ask that when increasing make allowances, the Secretary consider the impact on dairy farm milk prices… and profitability. NMPF has proposed more modest changes to the make allowances, which are projected to lower farm milk prices by about $0.50 per hundredweight (not $1.25).”

During cross-examination, Johnson was specifically asked by USDA AMS administrator Erin Taylor to explain how the make allowances affect him as his farm’s milk goes mainly to Class I markets in Florida and the Southeast, not to manufacturing.

“It’s all negative,” he replied. “The make allowances are used in the prices used to figure the base Class I milk price. I don’t know who gets that draw, but for me, it’s all negative.”

In addition to CDC’s proposal to add mozzarella, American Farm Bureau defended its proposal to add 640-lb block cheddar and bulk unsalted butter, and NMPF defended its proposal to remove 500-lb barrel cheddar.

Several days of detailed accounting testimony were heard, and the kicker was when representatives for Leprino and IDFA stated that barrels should be kept in the survey as a ‘market clearing’ product that is ‘storable’, but that bulk mozzarella should not be added because it’s a higher moisture, fresh cheese, not storable like cheddar, making it a product that is not a ‘market clearing’ product. (This idea of ‘what is market clearing’ was further explored this week as needing a new definition now that there is no dairy price support program or government storage of dairy products).

Interestingly, in cross examination, we learned that barrel cheese — which Leprino and IDFA want to keep in the survey — is also a relatively fresh cheese, not all that different from bulk mozzarella, as only 4- to 30-day-old barrel cheddar is reported. 

At one point, cheese industry representatives suggested the spread between blocks and barrels is used to price ‘basis’ and to price exported products, while block cheddar is mostly used to price other cheeses. Witnesses indicated some processors use barrel movement to price cheeses, such as mozzarella.

Some expert witnesses contended that other products can’t be added to the FMMO pricing formula because they are not traded on the CME. AFBF’s Cryan retorted that the CME should not be running this show, and he noted that dry whey wasn’t traded on the CME until after it was added to the FMMO formulas.

In fact, CME futures hedging, CME cash spot markets and the risk management tools that use these exchanges were a contentious point. Some witnesses said USDA formula changes will ‘disturb’ risk management contracts, and must be delayed 15 additional months after a USDA final decision to avoid such disturbance. 

On a similar note, economist Dr. Stephenson, while providing academic processor cost survey information this week, was cross-examined by economist Dr. Marin Bozic for Edge cooperative. Bozic asked Stephenson if the disturbance of risk management practices would ‘fit’ his understanding of ‘disorderly marketing’.

Stephenson replied: “No… I am not sure hedgers or speculators should be first or foremost in the minds of FMMO personnel. That’s not what we are here to do.”

-30-

Part Two: What drove rockier road for 2023 milk prices? Manure. Imports. Concentration.

— Along with more imports and shifts in cheese production, major manure-driven expansion in cheese-heavy Central U.S. put pressure on region’s ‘disrupted’ processing capacity

By Sherry Bunting, Farmshine, Updated in reflection from original publication in July 7, 2023 Farmshine

EAST EARL, Pa. — What has driven the rockier road for 2023 milk prices? Many things, and manure may be top on the list.

In fact, we’ll cover the ‘manure effect’ in a future article. But are we beginning to see the methane wheel-of-fortune behave with the ‘cobra effect’? (The British government, concerned about the number of venomous cobras in Delhi, offered a bounty for every dead cobra. Eventually, however, enterprising locals bred cobras for the income.)

This happened with greenhouse gases in the past. It happened with a byproduct gas of making refrigeration coolant. In 2005, when the UN Intergovernmental Panel on Climate Change began an incentive scheme. Companies disposing of gases were rewarded with carbon credits, which could eventually get converted into cash. The program set prices according to how serious the environmental damage was of the pollutant. (Like making cow methane seem like new methane when it’s not). As a result, companies began to produce more of the coolant in order to destroy more of the byproduct gas, and collect millions of dollars in credits. This increased production also caused the price of the refrigerant to decrease significantly.

With this prelude, let’s look back in retrospect on what I reported in the July 7, 2023 Farmshine when milk markets were in a tailspin hitting their low for the year — just 10 days before the gradual turnaround began.

As losses in the CME spot cheese markets and Class III milk futures markets continued through July 6, the Federal Order benchmark Class III price for June was pushed down to $14.91 per cwt. and protein down to $1.51/lb, July and August futures went well below the $15 mark, with Class III below $14.

Let’s look at the supply side of the January through June 2023 supply and demand equation.

Looking at the May Milk Production Report that was released in June, it’s hard to believe the bearish response we saw in milk futures and spot cheese markets that occurred based on a mere 13,000 more cows nationwide that month. It was a paltry 0.1% increase over a flat 2022, along with 11 more pounds of milk output per cow for the month (up 0.5% over flat 2022).

This flipped the switch from a gradually lower-than-2022 market to one that plunged sharply and suddently into the dumps – and all the analysts said: ‘We’ve got too much milk for demand.’ (In fact, two months later, processors are pointing to June and July milk dumping and $10 under class spot milk price as proof that USDA is setting Federal Milk Marketing Order minimum prices too high! — I digress).

As noted in Part One of this series that was published in the june 30 edition of Farmshine, other converging supply-and-demand factors plagued cheese markets that month until July 17 — despite basic fundamentals of these milk production reports not being all that bad. 

USDA Dairy Market News said spot loads of milk were being discounted in June by as much as $11 below the already abysmal FMMO Class III price in the Midwest. The milk dumping that reportedly began in May in Minnesota moved into Wisconsin through June and into July. The July 5th Milwaukee Journal Sentinel reported “Truckloads of fresh farm milk have been flushed down the drain into Milwaukee’s sewer system recently as dairy plants, filled to the brim, couldn’t accept more.” The story notes this had gone on for weeks, and the amount has declined to 5 trailer loads per week by the time The Milwaukee Journal Sentinel published its report.

For the price and milk dumping fallout, economists and analysts blamed the higher milk production (though it was modest on a national basis but huge in the Central U.S.). They blamed the higher cheddar cheese production (not accompanied by higher inventory), and they blamed the lower volume of exports (modestly below year ago on a year-to-date solids basis). 

Globally, milk production was up (it is declining this fall), they said, suggesting U.S. prices needed to get below the falling global prices in order to recover more export volume (instead of dumping in the sewer). Well, they got what they wanted as the U.S. prices dropped like a rock through June until the turnaround on July 17.

Of course, no one (but Farmshine) mentioned the rising imports that were reported in Part One of this series.

Looking for context on the imports, we reached out to retired cooperative executive Calvin Covington, who follows these things on a total solids basis and has been watching the whey market as a leading milk market indicator. We learned that his calculations on a total solids basis, pegged January through April 2023 imports of dairy products into the U.S. at levels 15% higher than a year ago!

“The 15% equals 39.3 million lbs. more solids,” Covington wrote in an email response to a Farmshine question. “Most of the imports are coming from Europe. Dairy demand is very weak in Europe, consumers have less money to spend. Those milk solids are moving out of Europe.”

Noted Covington in June: “On a total solids basis, ending dairy stocks as of April 30th are 3% higher than last April. The 3% equals 61.5 million lbs. more solids.”

This means the 15% increase in January through April dairy product imports — on a total solids basis — were equal to more than half (63%) of the 3% increase that was reported in April domestic ending stocks of all dairy product inventories on a total solids basis.

Think about that for a minute. Product came in and was inventoried while domestic milk was dumped, and producer prices were crushed so that the domestic price could fall below the global price so then the U.S. dairy exports could increase? It makes the head spin.

Class I sales were down during this time, especially in the Midwest where some fluid plants have closed. Fresh Italian cheese production was down, and that’s a big one for Wisconsin. Together these factors pushed more milk to make more American cheese at that time, some of it delivered to consumers in smaller packages (rationing). 

A wrinkle in the market-fabric comes from the dairy foods complex importing higher volumes, and there are the fake bioengineered microorganisms from which excrement is harvested and described as ‘dairy casein or whey protein without the cow.’ These analogs are being heavily marketed to large food manufacturers making dairy and bakery products as carbon-footprint-lowering dairy protein ‘extenders.’

So much so, that National Milk Producers Federation recently sent a letter to FDA asking the agency not to make the same mistake with these fake products as has been made with plant-based frauds.

However, as we look at the modest milk production increase for the first half of 2023, overall, and compare it to 2022, the total comparison was flattish then and it is declining now as we move toward Q3.

But there’s another major twist to this supply-demand equation:

The location and purpose of dairy expansion is undergoing accelerated transformation on a geographic and structural basis. This transformation is part of the “U.S. Dairy transformation” that the national dairy checkoff has promoted in its Pathways to Net Zero Initiative… and it is affecting the milk pricing for all U.S. dairy farmers, everywhere.

Here’s the problem: Milk production in the Central U.S. has expanded by much more than the national average. 

Even University of Wisconsin economics professor emeritus Bob Cropp noted in his writing after the May report that growth in the Midwest — where cheese rules the milk check — was outpacing processing capacity, and the existing capacity to process all this milk was being reduced by labor and transportation challenges.

The concentrated expansion of milk production in the Central U.S. has been accelerating since 2018, but a new paradigm is now in effect: New concrete is being poured in the targeted growth areas driven more by manure, than by milk, and new dairy processing plant construction that is completed and in the works is targeting the same areas.

This is creating a production bubble that is a flood within calmer seas.

Some are calling it the California RNG gold-rush as developers construct Renewable Natural Gas (RNG) projects — especially on new large dairies — for the California RNG market and to collect the low-carbon-fuel credits for the California exchange and other exchanges that are and will be emerging, thanks to the USDA Climate Smart wheel-of-fortune.

We’ve heard the national dairy checkoff managers from DMI talk about profitable sustainability, markets for manure, promotion of other revenue streams for dairy farms as part of the mantra the checkoff has assumed for itself as speaker for all-things-dairy for all-dairy-farmers on what is “sustainable” for the industry.

When the Net-Zero Initiative was launched — along with DMI’s industry transformation plan — it was something that had been in the works since 2008 and emerged more prominently in the 2017-21 period when the former and current U.S. Ag Secretary Tom Vilsack did his stint as top-paid DMI executive, presiding over the U.S. Dairy Export Center (USDEC) under DMI’s umbrella and as a top-talker on the Innovation Center for U.S. Dairy, also under DMI’s umbrella. 

All three: DMI, USDEC, and Innovation Center for U.S. Dairy are 501c6 non-profit organizations contracted to spend checkoff dollars. A 501c6 is essentially a non-profit that can lobby policymakers, whereas the 501c3 National Dairy Board cannot.

In 2020 and 2021, the Innovation Center — filing tax returns under the name Dairy Center for Strategic Innovation and Collaboration Inc. — doubled its revenue from around $100 to $150 million annually to $300 to $350 million.

We all heard it, read it, thought about it – maybe – that the checkoff was morphing into a facilitator for the transformation of the dairy industry led by manure-promotion, not necessarily milk promotion, with the mantra of feeding the world, being top-dog internationally, and meeting international climate targets with a Net Zero greenhouse gas pledge. (That pledge and the methane calculation are another story Farmshine readers are aware of, but we’ll leave that big driver off the table for this discussion.)

Here we are, now seeing an industry being created from within the broader dairy industry with new production driven by manure, in regions where new or expanding cheese, whey and ingredient plants are being located and potentially displacing production from plants and farms elsewhere that are not tied-into this manure-to-methane wheel-of-fortune using dubious science and math to overpeg a cow’s global warming impact.

While that production bubble is building in targeted growth regions with cheese-heavy milk checks, driven in part by manure-focused expansion, it bursted at the seams this summer due to a processing capacity bottleneck, compounded by supply chain disruptions and a sudden decrease in the production of fresh cheese at other plants and a sudden 18% decline in the amount of milk processed for Class I fluid use in the Upper Midwest.

Here’s the sticky wicket. A review of the 2022 end-of-year milk production report along with reports issued in the first half of 2023, revealed that, indeed, the Central U.S. was “awash in milk.” 

Zooming in on the milk production reports, we see South Dakota continuing its fast and uninterrupted growth — up 15.5% for 2022 vs. 2021, and up 7.4% Jan-May 2023 vs. 2022 — having leapfrogged Vermont, Oregon and Kansas and closing in on Indiana in the state rankings. 

Neighboring Iowa leapfrogged Ohio in 2022 with a 4.7% gain in milk production Jan-May 2023 vs. 2022. Number 7 Minnesota grew again after taking a breather with a 0.6% decline in 2022, then increasing 2% in production Jan-May 2023. 

The tristate I-29 corridor, where cheese processing capacity has been expanding, was up 3.3% in milk production collectively with 19,000 more cows Jan-May 2023. Add to this the 1.3% increase in number 2 Wisconsin’s May milk production, and we saw the quad-state’s collective increase was 203 million pounds of additional milk in the region vs. year ago in May, although Wisconsin’s contribution came from 3000 fewer cows, according to USDA.

Just west in number 3 Idaho, production jumped 3.1% with 7,000 more cows Jan-May 2023.

To the east in the Michigan-Indiana-Ohio tri-state region — where the large new cheese plant in St. John’s, Michigan is fully operational — collective milk output was up 2% over year ago with 11,000 more cows. In 2022, this tri-state region was down 2 to 3% for the year compared with 2021.

Number 5 New York made 2.1% more milk with 7,000 more cows in May vs. year ago, with most of this expansion in the western lake region. 

Number 1 California shrank milk production by 0.7% in May with 2000 fewer cows, and number 4 Texas flattened out its multi-year accelerated growth curve to make just 0.8% more milk in May than a year ago with just 1000 more cows, largely affected by the devastating Texas barn April fire resulting in the loss of around 20,000 cows. 

Neighboring New Mexico continued its multi-year downward slide, ranked number 9 behind a flat-to-slightly-lower milk output in number 8, Pennsylvania. 

Milk production in New Mexico fell 3.8% in May vs. year ago with 10,000 fewer cows. This followed an 8.4% decline in milk production and a 30,000-head cut in cow numbers for the year in 2022. Producers there cite well-access limitations, severe drought, high feed costs with reduced feed availability, as well as receiving the rock-bottom milk price as the reasons dairies in New Mexico are closing or relocating. 

With all of these factors in play, the production reports show a clear paradigm shift in how the dairy industry expands via transformation. It is being driven to where feed is available and milk output per cow is higher, and it’s now being driven by a non-milk-related factor: MANURE for the RNG ‘goldrush’

A saving grace is cattle are in short supply, with replacements bringing high prices. This fact is slowing the bubble, production is declining now, and prices are recovering from those unanticipated lows.

-30-

Fluid milk processors say they can’t recoup higher protein value

NMPF, NAJ say higher solids worth more nutritionally, Seek FMMO updates to avoid misalignments and disorderly marketing

Calvin Covington (left) for Southeast Milk and Peter Vitaliano for National Milk Producers Federation testified on what the outdated skim milk component standards mean in terms of underpaying farmers and eroding producer price differentials (PPD), leading to disorderly marketing. This occurs because the skim portion of the milk that is utilized in manufactured products (Class III and IV) is paid per pound of actual protein, solids nonfat and other solids; whereas the skim portion of the milk bottled for fluid use (Class I) is paid on a per hundredweight basis using the outdated standard skim solids levels. The fat portion is not an issue because it is already paid per pound in milk class uses. Screen captures, hearing livestream

By Sherry Bunting, Farmshine, Sept. 8, 2023

CARMEL, Ind. – The national Federal Milk Marketing Order hearing completed two weeks of proceedings, so far, in Carmel, Indiana. The entire hearing is expected to last six to eight weeks, covering 21 proposals in five categories.

Picking up the livestream online, when possible, gives valuable insight into a changing dairy industry and how federal pricing proposals could update key pricing factors.

The first week dug into several proposals to update standard skim milk components to reflect today’s national averages in the skim portion of the Class I price. 

Here is a bite-sized piece of that multi-day tackle.

National Milk Producers Federation (NMPF) put forward several witnesses to show what the outdated component levels mean in terms of underpaying farmers, and how paying for the skim portion based on outdated component levels has eroded producer price differentials (PPD), leading to disorderly marketing.

IDFA’s attorney Steven Rosenbaum grilled NMPF economist Peter Vitaliano on this. He tried on seven attempts to establish that the fat/skim orders in the Southeast don’t have component levels as high as the national average, suggesting this change would “overpay” producers in some markets.

In his questioning, Rosenbaum stressed that fluid milk processors can’t recoup the updated skim component values if those components do not “fill more jugs.”

Vitaliano responded to say that protein beverages are a big deal to consumers, and some milk marketing is being done on a protein basis. Rosenbaum asked for a study showing how many fluid processors are actually doing this.

Attorneys for opposing parties kept going back to this theme that the skim solids should not be updated because the FMMOs are based on “minimum” pricing. They contend that processors can pay “premiums” for the extra value if they have a way of recouping the extra value by making more product or marketing what they make as more valuable.

Vitaliano disagreed, saying that even though many processors do not choose to market protein on the fluid milk label, “more protein makes fluid milk more valuable to consumers.”

Attorney Chip English went so far as to ask Calvin Covington on the stand: Why should my clients (Milk Innovation Group) have to pay more for the additional solids in the milk when they are removing some of those solids by removing the lactose?

“Consumers don’t want lactose,” English declared.

Covington, representing Southeast Milk and NMPF, responded to say: “I don’t know that to be true. It is unfair to suggest all.”

Bottomline, said Covington, raising standard skim solids to reflect the composition of milk today vs. 25 years ago adds money to the pool to assist with the PPD erosion so that Federal Orders can function as they were intended and so producers are paid for the value.

As English further questioned whether consumers even care about the higher skim solids and protein levels of milk today, Covington replied: “Skim milk solids have a value in Class I, or fluid milk. People don’t buy milk for colored water. The solids give it the nutritional value. That’s the reason they buy milk. That’s why FDA set minimum standards in some states. Why would you drink milk if not for the nutritional value?”

He also pointed out that the increase in solids nonfat over the past 20-plus years has improved the consistency of lower fat milk options. As noted previously, the milkfat is a separate discussion and is not included in this proposal because farmers are already paid per pound for their actual production of butterfat in all classes, including Class I.

Under cross examination, Covington explained that the Class I price in all Federal Orders pays for skim on a standardized per hundredweight basis and pays for fat on actual per pound basis. Meanwhile, the manufacturing classes pay for both skim and fat on a per pound of actual components basis. 

As skim component levels have risen in the milk, the alignment of Class I to the manufacturing classes narrows because of the differences in how the skim is paid for. When this happens, it becomes more difficult to attract milk to Class I markets. That’s one example of disorderly marketing. PPD erosion and depooling of more valuable manufacturing class milk is another example. 

Covington explained the impact of this misalignment on moving milk from surplus markets to deficit Class I markets, that the lower skim value becomes a disincentive.

Vitaliano explained the depooling issue as “creating disorderly marketing conditions also, and great unhappiness when one farm is paid a certain price and another handler pays a different price (in the same marketing area). That’s disorderly unhappiness for the Federal Order program,” he said.

He noted that the fundamental reason for pooling is to take the uses in a given area with different values to achieve marketwide pooling where producers in that Federal Milk Marketing Area are paid similarly, regardless of what class of product their milk goes into.

“This removes the incentive for any one group to undercut the marketwide price to get that higher price (for themselves),” he said. “The Orders create orderly marketing with a uniform price. Depooling undermines that fundamental purpose that is designed to create orderly marketing.”

Either way, whether indirectly paying to bring supplemental milk into Class I markets from markets with higher manufacturing use, or in the case of depooling, the dairy farmers end up paying for the fallout from this erosion of the PPD.

Since the beginning, even before 2000 Order Reform, figuring the Class I base milk price had to begin somewhere, according to Covington. Federal pricing has always used the manufacturing class values in determining that base fluid milk price.

The trouble today is that Class III and IV handlers pay farmers per pound of actual skim components in the milk they receive, while the Class I handlers pay per hundredweight based on an arbitrary outdated national average skim component standard. Thus, the “opportunity cost” of moving this now higher component milk to manufacturing classes that pay by the actual pound of protein, for example, instead of by the old standard average protein levels is not accounted for in the Class I price that still uses the old standard average levels.

Pressed again on how it makes sense to raise Class I prices by raising the component level of the skim to more adequately reflect the national average today, Covington said: “It adds to the nutrition, and I stand by that. In proposal one, the price will go up (estimated 63 cents per cwt or a nickel per gallon). I am comfortable charging that extra price to Class I processors.”

Attorney English, representing MIG, retorted that, “The handlers who buy milk and then by adding a neutralizing agent remove the lactose, they’re going to pay more for the milk that they then have to process to subtract the lactose.”

Covington responded that, “There are consumers who think about lactose. There are consumers who buy lactose-free products, yes, because it is on the shelf, but it’s not all consumers.”

On the higher protein, English asked Covington how Class I processors are supposed to monetize that protein in a label-less commodity, a commodity that is declining in its share of total milk utilization?

“We are still selling 45 billion pounds of packaged fluid milk (annually) in this country,” said Covington. “Consumers wouldn’t buy that 45 billion pounds if it wouldn’t have some nutrition.”

English argued that milk is sold as whole, 2%, 1% and non-fat. It is not sold by its protein, so isn’t it “so highly regulated in ways that alternatives are not that any increase in price hinders sales of fluid milk?”

Covington acknowledged that, “yes, it is regulated, but I’m not convinced that this proposal will hinder fluid milk sales. Again, (higher components) add to the nutrition and I stand by that.”

Opponents kept coming back to these value questions, while proponents focused on the price alignment issue and orderly marketing.

To link up with the hearing livestream 8 to 5 weekdays, to read testimony and exhibits, and to respond to the virtual farmer testimony invitations made every Monday for the following Friday, visit the Hearing Website at https://www.ams.usda.gov/rules-regulations/moa/dairy/hearings/national-fmmo-pricing-hearing

-30-