Signal? What signal? Is anyone looking at the actual calendar and real costs?

(Excerpts from Sherry Bunting’s Milk Market Moos column in the Apr. 25 and May 2 Farmshine. Get the full Farmshine delivered weekly at a low subscription rate at farmshine.net)

The current dairy trade is ignoring the calendar composition on key reports — adding to bearish sentiment that has forced key dairy commodity prices lower and pushed mailbox milk prices below year ago, despite earlier 2025 forecasts had suggested a raise this year for dairy farmers.

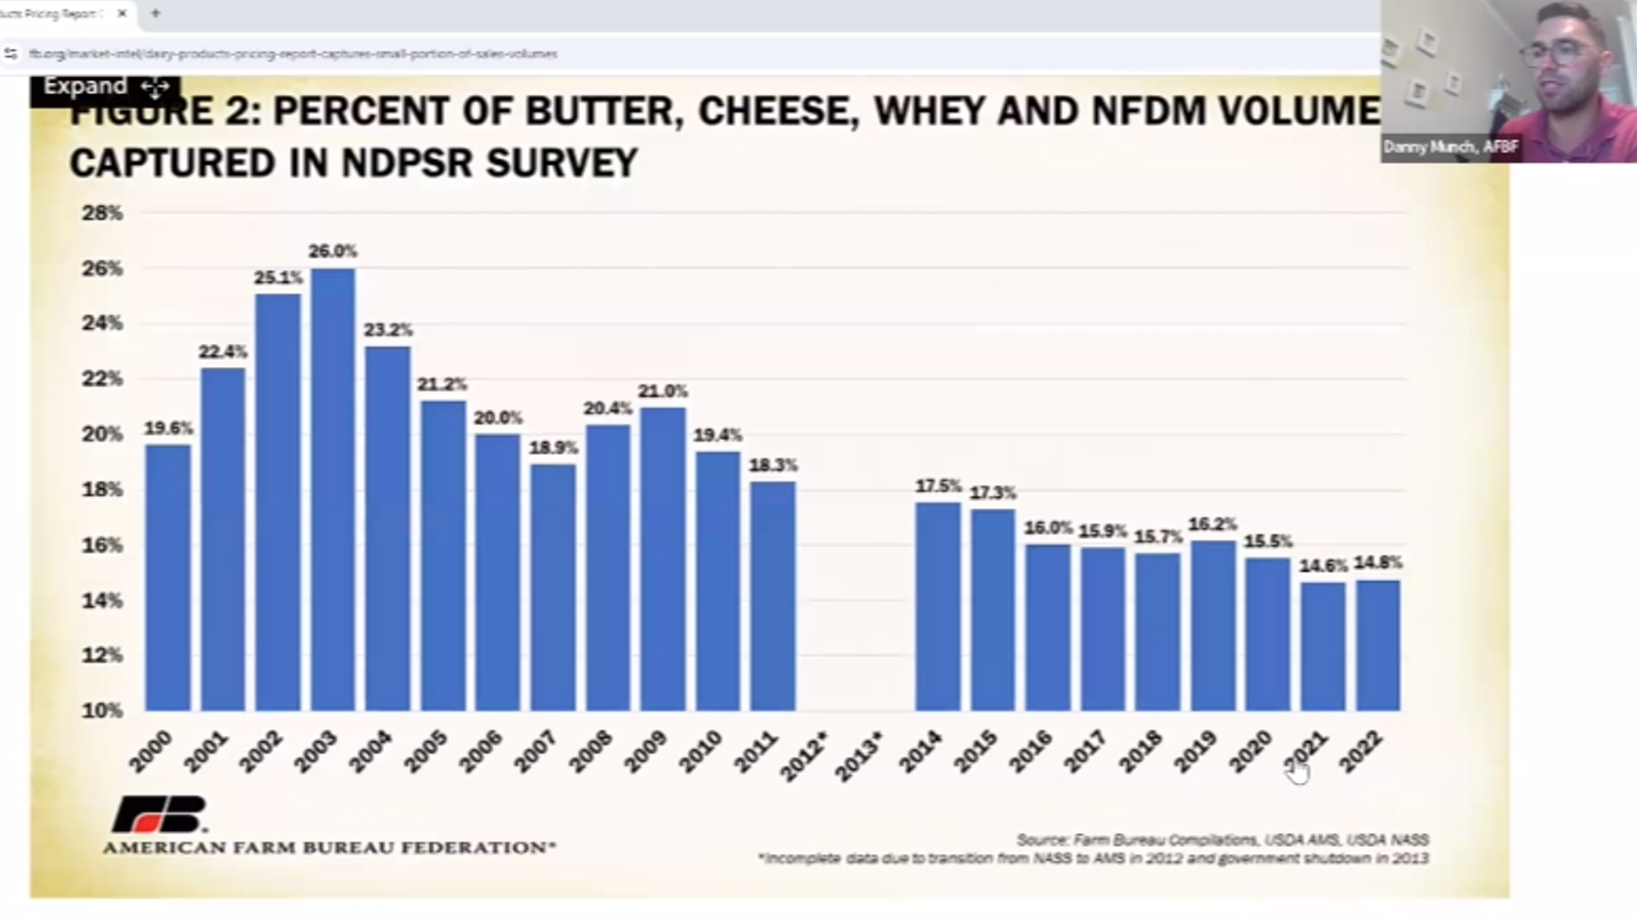
Cheese inventory was down 4% year-on-year (YoY) at the end of March, according to USDA’s April 24 Cold Storage Report. The percentage of the YoY deficits did shrink from January to February and February to March, so some in the trade believe this means stocks are building, and that this trend will worsen as plants ramp up newly commissioned capacity as the year progresses.

But the trade is ignoring the calendar composition. Daily production of cheese actually increased (leap-year-adjusted) during the first quarter of 2025, making this small erosion in the March margin of YoY deficit less worrisome in its reality.

Let’s look at the February Dairy Products Report released on April 3. It stated to the trade that cheese production was lower YoY. But this statistic did not adjust for the extra leap day on the February 2024 calendar. When we adjust the February figures to reflect the extra day of processing last year, we see a much different picture.

The leap-year-adjusted total cheese production for February was UP (not down) 1.3% YoY. American-type cheese production in February was UP 2.2% YoY. And the leap-year-adjusted production of fresh Italian cheeses (made to order) was UP 3% YoY. Despite heavier cheese production, we still had an inventory deficit in February and again in March. We won’t see March cheese production totals until the USDA releases them on May 6.

Bottomline, the leap-year-adjusted numbers show: U.S. manufacturers — in reality — are making more cheese YoY and storing less cheese YoY.

Let’s look at butter. Stocks were up 4% YoY at the end of March. This compares to a 17% overage reported at the end of February, which had one less day to eat it and sell it vs. year ago. Still, the March stockpile was the second largest March inventory in three decades.

But again, let’s review the calendar! The 2025 Easter and Passover holidays were much later than normal this year — occurring past the mid-point of April. How much holiday butter was moved after the March inventory report? We’d wager on this! USDA Dairy Market News mentioned heavy retail featuring of butter and cheese in its weekly reports for weeks ending April 4, 11 and 18. We will reserve judgement on butter sales and inventory until the March production totals are reported on May 6 and end of April inventory figures are released on May 23.

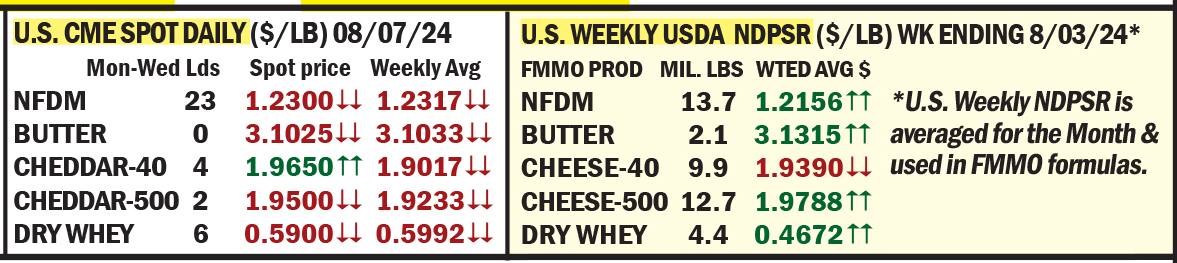
The butter trade, meanwhile, has reacted bearishly to the YoY comparisons without considering calendar composition factors. Today’s wholesale butter pricing on the CME spot market shows U.S. butter can be bought by domestic and international buyers at a substantial 40 to 45% discount compared with the uptrending Global Dairy Trade indexes. Was that severe discount necessary to move it? Or was it speculative and opportunistic?

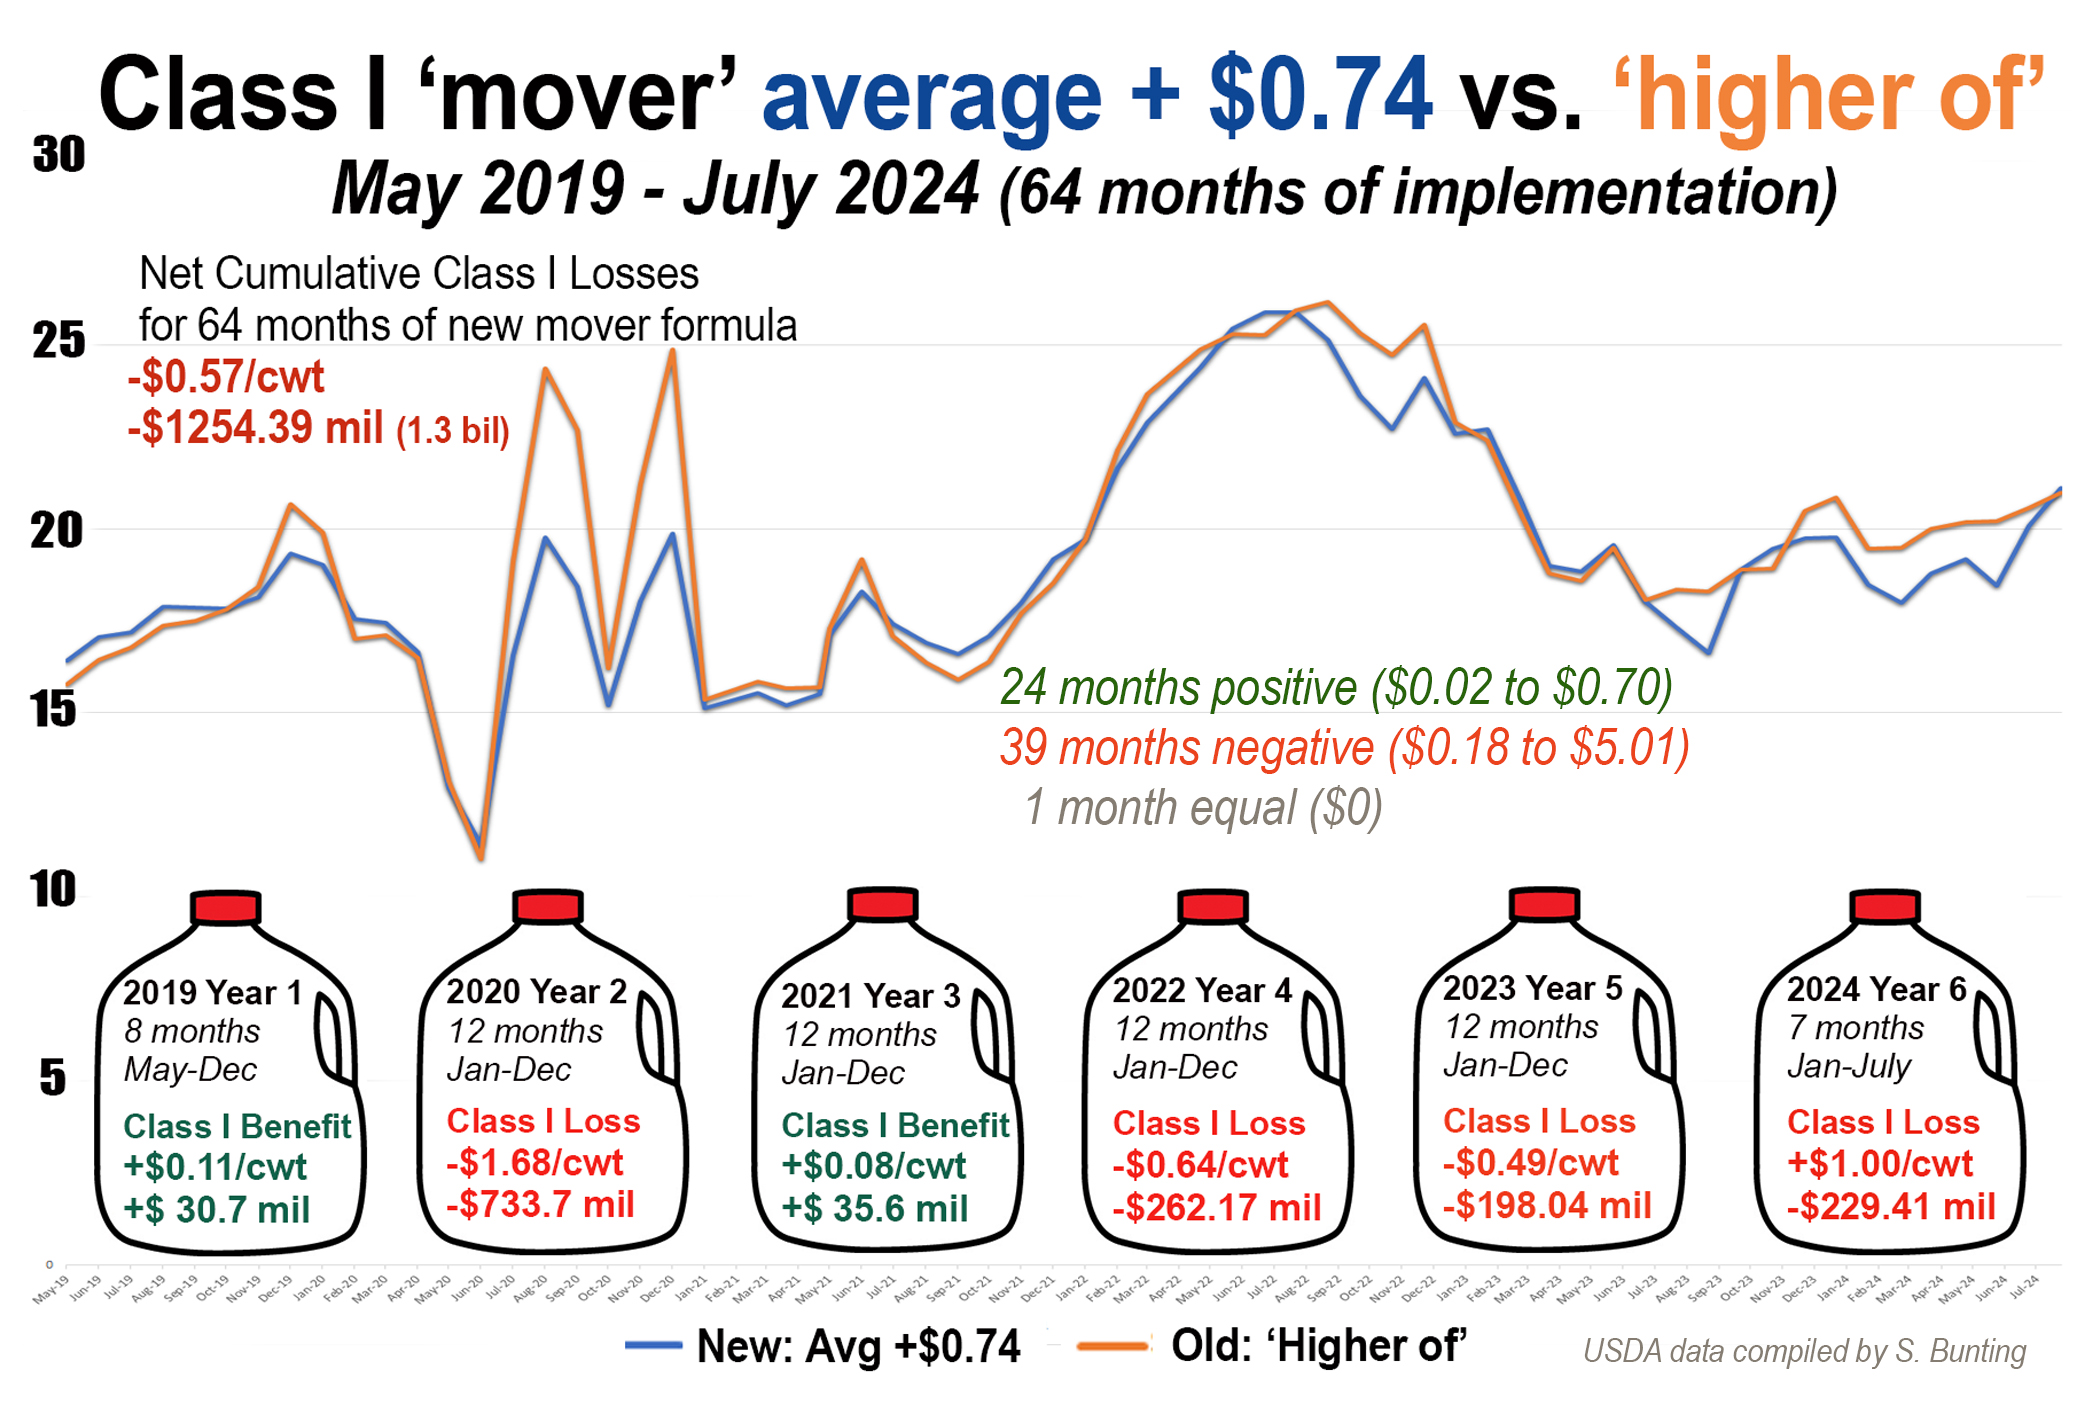
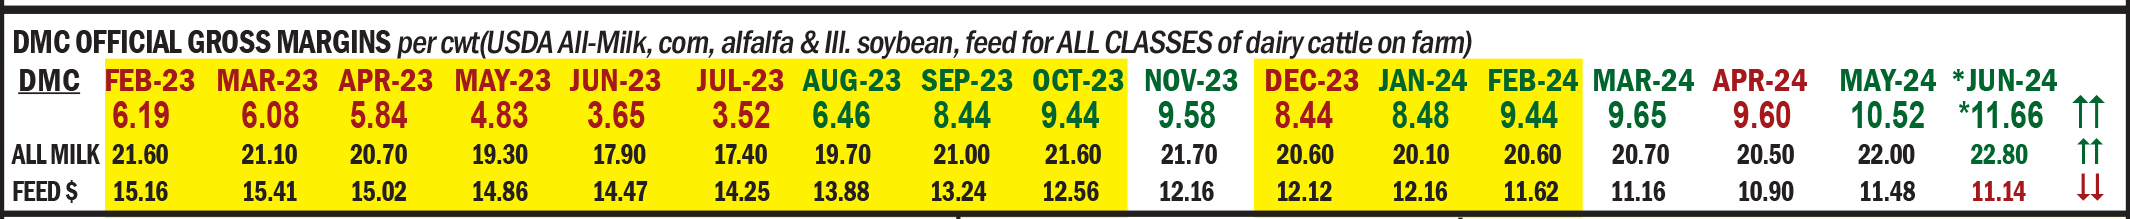
Meanwhile, farmers will pay the piper (Fig. 1) while processors bemoan the slow response of dairy farmers to what they describe as “a market signal for milk production growth.”

Really? Maybe try checking the batteries on those lights believed to be lit in the Bat Signal. By no means are producers flooding the market with milk, and yet here we are with the 2025 milk price forecast lowered nearly $2 from the January WASDE to the April WASDE.

Meanwhile, processors wonder why dairy farmers are making so many beef crosses instead of dairy heifers, which is keeping a lid on milk growth by large throughput dairies to fill new processing expansions. Dairy farmers began managing their heifer inventories with beef crosses in 2015. Ten years later, American Farm Bureau economists estimate 72% of dairies are doing it as beef semen sales to dairies have jumped from indicating over 111,000 beef-on-dairy calves in 2015 to 3.2 million in 2024.

The real all-cost profit margin on that beef-on-dairy wet calf is larger than the margin on the milk from its dam all year. It’s math.

U.S. dairy trade paradigm shift underway

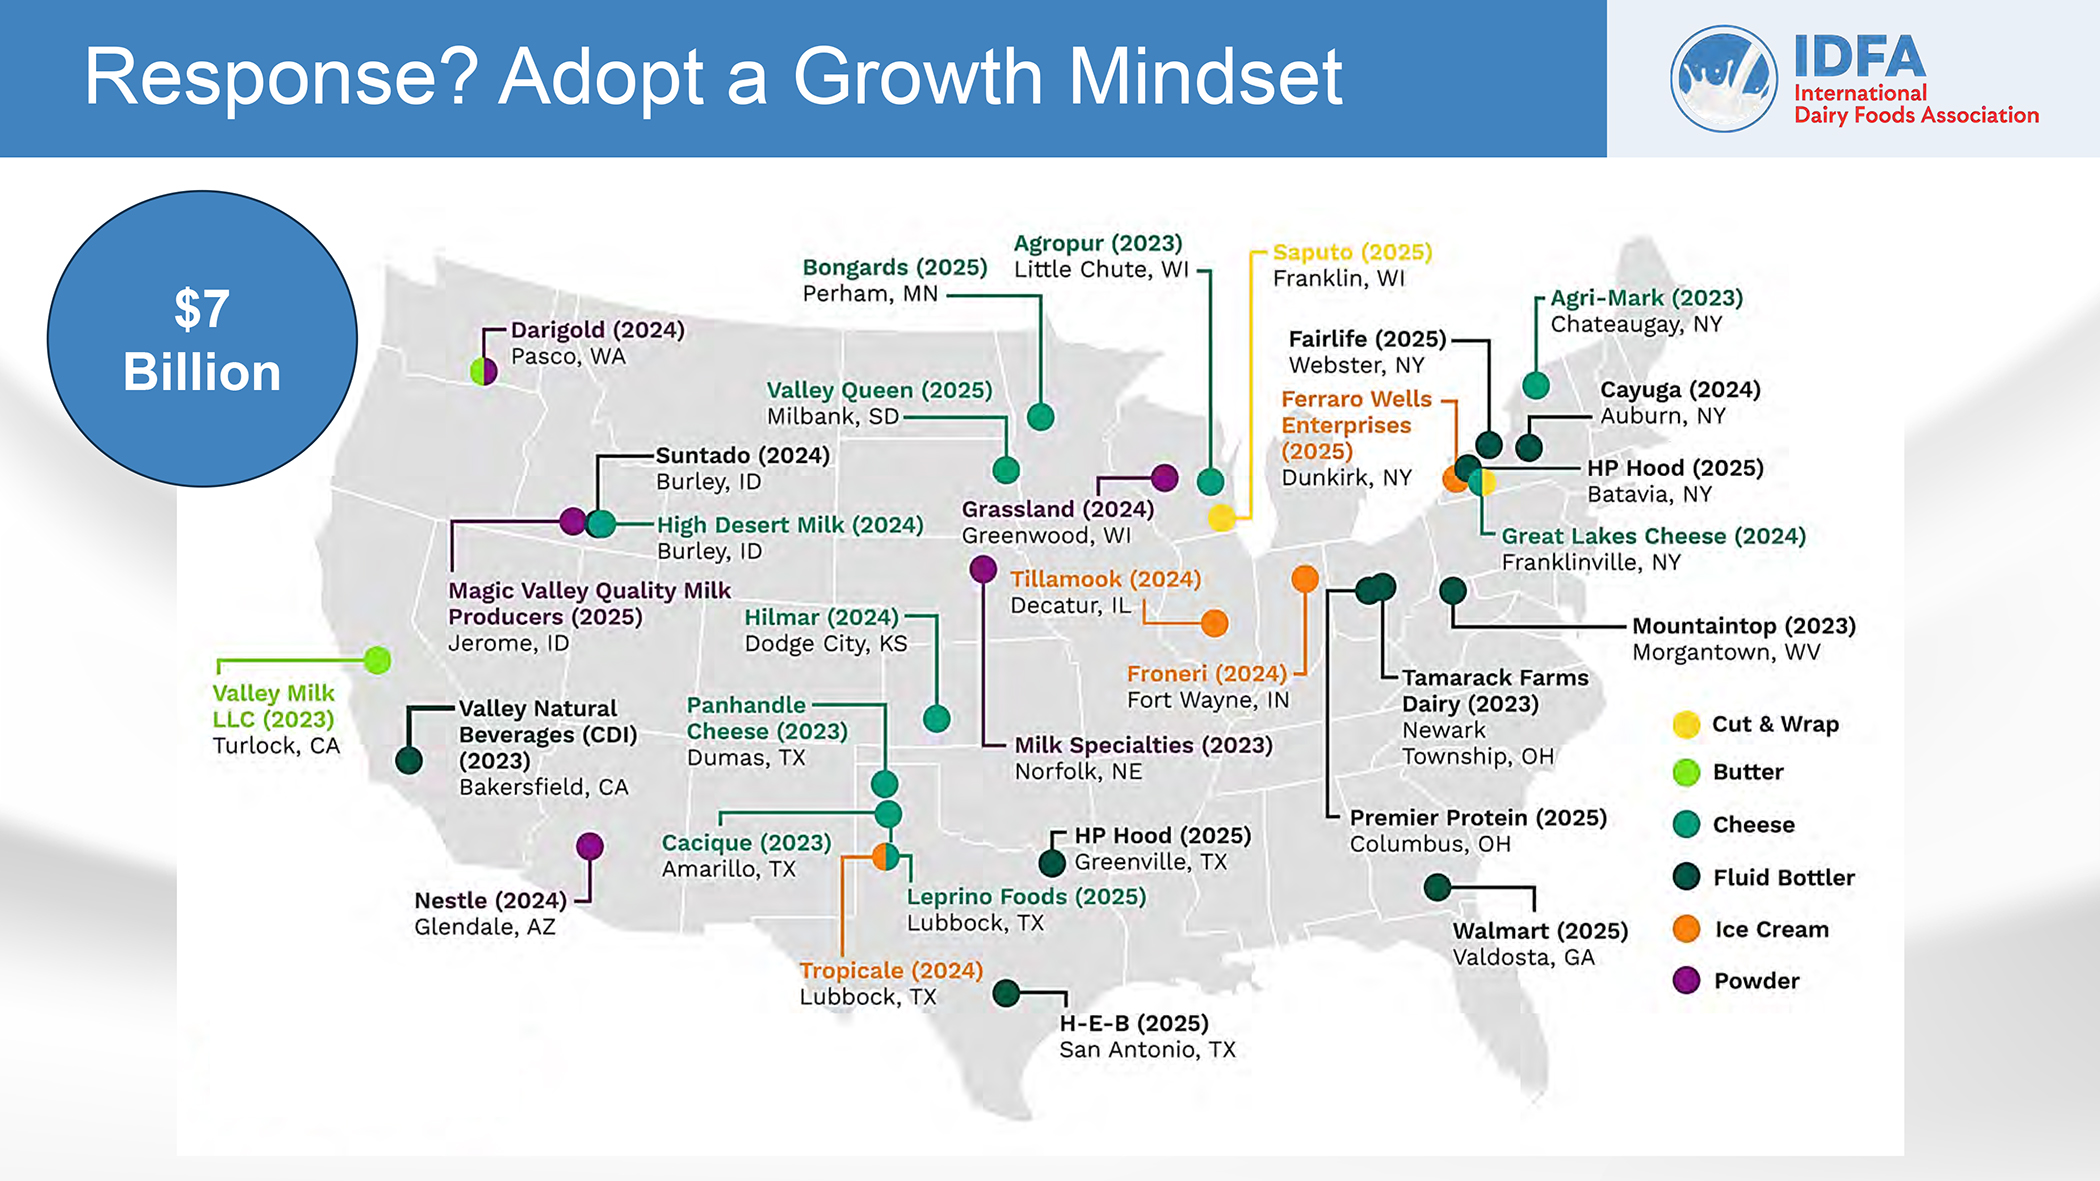
Several market factors are converging simultaneously: 1) The new tariff uncertainty; 2) The dairy trade’s preparation for new FMMO formula rules on June 1st; 3) Historic foreign investment in U.S. dairy processing growth with sights set on growing international sales as low-cost-producer; and 4) U.S. dairy product prices are at steep discounts below the Global Dairy Trade (GDT).

U.S. dairy has gone from running trade deficits on a value and volume basis before 2007 to running significant trade surpluses, especially from 2014 to 2022. In 2023-24, dairy exports flattened alongside growth in dairy imports from 2021 to 2024. On a volume basis, U.S. dairy exports represented 16% of U.S. milk production on a milk solids equivalent (MSE) basis for 2023 and 2024. This is four times the volume of imports, which grew to 4.2% MSE in 2024. Tariffs, a weaker U.S. dollar, and discounted U.S. product prices should lower U.S. dairy imports in 2025.

On the export side, the dairy trade paradigm has shifted to exporting higher-value products like cheese, and doing so as low-cost producer. 2024 saw record volumes of exported cheese (+17%) and butter (+7%). This continued into 2025 with Jan-Feb cheese export volume up 7% YoY, butter up a whopping 236%.

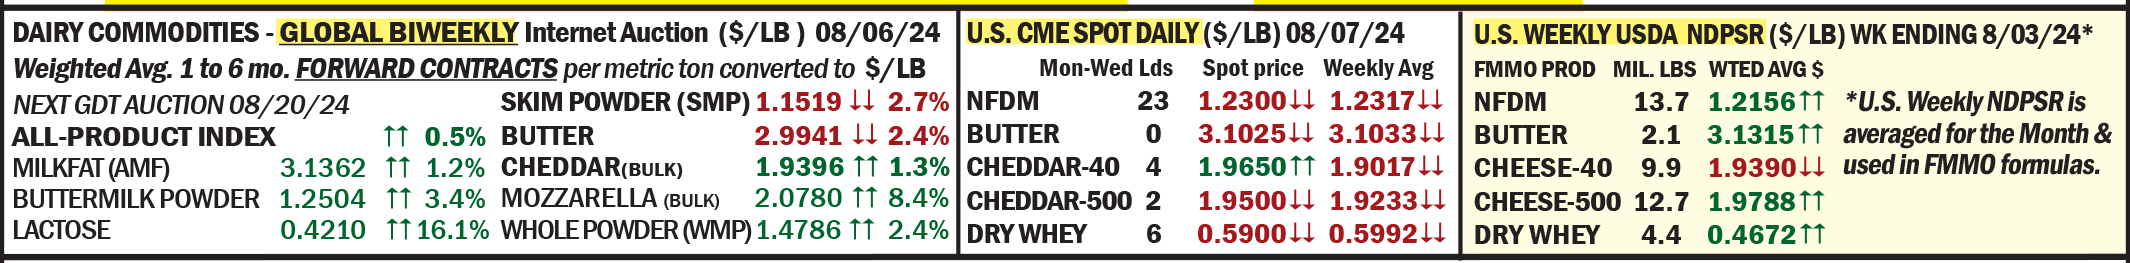
In its Apr. 18 weekly report, USDA Dairy Market News stated: “Demand for butter from international buyers is strong.” No surprise, considering U.S. butter at $2.32/lb is discounted 45% at $1.16/lb below the global butter price index of $3.48/lb (Fig. 3). U.S. cheese is attracting international interest at a nearly 30% discount as U.S. 40-lb block cheddar ($1.76/lb) undersells the global index ($2.32/lb) by 55 cents per pound (Fig. 2).

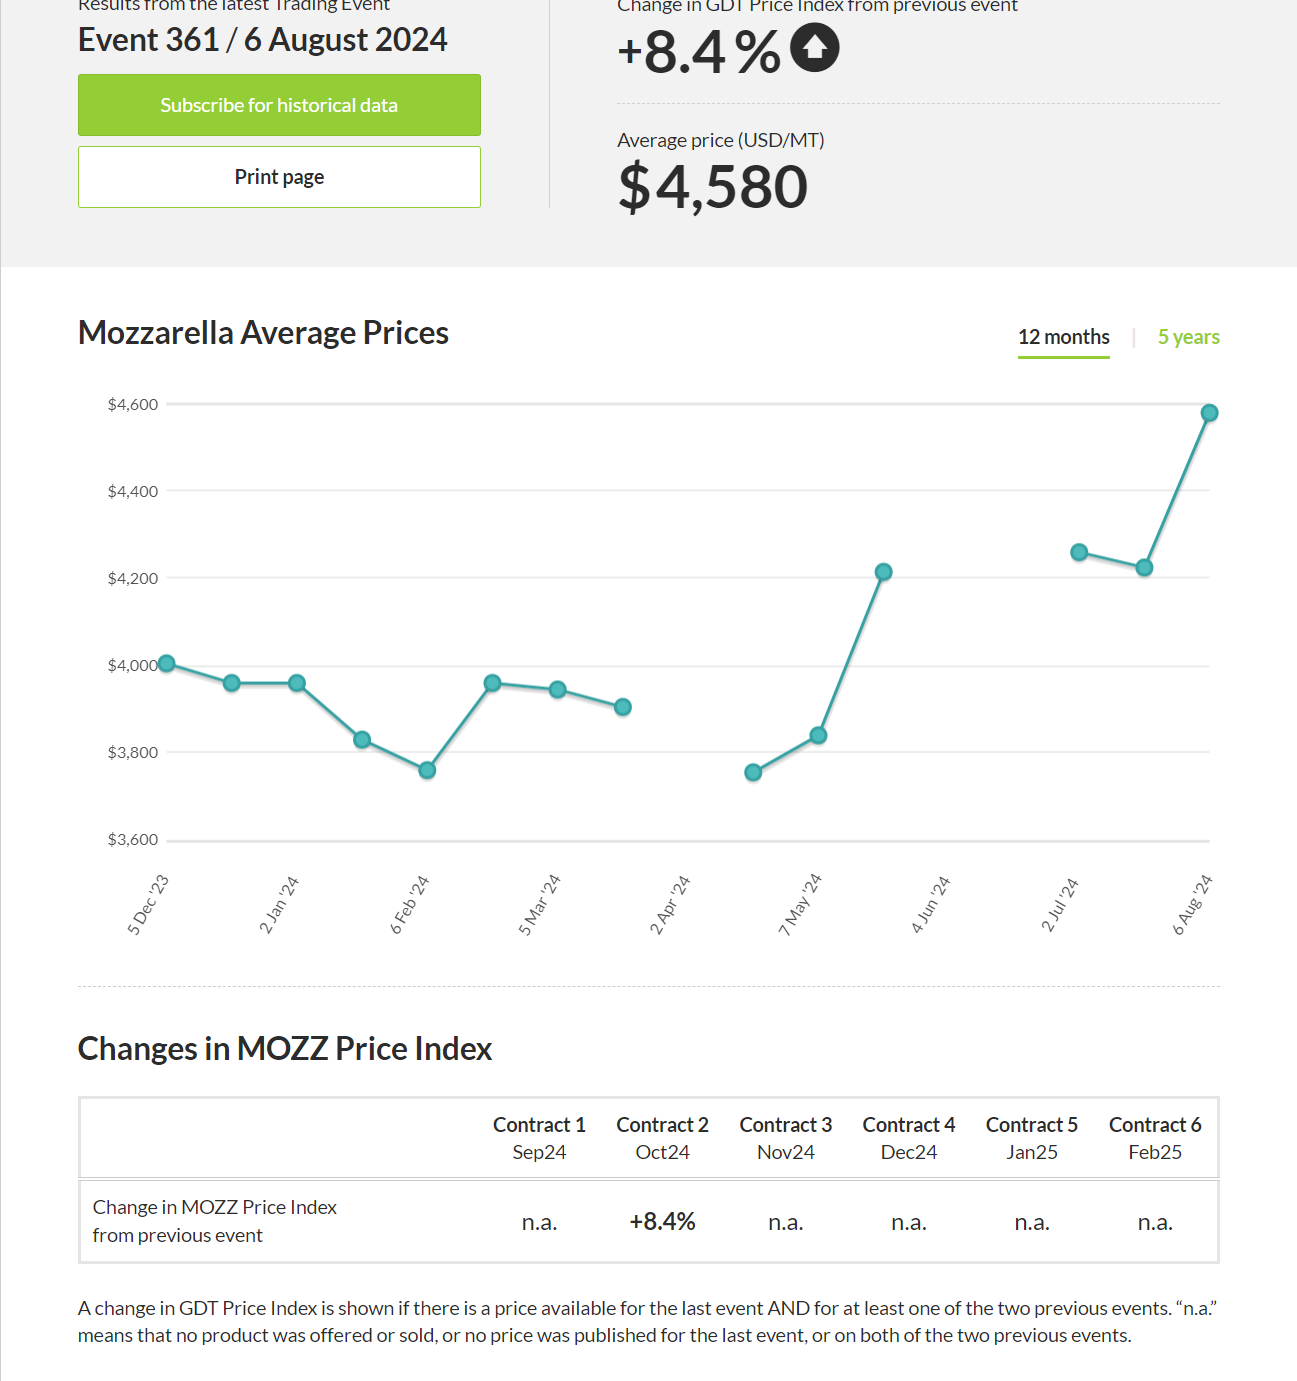
Meanwhile, the GDT index on whole milk powder (WMP) was higher for the past few sessions and the global pulse market in between pegged WMP at its highest price level in three years.

These global market trends would normally boost U.S. dairy markets. Not so today. The undercurrent of drilling down the price to be low-cost-producer of high-value overseas sales categories began last summer and has been exacerbated in Q1 2025 by the threat of retaliatory tariffs. At these discounts, plenty of U.S. product can move offshore, tariff or no tariff. If the market suppression has been in vain, meaning no retaliatory tariffs from trading partners for cheese, and in relation to domestic retail prices that may or may not come down — someone stands to make a lot of money, and it won’t be the farmers.

March & Feb. milk production up 0.9%

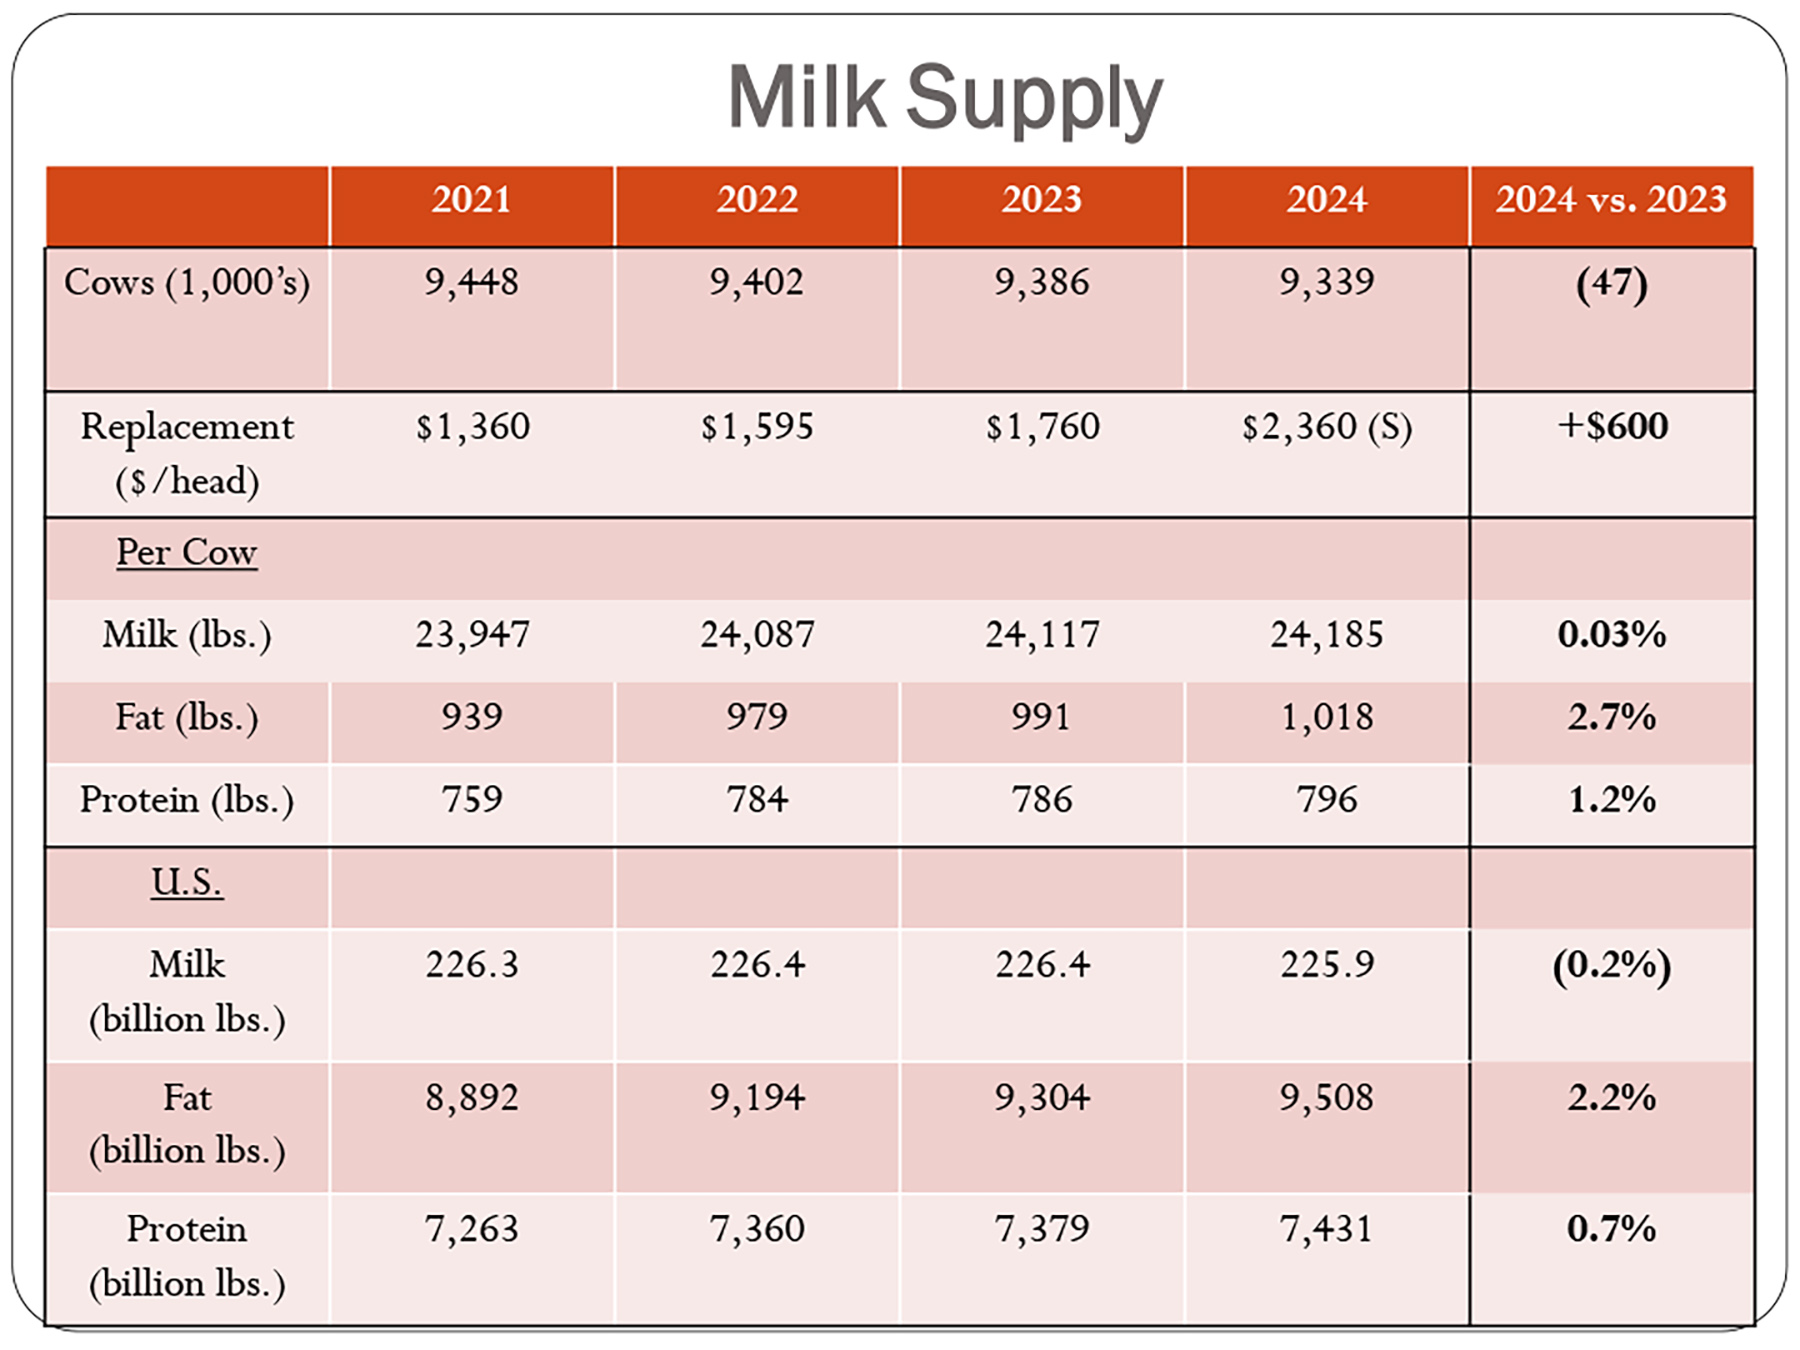
USDA’s March Milk Production Report on Apr. 22 tallied 19.8 bil. lbs, up 0.9% year-on-year (YoY). Feb. was revised higher, up 0.9% also (leap-year-adjusted). Milk output per cow grew by 0.3% YoY in March, and U.S. dairy farms milked 57,000 more cows YoY.

No. 3 Texas added 45,000 head, with milk up 9.4% YoY. For the first time in 4 years of major losses in production and cow numbers, neighboring New Mexico reported 2000 more cows making 1.5% more milk. South Dakota added 9000 cows and 5.1% more milk. No. 4 Idaho milked 29,000 more cows making 4.3% more milk. Kansas added 8000 cows with 4.4% more milk. No. 1 California continued lagging, down 2.1% as bird flu continues, though it is diminishing. No. 2 Wisconsin was up 0.1%, with 5,000 fewer cows. In the Mideast, 2000 more cows were milked, collectively, with Michigan’s milk up 1.3%, while Indiana and Ohio both gained 0.8%.

In the East, No. 4 New York increased production 1.3% with no added cows. No. 8 Pennsylvania as well as Virginia had milk production equal to a year ago, and both milked 1000 fewer cows. Vermont’s output grew 0.5% with 2000 fewer cows. Georgia grew by 4.1%, without adding cows. Florida declined 3.6% with 5000 fewer cows.

Even with two consistent back-to-back gains just shy of 1% in U.S. milk production, growth is still around half the annualized average growth curve that the U.S. dairy industry was on pre-Covid. Milk production growth, post-Covid — whether by cow numbers, output per cow or even the big jump in component levels — still lags the overall pre-Covid growth curve of 1.8% per year.

This was explored recently in a Milk Production webinar by National Milk Producers Federation in conjunction with Dairy Management Inc and McCully Consulting. They looked at the future for milk growth to support capital investments in processing.

Noted was the fact that planned growth in dairy processing tends to locate where milk growth is concentrated. From 2015 through 2024, milk production grew 8% nationwide, but was mostly concentrated in the Southwest, Idaho, and the Upper Midwest (including Michigan, Ohio, Indiana). Of course, Texas was tops, up 65% over the past decade. South Dakota was up 110% but represents less new volume than the Texas gain.

Webinar leaders circled western New York as a subset growth area, pushing the No. 4 state up 14% over the decade, whereas pretty much of the rest of the eastern seaboard was down, including Pennsylvania off by 9% since 2015. Georgia gained 20% trading off for its neighbor Florida, down 21%.

Questions come to mind in these Eastern numbers:

What role did the base programs play? They were installed by most co-ops and some processors and tended to focus on subduing (or even reducing!) production growth on the coasts vs. the interior. They were prevalent over the past decade, until fairly recently.

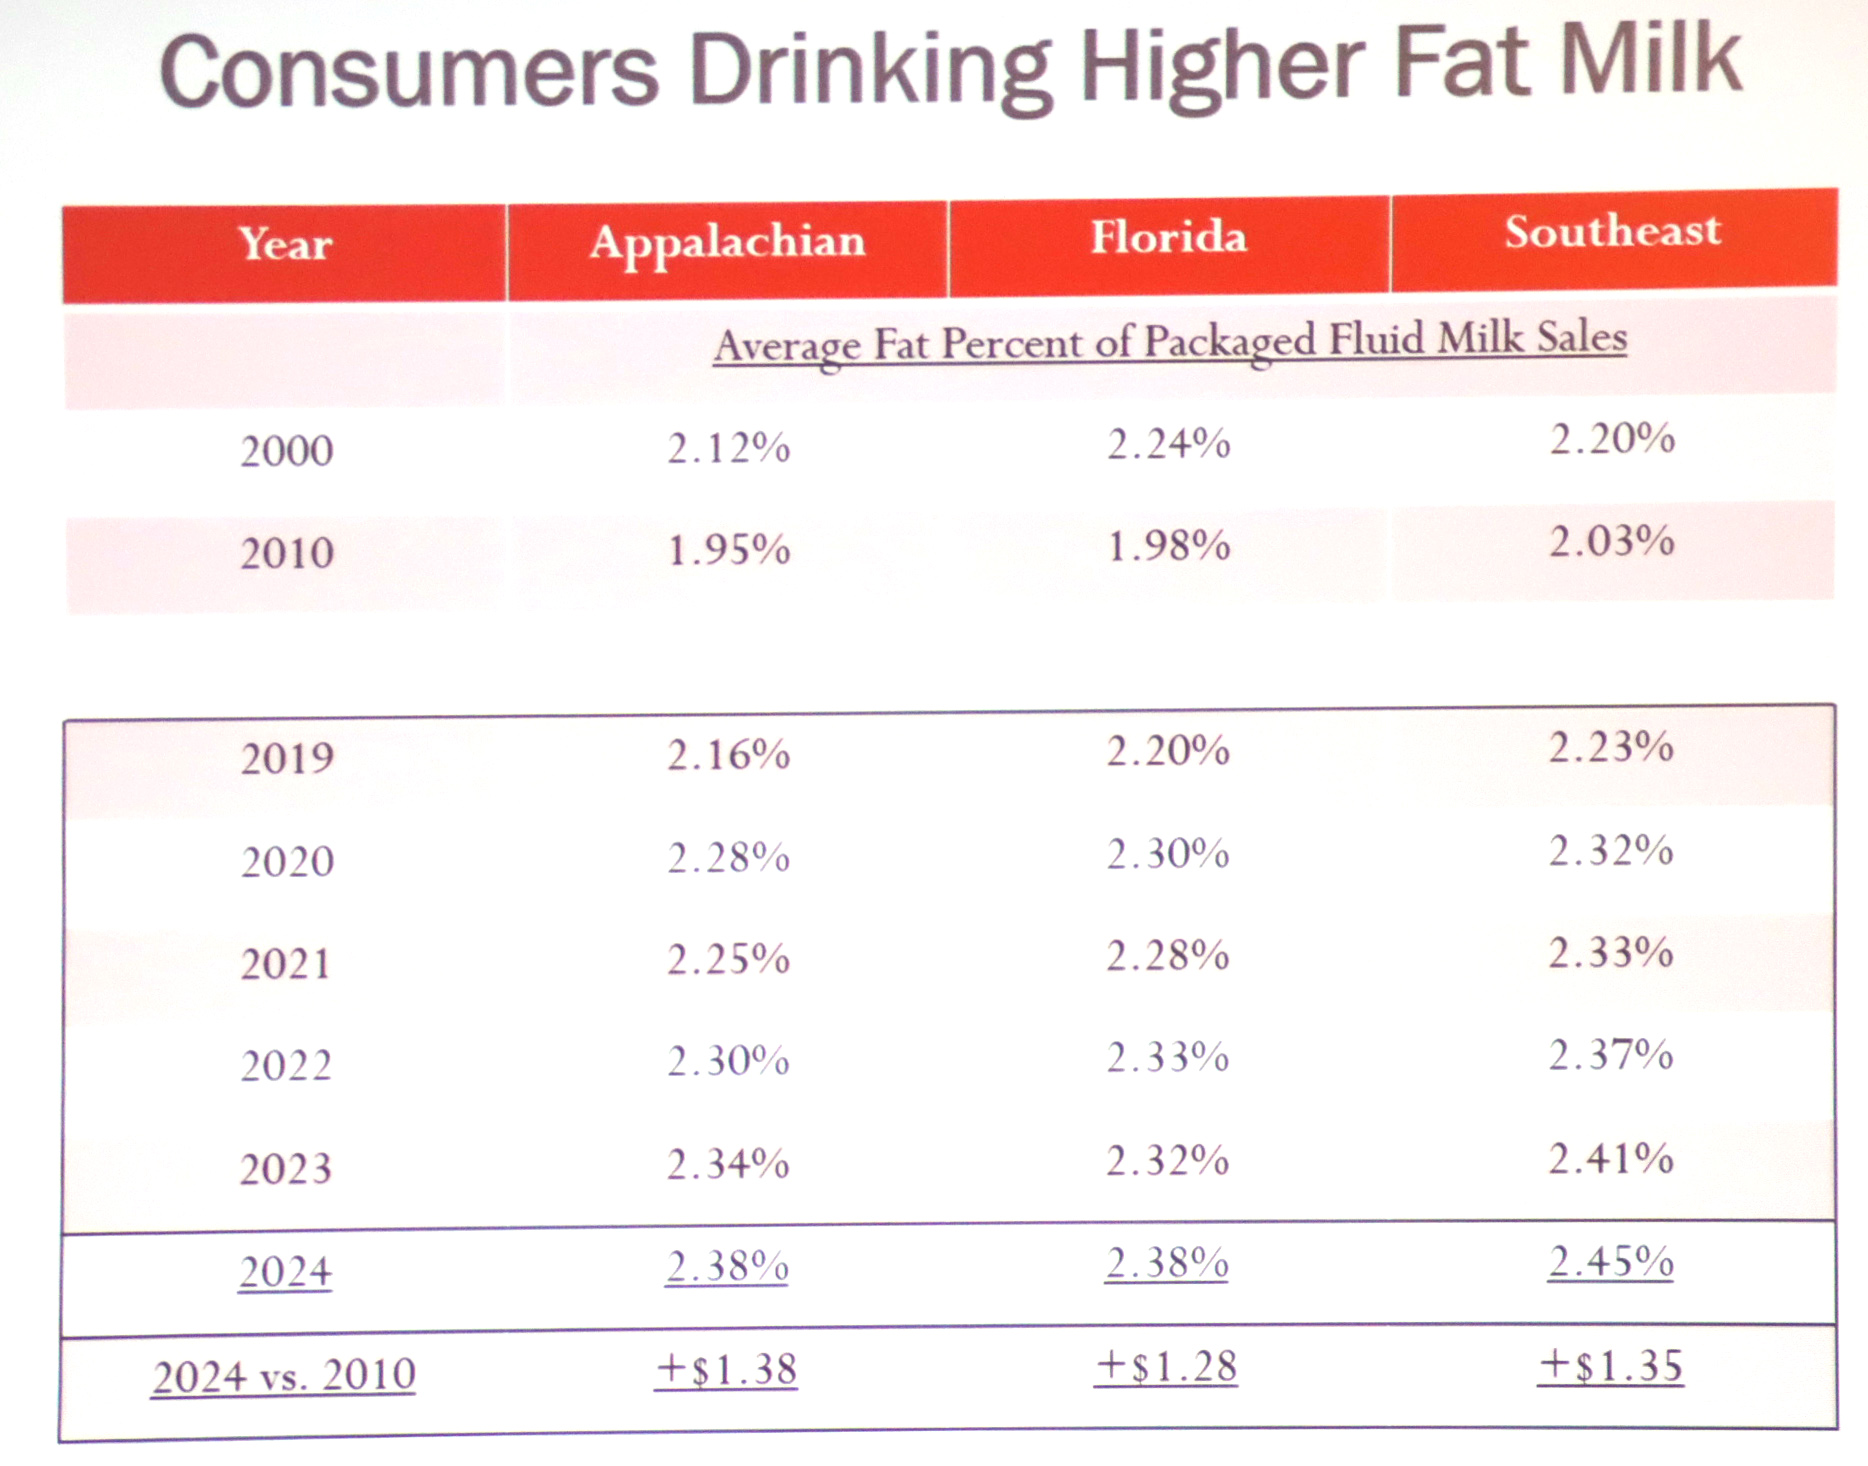
Industry leaders in the milk production webinar insist the market is signaling for more milk, but producer response has been slow. They said 1 to 2% milk solids equiv. growth via components has helped some, but not enough.

How strong is that market signal for more milk, when dairies are diversifying or exiting? Input costs and milk check deductions have increased over the past decade. The DMC milk-over-feed margin does not tell the whole story. Dairy farmers don’t get a “make allowance” for rising energy, labor, and insurance costs.

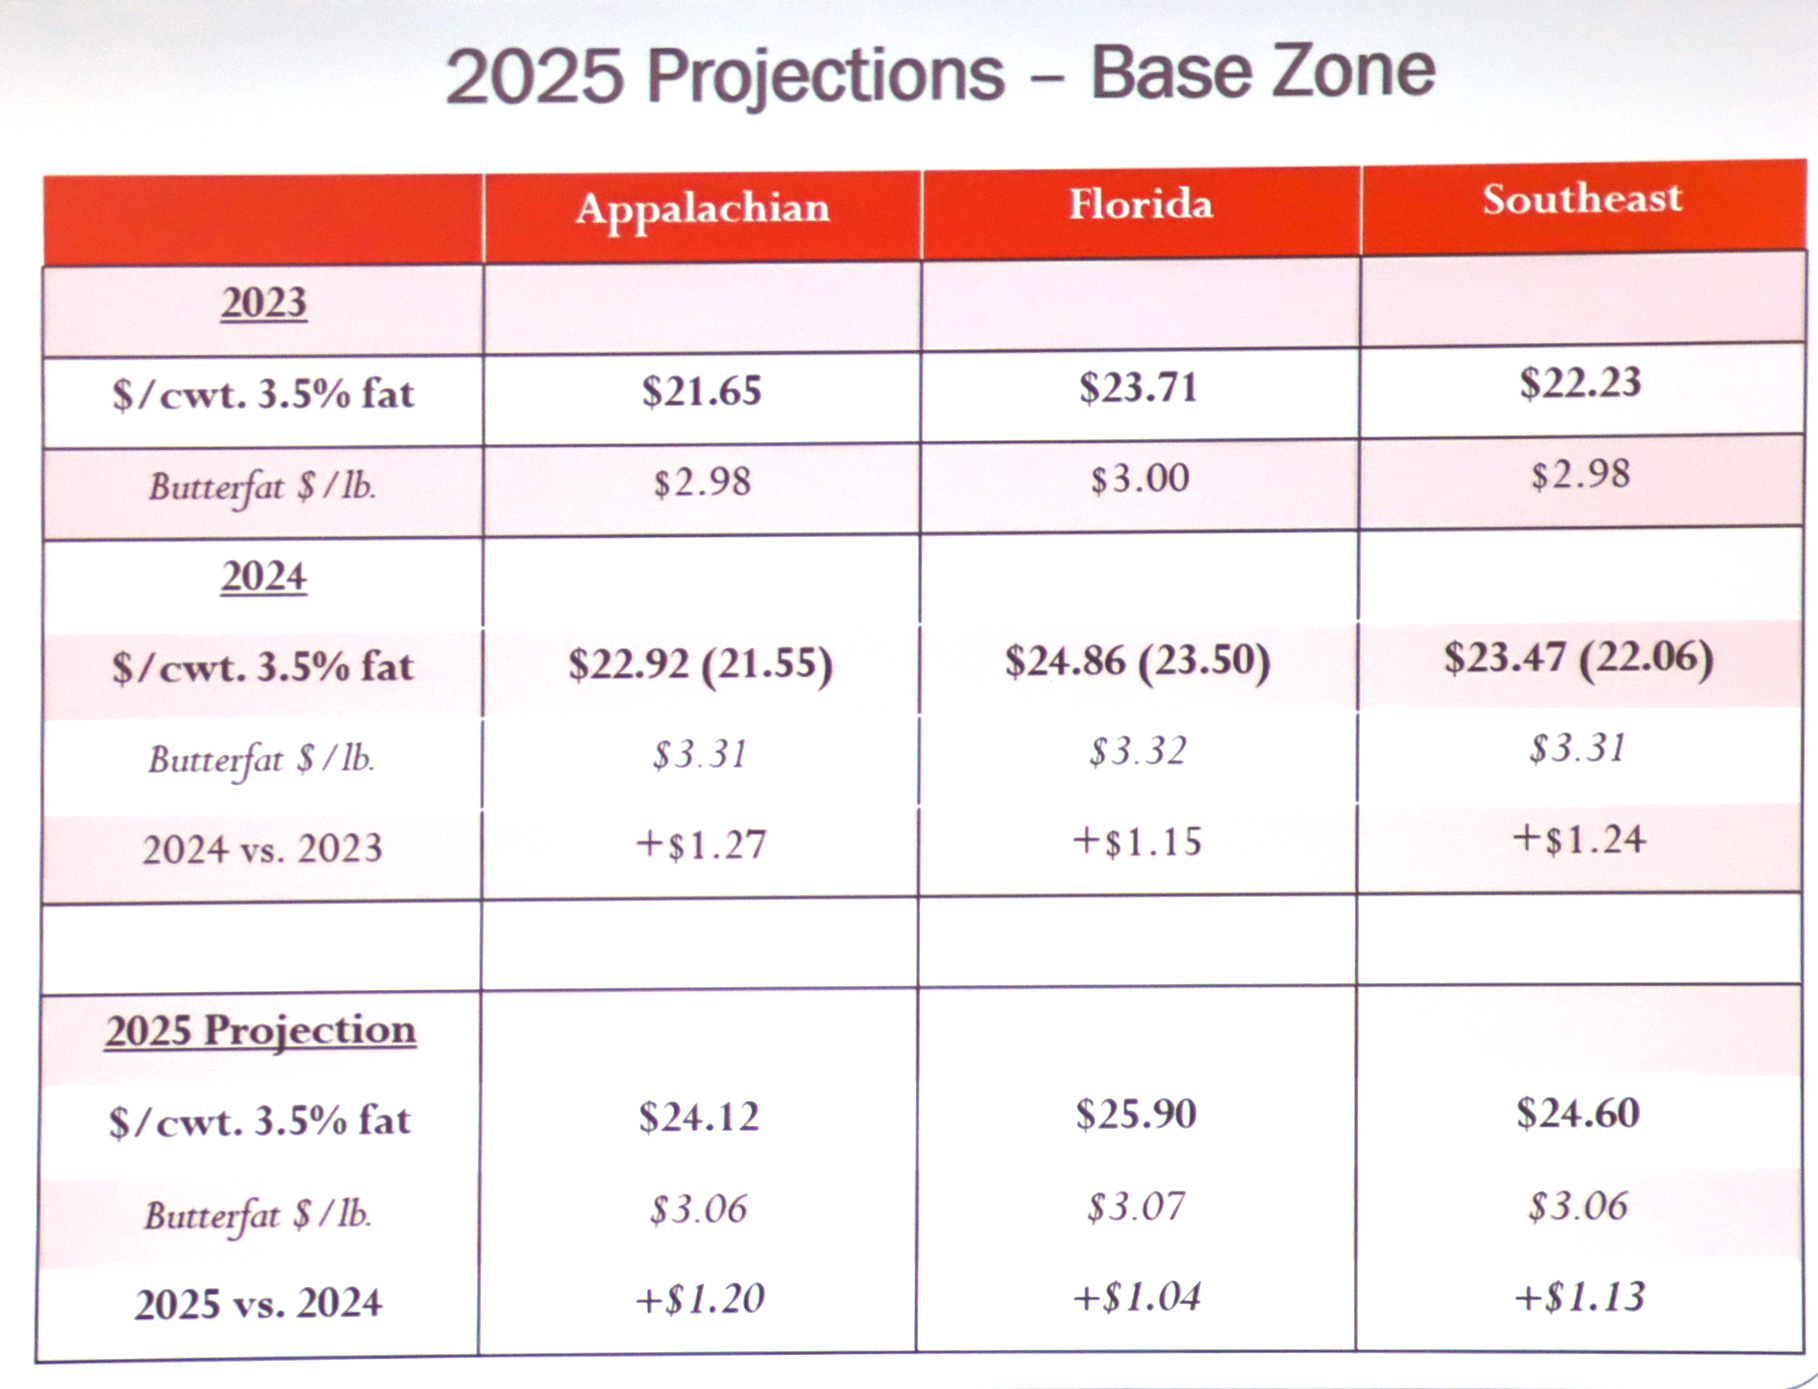
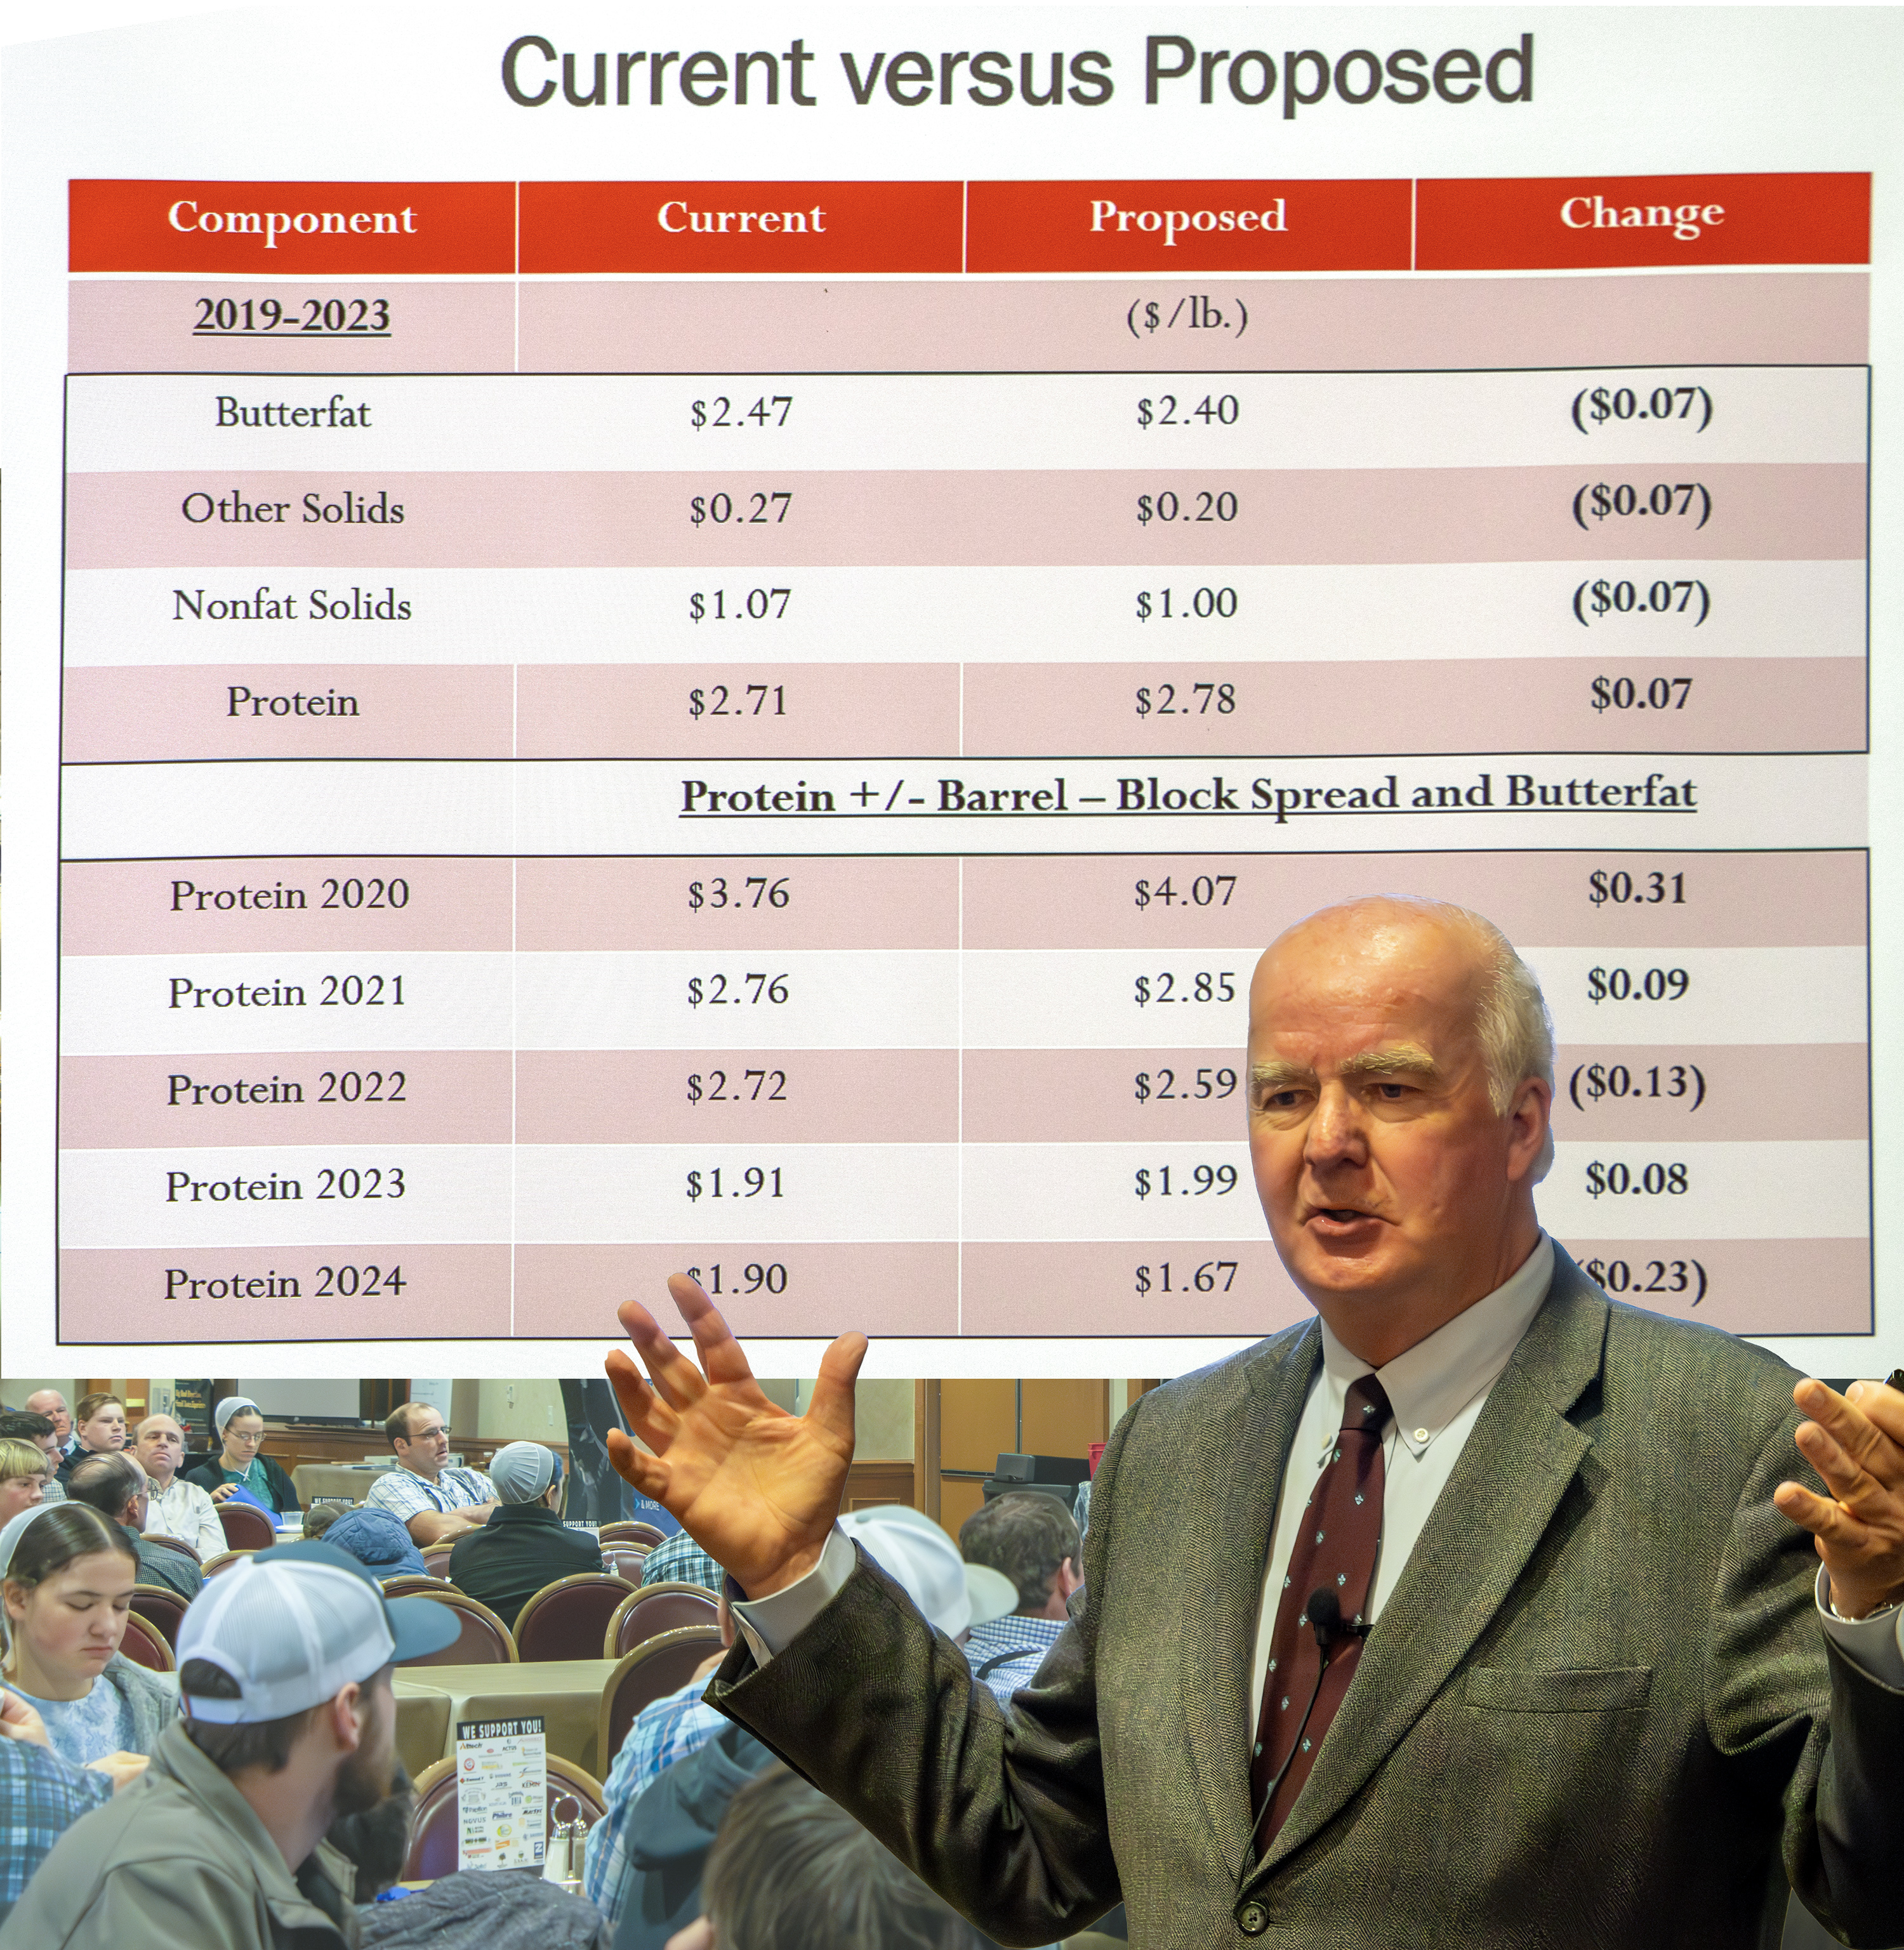
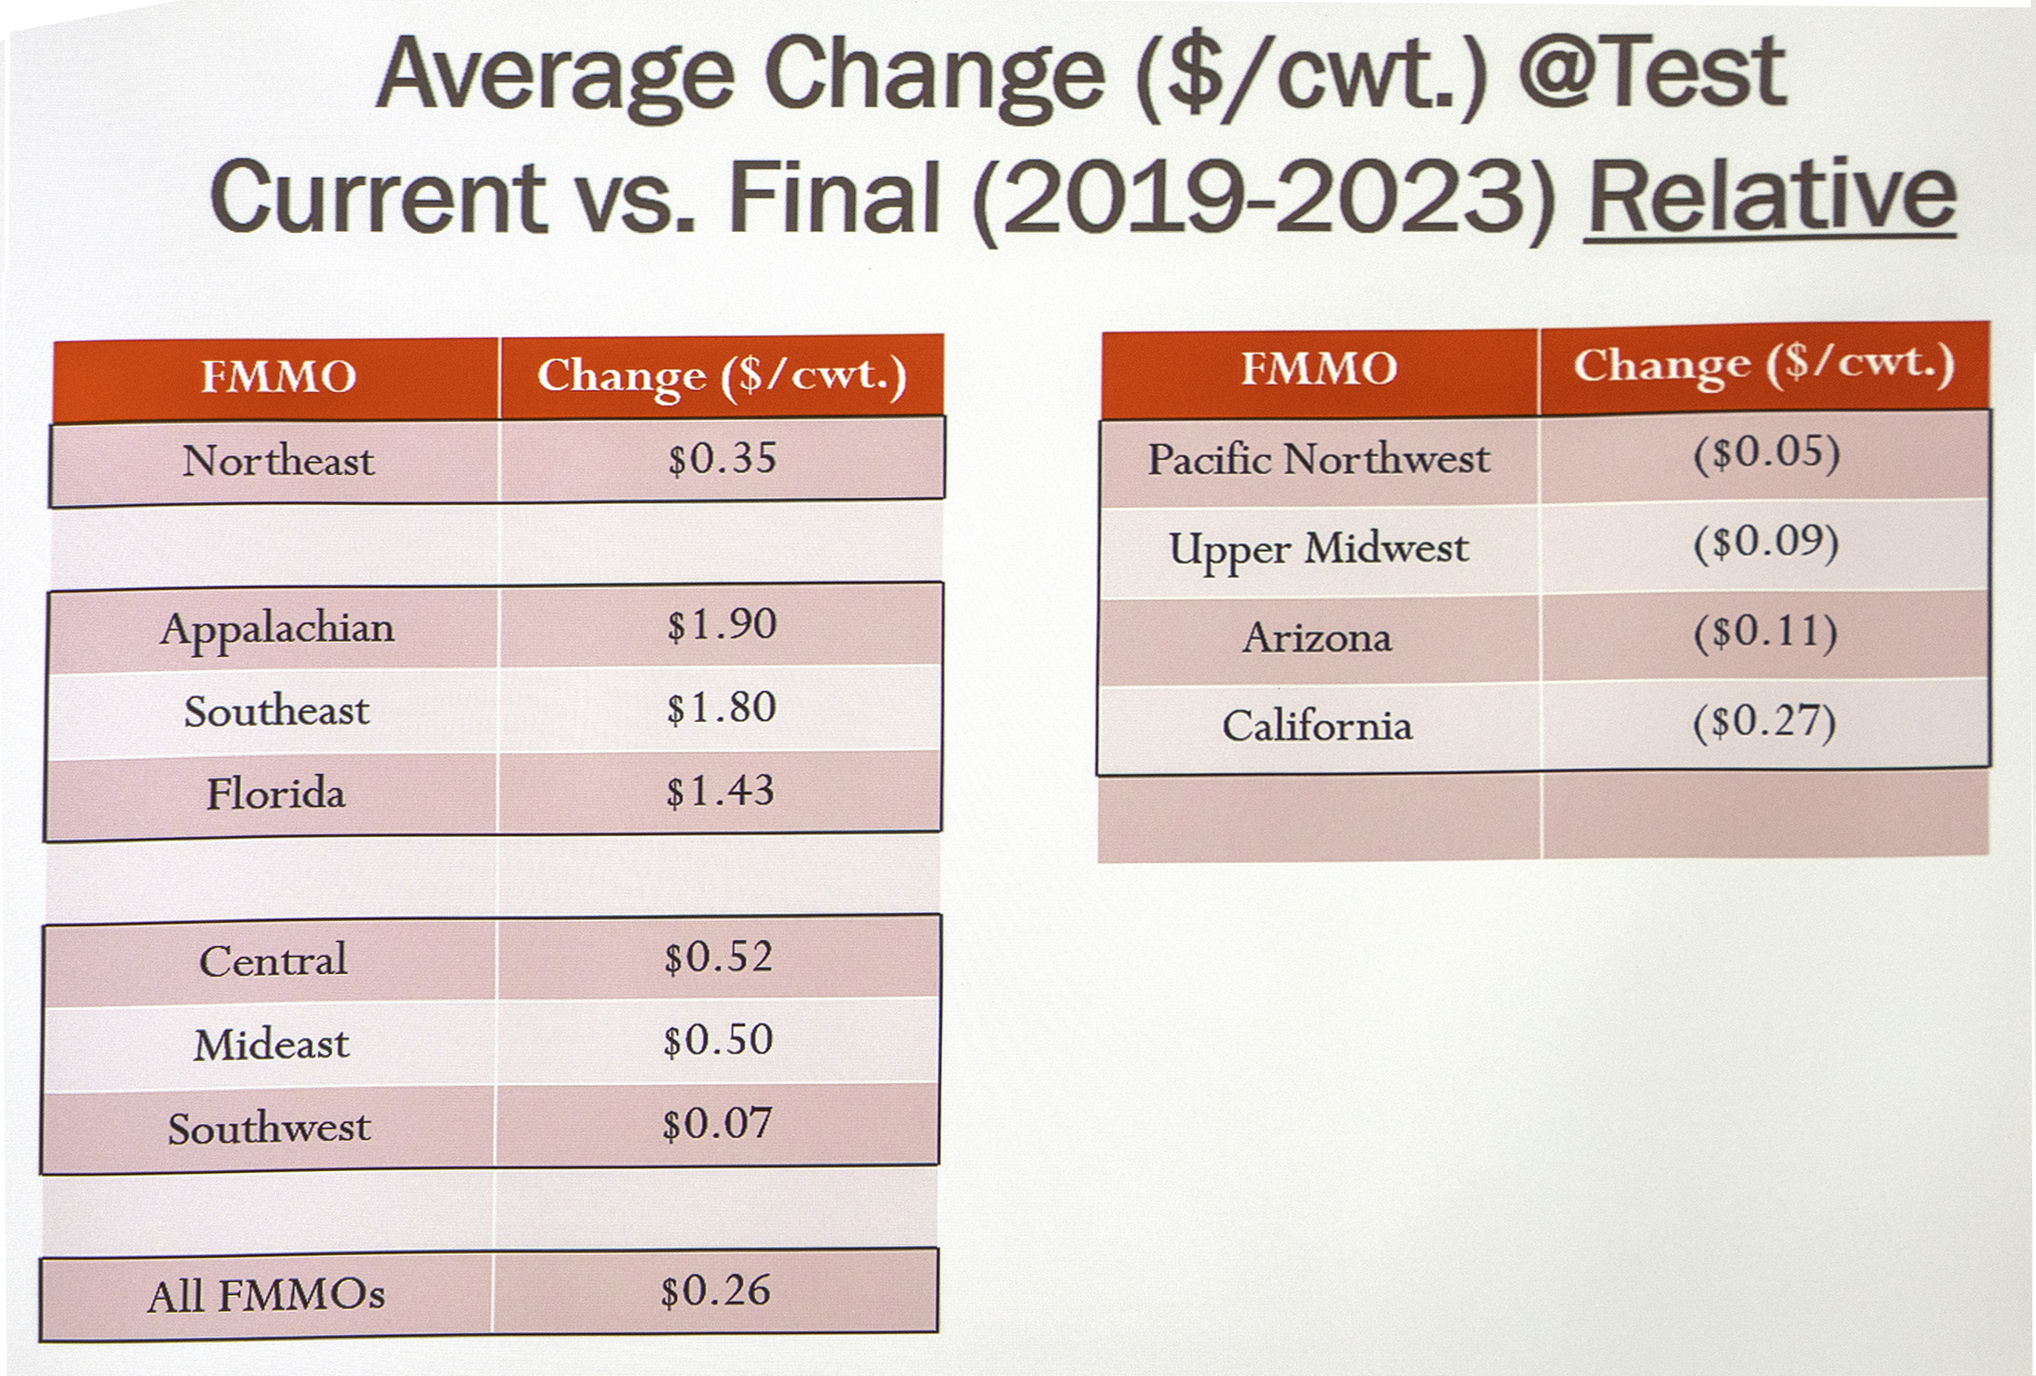
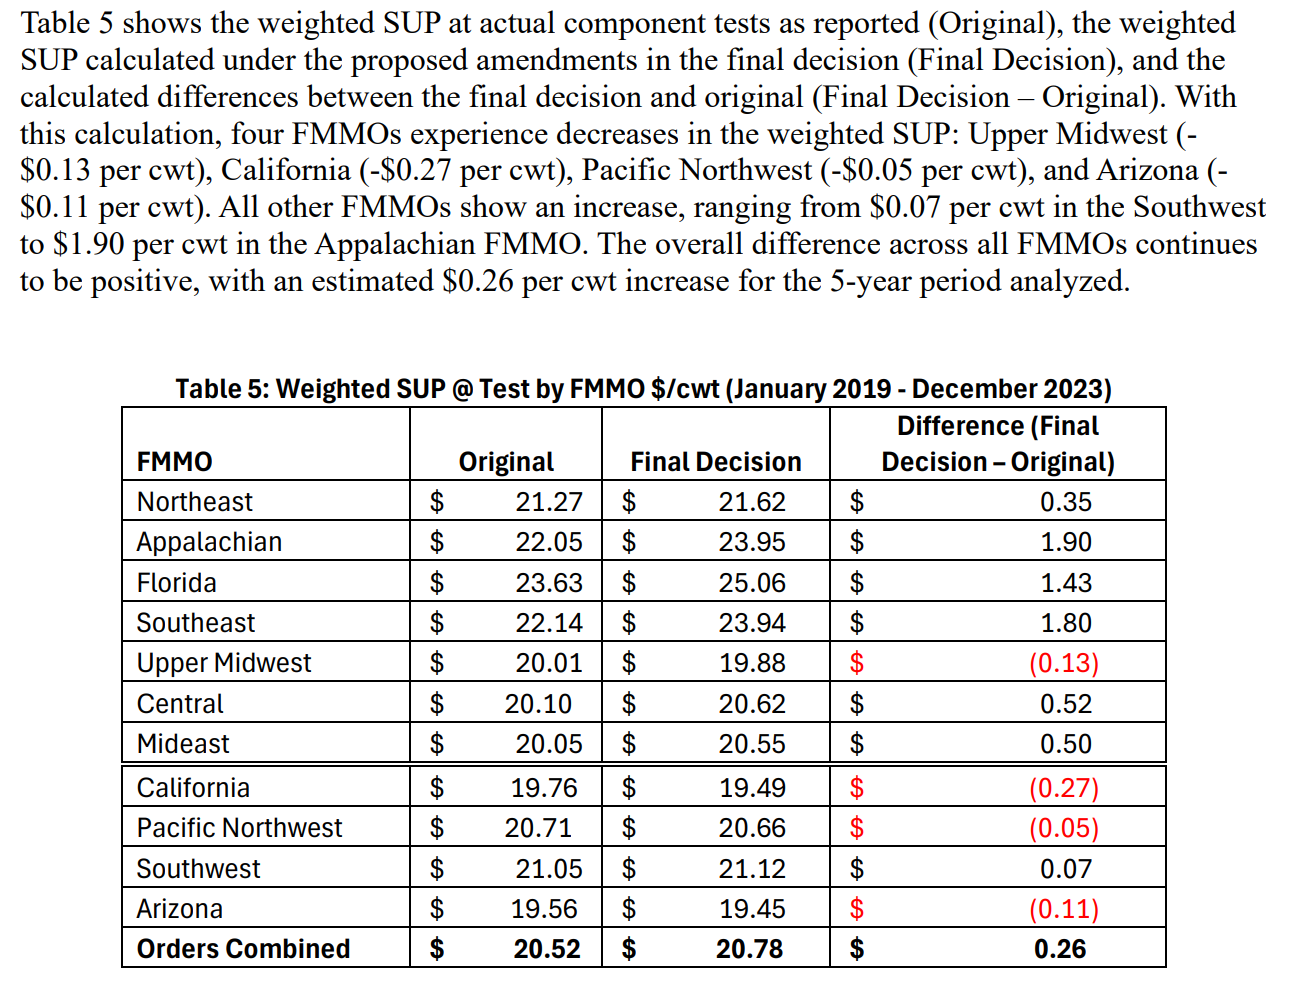
Will the 5 to 7 cents/lb increase in make (take) allowances, effective June 1st, dampen what processors describe as their ‘market signal for milk growth’? With the 2025 milk price and DMC margin forecasts already sliding lower, a 5-cents/lb increase in the “make” (take) for cheese translates to about 50 cents off a hundredweight of Class III milk, the nearly 7 cents/lb ‘make’ on dry whey and the interplay of butterfat impacts bump the total Class III ‘take’ to almost $1.00/cwt.

Does THAT signal scream: “More milk please?!” Maybe, if milk check bonuses return and deductions disappear.

(Even if processors bring back milk check bonuses and reduce or erase milk check deductions once they receive the higher take-allowances, how will those milk check adjustments be targeted in terms of dairy farm location, size, type, and/or incorporation of certain ‘sustainability’ technology. We’ll see.)

What’s on Covington’s 5-year milk market radar?

Pennsylvania dairy producers were treated to a forward look at Calvin Covington’s milk market radar during R&J Dairy Consulting’s annual seminar. The bottom line is cheese, cheese, and more whey. Photo by Sherry Bunting

Cheese and whey, will continue driving bus, with big growth in processing capacity on the road ahead

By Sherry Bunting, Farmshine, Feb. 7, 2025

EAST EARL, Pa. – Looking at the milk markets for 2025, Calvin Covington sees farm-level milk prices in the Northeast averaging 25 to 75 cents per hundredweight higher this year. He said milk margins, nationally, averaged $11.86 for the first 11 months of 2024, and he expects similar good margins to prevail in 2025.

The caveat? These are forecasted averages, and farmers should expect price volatility in their income and input costs, along with the mixed bag of positive, negative, and unknown impacts from the Federal Milk Marketing Order changes implemented in the second half of the year. He expects butterfat prices to remain good, but lower in 2025; whey prices will be higher, but more volatile; and protein may be lower as huge new cheese processing capacity comes online

Covington mostly shared what’s on his radar for the next 3 to 5 years during R&J Dairy Consulting’s 18th Annual Dairy Seminar, attended by more than 250 farmers at Shady Maple Smorgasbord in eastern Lancaster County, Pennsylvania on Jan. 28th.

He remarked about the number of young farmers in the crowd, and pointed out that Lancaster County is the consummate dairy county in the U.S. — with more than 1100 Grade A dairies, producing over 2 billion pounds of milk last year, which is 4.5% of total U.S. output and more milk than half of the state totals across the nation.

Consumers: more cheese, more fat, more solids

“Cheese is driving the dairy industry, and consumers are consuming more milkfat. That’s what makes stuff taste good,” he said. “Cheese is one-third fat, and that’s one reason why milkfat consumption is growing.”

He also showed how increased fat consumption is demonstrated in fluid milk sales, with “whole milk coming up.”

This trend toward consuming products with more solids is also evident in ice cream sales, which are down, but the fat content is up; and in yogurt sales, which are flat, but move “more milk in the yogurt” in the form of more solids.

Now retired, Covington, a previous National Dairy Shrine Guest of Honor and World Dairy Expo Person of the Year, spent over 50 years working for dairy farmer organizations, including as a DHIA milk tester, CEO of American Jersey Cattle Breeders Association, and CEO of Southeast Milk Inc.

He said the total solids growth in the dairy sales is expected to continue, up from 27 billion pounds total a decade ago to 31 billion pounds in 2024.

The caveat, he said, is that “exports peaked a couple years ago at 17% of total milk solids, and last year (2024) was down at 16%. Exports are a big part of your market, but they have started to level off.”

When asked about imports, Covington said “they keep going up, especially on butterfat” as the U.S. now imports almost as much milkfat as it exports.

He noted increased consumer demand for Irish butter, which is made differently than U.S. butter, with more butterfat. “I hope we start making better-tasting butter in the U.S. instead of importing it,” he shared.

Amid the demand for milk solids, Covington said “it’s amazing what you are doing with your milk components as dairy farmers.” In the Northeast, producers are averaging 4.21 fat and 3.29 protein due to genetics and “the job farmers are doing with their nutritionists and feed companies.”

Covington demonstrated with 2023 vs. 2024 comparisons that farmers are increasing the amount of products made by increasing components year over year, instead of milk production and cow numbers.

Components are the big story on the supply side, a trend he also sees continuing. He doesn’t expect dairy cow numbers nor milk output per cow to go back to the year-over-year gains seen in the past any time soon.

With a chart he showed the stark 2024 vs. 2023 data: Cow numbers are down 47,000 head; replacement heifers sell for $600 more per head; average milk output per cow is flat; but average fat pounds per cow is up 2.7% and average protein pounds per cow up 1.2%. This means that even though total U.S. milk production at an estimated 225.9 billion pounds is down 0.2% from year-earlier, total fat pounds at 9.508 billion pounds are up 2.2%, and protein pounds at 7.431 billion pounds up 0.7%.

“You’re doing it with your components,” he said. “And that’s going to continue.”

Cheese (or maybe whey) is driving the bus

Putting aside the import and export caveats, Covington demonstrated that as the overall dairy market is growing, almost all of this growth has been in the cheese market, which has become a much bigger piece of the much bigger pie.

“Cheese has been driving the dairy industry for several years, and everything points to it driving the industry going forward,” he said, showing a chart of the product mix in the year 2000 when 167.4 billion pounds of milk was produced in the U.S., sold as half cheese, and one-third fluid milk, with 15% other products. This compares with 2024, when 225.9 billion pounds of milk was produced and 58% of the sales were in cheese, 20% fluid milk, and 22% other products.

Per capita trends also show “consumers are eating more of their milk instead of drinking it,” said Covington. “We have seen tremendous change since 1986, when consumers first started consuming more of their milk as cheese than as fluid milk. Look at 2023, people consumed 405 pounds of milk (equivalent) in the form of cheese and 128 pounds in the form of fluid milk.”

While home milk delivery is rare today, Covington said it happens now in the form of pizza.

“If I drive around the city on a Friday night, I’ve got to get out of the way of the pizza delivery people. I figure, on average, it takes a little over a gallon of milk to make one average size pizza. Just think how much home delivery we have today of milk, but in the form of something else, not the milkman dropping off half gallons,” he said.

“The market is changing, and it’s going to keep on changing.”

Why is cheese growing so much? Covington pointed to things he hopes are lessons for other products: 1) Convenience, innovation in packaging and varieties, with pizza accounting for 42% of all cheese; 2) Brand identity, there’s still a lot of this in cheese, not making it a commodity to try to get to the lowest price like in other dairy products (i.e. fluid milk); and 3) taste, people love cheese.

Big bets on the future

Big bets are being made for more cheese growth, and the revenue stream of whey ‘byproduct.’

“We are in a slurry right now of a pile of money being spent on new plant construction,” said  Covington, listing the states of Kansas, Texas, South Dakota, Minnesota, Wisconsin and New York. 

When all of this new construction is complete over the next year or so, Covington expects the need for 30 million pounds of milk a day to fill the new plants or expansions, which he estimates represent investments of at least $5 billion and are owned by private companies or groups of farmers or individual farms that are not cooperatives.

“This kind of money and growth is not being put out there unless there is confidence in getting a return on investment with cheese and whey product growth both domestically and internationally,” he pointed out.

New cheese plant construction, when completed over the next year or so will take in more than 30 billion pounds of milk a day, and they gain a lot of additional revenue from what they do with the whey that smaller traditional cheese plants don’t have the equipment to do.

These new plants making all of this cheese will also have a lot of whey.

He explained that small plants get about $1.00/cwt for the whey cream and have the liquid whey to do something with. Some plants might dry it and get $3 per cwt for the dry whey plus the $1 for the whey cream, so that’s $4/cwt.

“Small traditional cheese plants can’t afford the equipment to do what some of these new plants are doing. These new companies not only dry the whey, they fractionate it to make whey protein concentrates. They separate out the lactose for whey protein isolates,” Covington said, rattling off a few items on the expanding list for everything from snacks and beverages, to pharmaceuticals and cosmetics, to milk replacers, to counter-top items, ‘pizza cheese,’ artificial seafood, canned hams, and more.

“It’s just amazing, and it brings in more revenue. When we think about cheese, it’s more than just the cheese, it’s also the income from the whey that’s left over,” he said, adding that the CEO of a large cheese company once told him: “Sometimes I think the cheese is the byproduct.”

With this kind of investment, the new plants are going to be making big volumes and getting income from the whey.

“This puts a crimp on the small cheese plants that can’t do this, and they’re going to have to get it out of the cheese end,” Covington observed, suggesting some potential structural change on the cheese side of the dairy industry with significant domestic and international sales growth needed to stay a step ahead.

On the positive side of the fluid milk industry, in addition to growing whole milk sales, Covington highlighted new investments. He sees a future with more dominance by grocery stores, pointing out the two new Walmart plants going into Georgia and Texas, which will be the largest in the country, processing 50 to 55 loads of raw milk a day.

Other big investments in the fluid milk sector in the Northeast are ultrafiltration and ESL packaging, such as the new fairlife plant under construction in western New York, new ESL expansion at the former Hood plant owned by Maola, and aseptic shelf-stable milk packaging at Cayuga Milk Ingredients.

-30-

Covington’s Southeast milk market outlook: Higher prices for 2025; higher-fat milk sales also put more money in milk checks

Calvin Covington gave his dairy market outlook during the Georgia Dairy Conference in Savannah. Photo by Sherry Bunting

By Sherry Bunting, Farmshine, January 24, 2025

SAVANNAH, Ga. – Flat milk production volume, but with higher components, and a more unpredictable demand are factors new to the dairy industry that make price projections more difficult for the year ahead.

Calvin Covington has spent his life in milk marketing, now retired from managing Southeast Milk Inc., and before that working with cheese processors to see (and pay) the value of higher protein and fat when he was with the American Jersey Cattle Association earlier in his career.

Covington gave his dairy outlook for 2025, with emphasis on the Southeast markets during the Georgia Dairy Conference attended by over 400 in Savannah, Jan. 20th.

“I was way low on my projections last year. 2024 ended up with prices higher than anticipated,” he said.

This year, he is projecting prices in the Southeast markets to rise by $1.20 per hundredweight as an average for 2025 vs. 2024 in the Appalachian region ($24.12), $1.40 in Florida ($25.90) and $1.13 in the Southeast Order ($24.60). Most of the increase will come from the skim side this year because the FMMO changes, which will be implemented in the second half of 2025, will pressure butterfat value.

Covington shared his price projections for Southeast milk markets for 2025.

Producers are making higher butterfat milk, averaging well over 4.0% across the three Southeast Orders at 4.06 in Appalachian, 3.92 in Florida, and 4.11 in the Southeast. This compares with 3.65% across the three Orders in 2010.

“Additionally, consumers are also drinking higher fat milk,” said Covington, calculating the average fat percentage of Class I sales in the three Southeast Orders rose from 1.95% in 2010 to 2.4% in 2024.

Covington calculated that fat percentage in milk sales showing the change in consumer preference for higher fat milk puts more money in producer milk checks.

“In 100 pounds of Class I milk in the Appalachian Order, for example, that 2.38% fat made the milk worth more money, $1.38 per cwt more,” he said, with a chart showing Southeast producers saw a $1.28 benefit; Florida $1.35.

“There has been a big change in consumer preference, and that has raised your Class I price,” he said.

He commended dairy producers for improving their components, which has also improved their milk price.

“You’ve done this through genetics and feeding and nutrition programs, and it’s not going to stop. We are moving quickly to Holsteins making milk like Holsteins and testing like Jerseys.”

Other good news heading into 2025 is dairy product inventories are in good shape, he said. Cheese stocks are down, powder is up just a small amount, dry whey inventory is way down and butter inventory is flat.

Dairy product demand is up, but Covington sees a bit of a challenge looking at demand on a total solids basis because “we are exporting more cheese and less powder.”

Looking ahead, he gave attendees a lot to think about on the changing structure and markets in the dairy industry.

Covington observed that 10% (140) of the 1408 dairy farms that were counted in the 2022 Census of Agriculture in the Southeast had 64% of the region’s milk sales.

Of that 140, there were 22 farms with 2500 cows or more, producing 32% of the region’s milk.

“This is happening all over the country,” said Covington. “We are getting more concentrated.”

This year the milk production advantage flipped back to Florida by slightly more than Georgia, but the two states together have reached 50% of Southeast milk sales. Covington thinks by 2030, “we will see 60% of the milk produced in the Southeast coming from Georgia and Florida.”

When asked what has led to Georgia’s rapid increase in production over the past few years, Covington said “Georgia dairy farmers want to expand and they have the ability to expand. They are progressively making more milk per cow and have the land mass and support.”

His “demand and supply” summary for the Southeast region shows 1160 dairy farms at the end of 2024, producing 8 billion pounds of milk with 32 regulated milk plants. The region had 8.3 billion pounds of Class I fluid milk disposition, and 0.9 billion pounds of Class II products processed.

Against those numbers, the amount of packaged fluid milk products sold in the Southeast was 10 billion pounds. “The Southeast is still a deficit area, and there is room for growth,” he said.

As for total U.S. milk production, Covington doesn’t see it rebounding any time soon. Cow numbers are moving lower and milk per cow is simply not making the year over year gains seen in the past.

“Milk production has been pretty constant for the last three years,” he said. “We have to go way back to see where that has happened before.”

But he also wanted producers to think differently about production, to realize that in making more components, their milk is generating more products. He calculates that today’s hundredweights of milk, nationwide, yield a half pound more cheese. That adds up.

“You as dairy farmers are doing this. By getting your components up, you are also improving sustainability over time. You are making more products from the same volume of milk,” Covington explained.

“Based on average component level changes, if a plant is making one million pounds of cheese a day, they now need 177 loads instead of 185 loads a day for that same output,” he said.

-30-

The good, bad, and unknown of new FMMO pricing formulas ‘approved’ by producer referendum

Calvin Covington shared that the collective impact of all the FMMO changes on the Northeast Order farms is likely to be neutral to slightly beneficial, while farms in the three Southeast Orders will benefit the most because of bigger Class I differentials and greater Class I utilization. Butterfat and other solids prices will be lowered, and the wild card will be protein because barrel cheese prices moved higher than blocks in 2024, but the barrel price will no longer be used in the protein price formula after June 1st. Photo by Sherry Bunting

By Sherry Bunting, Farmshine, Jan. 31, 2025

SAVANNAH, Ga. and EAST EARL, Pa. — As part of his annual outlook for Southeast milk markets, and also in his look ahead for the milk market nationally and in the Northeast, well-respected retired milk co-op executive Calvin Covington broke down the final USDA Federal Milk Marketing Order (FMMO) formula changes into three categories: The positive, the negative, and the unknown. (Plus, there is also the ‘unvetted.’)

Covington spoke to over 300 attendees from 10 states at the 2025 Georgia Dairy Conference in Savannah on Jan. 20th, just a few days after USDA’s announcement that producers in each of the 11 FMMOs approved the final rule. Then, on January 28th, he was in eastern Lancaster County, Pennsylvania speaking to 250 dairy farmers on this topic at R&J Dairy Consulting’s 18th Annual Dairy Seminar at Shady Maple Smorgasbord.

The FMMO changes will be implemented June 1, 2025, except for the increased milk composition factors, which will be delayed six months due to impacts on “risk management.”

Covington shared collective analysis based on USDA’s backward-looking data (2019-23), showing that all six pricing changes, combined, would have benefited producers by 26 cents per hundredweight across all FMMOs, nationwide, during those years.

“But, like the disclaimer on a financial prospectus, ‘past performance is not an indicator of future results.’ It is all relative,” he said. “The three Orders of the Southeast are by far the biggest beneficiaries, but going forward, there are a lot of things we just don’t know.”

Calvin Covington shared analysis of how the recently approved FMMO milk pricing changes could collectively impact each of the 11 Orders, but warned that analysis based on past performance, may not be an indicator of future results.

Orders with estimated negative net impact at test are: Pacific Northwest (124) -5 cents; Upper Midwest (30) -9 cents; Arizona (131) -11 cents; and California (51) -27 cents.

Orders with estimated positive impacts at test are: Appalachian (5) +$1.90; Southeast (7) +$1.80; Florida (6) +$1.43; Central (32) +52 cents; Mideast (33) +50 cents; Northeast (1) +35 cents; and Southwest (126) +7 cents.

The good

“The Southeast will see the majority of benefit, with the updated Class I differentials,” Covington reported, illustrating how they vary by location for an average increase of $1.42 per cwt across the country – but only for Class I milk. The three Orders of the Southeast will see more of this benefit because they have the largest Class I differential increases and their blend prices are predominantly Class I.

A University of Wisconsin-Madison study had previously looked at where the plants are and where the milk is, in order to think about moving milk from where it more is produced to where it is needed.

The highest differential increase is along the route 85 corridor, beginning near Atlanta, up into West Virginia, where there are plants but no milk. Interestingly, his chart showed that the smallest increases for the region are in Florida locations as well as Valdosta, Georgia, where the new Walmart milk plant is being built.

In the Northeast, Covington said dairy farmers will have to get used to what this looks like on their milk check, and they will also see more incentive to move milk South under these new differentials.

“Each county has a differential assigned to it,” he said, pointing to the area of the R&J Meeting, near New Holland seeing a $1.40 per cwt. increase in Class I differential, but this is a smaller increase compared to the much larger increase put on at Boston, Mass.

“That big increase in Boston is because there’s not any milk around there, and it’s raised to get the milk to move to the people there,” he said. This means that even though the new Class I differential will raise the Class I price in New Holland, “farmers will have to get used to seeing their location differential as a bigger negative on the milk check,” because the increased differential in Boston is so much bigger.

The milk composition factor updates are straightforward, he said, yielding about a 35 cents per cwt benefit to the Class I milk price in all FMMOs, and will raise the standardized skim value of the other classes in the three southeastern Orders that are still priced as fat/skim instead of by multiple component pricing.

The bad

The make allowance increases will lower the price for butterfat and other solids value, he said, “but we don’t know what will happen with the protein price because of the elimination of the barrel cheese prices from the formula.”

This will manifest as lower butterfat and other solids component prices for the Northeast, he said. “We would expect the protein price to be higher, based on history, but that depends upon the block to barrel price spread and its relationship to the butterfat price.

The unknown

Historically, the 500-pound barrel cheese price was lower than 40-pound block price.

Last year, however, barrels have been higher, so we don’t know,” said Covington.

Also in the unknown category is the return to the ‘higher-of’ as USDA’s method for setting the base Class I skim price.

“In the past five years, the average-of method cost dairy farmers millions of dollars, but we don’t know going forward if the skim factors (Class III vs. Class IV) will get back to being closer together, which would lower prices. If the spread stays wide, this change to the higher-of will increase prices,” he explained.

When asked if the Covid pandemic created the loss in Class I value under the average-of vs. higher-of, Covington said the Covid period — while most obvious — only accounts for one year out of five years in which the spreads between Class III and Class IV and between block and barrel cheese were detrimental.

“The thing going forward is, we just don’t know,” he said.

The unvetted

The sixth change is not listed separately in the Jan, 16th USDA notice to trade, and it was not part of any hearing proposal. Covington said he views the extended shelf life (ESL) adjuster as “a new class of milk.”

“The ESL adjuster is only on Class I. You’ll have a Class I mover skim price that will be calculated for conventional milk based on the higher-of III or IV,” he said. “Then you need a big spreadsheet to show what’s going to happen next. They’ll look 36 months previous to 12 months previous at the difference between the higher-of and the average-of, and that will be the adjuster to use for ESL milk that month.”

He estimates the ESL adjuster would have averaged -30 cents in 2024, but for some months it would have been a plus.

“My initial analysis is that it will not make a whole lot of difference in the short term, but we just don’t know going forward if some will try to manipulate this,” he said. “My concern is that it was not proposed at the hearing at all, and there’s no definition for extended shelf life. I know being in this business all these years, if there is a way to work around it for a benefit, they will find a way to do it.”

When asked about the competitive issues between conventional and ESL fluid milk and between out-of-area packaged ESL milk competing with in-area fresh milk, Covington observed potential competitive issues between conventional and ESL milk in the same area.

“You’ll have two different costs at the same location. What has always been the beauty of the Federal Order system is having the same raw product costs at the same location,” he said, adding that new ESL plants are being built and others are expanding.

“As ESL grows… there could be some months with a price advantage,” Covington suggested, pegging that difference historically to be as much as $1.00 per cwt in some months. “That kind of difference can create disparity between conventional and ESL milk.

“The thing is, we just don’t know, going forward, what it’s going to look like.”

Covington urged farmers to pay attention and be involved. Federal Order reforms are a slow process involving a lot of time and compromise. Changes this big only happen about every 25 years, he said.

He noted that Farmshine has kept dairy farmers “well-informed” with effective reporting on the markets and the FMMO process.

He said that as more manufactured products are sold and less fluid milk, compared with 25 years ago, the future could look different if future administrations and lawmakers feel differently about the pricing of milk. If manufacturers perhaps choose not to participate, FMMOs could some day be looked to primarily for handling the payments and test weights.

However the future plays out, Covington urged: “Stay informed and be involved because it is your milk check.”

-30-

USDA to complete producer vote before new administration comes to town

Final FMMO rule adds more to make allowances, shortens delay on composition updates, restores higher-of, keeps controversial ESL adjuster.

By Sherry Bunting, Farmshine, Nov. 15, 2024

WASHINGTON, D.C. – The USDA released on Nov. 12 the Secretary’s nearly 400-page final decision on the Federal Milk Marketing Order (FMMO) price formula changes, with a few changes from the July ruling.

USDA rejected comments seeking to forestall the make allowance increases or to reduce their size. All make allowances are further raised in the final rule vs. preliminary rule by a fraction of a penny for marketing costs. Also, USDA has added more than a penny per pound to its earlier decision on the nonfat dry milk make allowance. These are milk check deductions that are embedded in the class and component formulas.

USDA also plans to stick with its earlier decision to introduce a rolling adjuster for extended shelf life (ESL) milk, which creates essentially two-movers for Class I that was not part of the hearing scope. The Department further defined ESL milk by processing method to be all milk using ultra-pasteurization, not just relying on the shelf life designation of 60 days or more.

The broad range of changes in the proposed final rule are the result of the national hearing and rulemaking process that began in 2023. It will be made final for implementation after dairy producers vote to approve these changes in the Order-by-Order referendum that will be completed before the new administration takes office on January 20th.

USDA AMS will mail voting ballots to eligible producers and qualified cooperative associations — which may bloc-vote on behalf of their eligible members — after the final rule is published soon in the Federal Register. Ballots must be returned with a postmark of December 31, 2024 or earlier and be received by the Department by January 15, 2025 in order to be counted.

Not all producers in a Federal Order will be eligible to vote. Only producers with milk pooled on a Federal Order in the month of January 2024 are eligible to vote in that Federal Order.

A ‘yes’ vote accepts all parts of the final rule. A ‘no’ vote rejects the changes but also rejects the continuation of that Order. Any of the 11 Federal Orders that does not meet the two-thirds majority requirement for acceptance of these changes will be terminated. The two-thirds majority is calculated among eligible producers in the Order who return a ballot.

USDA AMS will host three public webinars to further inform stakeholders of the changes and referendum process on Nov. 19 and Nov. 25 at 11:00 a.m. ET and Nov. 21 at 3:00 p.m. ET. A link to access the webinars will be provided at the AMS hearing website along with supplementary educational documents. 

Using its backward-looking analysis of applying the changes to actual 2019-23 pool test data, the combined net benefit for all 11 Federal Orders of all the changes in the final rule is estimated at +$0.26 per hundredweight. However, an average does not tell the full story, and it does not include the positive orderly marketing impact of restoring the higher-of method for calculating the Class I base price mover.

USDA’s Table 5 above is the backward-looking static analysis of the weighted Statistical Uniform Price (SUP) – at actual pool component test – showing net benefits for the following Orders: Appalachian +$1.90 per hundredweight, Southeast +$1.80, Florida +$1.43, Central U.S. +$0.52, Mideast +$0.50, Northeast +$0.35, Southwest +$0.07. 

Table 5 shows net-negative impact for California -$0.27, Upper Midwest -$0.13, Arizona -$0.11, and Pacific Northwest -$0.05.

However, this analysis does not factor-in the positive impact of restoring the higher-of method for calculating Class I. The Orders showing net negative impacts above have more liberal policies for jumping in and out of FMMO pools. Since USDA did not quantify the benefit of its restoration of the higher-of method for the Class I mover, it’s important to note that this can soften the blow. 

According to experts consulted by Farmshine on this matter, the potential average benefit for the same 2019-23 period of orderly marketing under the higher-of method in a low-Class-I FMMO like the Upper Midwest is 7 to 10 cents per hundredweight.

More importantly, the orderly marketing restored by this part of the final rule has a protective effect on the month-to-month hits taken by pooled producers from opportunistic depooling and negative PPDs. Why? Because the higher-of method — used for two decades, before the legislative change in 2019 — encourages functional class price relationships that promote orderly marketing.

In short, producers should realize that the restoration of the higher-of reduces the prevalence of very large negative PPDs that can disrupt performance of their risk management tools and treat pooled producers inequitably during black swan events and times of major market imbalances — like have been experienced over the past five years under the average-of method. This is a benefit that is difficult to quantify, but is contained in this decision nonetheless.

On the positive side for dairy farmers, the USDA will also shorten the delay from 12 months to six months for implementing the updated skim milk composition factors. These updates are shown above, which witnesses testified would raise Class I prices in all Federal Orders by an estimated 70 cents per hundredweight (based on 2022 data), while also increasing the manufacturing class prices in the four fat/skim Orders.

Raising the skim component standards helps bring the Class I, III, and IV in alignment, reduces the frequency of negative PPDs, and reduces the incentives for depooling that undermine orderly marketing.

The manufacturing class prices in the other seven Orders that use multiple component pricing are already paid on actual components, not by standardized levels.

Standardized butterfat composition at 3.5% will not be updated in this decision because this is a paper number that does not affect how producers are actually paid. Each pooled producer’s individual minimum price in all Federal Orders is already based on their actual butterfat test for pounds shipped.

The updates to county-by-county Class I location differentials were also tweaked in places, compared with the July preliminary decision, and the base differential for all counties at $1.60 per hundredweight remains in place.

Butterfat recovery within class and component formulas will be updated from 90% to 91%. Several proposals had requested a larger increase.

The Secretary’s final decision on the Class I base price mover remains unchanged from July.

USDA will restore the higher-of formula, which had been changed to an average-of formula in the 2018 farm bill. USDA is also sticking with the ESL adjuster, creating what is essentially a two-mover system for fluid milk.

Processors will separately report sales of conventionally processed (HTST) and ultra-pasteurized (ESL) fluid milk product sales each month. The higher-of method will set the base price mover, and USDA will apply the new ESL adjuster to the sales of ultra-pasteurized milk to determine their final pool obligation.

The ESL adjuster represents the difference between the higher-of vs. the average-of the Class III and IV advance pricing factors over a 24-month period with a 12-month lag. USDA states that it sees this adjuster “stabilizing” the difference between HTST and ESL over time.

USDA also rejected comments that had raised competitive concerns, stating: “The record does not contain evidence to support the implication that manufacturers of dairy products, the majority of which do not manufacture ESL products, would make business decisions to gain an advantage in the fluid market where they do compete.”

On the negative side for dairy farmers, the large increases in processor make allowance credits were made a bit larger, not reduced, after the 60-day public comment period.

USDA relied on the voluntary surveys of processor costs that were presented at the hearing as customary data sources from past make allowance adjustments. While USDA did not fully meet the requests of International Dairy Foods Association (IDFA) and Wisconsin Cheesemakers Association (WCMA), it does recommend much larger make allowances than what National Milk Producers Federation (NMPF) had proposed.

Make allowances represent the costs of converting raw milk into the four manufactured dairy products surveyed by USDA. They are embedded in the pricing formulas, not line items on a milk check, and they aggregate to an impact of 75 cents to $1.00 per hundredweight — depending on product mix and Class utilization.

USDA responded to processor comments about marketing costs, adding $0.0015/lb to its previously proposed processor make allowance credits for cheese, butter, nonfat dry milk, and dry whey. USDA also responded favorably to the processors’ request to adjust the nonfat dry milk make allowance to be more than a penny per pound higher than previously proposed.

The final decision will raise the make allowances on the four products used in class and component pricing – per pound — as follows:

Cheddar cheese will be increased from the current make allowance of $0.2003 to $0.2519 per pound; dry whey from $0.1991 to $0.2668; butter from $0.1715 to $0.2272, and nonfat dry milk from $0.1678 to $0.2393.

In its rationale, USDA stated that NMPF member-cooperative-processors supported the NMPF proposal as “a more balanced approach” to consider impacts on producers and processors. However, they also testified that the smaller increases proposed by NMPF “did not cover their costs.”

This put USDA in the position of having to rely only on the cost data provided by IDFA and WCMA because NMPF offered no cost data to support their smaller proposal. USDA said it rejected consideration of the impact on dairy farmers because the Agricultural Marketing Agreement Act does not include producer profitability as a factor for the Secretary’s consideration on this matter.

USDA chose not to wait for the mandatory and audited cost of processing survey that Congress is expected to authorize and require USDA to utilize in the future. This language is included in all versions of the new farm bill and is reportedly supported by NMPF, IDFA and American Farm Bureau Federation (AFBF).

The final rule also removes 500-pound barrel cheese prices from the protein and Class III formulas, meaning only 40-pound block Cheddar price surveys will be used going forward. USDA rejected proposals that sought to add 640-pound block Cheddar, bulk mozzarella cheese, and unsalted butter to the pricing survey.

-30-

There is NO basis for two Class I movers in FMMO recommended decision!

AUTHOR’S NOTE: Who’s the wizard behind the curtain on USDA’s last-minute milk pricing surprise, the splitting of the Class I baby to favor ESL? Vilsack, of course, with a little help from his checkoff cronies at Midwest Dairy and DMI — masquerading as ‘dairy farmers.’

By Sherry Bunting

USDA’s recommended decision on Federal Milk Marketing Order Class I (fluid milk) formulas brought a big surprise getting very little attention. That surprise: “splitting the Class I baby” and adding what constitutes a “fifth Class” of milk — TWO Class I movers announced each month.

ZERO proposals to divide Class I into a two-mover system were aired at the national hearing. Even USDA’s analysis shows the two movers would differ by as much as $1 apart — or more — in any given month.

The hearing record is woefully inadequate, indeed completely void of testimony for a second Class I mover. No proposal. No evidence. No testimony. No analysis. No parameters. No definition.

What does this surprise two-mover decision mean? 

Fresh, conventionally processed (HTST) milk would go back to being priced by the prior method, using the higher of the Class III or IV advance pricing factors to determine the Class I skim milk base price portion of the mover. 

On the other hand, milk used to make extended shelf life (ESL) fluid milk products, defined only as “good for 60 days or more,” would continue to be priced using the average of these two pricing factors, plus-or-minus a rolling adjuster of the difference between the higher-of and average-of for 24 months, with a 12-month lag.

Confused yet? 

The industry is calling this surprise two-mover twist ‘innovative’ and ‘creative’, even ‘brilliant.’ But let’s hold the horses a moment. 

With two movers, fluid milk costs could be different for plants in the same location based on shelf life. Could processors change the label to move between the movers and pay whichever mover was lower? Who knows? There is no clear definition for the new class, and the parameters to qualify are non-existent.

ESL processors will know the rolling adjuster 12 months in advance, due to the “lag.” They will know the two advance-priced movers a month in advance. They will have it charted in an algorithm no doubt, and make decisions accordingly.

Dairy farmers, on the other hand, will find out how their milk was used and priced two weeks after all their milk for the month was trucked off the farm. If the two-price Class I system becomes law, dairy producers’ milk checks will be even less transparent than they are now!

Not only does the USDA hearing record and decision fail to clearly define ESL, the industry doesn’t even have an exact and generally-accepted definition or standard for ESL.

ESL is both a loose and specific term.

Generally speaking, ESL is a term covering a broad range of products — ranging from UHT (ultra high temperature) or ultra pasteurization, aseptic packaging, to the inclusion of a process that combines microfiltration, skim separation, and indirect heating (in stages). These processes yield what is more specifically referred to as ESL fresh milk with a longer shelf life in refrigeration, but is not shelf-stable.

What’s at the root here?

Dairy checkoff personnel have openly identified ESL — especially shelf stable aseptically packaged milk — as its “new milk beverage platform.” Dairy farmers’ promotion funds are being used to research and promote ESL milk, as well as studying and showing how consumers can be “taught” to accept it.

For the past few years, the four research centers supported by the checkoff have been drilling into milk’s elements to sift, sort, and test different combinations to reinvent milk as new beverages.

In 2023, North Carolina State researcher Dr. MaryAnne Drake —speaking at the 2023 Georgia Dairy Conference — talked about this “new milk beverage platform. We are after a shelf-stable milk that tastes great and meets our consumer’s sensory needs and our industry’s sustainability needs,” she said.

Bingo. Dairy checkoff funds for ESL are being driven by the net-zero sustainability targets. And now USDA’s federal milk order changes are proposing to lower dairy farmers’ Class I income and/or competitively favor, and in a way subsidize, ESL processors over fresh HTST fluid milk processors. Follow the money.

Dr. Michael Dykes of IDFA, at the Georgia Dairy Conference in January 2024, told dairy producers that “this is the direction we (processors) are moving… to get to some economies of scale and bring margin back to the business.” He said the planned new fluid milk processing capacity investments are largely ultra-filtered, aseptic, and ESL — 10 of the 11 new fluid plants on the IDFA map he displayed are ESL. Some will also make ultrafiltered milk and plant-based beverages too.

The linchpin to regional dairy systems and markets for milk from farms that fit USDA’s description of small businesses is the processing of fresh, conventionally pasteurized (HTST) fluid milk.

Meanwhile, dairy checkoff overseers, in cahoots with processors, are making big bets that consumers will embrace the obvious conversion underway to the consolidating shelf stable ESL milk, emboldened by the average-of pricing that has failed farmers miserably over the past five years and is now part of the proposed two-price Class I system mysteriously added to the USDA recommended decision when a two-price Class I system was never noticed as part of the hearing scope.

In the recommended decision, USDA notes that ESL currently represents 8 to 10% of total fluid milk sales but does not present the full picture of how the industry began aggressively converting to ESL since 2019 when Class I average-of was implemented. More of these accelerated investments will become operational in 2024-26.

Before we know it, the industry will have converted to ESL, and dairy farmers will once again experience disorderly marketing, depooling, and the basis risk of the mysterious average-of mover.

Dairy farmers have seen this movie before. 

In 2018, the average-of method — which changed how the Class I base was calculated — was portrayed by National Milk and the IDFA as “revenue neutral.” But at the recent national milk order hearing, testimony revealed that farmers experienced Class I revenue losses totaling nearly $1.25 billion from May 2019 through July 2024… and other impacts. 

Disorderly markets via the ‘average-of’ continue to result in losses and disrupt performance of risk management tools that fail to protect farmers against the intervals of extreme basis risk.

Proponents say the proposed rolling 36-to-13-month ESL adjuster on the second mover in USDA’s decision provides compensation to farmers for the difference between average-of and higher-of. However, that occurs gradually — over time — with a lagged interval. If tight milk supplies boost commodity prices and drive up all classes of milk, then dairy farmers’ incomes will at least partially lag years behind real-time markets!

ESL processors like Nestle and fairlife testified that the average-of method over the past five years allowed them to use Class III and IV hedges on the CME to offer flat 9- to-12-month pricing to wholesale customers and increase their sales. Nice to know the big corporations made money on that inequitable Class I pricing system.

Would a two-mover system ultimately reduce farmers’ access to milk markets in some regions and diminish the food security of those consumers? Watch the impact of a new, unregulated ESL plant now being built in Idaho!

Many legitimate questions lack answers

Milk is commonly prized as the freshest, least processed, most regionally local food at the supermarket. Will the USDA recommended decision accelerate consolidation and a reduction in fresh fluid milk availability for consumers?

Has USDA considered the purpose of the FMMO system is to promote orderly marketing and the adequate supply of fresh fluid milk? Will consumers accept the taste of the not-so-fresh ESL, or migrate faster to other beverages if fresh fluid milk is less available to them?

How will the two-mover system impact dairy farms located outside of the industry’s very specific identified growth centers? 

Will this perpetuate the wide divergence between Classes III and IV that has been an issue since 2019, further punishing dairy farmers with disorderly marketing and opportunistic depooling?

Who knows? The hearing failed to define, examine, or obtain evidence on any such questions… or any other questions that the hearing process is meant to be open to because this decision falls outside of the hearing scope!

Vilsack strikes again?

This proposal — a price break favoring ESL milk — fits the climate and export goals set forth by Ag-Secretary-then-DMI-executive-then-Secretary-again, Tom Vilsack. The pathway to rapidly consolidate the dairy industry to meet those goals is to tilt the table against fresh fluid milk. This is something Vilsack already put a big dent in by removing whole milk from schools.

It’s like one well respected veterinarian in the industry observed recently in conversation: “Someone decided: Thou shalt drink low-fat milk and like it.”

That “someone” is apparently equally convinced that the industry shall move to ESL and aseptic milk processing… while using dairy farmers’ checkoff funds to figure out how to get consumers to like that too.

-30-

‘Make allowance’ among hot topics ahead of producer vote on USDA’s proposed milk pricing changes

35 dairy farmers, industry representatives, and farm media attended “Winners and Losers: a discussion about USDA’s proposed milk pricing reforms,” hosted by the American Dairy Coalition during the 57th World Dairy Expo in Madison, Wisconsin October 3rd.

By Sherry Bunting, Farmshine, October 11, 2024

MADISON, Wis. – “I’m in Wisconsin, and on the graph (below) it looks like producers in Order 30 are having to decide between less money with an Order or even less money without an Order. Am I wrong and is there a silver lining?”

That was the crux of the question one dairywoman asked during the American Dairy Coalition’s (ADC) ‘Winners and Losers’ seminar and press conference Oct. 3 at World Dairy Expo. Over 35 farmers, industry representatives, and media professionals gathered to hear insights about USDA’s recommended decision on changes to Federal Milk Marketing Order (FMMO) price formulas.

American Farm Bureau economist Danny Munch was the invited presenter, followed by time for questions, moderated by Kim Bremmer of Ag Inspirations, and opportunities for networking and farmer-to-media connections during the remainder of the two hours.

Dairy farmers attending ADC’s press conference gave interviews after the discussion on USDA’s proposed milk pricing changes.

At issue was the impact on FMMOs with more cheese and less fluid milk, that would experience the negative impacts of a proposed hike in processor make allowances without the positive buffer of higher Class I location differentials.

Bremmer said over 126 individuals and organizations provided comments to USDA. The comment period ended Sept. 13. 

During his visit to Expo on Oct. 4, Ag Secretary Tom Vilsack said USDA would issue a final decision in mid-November. Also on Oct. 4, USDA held a webinar explaining the producer referendum expected in January. (Look for more specifics in a future Farmshine, and check out the Farm Bureau recap here)

The short answers to the above question appear to be yes, yes, and yes. With an Order, producers in some regions will see lower FMMO blend prices. Without an Order, they would lose minimum prices altogether and other important FMMO functions.

The silver lining? Munch pointed to better competition currently for milk, and he sees opportunity for milk in the future as consumers focus on protein.

New to the discussion was make allowance data compiled by AFBF for its official comment at the Federal Register showing the average plant size of processors participating voluntarily in the Stephenson Survey relative to the average plant size of processors reporting to the NASS Dairy Product Manufacturing Survey (below)

The average size and volume of the plants in the voluntary cost of processing survey is 5 to 20 times smaller than the size and volume of plants reporting to USDA on price and production. This is further evidence that mandatory surveys are the only fair way to examine and set make allowance levels.

ADC reports that farmers have called with questions and concerns about the FMMO changes they will vote on. Part of ADC’s mission is to inform dairy farmers and help them understand factors like this that affect their businesses, said Bremmer.

For example, it’s helpful for farmers to realize that current make allowances equate to $2.17 to $3.17 per hundredweight in deductions already in the pricing formulas to cover the cost of converting milk to butter, cheddar cheese, nonfat dry milk, and dry whey. 

The proposed new make allowances add 70 cents to $1.00, depending on class utilization, bringing the total deduction to about $2.89 to $4.07 per hundredweight, maybe more.

The splitting of Class I into a two-mover pricing system is also causing discontent and concern. On the one hand, USDA would restore the ‘higher-of’ method for conventionally pasteurized fluid milk but use an ‘average-of’ method with a rolling and delayed adjuster for the extended shelf life (ESL) fluid milk products. This new milk class was not vetted nor defined during the hearing.

Also of concern is the delay in implementing positive updates to milk composition standards that have not been updated since Order Reform in 2000.

USDA’s recommended decision applies to all 11 FMMOs nationally but will be voted on by eligible (pooled) producers in each Order, individually.

A two-thirds ‘yes’ vote within each individual Order continues that Order with the changes. If the two-thirds threshold is not met by either producer numbers or volume in an Order, then the result is termination of that Order. 

Producers do not have the option of voting separately on the five pieces of the USDA decision, nor do they have the option of voting to keep the FMMO pricing formulas as they are currently.

Economists with National Milk Producers Federation have stated previously that 65 to 70% of the U.S. milk supply is marketed through cooperatives that tend to bloc vote for their producers, but this percentage can vary on an individual Order basis.

USDA determines voting eligibility, based on whether milk was pooled in the reference period selected by each Market Administrator. 

“When we get down the road to the vote, and if we vote ‘no,’ that will dissolve the Order, right?” asked one dairy farmer. “What opportunity does any geography have to reorganize a new Order to fit what works for them?”

Munch said producers could start a process to create a new Order, but it would still be required to use the same price formula rules because these will apply to ALL Orders uniformly. In contrast, he noted that USDA leaves pooling and depooling rules to be decided individually by each Order.

One member of the media pressed Munch to speculate on what happens if a western Order votes no, but an eastern Order votes yes?

“People always want me to speculate on what happens if California or the Upper Midwest vote out their Order(s). What we’ve seen in the past in unregulated areas, or areas with state orders — they still base a lot of their pricing on the nearby Federal Order system,” he responded.

“If we remove more milk out of the Federal Order system, does that system then play less of a role in pricing milk, and does that unregulated market start to dictate and suck milk out of the regulated areas, if you’ve taken out some of the large milk production states? That’s just some speculation, something to think about in the long term,” he said.

On a more immediate basis, Munch said that if an Order is terminated by this vote, “farmers lose protections like timely payments and component verifications, and the minimum prices. You could end up with a patchwork.”

He pointed out that USDA did not raise make allowances by the full amount requested by processors, but also did not go with the more modest increases requested by the cooperatives.

In their post-hearing comments, processors voiced great unhappiness with the decision, he said, because they didn’t get the multi-year increases to even higher levels.

“We don’t blame USDA for trying to come up with a middle ground… we just don’t have the data. The way hearing processes work is they collect this data brought by stakeholders and try to come up with a compromise that works for everybody,” Munch explained. “Our argument is that the data may not reflect market conditions, and we want to make sure that it does. We can’t get that assurance until there’s an audited, mandatory survey.”

As a standalone piece, AFBF estimates that USDA’s proposed increase in make allowances would remove an additional $1.25 billion annually from producer pool revenue, nationwide, based on past pooling data. However, USDA proposes a one-year delay in implementing the milk composition updates that would contribute $200 million annually in producer pool revenue nationwide.

Munch sees the 12-month delay in implementing the milk composition standards and the splitting of the Class I mover with an ESL adjuster as two things that appear to be “thrown in there,” with a lot of groups voicing discontent and confusion.

When asked by a reporter if the add-ons to Class I will create consumer resistance to what could be a 25-cents-per-gallon increase in retail fluid milk prices, Munch cited the hearing record where economists testified to the relative inelasticity of fluid milk demand.

He also sees great opportunity for milk: “When I go to the gym, I used to see no one drinking milk. Now I see tons of people drinking milk, protein shakes, and other things, and it’s not plant-based products. I think milk can take advantage of marketing the protein benefits that people in my generation are looking for and are willing to pay for.”

Munch was asked if AFBF will recommend how its dairy members should vote.

“We will not make that recommendation. We take positions based on our policy, which includes opposing any make allowance updates until we have mandatory cost of processing surveys, and other aspects related to our policy book,” he replied. “It’s up to our members to make those voting decisions, and there is a regionality to this, so we don’t get involved at that level.”

Florida producers, for example, “will be okay with the new rules” because the over 80% Class I utilization brings with it higher location differentials. The Upper Midwest, on the other hand, has been at roughly 5% Class I and 93% Class III, so there is very little benefit from the Class I changes, but those producers are subjected to the highest make allowance deductions for Class III products, which is 95% of their blend price.

-30-

Concerning surprises in FMMO proposed rule; Comments due Sept. 13th

By Sherry Bunting, Farmshine, Sept. 6, 2024

EAST EARL, Pa. – “Those who don’t learn from history are doomed to repeat it.” That was the theme of the American Dairy Coalition’s webinar on the USDA’s proposed Federal Milk Marketing Order (FMMO) pricing changes, which I participated in last Thursday, August 29th.

Over 125 people participated, including state dairy and state farm bureau organization leaders and individual producers. American Farm Bureau economist Danny Munch helped producers understand the proposed changes and walked through the areas of mutual concern. Other panelists offered information, and participants’ questions were addressed.

“This webinar was a grassroots dairy producer undertaking,” said moderator Kim Bremmer of Wisconsin-based Ag Inspirations. “ADC planned it to make sure dairy farmers have a way to ask questions before the public comment period closes on Sept. 13th. We know the last update to milk pricing occurred in that 2018 farm bill, and that was without your input, and it cost dairy producers over a billion dollars across the country. It is really important that your voices are heard.”

Four primary areas of concern were discussed: the processor make allowance increase, the size of the whey make allowance relative to the price, delayed timing of beneficial updates to milk composition, and the surprising 2-mover system for Class I, effectively adding a 5th class of milk to the FMMO pricing scheme.

A 2-mover system was not vetted during the very lengthy USDA hearing. It appears to be “thrown in” as a last-minute compromise to appease processors investing in extended shelf life (ESL) fluid milk capacity.

Nestle and Fairlife had testified to sales volume growth when they offered 9 to 12-month flat-pricing after the average-of was implemented in May 2019. They said they must have average-of pricing to manage their risk so they can offer long-term pricing to grow sales.

Make allowance increases quite large

USDA proposes to raise processor make allowance credits by 29 to 33% above the current level. That equates to a 75-cents to $1.00 per hundredweight new deduction from milk checks, embedded in the pricing formulas, depending on how the milk was utilized.

Munch said make allowances are part of the formulas that start with surveying market prices for the four base commodities – 40-lb cheddar cheese blocks, butter, nonfat dry milk, and dry whey. USDA works backwards from the surveyed price to derive a value for the raw milk.

He used a cartoon imagining of “little Zippy selling cheese at his cheese stand.” (a light-hearted reference to AFBF president Zippy Duvall, a former dairyman).

“USDA is surveying the volume and value that he is selling it at — out in the marketplace — and then is using that price to derive a raw milk price,” Munch said, explaining that, “working backward, there has to be a part of the formula that accounts for the cost for Little Zippy to convert the raw milk into the cheese. He uses non-dairy ingredients like cultures and salts. It’s his own labor as well as overhead and equipment that he uses to convert raw milk into cheese. In the FMMO system, that deduction that accounts for his costs is called the make allowance,” he continued.

But today, the Little Zippys of the dairy industry are not so little, and they report much less on the USDA price survey, and they make so much more of the products that are NOT price-surveyed. These other products — such as mozzarella cheese, pizza cheese, other non-cheddar cheeses or cheddar cheeses in other bulk package sizes, whey protein concentrate, skim milk powder, whole milk powder, unsalted butter, and on and on — are not part of the formula and do not contribute value to the farmer’s milk check. Class I and II products are not price-surveyed either.

“When we look at the surveys, so many things are made out of the wonderful perfect nutrition of milk made on our farms, so what is the percent of products that are actually represented in the surveys?” asked Indiana dairy producer Sam Schwoeppe, who moderated the webinar Q&A

Survey volume quite small

Munch said the volume captured is “quite small and declining” to 14.8% in 2022 after being a high of 26.4% in 2002. “But those are just the products that are actually surveyed. There’s a lot of products that are not even surveyed, and that means the percent is even less.”

American Farm Bureau, American Dairy Coalition, and others pushed for some other bulk products to be added, but those proposals were rejected in this USDA decision.

So, how can current make allowance levels be too low when processors are spending billions to expand? Or, are dairy farmers expected to pay this debt service? 

Dr. Michael Dykes, the CEO of the International Dairy Foods Association (IDFA), representing processors, told dairy farmers at the Georgia Dairy Conference in January 2024 that, “7 billion in new processing investments (below) will be coming online in the next two to three years. There’s a lot of cheese in those plans. These are going to be efficient plants. You’re going to see consolidation.”

The proposed make allowance increases of 5 to nearly 7 cents per pound across the four commodities equate to a new embedded milk check deduction of nearly $1.00 per hundredweight for Class III and around 75 cents for Class IV – over and above the current make allowances that already equate to $2.20 to $3.40 per hundredweight. Class I would see this embedded in advance skim and fat pricing factors that are used to set the base price mover.

Collectively, the make allowance increases could remove $1.25 billion annually from FMMO pools, Munch showed in a 5-year static analysis based on prior pool composition, (See chart at top). Other aspects of USDA’s full proposal will defray some or all of the loss, mainly in the FMMOs with more Class I utilization. USDA’s proposal includes increases in location differentials for Class I fluid milk.

What happened in 2008-09?

Learn from the past or be doomed to repeat it? The last time make allowances were increased in 2008, a dairy market crash followed. As a webinar panelist and ag journalist, I pointed out that the dry whey price fell below the dry whey make allowance for the first seven months of that implementation from October 2008 through April 2009, resulting in penalties deducted from milk checks on every pound of other solids in the milk.

This time, the proposed dry whey make allowance is the largest of all – up 33.2% from $0.1991/lb now to $0.2653/lb. If in effect a year ago, dairy farmers would have again seen negative other solids penalties on their milk checks in July and August 2023 when milk prices were at their lowest. Meanwhile, processors made less dry whey, instead making more value-added products that are not price-surveyed.

Munch noted that only 66% of the plants on the price survey actually participated in the voluntary cost survey used by USDA to set the proposed new make allowances. AFBF, ADC and other organizations have been on record opposing make allowance increases until mandatory, audited surveys are conducted by USDA.

Conversion from fresh milk to ESL?

Learn from the past or be doomed to repeat it? On the Class I side, the 2018 farm bill changed the base price calculation. Farmers were told this would be revenue neutral, but the change cost them – at minimum — $1.25 billion over the past five years.

USDA now proposes to restore the higher-of calculation, but only for conventionally pasteurized HTST (or fresh) milk. Extended shelf life (or ESL) fluid milk products — labeled good for 60 days or more — would be priced using a new average-of method with a rolling adjuster.

Shouldn’t ESL have been defined in the hearing, and the economic impacts studied? This idea of two different Class I movers was not vetted in the hearing.

With two movers, fluid milk costs could be different from the same location based on shelf life. Webinar comments questioned USDA’s loose definition of ESL; Could processors change the label to move between the movers and pay whichever mover was lower?

The USDA’s one-year static analysis showed the ESL Class I mover would have ranged from being $1.18 per hundredweight over to 95 cents under the HTST Class I mover in various months of 2023. That’s a big spread.

What’s at the root here? The dairy checkoff has openly identified ESL milk as the new milk beverage platform, using dairy farmer funds to research and promote it and to show consumers can be ‘taught’ to accept it.

Dr. Dykes of IDFA, at the Georgia meeting in January 2024, also told dairy producers that “this is the direction we (processors) are moving… to get to some economies of scale and bring margin back to the business.” He said the planned new fluid milk processing capacity investments are largely ultra-filtered, aseptic, and ESL. (10 of the 11 fluid milk plants on the IDFA map above are ESL and/or aseptic fluid milk plants. Some will also make ultrafiltered milk, and some will make plant-based beverages at the same location.)

Has USDA considered the purpose of the FMMO system is to promote orderly marketing and the adequate supply of FRESH FLUID MILK? Will consumers accept the taste of the not-so-fresh ESL and aseptic milk, or migrate faster to other beverages if fresh fluid milk is less available to them?

Would a 2-mover system ultimately reduce farmers’ access to milk markets in some regions and diminish the food security of those consumers? Prized as the freshest, least processed, most regionally local food at the supermarket, will the USDA decision reduce fresh fluid milk availability down the road?

How will the 2-mover system impact dairy farms located outside of the industry’s very specific identified growth centers? And will this perpetuate the wide divergence between Classes III and IV that has been an issue since 2019, further punishing dairy farmers with disorderly marketing and opportunistic depooling?

Webinar participants asked: “Will commenting even matter? Or is the USDA Secretary’s mind made up? How important is individual farmer input?”

“It’s extremely important for farmers to get involved. Even with talking points, really tell your own story with it,” said Munch. “They like hearing from you, and the stories of the impacts to your balance sheet, to your future revenue or the stability of your local community. They want to know the impact on small businesses. That’s one of the driving points.”

Not much time

With a short time remaining to comment at the Federal Register Docket AMS-DA-23-0031-0002.

American Dairy Coalition has prepared an official comment, so other like-minded organizations and individuals can sign on before the filing deadline, which is 11:59 p.m. Friday evening, Sept. 13, 2024.

Comment directly to the Federal Register docket at https://www.federalregister.gov/documents/2024/07/15/2024-14769/milk-in-the-northeast-and-other-marketing-areas-proposed-amendments-to-marketing-agreements-and

Click here to read the ADC’s comment that will be filed before the deadline Friday evening at Sept. 13 at 11:59 p.m. Dairy farmers and organizations wanting to associate themselves with the comment can click here.

Click here to view ADC’s Aug. 29 webinar.

Click here to read Danny Munch’s at Farm Bureau Market Intel.

Why the proposed 33.3% raise in the whey make allowance is way too big without a ‘snubber’

By Sherry Bunting, Milk Market Moos in Farmshine, Aug. 9, 2024

USDA’s weekly National Dairy Product Sales Report (NDPSR) is out of whack on whey. The NDPSR is the mandatory processor survey of prices on the four commodities used in Federal Milk Marketing Order (FMMO) end-product pricing formulas.

The NDPSR price for dry whey for the week ending Aug. 3 was $0.4672/lb, a modest improvement of a half penny over the previous week’s NDPSR, but still 10 to 14 cents lower than the past three weeks of weighted average spot prices, and a nickel lower today than even at the start of the spot market rally six weeks ago.

The NDPSR should have caught up closer to the spot market by now, considering that only sales that are forward priced within 30 days can be reported.

The CME spot market is what processors touted during FMMO hearing testimony as the ‘market clearing’ price that they use as a baseline to price commodities for export and non-formula, non-reported ‘value added’ products.

They also lamented — at length — that USDA is setting producer minimum prices too high, some threatening to modify future expansion plans if they don’t get to ‘market clearing levels’ with higher make allowances deducted for their rising costs — including ‘sustainability costs’, they want covered.

If these dry whey ‘market clearing’ CME spot values we have been seeing of late are not translating to the NDPSR used in FMMO class and component price formulas over a three to six week period, then maybe we should all be questioning the 33.3% raise the processors will be getting from dairy farmers’ milk checks in the dry whey make allowance that USDA proposes to increase from the current $0.1991/lb to $0.2653/lb. That is, if the proposed rule announced July 1st survives the 60-day comment period, 60-day review, and producer referendum early next year.

I wonder if USDA underestimates how fed-up the farmers are in the Upper Midwest with being the worst-paid in the nation seeing the biggest make allowance bite coming right at them in this proposal — and very little Class I benefit to offset it. After 5 years of disrupted pooling by the ‘average of’ method, Order 30 has developed some bad pool-jumping habits that could linger in that region — even when fluid milk pricing returns to the higher of. Who knows?

If a two-thirds ‘yes’ vote is not achieved in Order 30, or any Order for that matter, the Market Administrator’s office there closes, immediately.

There is so much value in whey today, and it’s a byproduct of the cheesemaking process to begin with. It’s hard for this observer to resolve conflicts of logic in the size of this raise that USDA justifies based on voluntary surveys in which only a fraction of the plants that price report would offer their cost of processing data to determine.

In fact, even Dr. Mark Stephenson said it was more challenging this time to separate-out the costs for other products that are not price reported, but made in the same plants. He said today’s plants are more complex than in 2006 when the model was used on voluntary data to set the current make allowances that were implemented in 2008, the last time they were raised.

But folks, there’s no snubber, and for dry whey, that’s a problem. When farmers were losing their shirts last summer, they would have been giving away the ‘other solids’ in their milk for free — or paying processors a small fee to take them as though worthless — because the dry whey price at that time was equal to or fractionally less than what the new proposed dry whey make allowance would be!

It happened the last time make allowances were raised in 2008, just ahead of the 2009 dairy crisis. I’ll not soon forget farmers asking me if there is some way to avoid sending the ‘other solids’. Of course, that’s silly, but we get the point, and it’s sharp.

This is significant in the Upper Midwest, where it impacts over 90% of the milk because it’s a Class III market. But this also affects all Orders to some degree, depending on pool composition. With new processing capacity coming online, much of it cheese, in the next 12 to 24 months, other milk marketing areas will see Class III growth change their blend prices too.

The other thing to think about is USDA proposes to implement the new make allowances for all four commodities right away after the referendum in early 2025, but some of the other parts of the proposed rule will be delayed because of risk management impacts. Yet make allowances also impact risk management. They are also part of the formula for the Class III and IV milk prices — so this change also would immediately affect the futures board. In fact, that’s part of what happened in 2008.

Can you imagine an immediate $0.75 to $1.00 drop on the futures board due to higher processor credits? What’s the calculus there? The make allowance for dry whey affects the ‘other solids’ value as well as the Class III price.

And then we have the added insult of ‘pizza cheese’ being billed as ‘like mozzarella’ just moister because it’s a second process of the whey and water to congeal some secondary curd. It is essentially whey cheese with a different melting texture (I notice it browns cardboard-flaky on frozen pizza before the dough is done, but keeps some moisture. I don’t buy my once favorite frozen pizza brands anymore suspecting that’s the problem). It’s also used as a crust filler.

So, how much real mozzarella is being displaced, and how much near-mozz value are they selling this whey product for? That’s a price that never gets reported because it’s — well — not dry whey. It’s a proprietary value-added product.

The ubiquitous whey protein concentrates and isolates found in so many high protein drink and snack preparations are another hot ticket not getting price reported. And yet, here’s dry whey at 50 to 60 cents/lb for 6 weeks on the market-clearing CME, and the price going into the FMMO formulas is hanging back at 43 to 47 cents/lb over the same 6 week period.

Spot market red, not as bad as it looks

The whey market traded 6 loads on the CME spot sessions this week with a penny loss at 59 cents/lb Wed., Aug. 7 vs. the prior Wednesday. The weighted average for the week is still at just about 60 cents/lb.

The CME spot cheese market was mostly quiet again this week, but prices for blocks moved higher Wed., Aug. 7, when 40-lb block Cheddar was pegged at $1.9650 — up 4 cents from the prior Wednesday, with 4 loads trading the first three days. The 500-lb barrel cheese price, pegged at $1.95/lb was down 2 1/2 cents compared with a week ago; 3 loads traded. The NDPSR for week ending Aug. 3 was reported in reverse with a 4-cent barrel over block advantage at $1.9788/lb and $1.9390/lb, respectively.

Butter melted off 2 cents after last week’s 39-load haul came to a grinding halt Aug. 1st. Nothing traded from Aug. 2 through 7, and the spot butter price remained at $3.1025/lb Wed., Aug. 7. The weighted average was steady at just over $3.10/lb, off 3 cents from the NDPSR price of $3.1315/lb for week ending Aug. 3.

Grade A nonfat dry milk trade remained active the first three days this week with a whopping 23 loads changing hands, and the spot price pegged at $1.23/lb Wed., Aug. 7, down a penny and a half from the prior Wednesday. The weighted average for stood at $1.2317, and the NDPSR price continued to lag the past few weeks of spot market levels by three cents.

We see these headlines that the recent gains in farm milk prices are taking away the U.S. competitive advantage on the world market. Don’t believe them, folks. While it is true that nonfat dry milk is running above the global skim milk powder price, the reason is because we are not making nearly as much milk powder in the U.S. because milk is tight, cheese capacity has expanded, and cheese-vats are pulling in the available milk. Fluid milk sales are also up year over year. We are also not building powder inventory, so of course this means we’ll export less.

On the cheese and whey, there’s plenty of wiggle room between U.S. and global prices, judging by the recent Global Dairy Trade auction.

Global Dairy Trade index up 0.5%

The GDT biweekly internet auction on Tues., Aug. 6 added value to the mid-July gain — up 0.5% vs, July 16.

Here’s the kicker. The cheese index for Sept. 2024 through Feb. 2025 delivery was higher than the current U.S. market-clearing block and barrel prices. Meanwhile, lactose outpaced the current NDPSR drag on whey.

The big story is bulk mozzarella was up a record 8.4% with all sales contracted for delivery October 2024. The bulk mozzarella contracts are new. They have only been trading on the GDT since December 2023. Tuesday’s sales — all for Oct. 2024 delivery — are, by far, the highest yet of the 15 sessions in which bulk mozzarella was offered. The CME does not have a U.S. ‘clearing market’ for mozzarella. Furthermore, USDA does not include bulk mozzarella in the mandatory NDPSR weekly survey because mozzarella prices are not used in the FMMO milk pricing formulas. A proposal to add this was rejected by USDA in its recommended decision July 1st.

The GDT Industrial bulk cheddar index was up 1.3% compared with three weeks ago at an average $1.94/lb — 2 cents higher than the weighted weekly average on CME barrels and 4 cents over CME blocks. September delivery cheddar averaged $1.90/lb and October dipped to $1.89/lb, but product for delivery Nov. through Feb. moved toward $1.98/lb.

Meanwhile, USDA agreed with NMPF’s proposal to remove the 500-lb barrel cheese price from the weighted average used in the FMMO formulas. This will mean only the 40-lb block cheddar price will be used in the future to calculate the protein and Class III milk prices. Barrels have been trading over blocks recently, and during the FMMO hearing, IDFA witnesses (opposing the change) said they use the barrel price and dry whey price as the basis for pricing U.S. mozzarella for export sales.

Higher GDT indexes were also achieved Tuesday on the following products: Whole milk powder up 2.4%, averaging $1.48/lb; Anhydrous milkfat powder (AMF) up 1.2%, averaging $3.14; Lactose up a whopping 16%, at 42 cents/lb. Lower indexes were reported on Skim Milk Powder (SMP) down 2.7%, averaging $1.15/lb; and Butter down 2.4%, averaging $2.99/lb.

Milk futures mixed

Class III milk futures were generally steady this week, except near-term September took a 45-cent hit and 2025 contracts were mostly firm to a nickel higher, spots up 15 cents. Class IV futures were steady through 2024, but 10 to 30 cents lower on 2025 contracts. On Wed., Aug. 7, Class III milk futures for the next 12 months (Aug24-Jul25) averaged $19.41, down 3 cents from the same 12 months averaged on the previous Wednesday. The 12-month Class IV average at $20.82 was down a dime.

June DMC margin $11.66, up $8.00 above year ago program lows

As expected, the June DMC margin came in at $11.66, which is $2.16 above the highest tier one coverage level of $9.50/cwt. Announced August 2nd, the June margin was based on an 80-cent higher All-Milk price at $22.80/cwt and a 34-cent drop in feed cost at $11.14/cwt for a DMC margin that was deemed $1.14 higher than May and up by a whopping $8.00/cwt above year-ago program lows set in June and July 2023 at $3.65 and $3.52.

30-day H5N1 detections at 36 in 6 states, Colorado continues to be a breaking hot-spot, Iowa drops from the list, South Dakota returns

As of August 9, 2024, the current confirmed cases of H5N1 in dairy cows within the past 30 days stand at 36 herds in 6 states. Of these, 28 are in Colorado, where the most recent slew of 12 detections were reported for Aug. 5 and 6. Colorado remains the hot spot by a long shot. The state issued an order July 22nd to require mandatory bulk tank milk testing.

Iowa dropped from the 30-day list this week, but South Dakota returned to the list with 2 detections. Other states with confirmed cases within the past 30 days are: Minnesota (1), Idaho (1), Texas (2), and Michigan (1). Cumulatively, since the beginning of the outbreak on March 25, 2024, there have been 190 detections in 13 states.

Enrollments in the national voluntary dairy herd status bulk tank testing include 24 herds: Michigan (10), New Mexico (4), Pennsylvania (3), and 1 herd each in Kansas, Nebraska, North Carolina, Ohio, South Dakota, Tennessee, and Texas. Colorado herds (110) are now all being bulk-tank tested due to the state’s mandatory ruling on July 22.

USDA recommends changes to milk pricing formulas and other Milk Market Moos

By Sherry Bunting, Milk Market Moos column in Farmshine, July 5, 2024 (with updates)

USDA issued a 332-page recommended decision on July 1 for changes to pricing formulas in all 11 Federal Milk Marketing Orders, which was later published in the Federal Register July 15.

The bottom line is a mixed bag of positives, negatives, and questions requiring further study.

USDA AMS professionals did yeoman’s work with the 49 hearing days across five months of proceedings on 21 proposals, yielding 500 exhibits; more than 12,000 pages of transcripts of testimony from farmers, cooperatives, processors and others, along with cross-examination; and over 30 post hearing briefs and correspondence.

Once the draft decision is officially published in the Federal Register in the coming weeks, the 60-day public comment period begins, followed by 60 days of USDA evaluation of the feedback, followed by a final rule, followed by a producer referendum.

According to the FAQ section at the USDA AMS national hearing website, only producers who are pooled in the selected representative month in each Federal Order will be eligible to vote. Each of the 11 Orders votes separately.

If two-thirds of those eligible dairy farmers OR two-thirds of the pooled volume they represent in an Order vote “yes,” then that Order continues, as amended. If neither two-thirds threshold is met, then that Order is terminated. *AMS answered our question on the two-thirds determination that it is determined by the number of eligible (pooled) producers who actually participate in the vote, stating: “If a producer receives a ballot but does not return it, the producer is not included in either the numerator or the denominator of the two-thirds calculation.”

Here’s what’s in the USDA recommended decision package:

1) Milk Composition Factors: USDA recommends updating the milk composition factors to 3.3% true protein, 6.0% other solids, and 9.3% nonfat solids. This would mainly affect Class I in all Orders and the other Class prices in the fat/skim priced Orders.

2) Surveyed Commodity Products: The recommendation here is to remove the 500-pound barrel cheese prices from the Dairy Product Mandatory Reporting Program survey and rely solely on the 40-pound block cheddar cheese price to determine the monthly average cheese price used in the Class III and protein formulas. National Milk Producers Federation (NMPF) proposed this and International Dairy Foods Association (IDFA) opposed it. American Farm Bureau Federation (AFBF) had proposed adding unsalted butter and 640-lb block cheddar to the survey, and California Dairy Campaign had proposed adding bulk mozzarella. Neither of these proposals were included in USDA’s recommended decision.

AFBF chief economist Roger Cryan discussed this recently on Farm Bureau Newsline, where he also talked about USDA decision not to include AFBF’s proposal to raise the Class II differential.

3) Class III and Class IV Formula Factors: USDA chose to recommend make allowance increases that fall in between the lower increase proposed by NMPF and the higher increase proposed by IDFA and Wisconsin Cheesemakers. The USDA recommendation is to raise these manufacturing allowances from current levels to these new levels: Cheese: $0.2504; Butter: $0.2257; NFDM: $0.2268; and Dry Whey: $0.2653. The recommended decision also proposes updating the butterfat recovery factor to 91%.

By our calculations, the proposed make allowance increase would equate to roughly an additional 80 cents per hundredweight deduction from milk checks embedded in the pricing formulas. Current make allowances total up to about $2.75 to $3.60 per hundredweight, depending on product mix. New make allowances would total up to about $3.25 to $4.50 per hundredweight, depending on product mix.

AFBF economist Danny Munch was interviewed by Brownfield Ag on July 2, noting the increase is 5 to 7 cents per pound. “When we loop that into a per-hundredweight value, that means farmers will be seeing 75 cents to 87 cents less per hundredweight on their milk checks because of the increased make allowance.” He says the data used for the make allowances was based on voluntary cost of production surveys. 

Farm Bureau president Zippy Duvall did not mince words: “We strongly believe make allowances should not be changed without a mandatory, audited survey of processors’ costs. Our dairy farmers deserve fairness in their milk checks and transparency in the formula, but the milk marketing order system can’t deliver that unless make allowances are based on accurate and unbiased data,” he said in an AFBF news release.

American Dairy Coalition CEO Laurie Fischer also weighed in: “We are disappointed that USDA has proposed higher make allowance credits for processors, which are — in effect — deductions from farmer milk checks that are embedded within the pricing formulas. The industry does not yet have mandatory, audited cost surveys, and there is no connection between increased processor credits and a transparent, adequate price paid to farmers,” she said in an ADC news release, adding that these two elements have been key policy priorities for ADC since January of 2022.

4) Class I differentials: USDA recommends updating Class I differential values to reflect the increased cost of servicing the Class I market. The base differential for all counties stays at $1.60, and the county-specific Class I differentials are specified in the decision at levels higher than they are currently, but by less than the increases that had been proposed by NMPF.

5) Base Class I Skim Milk Price: USDA recommends going back to the higher-of the advanced Class III or Class IV skim milk prices to set the Class I mover each month. However, the Department did not go with Farm Bureau’s request to do this on an emergency expedited basis.

And, here’s where it gets tricky, the higher-of method would only apply to fresh fluid milk, while adopting a rolling monthly adjuster that incorporates the average-of for milk that is used to make extended shelf life (ESL) fluid products, including shelf-stable milk.

This means ESL milk would be priced differently from conventional fresh fluid milk within the same Class I category. A simple averaging method would be used as part of this special ESL adjuster, which would incorporate a 24-month rolling average (with a 12-month lag) of the difference between the higher-of minus the average-of, which is added to the current month simple average-of, and then the current month higher-of is subtracted from that sum. This adjuster could be either a positive or negative number.

In fact, we’ve learned that this ESL adjuster, using months 13 through 36 counting backward from the implementation date, would allow milk for ESL products to recoup, over time, some of the very large prior losses experienced by all dairy farmers during the average-of method that has been in place since May 2019. Because a simple average is used for the adjuster calculation, without the 74 cents, more would be recouped than the actual loss difference experienced under the years of the average plus 74 cents method. On the other hand, the rolling adjuster look back will include months in which a smaller make allowance was in effect than could be the case in the future if USDA’s make allowance recommendation becomes final.

Meanwhile, producers of milk bottled as ‘regular’ fresh fluid milk would start right out of the implementation gate at the higher-of and recoup zero prior loss endured under the current form of average-of, and be subjected to the higher make allowance, which is built into the advance pricing factors. (More on this feature of the USDA recommended decision in a future article.)

In its ‘notice to trade,’ USDA states that the ESL adjuster was developed to “provide for better price equity for ESL products whose marketing characteristics are distinct from other Class I products.”

Meanwhile, in his July 3rd CEO’s Corner, NMPF’s Gregg Doud appears to embrace what is essentially a fifth milk class given the different pricing methods proposed in the recommended decision for Class I — depending on shelf-life classification.

Doud writes: “Recognizing the need to restore orderly milk marketing, USDA decided to go back to the higher-of, with an accommodation for extended shelf-life milk, thus granting NMPF’s request for the vast majority of U.S. fluid milk. USDA’s solution is, frankly, as innovative as it is fair – a classic case of two sides not getting all that everyone wanted, but everyone getting what they most needed.”

Splitting the baby was not part of any hearing proposal that we could find; apparently processors made their case with USDA as to needing the average-of method (with calculated adjuster) to sell ESL milk products deemed the new milk beverage platform.

During the national hearing in Carmel, Indiana, representatives from Nestle, a major maker of ESL fluid milk products, said their sales increased once the average-of method was implemented in May 2019 through legislative language in the 2018 farm bill. They testified that they could manage risk when providing 9 to 12 month future pricing on shelf-stable fluid products to foodservice and convenience stores. They lamented that losing the average-of would hurt their sales.

Representatives for fairlife testified that forward pricing of their ESL products was critical to their ability to grow sales and that losing the average-of would impact future plans, including the size of the new plant being planned for New York State and other expansions elsewhere in the future.

However, since this bifurcation of Class I was not a proposal subject to vetting, no one had the opportunity to present evidence on future impacts.

Public comments on the recommended proposals will be accepted for 60 calendar days after the decision is published in the Federal Register. Comments should be submitted at the Federal eRulemaking portal: http://www.regulations.gov or the Office of the Hearing Clerk, U.S. Department of Agriculture, 1400 Independence Ave., SW, Stop 9203, Room 1031, Washington, DC 20250-9203; Fax: (844) 325-6940.

OTHER MOOS — July 3, 2024

Milk futures swap trends: Cl. IV up, III down

Class III milk futures moved lower this week especially on August and Sept. 2024 contracts; while Class IV milk futures were higher on 2024 contracts, steady to firm for 2025. On Tues., July 2, Class III milk futures for the next 12 months averaged $19.28, down 24 cents from the previous Wednesday. The 12-month lass IV milk futures average was $21.19, up 14 cents. This put the spread between Class IV over III at nearly $2.00 per cwt.

Block cheese, whey higher

Pre-holiday trade was firm to higher with little volume moved on most products. But nonfat dry milk lost ground, and the 500-lb barrel cheese trade was active at lower prices.
The 40-lb block Cheddar price was pegged at $1.90/lb on Tues., July 2, up 2 cents from the previous Wednesday, with just 2 loads trading the first 2 days. The 500-lb barrel cheese market lost 2 cents, pegged at $1.88/lb Tuesday with 12 loads trading the first two days. (Update gained it back July 3 at $1.9025/lb with 2 loads trading). Dry whey gained a half-penny on the week at 49 cents/lb; one load traded.

Butter higher, powder weak

The butter market saw no trades the first two days this week. By Tues., July 2, the daily CME spot price was pegged nearly a nickel higher at $3.1375/lb. Grade A nonfat dry milk lost a penny and a half at $1.17/lb Tuesday with 4 loads changing hands. (Update, NFDM up July 3 at $1.18/lb, 2 loads traded)

May All-Milk $22.00, DMC margin $10.52

USDA announced the All-Milk price for May at $22.00, up $1.50 from April and $2.90 higher than a year ago. The national average fat test was 4.17, up 0.02 from the previous month and up 0.11 from a year ago. The Pennsylvania All-Milk price for May, at $22.50, was just 70 cents higher than for April, and fat test fell by 0.10 from April to May.

USDA announced the May Dairy Margin Coverage (DMC) margin at $10.52/cwt, up 92 cents from April and up a whopping $5.69 per cwt from the May margin a year ago. This is the third consecutive month in which no DMC margin payments were triggered as the margin remains above the highest coverage level of $9.50/cwt. The $1.50/cwt gain in the national average All-Milk price in May outpaced the 58 cents/cwt increase in feed cost.

H5N1 detections fall to 57 in just 7 states

As of July 2, 2024, the confirmed cases of H5N1 in dairy cows decreased to 57 herds in now just 7 states as South Dakota moved past the 30-day window and off the active map. Colorado has the most detections at 23 in the past 30 days, 27 cumulatively since April 25. This has created some questions as it represents 20 to 25% of the 110 herds in the 13th largest milk-producing state. Colorado is followed by Iowa (12), Idaho (9), Minnesota (6), Texas (5), while Michigan’s previously high numbers over 25 have dropped to one, and Wyoming still has just one. Michigan and Wyoming will be past their 30 days on July 7 and 12, respectively, if no new detections are confirmed.