Concerning surprises in FMMO proposed rule; Comments due Sept. 13th

By Sherry Bunting, Farmshine, Sept. 6, 2024

EAST EARL, Pa. – “Those who don’t learn from history are doomed to repeat it.” That was the theme of the American Dairy Coalition’s webinar on the USDA’s proposed Federal Milk Marketing Order (FMMO) pricing changes, which I participated in last Thursday, August 29th.

Over 125 people participated, including state dairy and state farm bureau organization leaders and individual producers. American Farm Bureau economist Danny Munch helped producers understand the proposed changes and walked through the areas of mutual concern. Other panelists offered information, and participants’ questions were addressed.

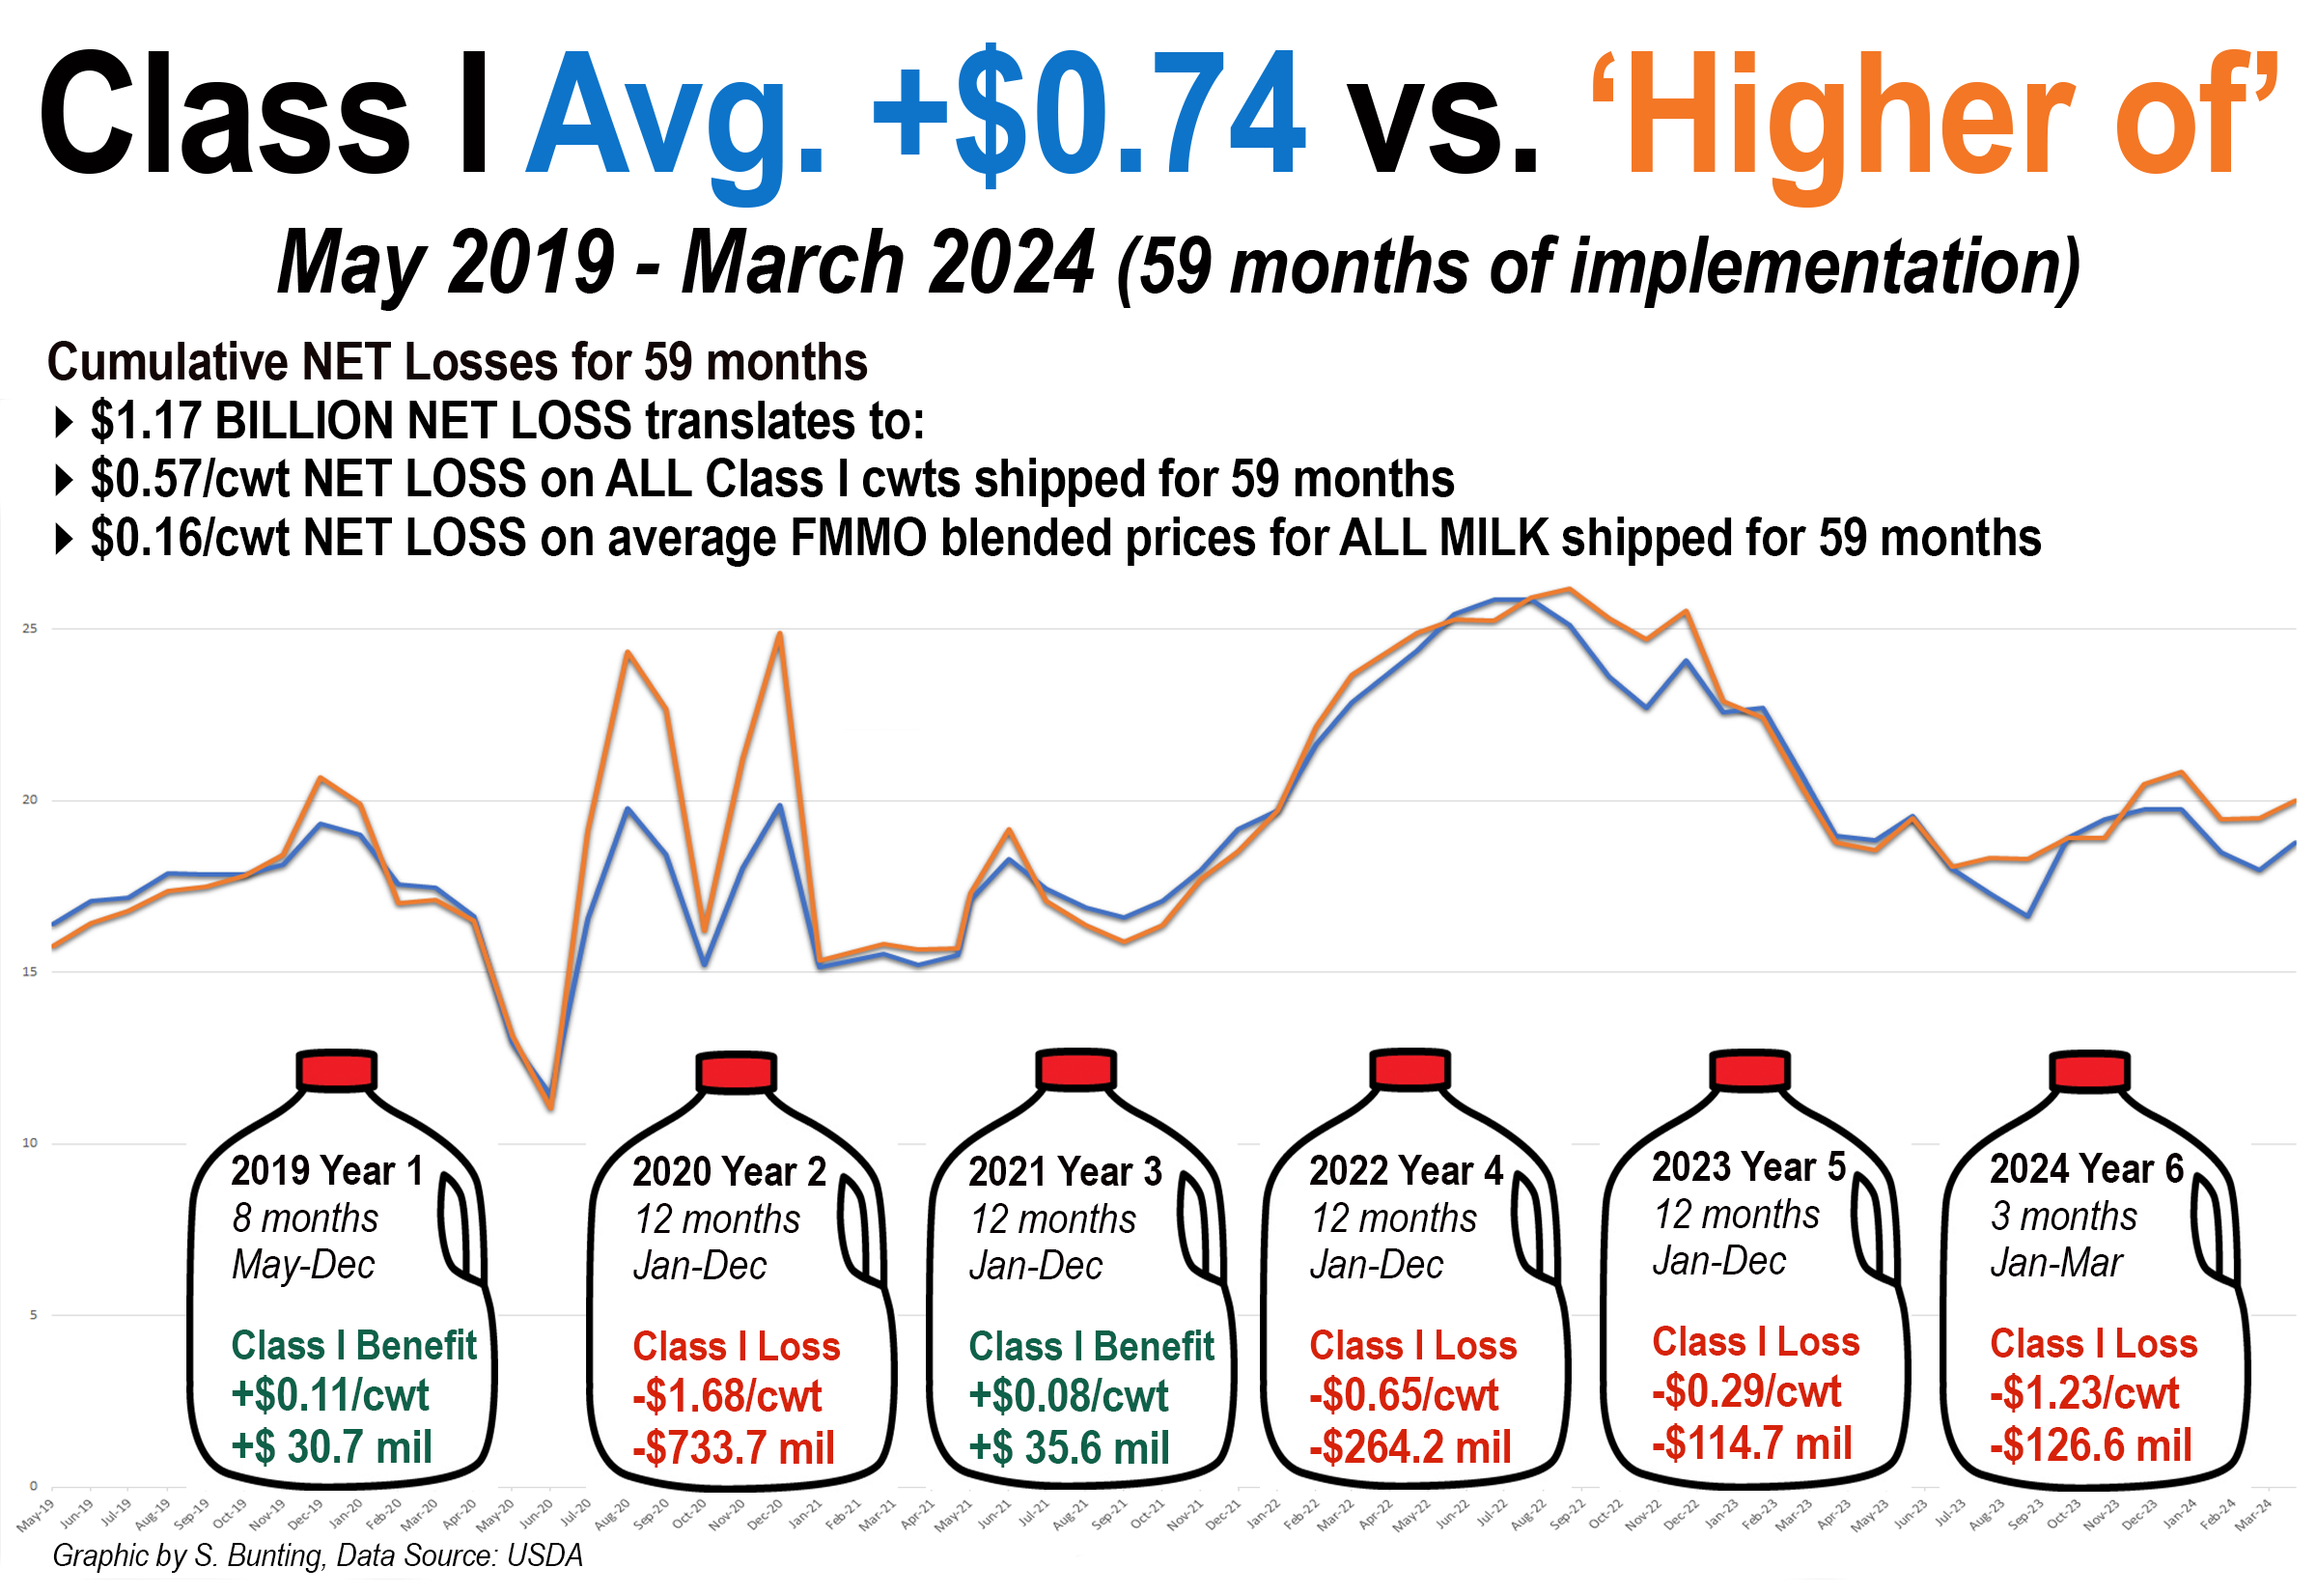
“This webinar was a grassroots dairy producer undertaking,” said moderator Kim Bremmer of Wisconsin-based Ag Inspirations. “ADC planned it to make sure dairy farmers have a way to ask questions before the public comment period closes on Sept. 13th. We know the last update to milk pricing occurred in that 2018 farm bill, and that was without your input, and it cost dairy producers over a billion dollars across the country. It is really important that your voices are heard.”

Four primary areas of concern were discussed: the processor make allowance increase, the size of the whey make allowance relative to the price, delayed timing of beneficial updates to milk composition, and the surprising 2-mover system for Class I, effectively adding a 5th class of milk to the FMMO pricing scheme.

A 2-mover system was not vetted during the very lengthy USDA hearing. It appears to be “thrown in” as a last-minute compromise to appease processors investing in extended shelf life (ESL) fluid milk capacity.

Nestle and Fairlife had testified to sales volume growth when they offered 9 to 12-month flat-pricing after the average-of was implemented in May 2019. They said they must have average-of pricing to manage their risk so they can offer long-term pricing to grow sales.

Make allowance increases quite large

USDA proposes to raise processor make allowance credits by 29 to 33% above the current level. That equates to a 75-cents to $1.00 per hundredweight new deduction from milk checks, embedded in the pricing formulas, depending on how the milk was utilized.

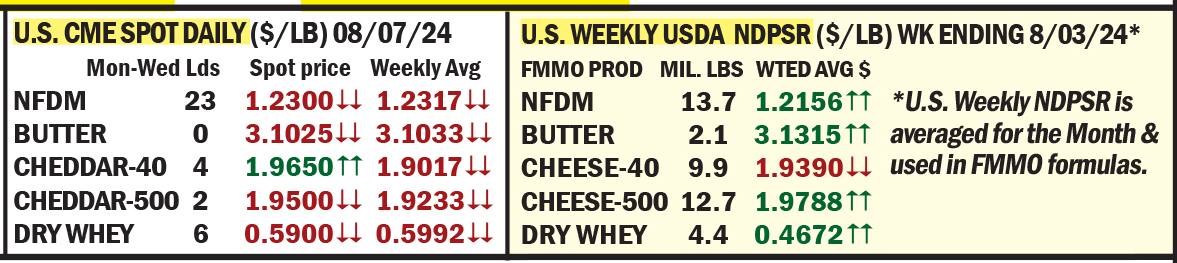
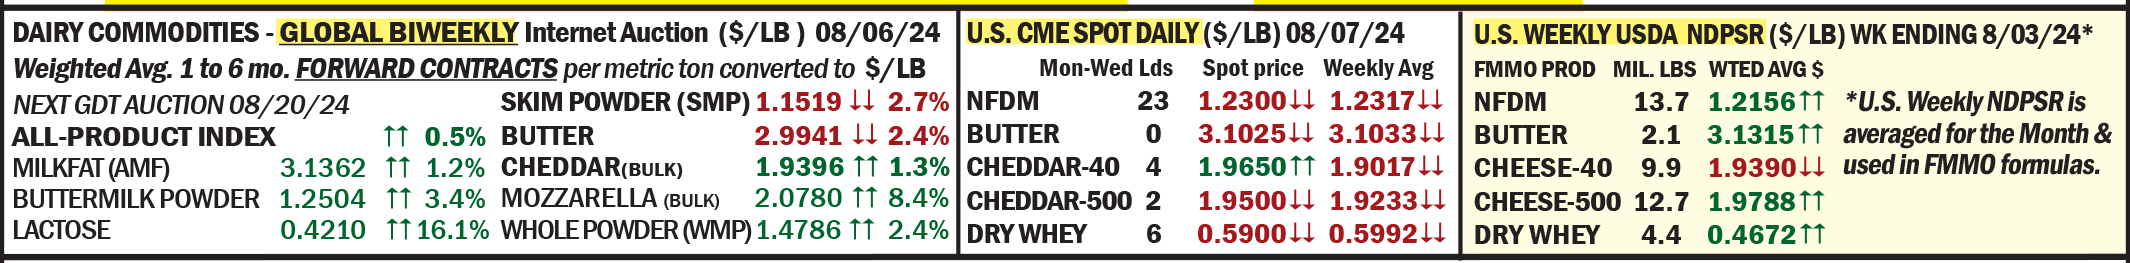
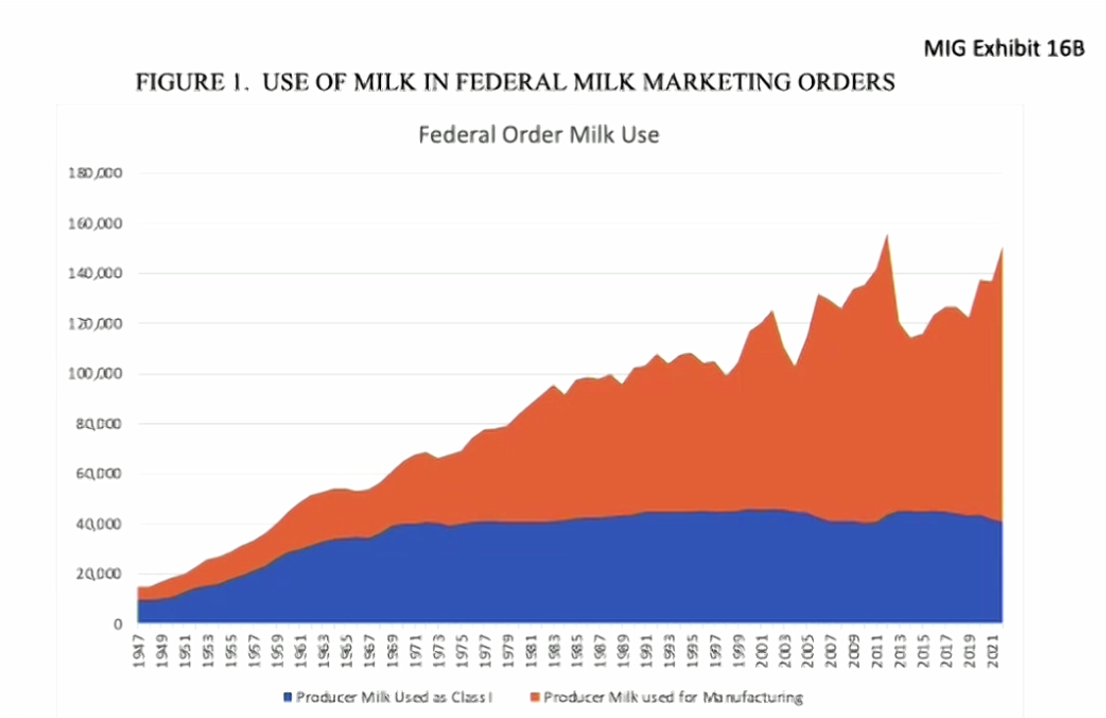
Munch said make allowances are part of the formulas that start with surveying market prices for the four base commodities – 40-lb cheddar cheese blocks, butter, nonfat dry milk, and dry whey. USDA works backwards from the surveyed price to derive a value for the raw milk.

He used a cartoon imagining of “little Zippy selling cheese at his cheese stand.” (a light-hearted reference to AFBF president Zippy Duvall, a former dairyman).

“USDA is surveying the volume and value that he is selling it at — out in the marketplace — and then is using that price to derive a raw milk price,” Munch said, explaining that, “working backward, there has to be a part of the formula that accounts for the cost for Little Zippy to convert the raw milk into the cheese. He uses non-dairy ingredients like cultures and salts. It’s his own labor as well as overhead and equipment that he uses to convert raw milk into cheese. In the FMMO system, that deduction that accounts for his costs is called the make allowance,” he continued.

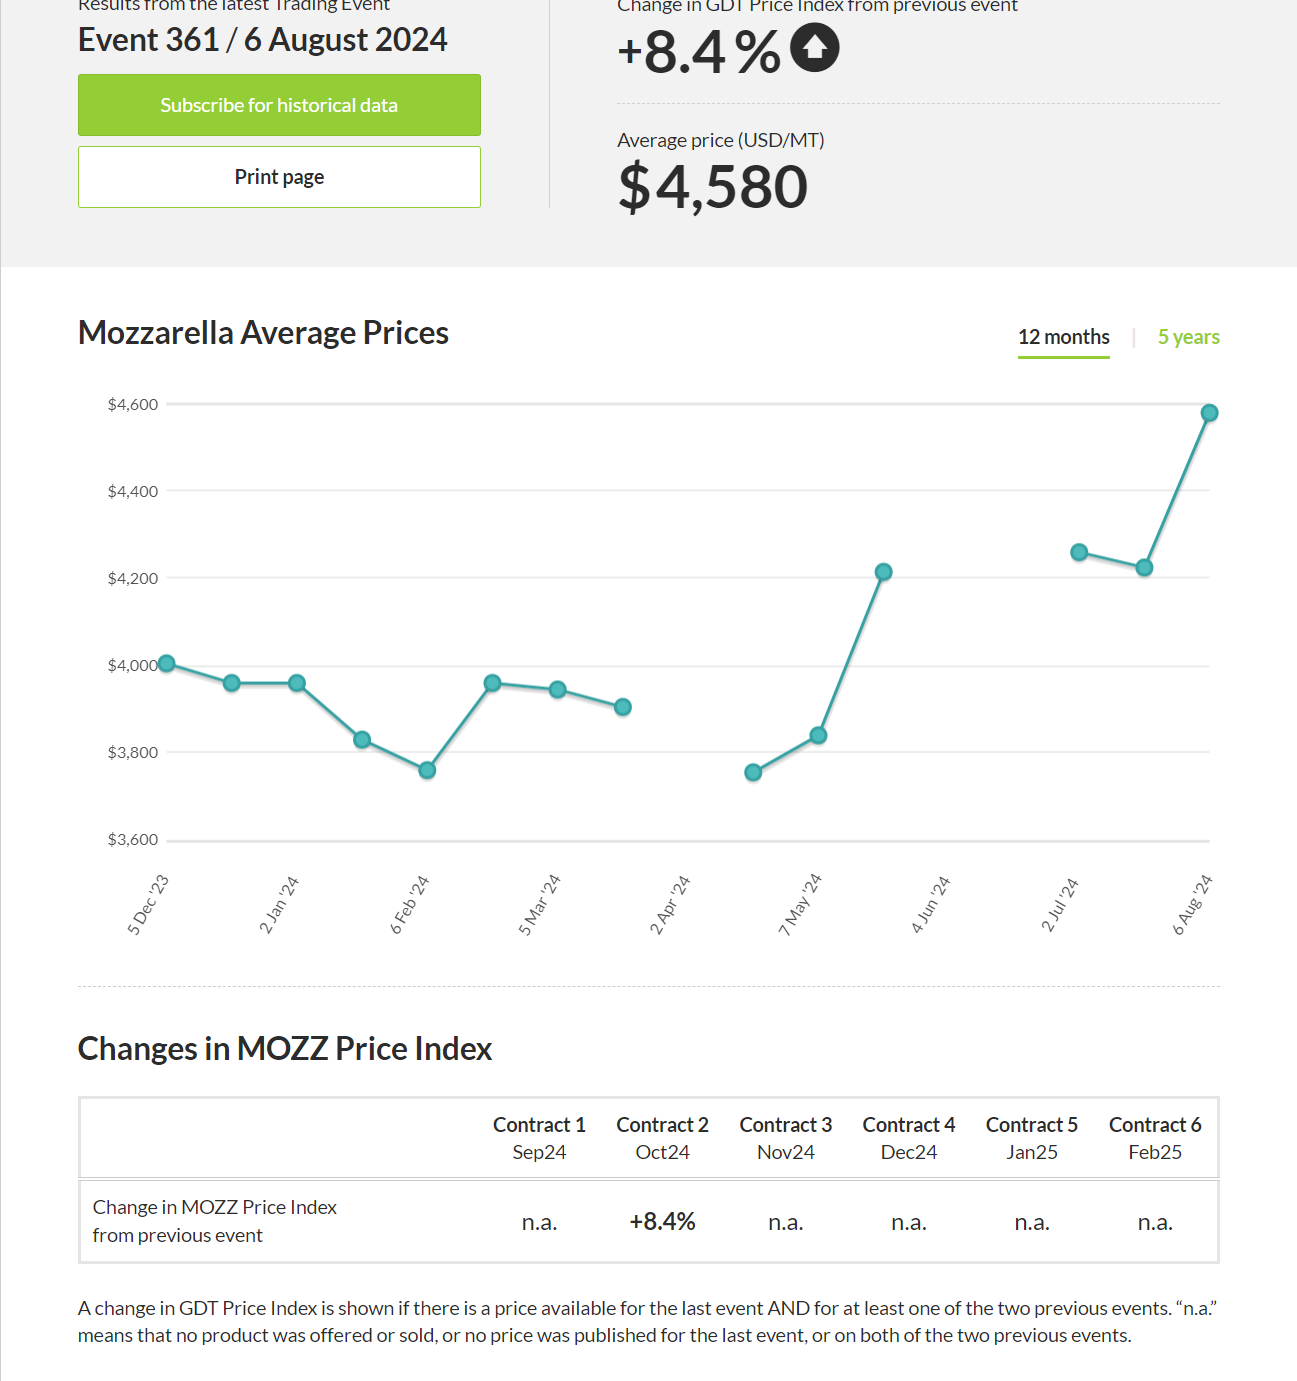
But today, the Little Zippys of the dairy industry are not so little, and they report much less on the USDA price survey, and they make so much more of the products that are NOT price-surveyed. These other products — such as mozzarella cheese, pizza cheese, other non-cheddar cheeses or cheddar cheeses in other bulk package sizes, whey protein concentrate, skim milk powder, whole milk powder, unsalted butter, and on and on — are not part of the formula and do not contribute value to the farmer’s milk check. Class I and II products are not price-surveyed either.

“When we look at the surveys, so many things are made out of the wonderful perfect nutrition of milk made on our farms, so what is the percent of products that are actually represented in the surveys?” asked Indiana dairy producer Sam Schwoeppe, who moderated the webinar Q&A

Survey volume quite small

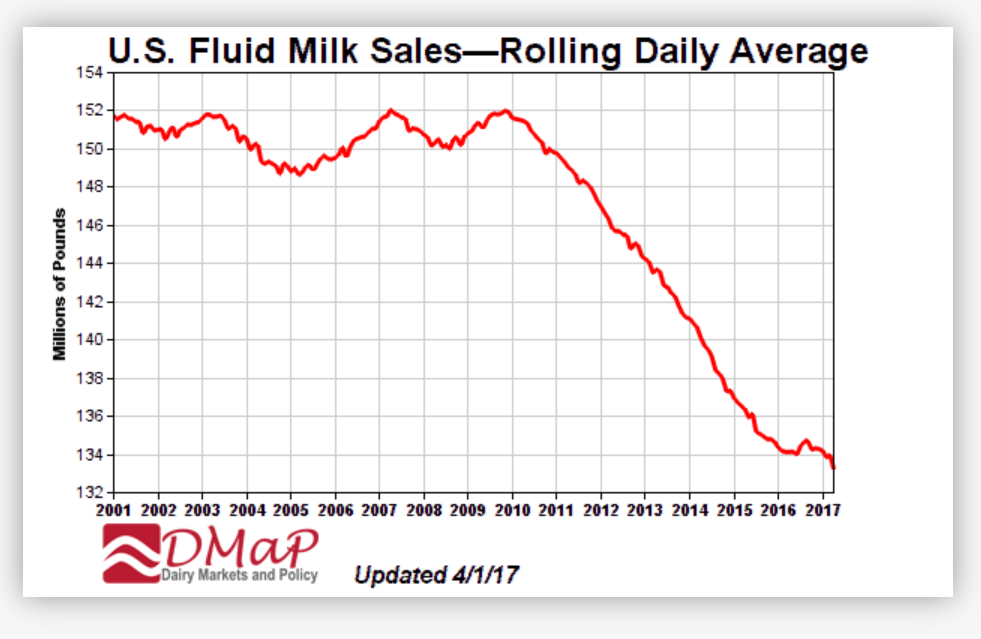
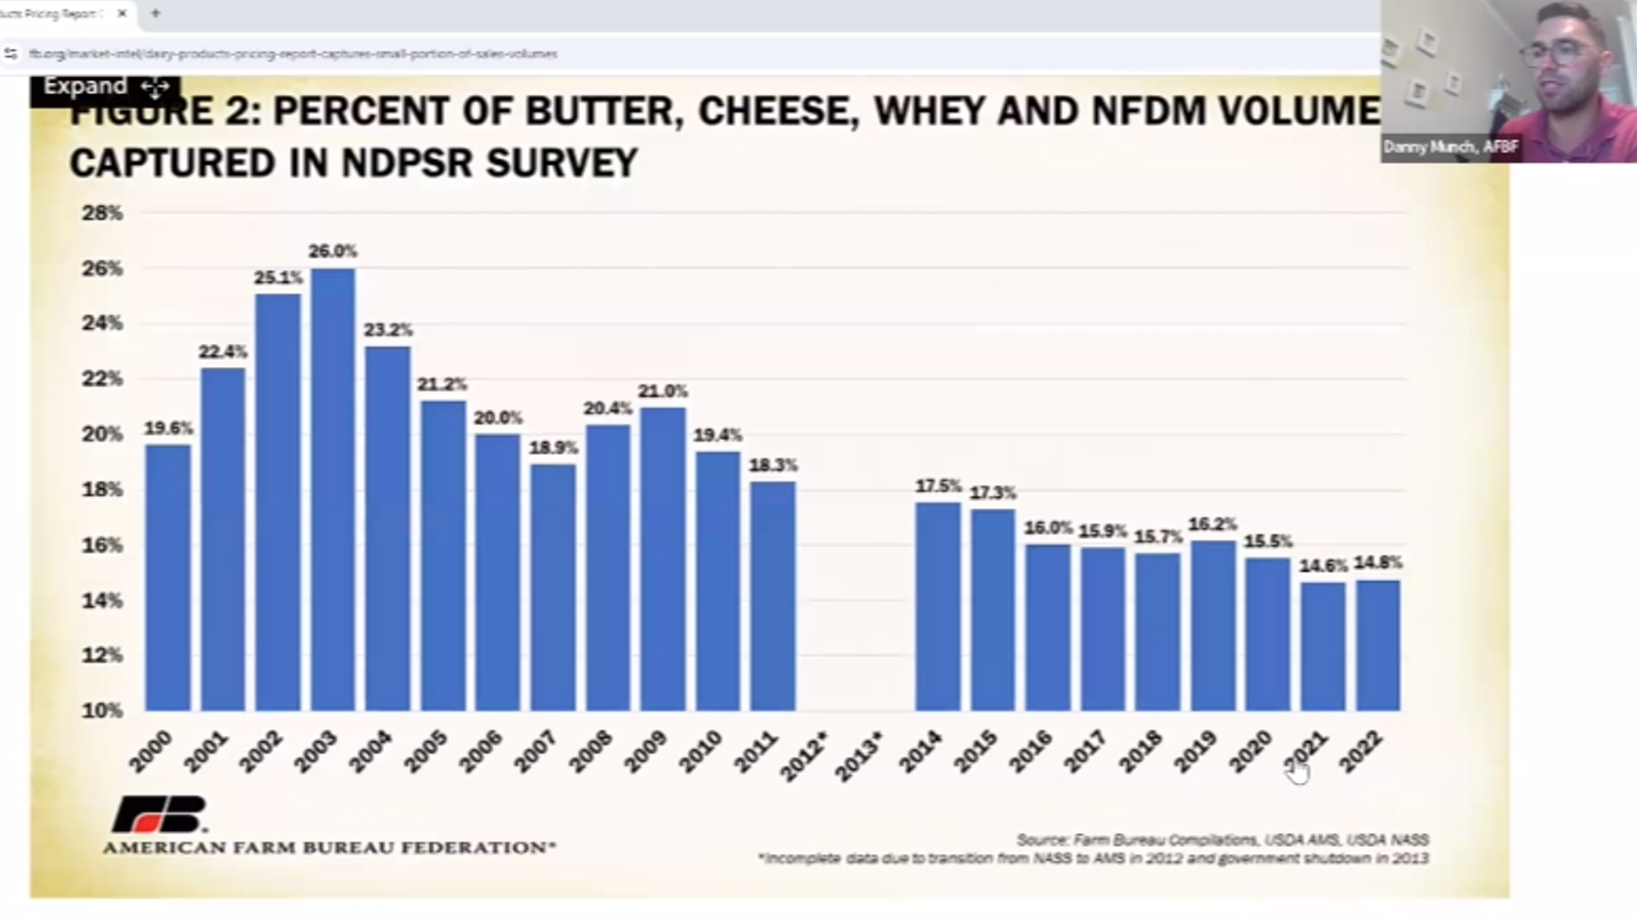
Munch said the volume captured is “quite small and declining” to 14.8% in 2022 after being a high of 26.4% in 2002. “But those are just the products that are actually surveyed. There’s a lot of products that are not even surveyed, and that means the percent is even less.”

American Farm Bureau, American Dairy Coalition, and others pushed for some other bulk products to be added, but those proposals were rejected in this USDA decision.

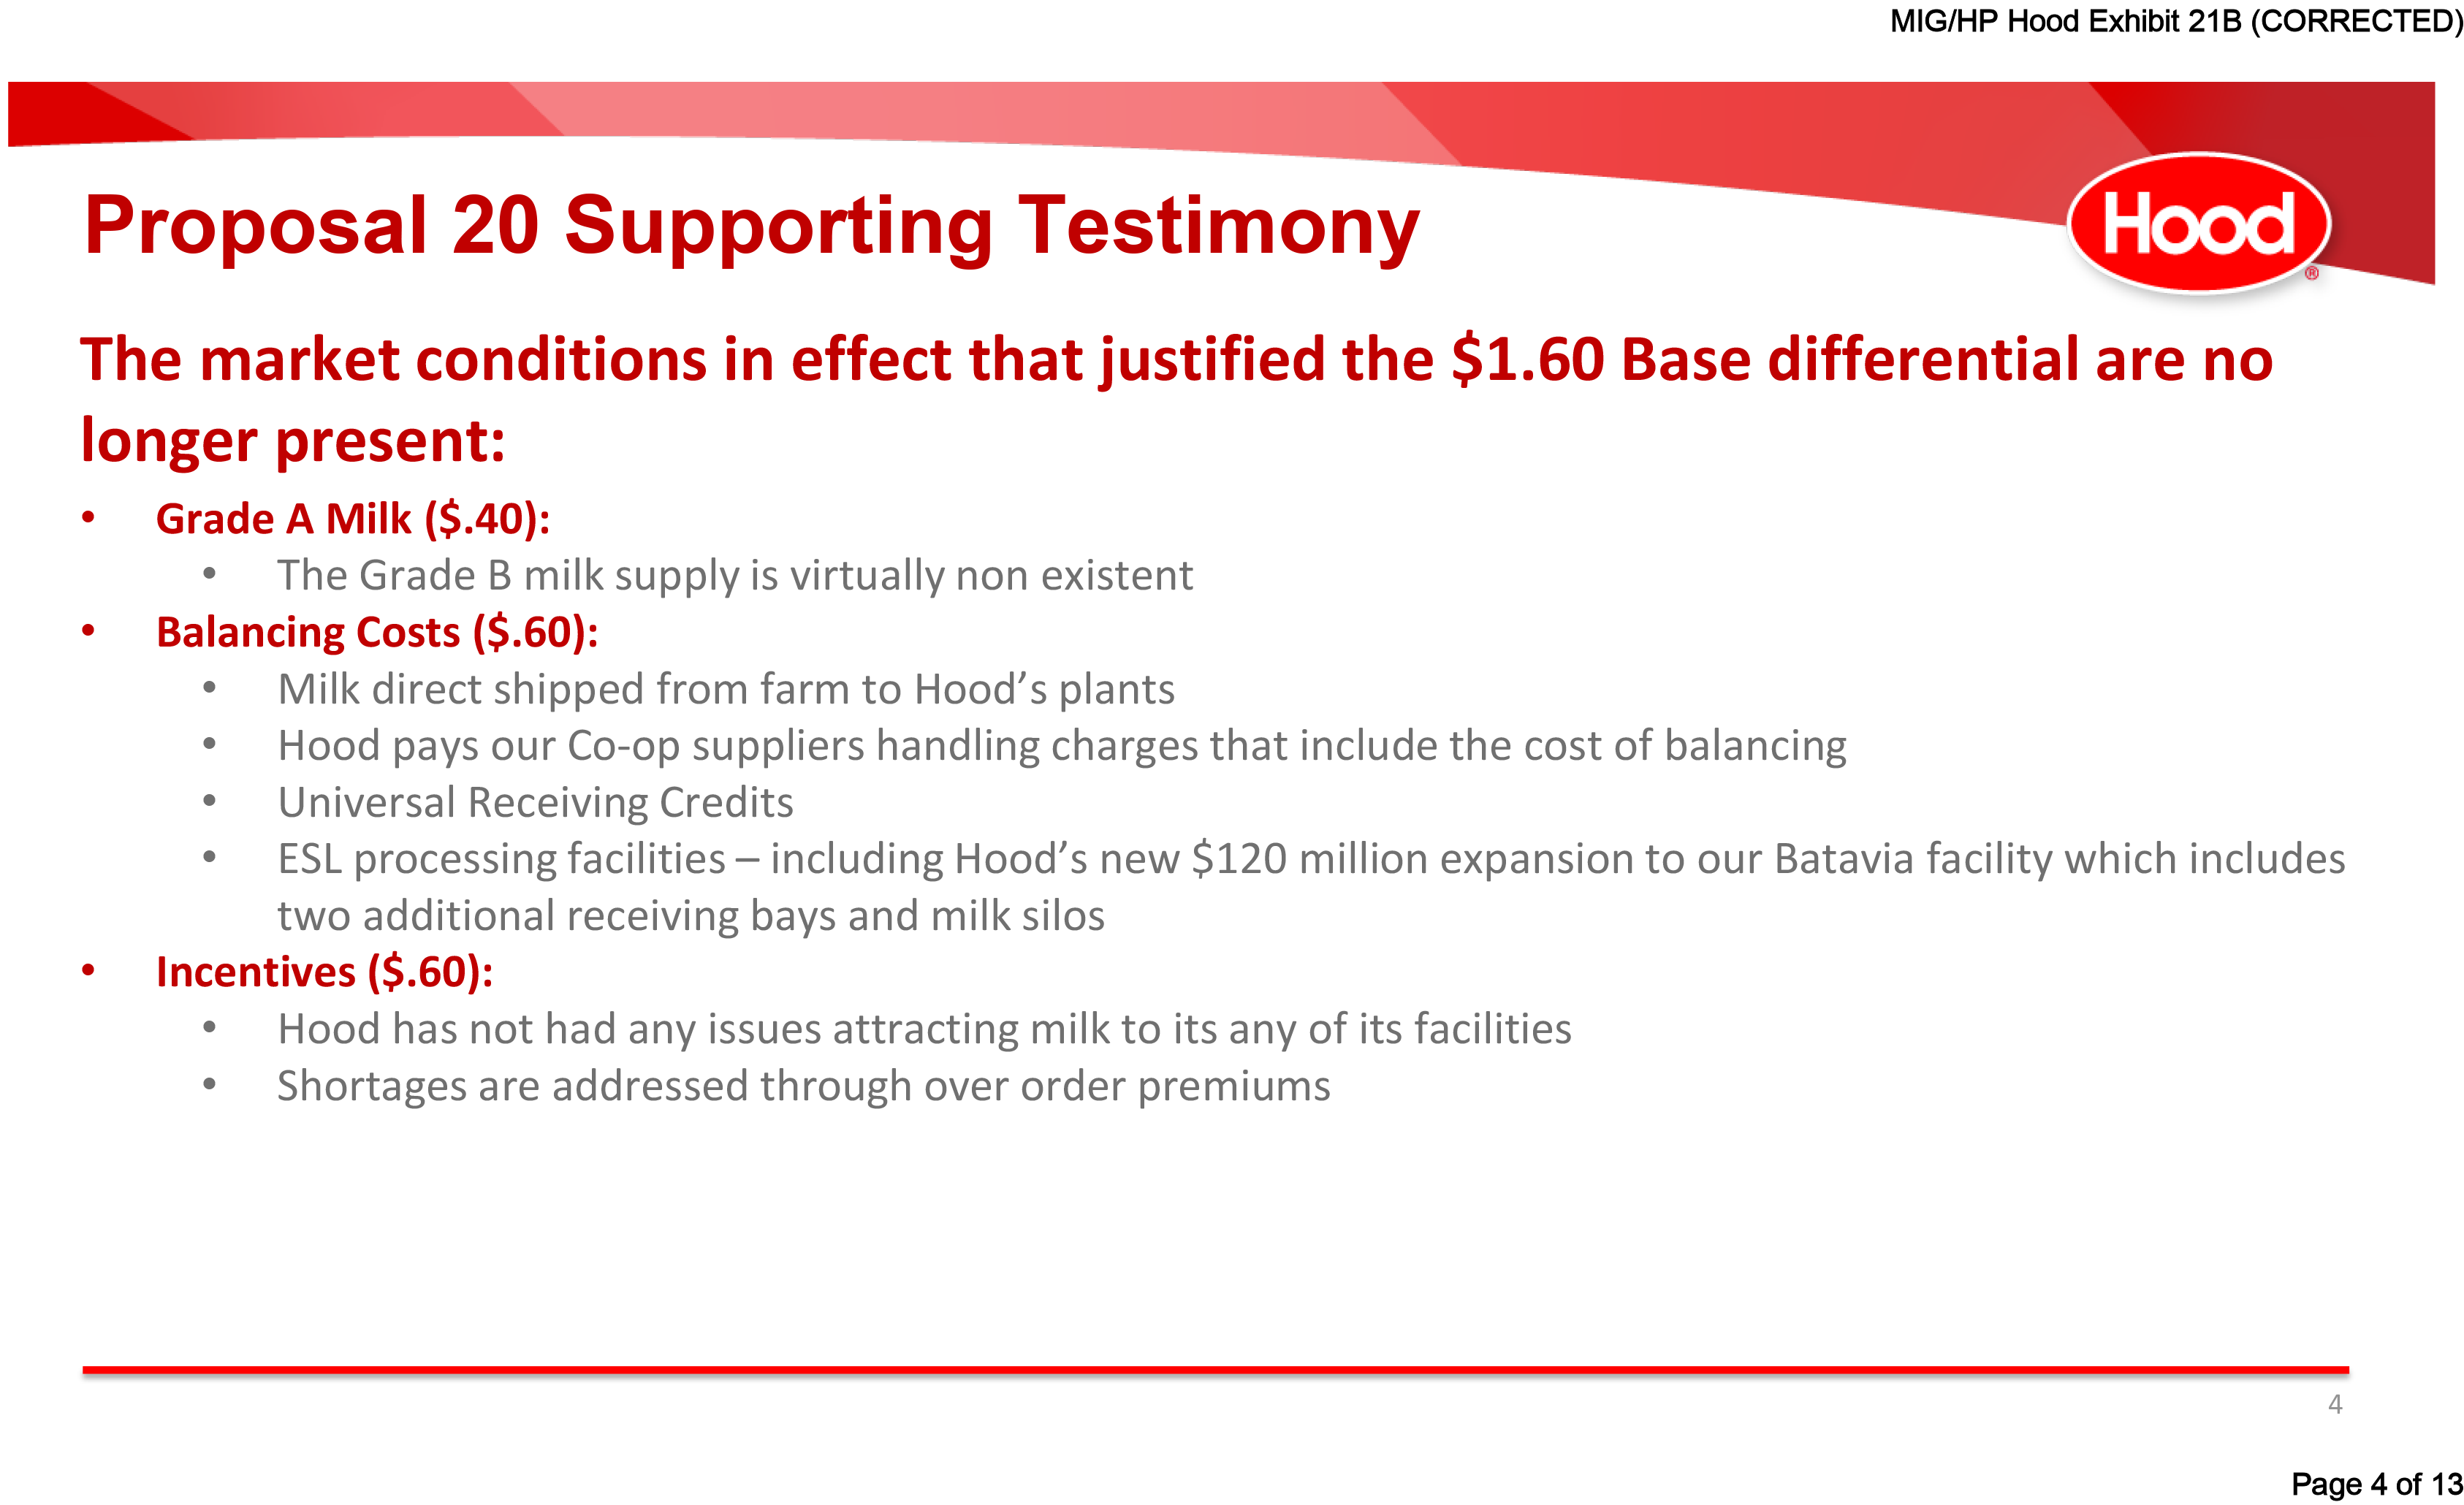
So, how can current make allowance levels be too low when processors are spending billions to expand? Or, are dairy farmers expected to pay this debt service? 

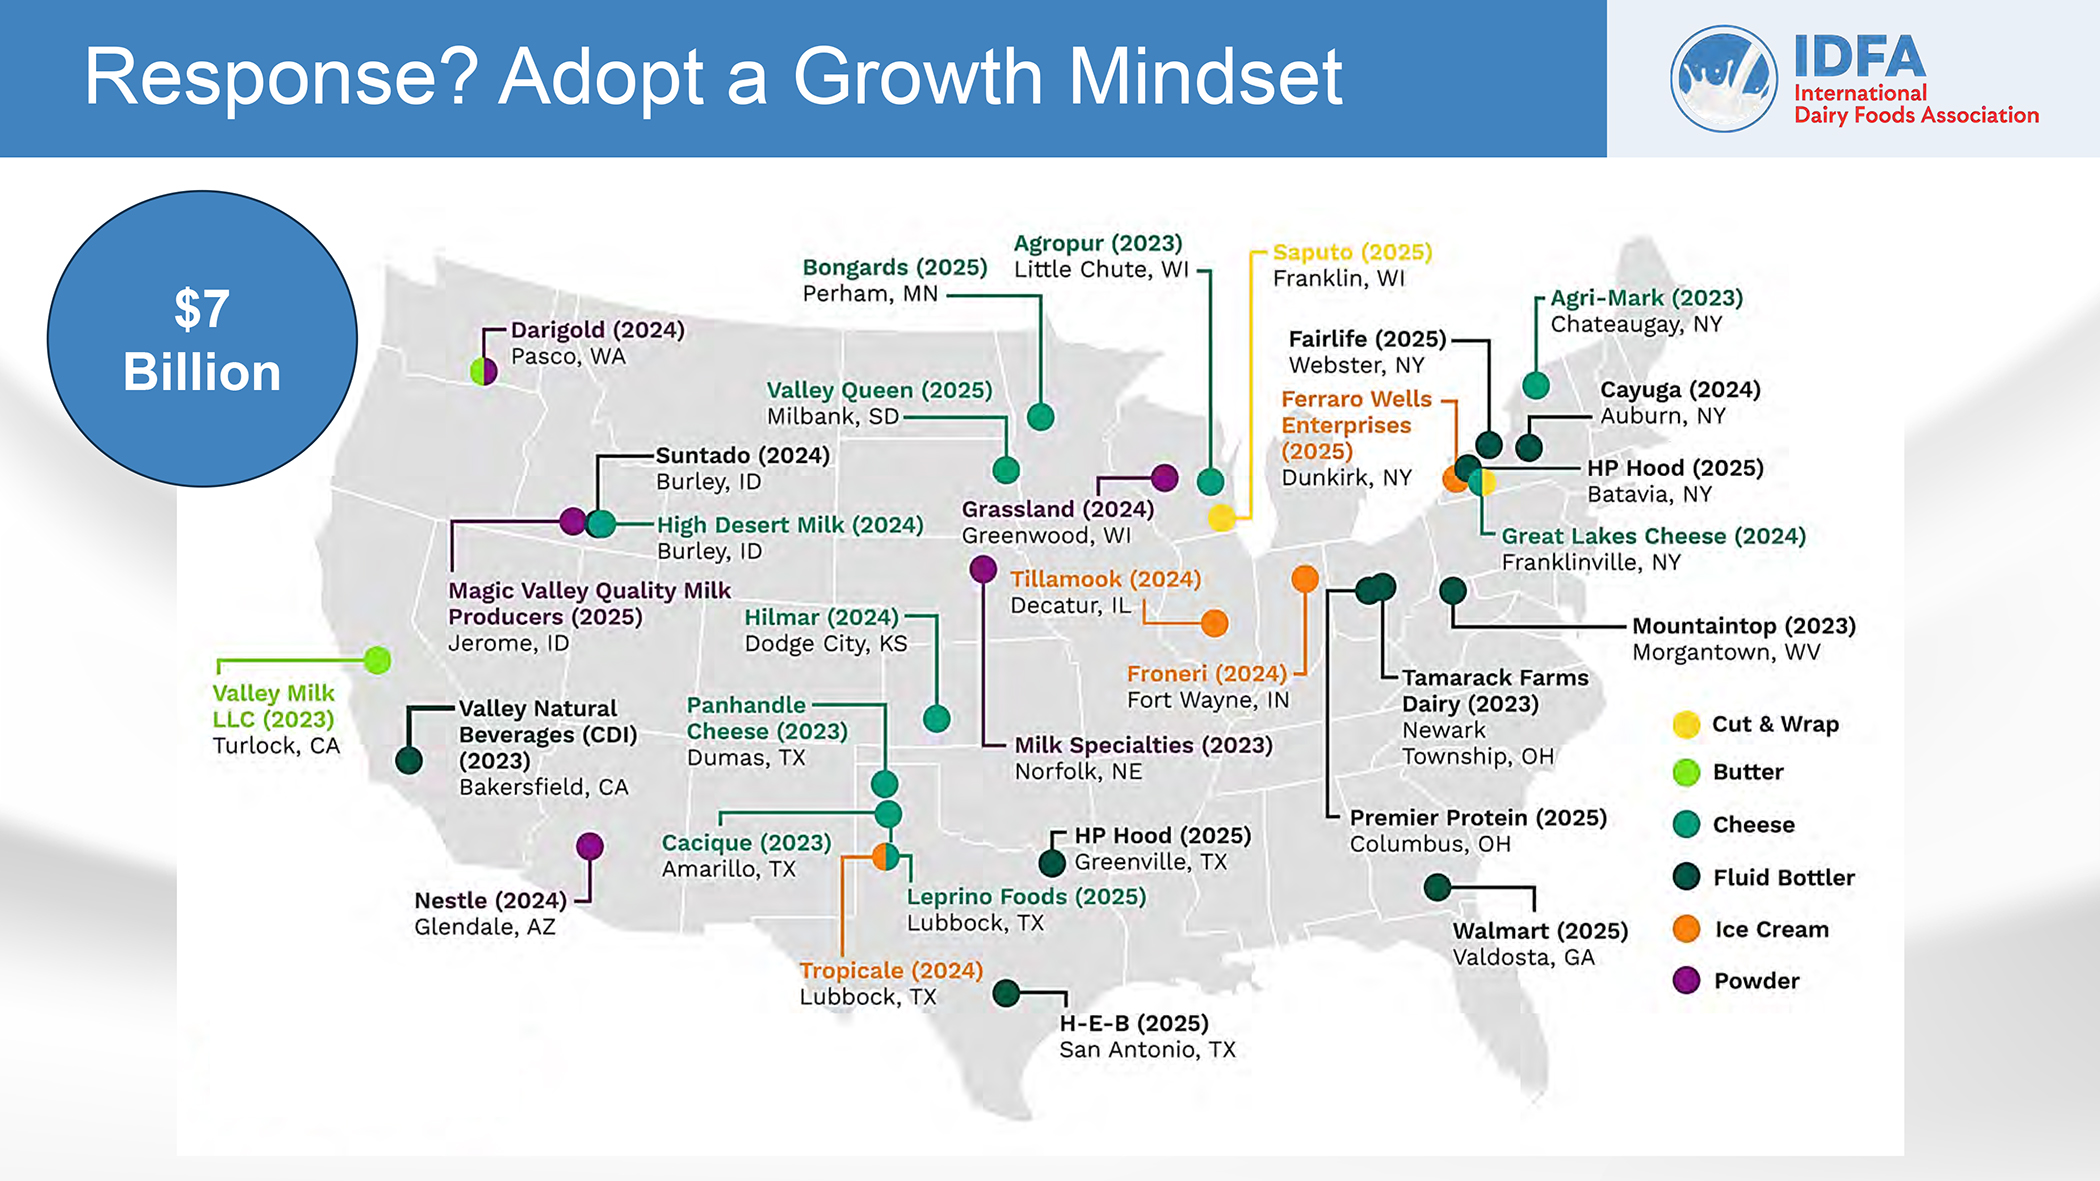
Dr. Michael Dykes, the CEO of the International Dairy Foods Association (IDFA), representing processors, told dairy farmers at the Georgia Dairy Conference in January 2024 that, “7 billion in new processing investments (below) will be coming online in the next two to three years. There’s a lot of cheese in those plans. These are going to be efficient plants. You’re going to see consolidation.”

The proposed make allowance increases of 5 to nearly 7 cents per pound across the four commodities equate to a new embedded milk check deduction of nearly $1.00 per hundredweight for Class III and around 75 cents for Class IV – over and above the current make allowances that already equate to $2.20 to $3.40 per hundredweight. Class I would see this embedded in advance skim and fat pricing factors that are used to set the base price mover.

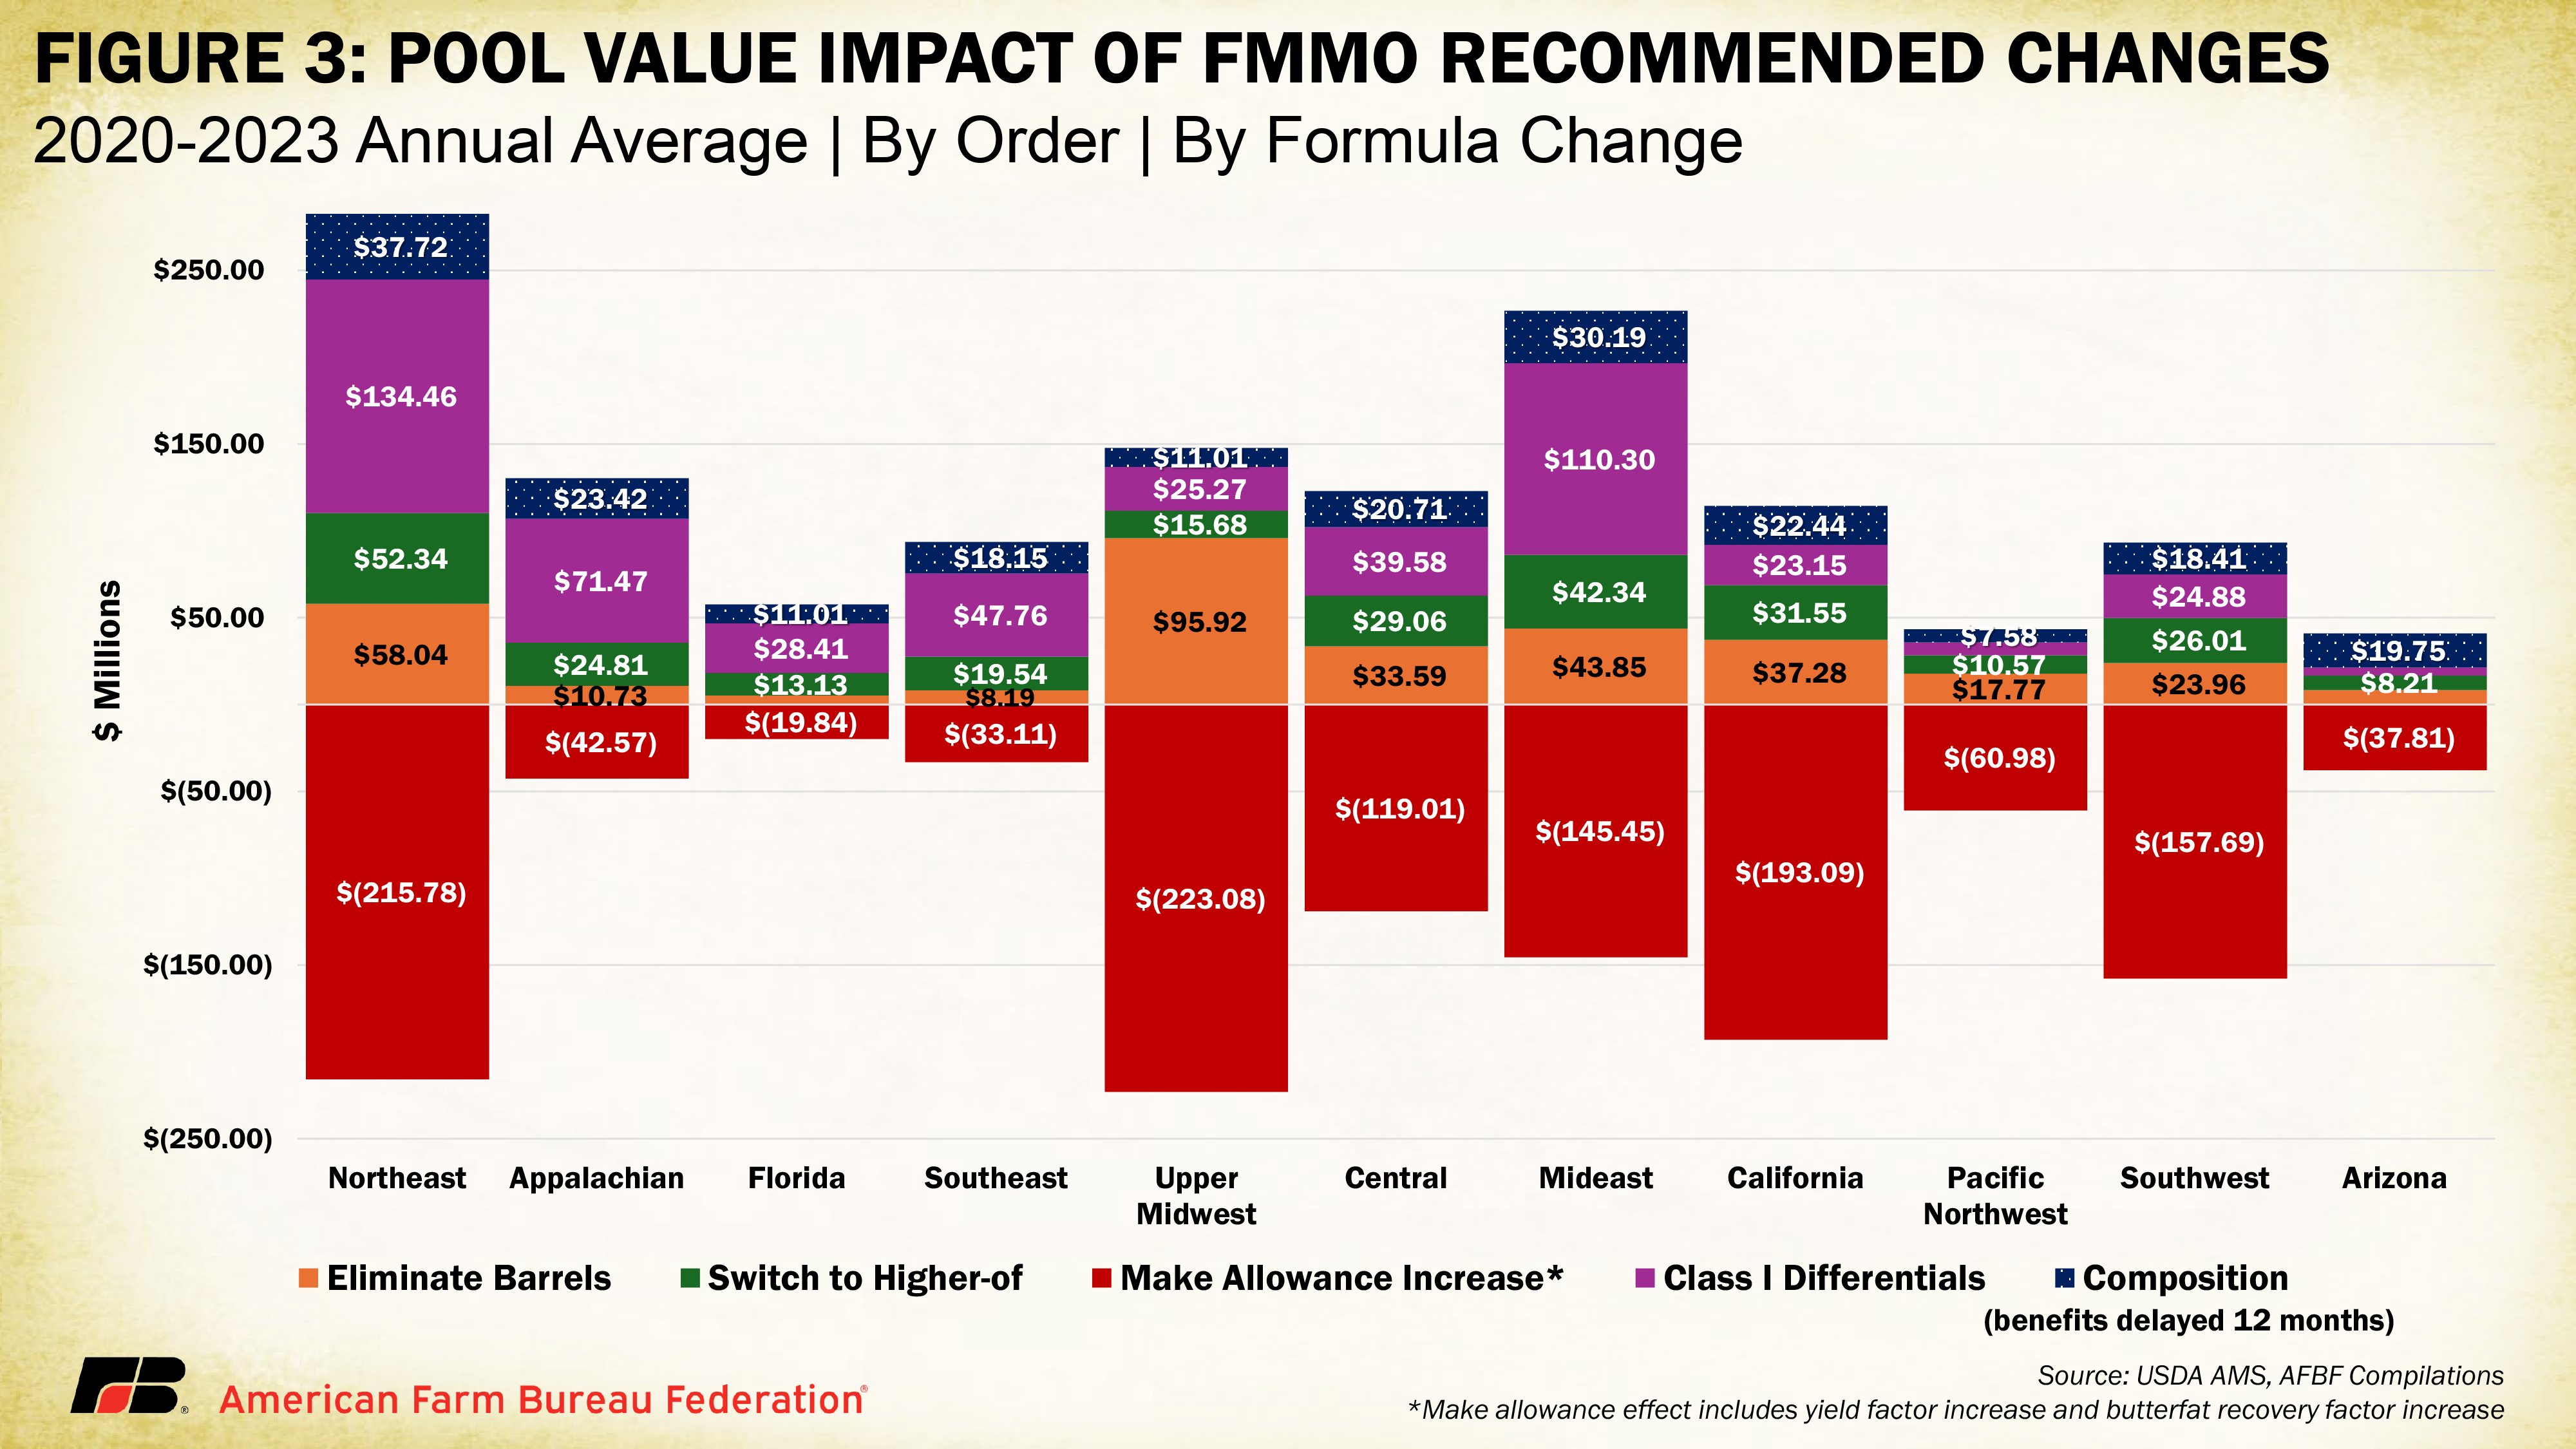
Collectively, the make allowance increases could remove $1.25 billion annually from FMMO pools, Munch showed in a 5-year static analysis based on prior pool composition, (See chart at top). Other aspects of USDA’s full proposal will defray some or all of the loss, mainly in the FMMOs with more Class I utilization. USDA’s proposal includes increases in location differentials for Class I fluid milk.

What happened in 2008-09?

Learn from the past or be doomed to repeat it? The last time make allowances were increased in 2008, a dairy market crash followed. As a webinar panelist and ag journalist, I pointed out that the dry whey price fell below the dry whey make allowance for the first seven months of that implementation from October 2008 through April 2009, resulting in penalties deducted from milk checks on every pound of other solids in the milk.

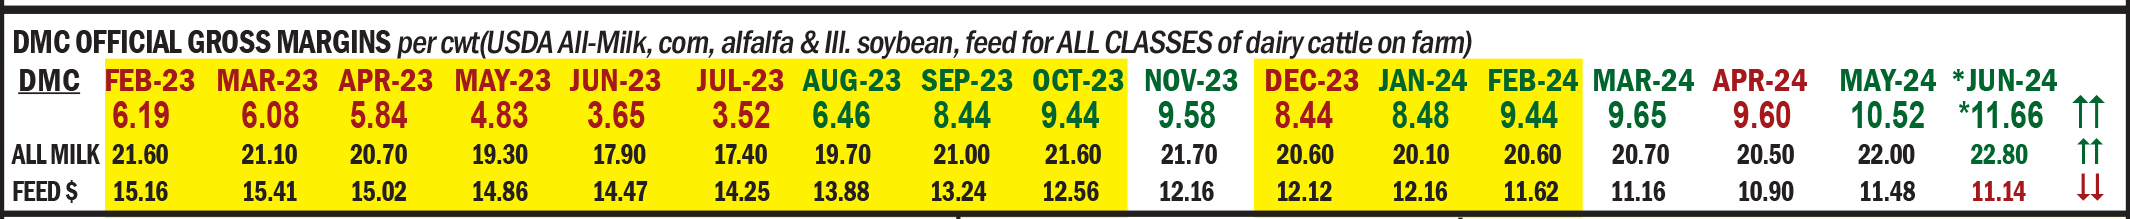
This time, the proposed dry whey make allowance is the largest of all – up 33.2% from $0.1991/lb now to $0.2653/lb. If in effect a year ago, dairy farmers would have again seen negative other solids penalties on their milk checks in July and August 2023 when milk prices were at their lowest. Meanwhile, processors made less dry whey, instead making more value-added products that are not price-surveyed.

Munch noted that only 66% of the plants on the price survey actually participated in the voluntary cost survey used by USDA to set the proposed new make allowances. AFBF, ADC and other organizations have been on record opposing make allowance increases until mandatory, audited surveys are conducted by USDA.

Conversion from fresh milk to ESL?

Learn from the past or be doomed to repeat it? On the Class I side, the 2018 farm bill changed the base price calculation. Farmers were told this would be revenue neutral, but the change cost them – at minimum — $1.25 billion over the past five years.

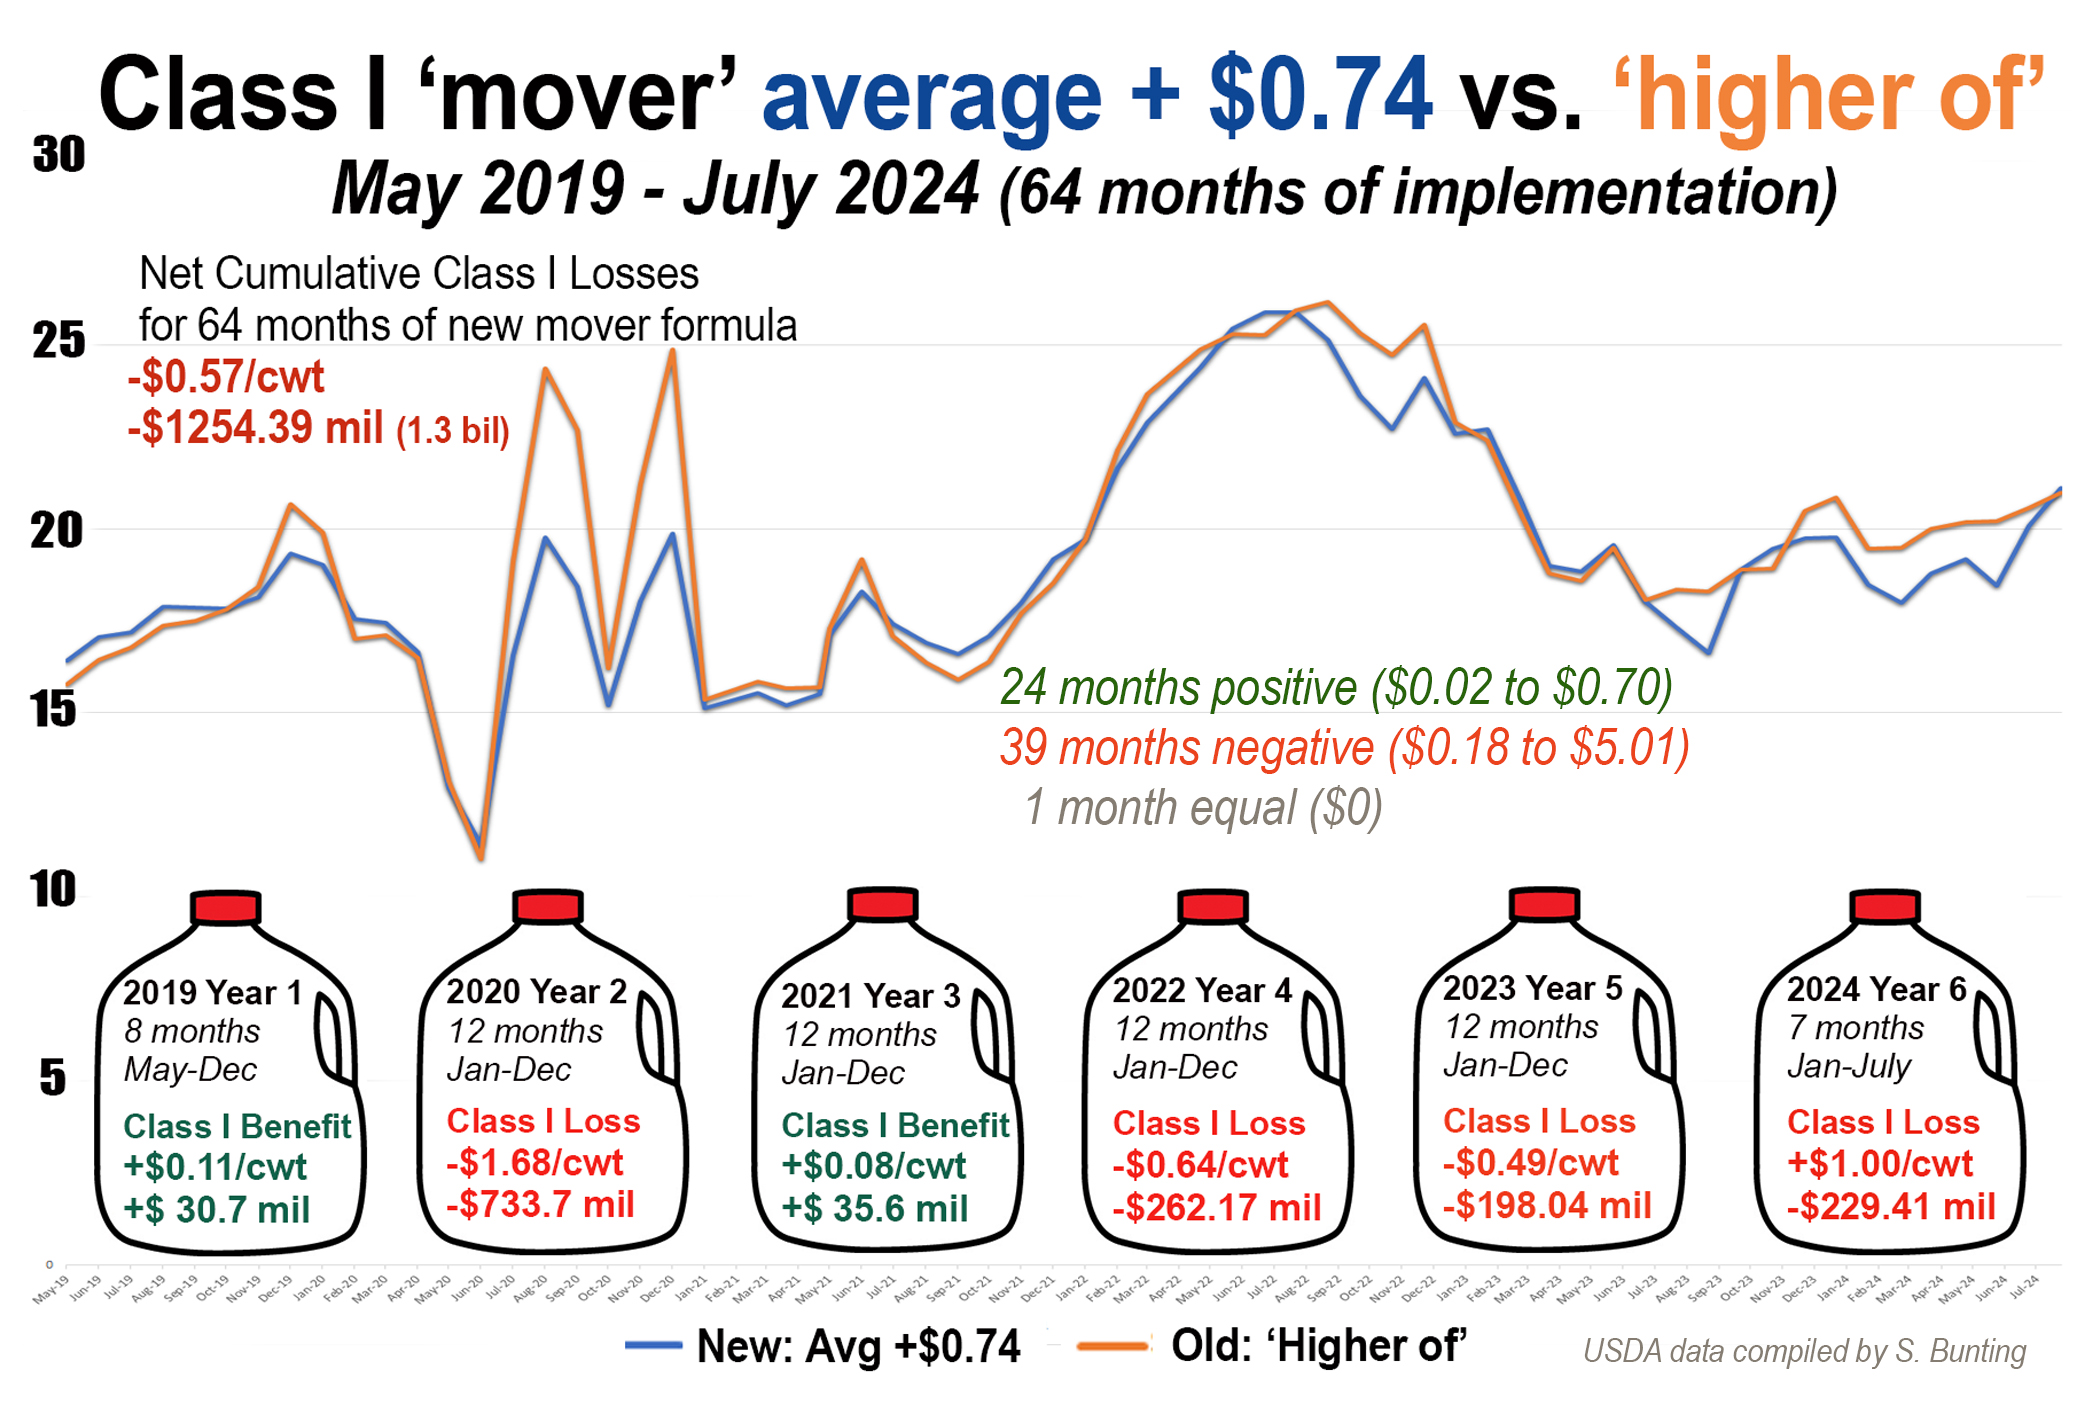
USDA now proposes to restore the higher-of calculation, but only for conventionally pasteurized HTST (or fresh) milk. Extended shelf life (or ESL) fluid milk products — labeled good for 60 days or more — would be priced using a new average-of method with a rolling adjuster.

Shouldn’t ESL have been defined in the hearing, and the economic impacts studied? This idea of two different Class I movers was not vetted in the hearing.

With two movers, fluid milk costs could be different from the same location based on shelf life. Webinar comments questioned USDA’s loose definition of ESL; Could processors change the label to move between the movers and pay whichever mover was lower?

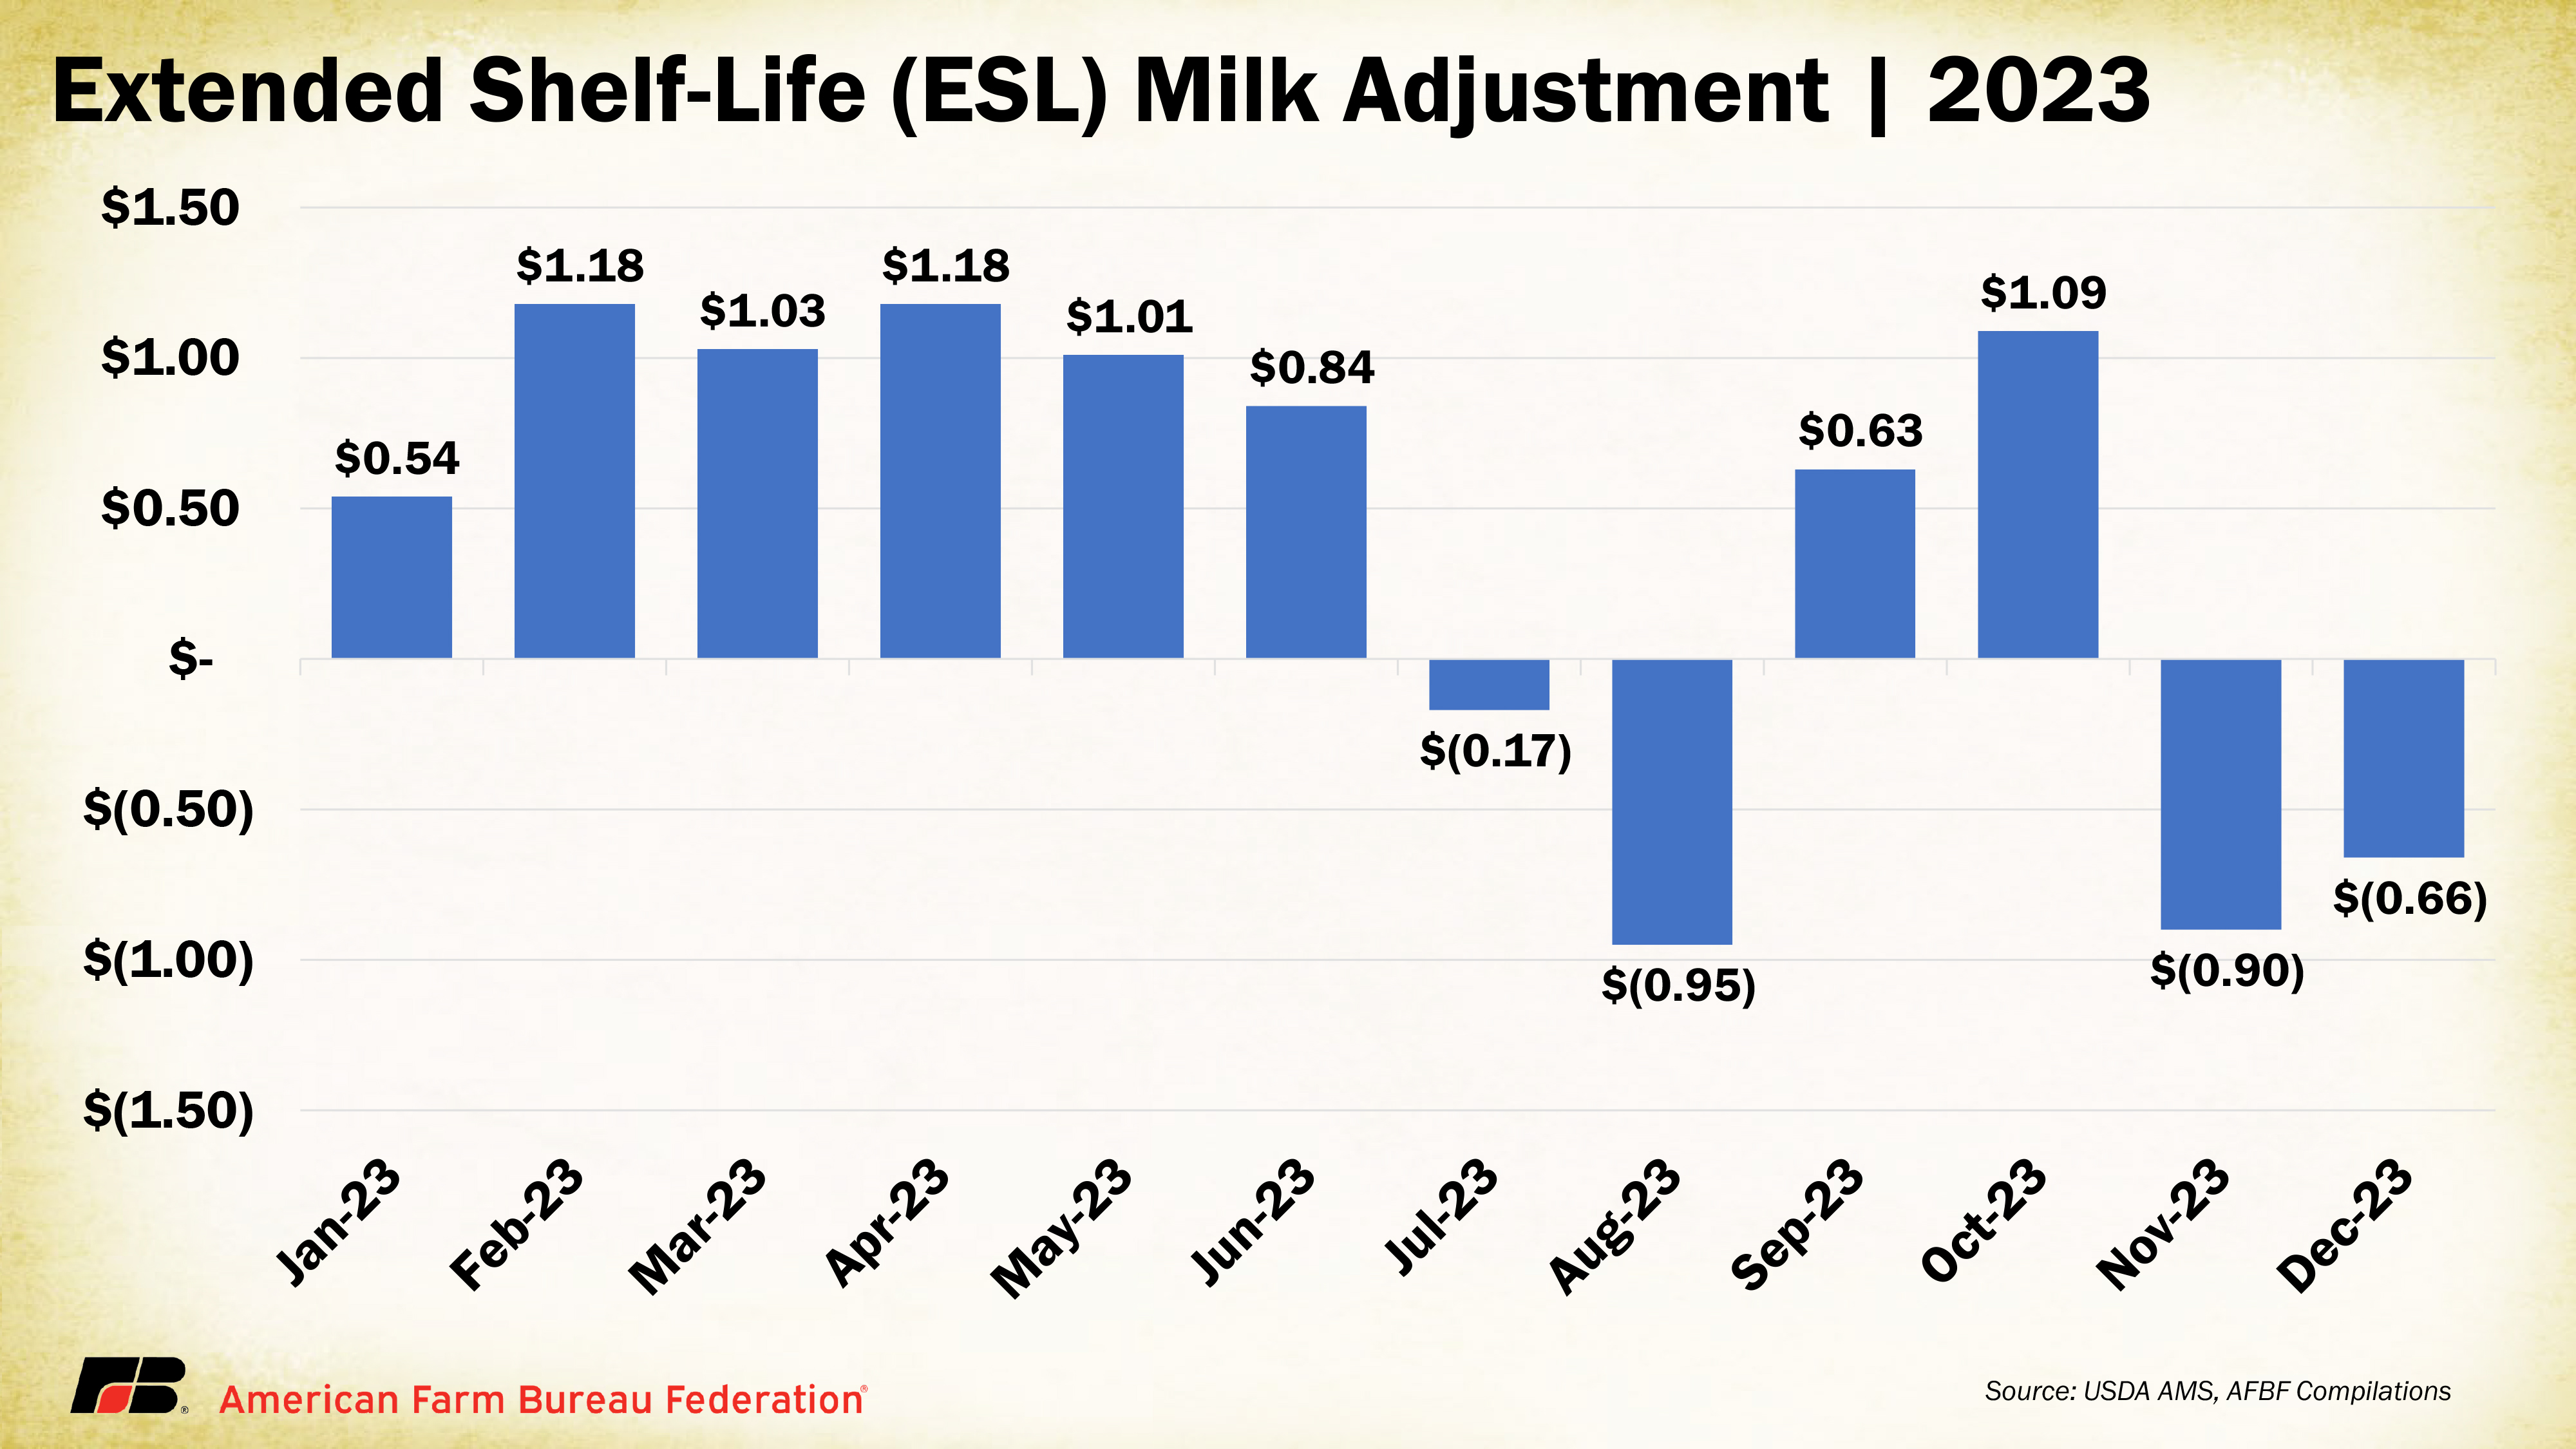
The USDA’s one-year static analysis showed the ESL Class I mover would have ranged from being $1.18 per hundredweight over to 95 cents under the HTST Class I mover in various months of 2023. That’s a big spread.

What’s at the root here? The dairy checkoff has openly identified ESL milk as the new milk beverage platform, using dairy farmer funds to research and promote it and to show consumers can be ‘taught’ to accept it.

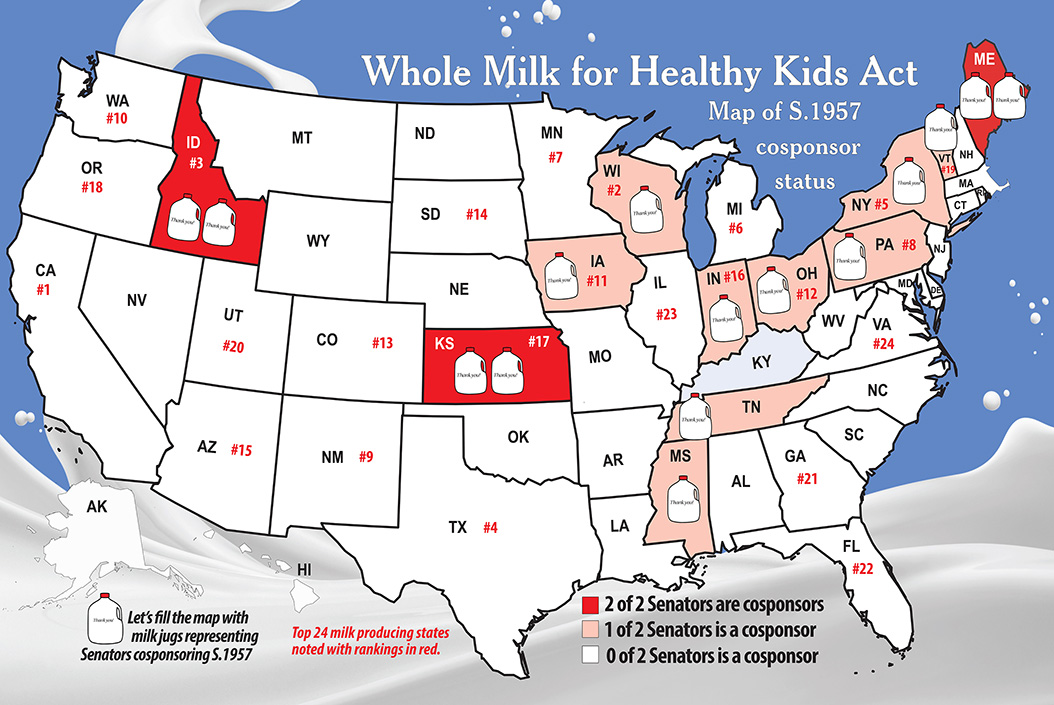
Dr. Dykes of IDFA, at the Georgia meeting in January 2024, also told dairy producers that “this is the direction we (processors) are moving… to get to some economies of scale and bring margin back to the business.” He said the planned new fluid milk processing capacity investments are largely ultra-filtered, aseptic, and ESL. (10 of the 11 fluid milk plants on the IDFA map above are ESL and/or aseptic fluid milk plants. Some will also make ultrafiltered milk, and some will make plant-based beverages at the same location.)

Has USDA considered the purpose of the FMMO system is to promote orderly marketing and the adequate supply of FRESH FLUID MILK? Will consumers accept the taste of the not-so-fresh ESL and aseptic milk, or migrate faster to other beverages if fresh fluid milk is less available to them?

Would a 2-mover system ultimately reduce farmers’ access to milk markets in some regions and diminish the food security of those consumers? Prized as the freshest, least processed, most regionally local food at the supermarket, will the USDA decision reduce fresh fluid milk availability down the road?

How will the 2-mover system impact dairy farms located outside of the industry’s very specific identified growth centers? And will this perpetuate the wide divergence between Classes III and IV that has been an issue since 2019, further punishing dairy farmers with disorderly marketing and opportunistic depooling?

Webinar participants asked: “Will commenting even matter? Or is the USDA Secretary’s mind made up? How important is individual farmer input?”

“It’s extremely important for farmers to get involved. Even with talking points, really tell your own story with it,” said Munch. “They like hearing from you, and the stories of the impacts to your balance sheet, to your future revenue or the stability of your local community. They want to know the impact on small businesses. That’s one of the driving points.”

Not much time

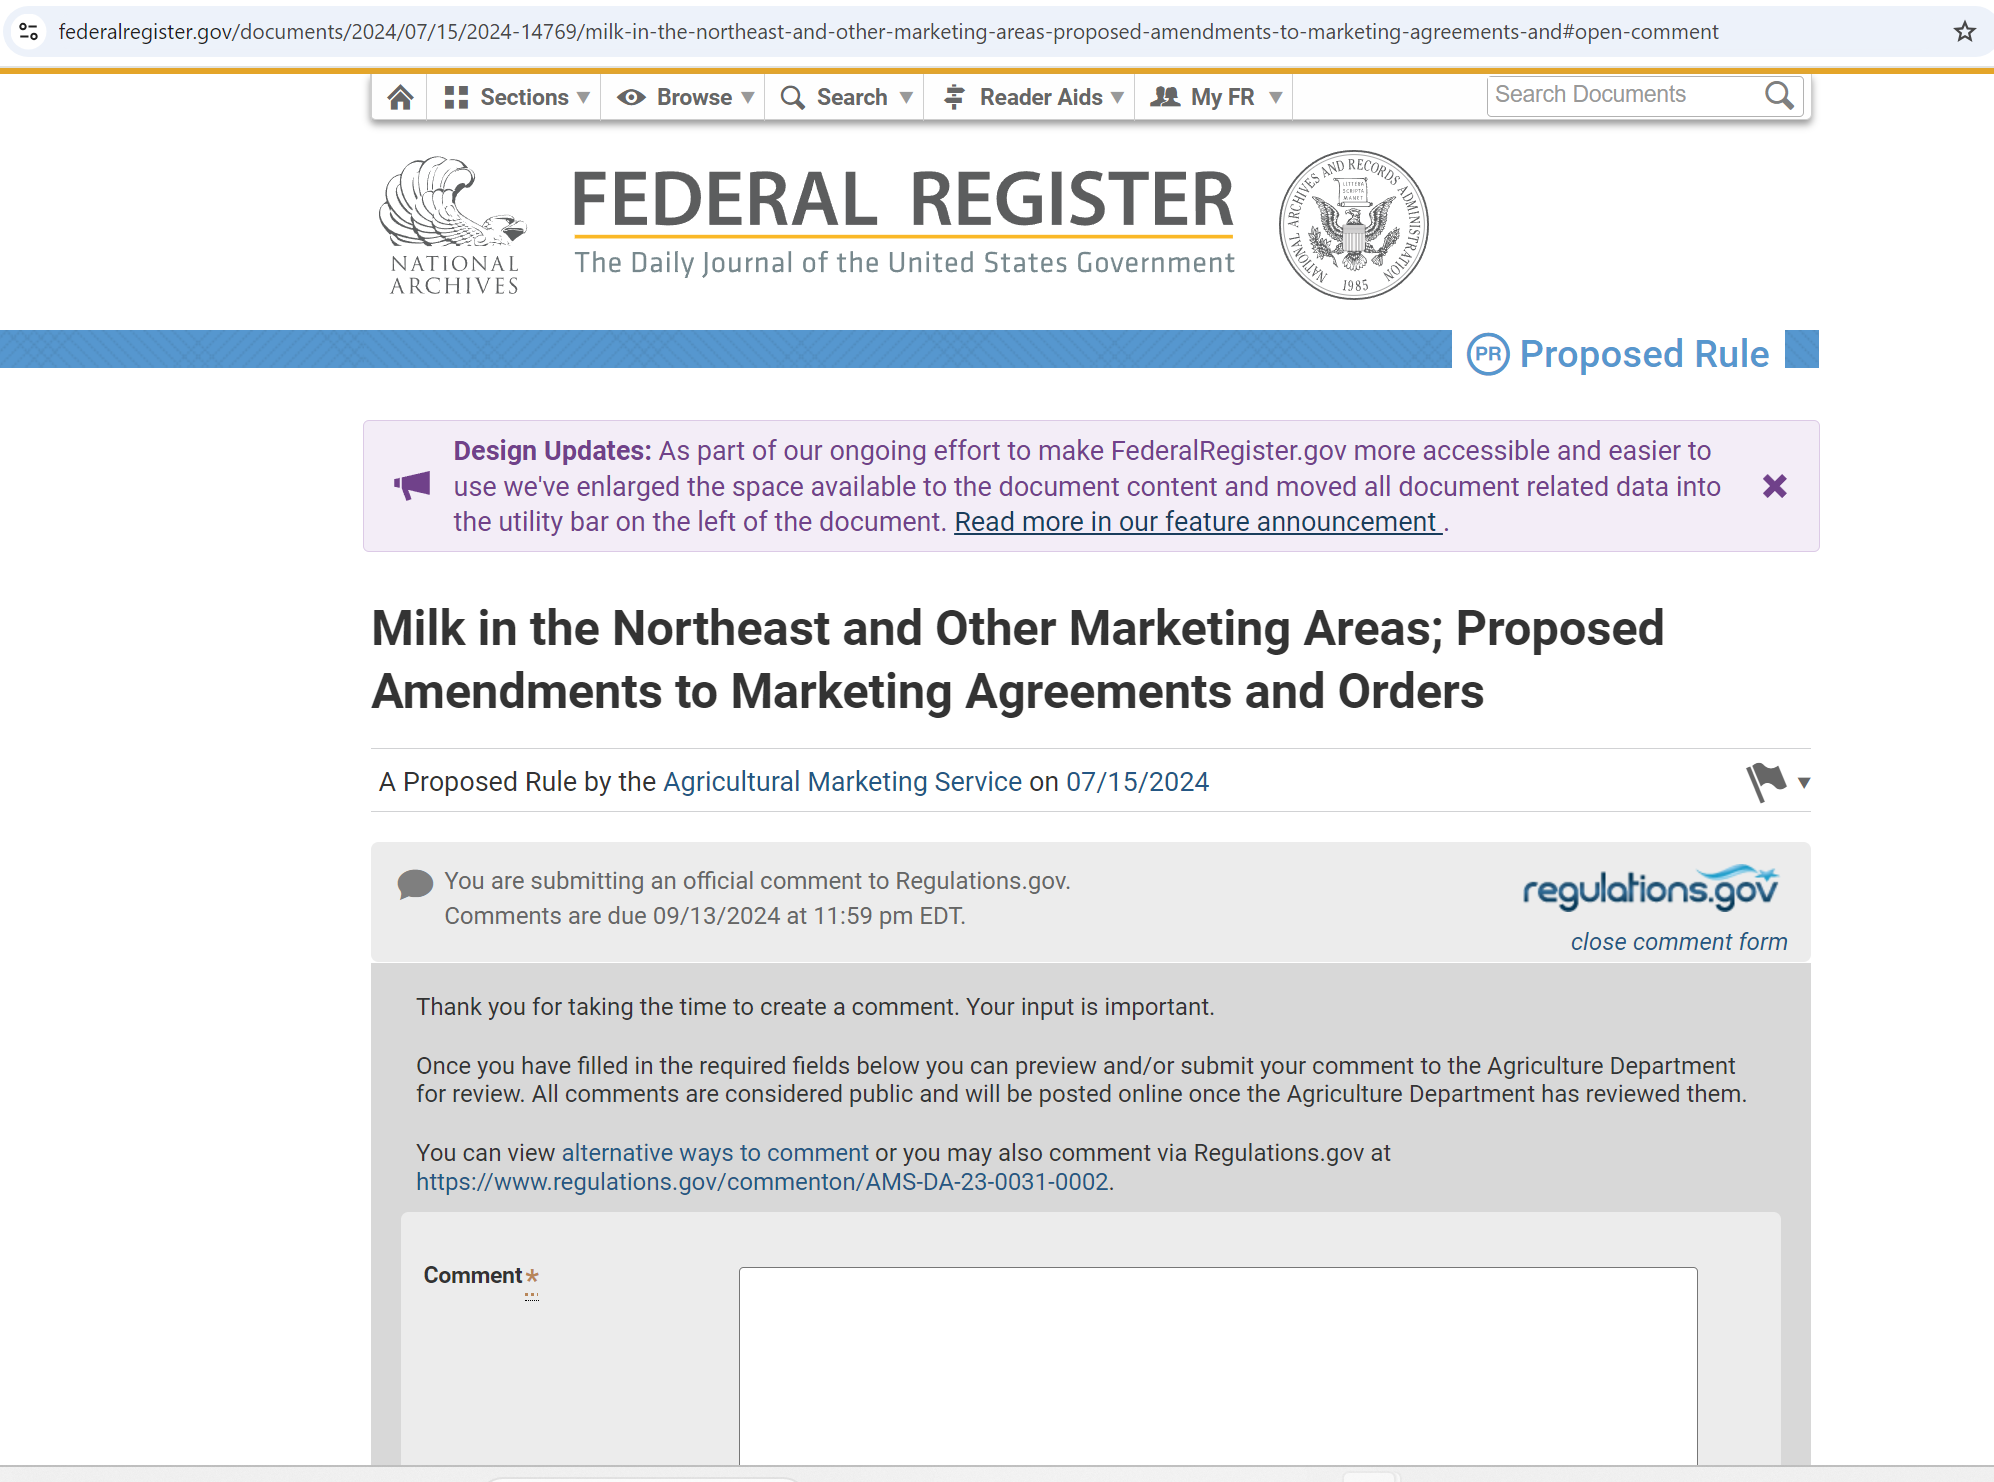
With a short time remaining to comment at the Federal Register Docket AMS-DA-23-0031-0002.

American Dairy Coalition has prepared an official comment, so other like-minded organizations and individuals can sign on before the filing deadline, which is 11:59 p.m. Friday evening, Sept. 13, 2024.

Comment directly to the Federal Register docket at https://www.federalregister.gov/documents/2024/07/15/2024-14769/milk-in-the-northeast-and-other-marketing-areas-proposed-amendments-to-marketing-agreements-and

Click here to read the ADC’s comment that will be filed before the deadline Friday evening at Sept. 13 at 11:59 p.m. Dairy farmers and organizations wanting to associate themselves with the comment can click here.

Click here to view ADC’s Aug. 29 webinar.

Click here to read Danny Munch’s at Farm Bureau Market Intel.

Why the proposed 33.3% raise in the whey make allowance is way too big without a ‘snubber’

By Sherry Bunting, Milk Market Moos in Farmshine, Aug. 9, 2024

USDA’s weekly National Dairy Product Sales Report (NDPSR) is out of whack on whey. The NDPSR is the mandatory processor survey of prices on the four commodities used in Federal Milk Marketing Order (FMMO) end-product pricing formulas.

The NDPSR price for dry whey for the week ending Aug. 3 was $0.4672/lb, a modest improvement of a half penny over the previous week’s NDPSR, but still 10 to 14 cents lower than the past three weeks of weighted average spot prices, and a nickel lower today than even at the start of the spot market rally six weeks ago.

The NDPSR should have caught up closer to the spot market by now, considering that only sales that are forward priced within 30 days can be reported.

The CME spot market is what processors touted during FMMO hearing testimony as the ‘market clearing’ price that they use as a baseline to price commodities for export and non-formula, non-reported ‘value added’ products.

They also lamented — at length — that USDA is setting producer minimum prices too high, some threatening to modify future expansion plans if they don’t get to ‘market clearing levels’ with higher make allowances deducted for their rising costs — including ‘sustainability costs’, they want covered.

If these dry whey ‘market clearing’ CME spot values we have been seeing of late are not translating to the NDPSR used in FMMO class and component price formulas over a three to six week period, then maybe we should all be questioning the 33.3% raise the processors will be getting from dairy farmers’ milk checks in the dry whey make allowance that USDA proposes to increase from the current $0.1991/lb to $0.2653/lb. That is, if the proposed rule announced July 1st survives the 60-day comment period, 60-day review, and producer referendum early next year.

I wonder if USDA underestimates how fed-up the farmers are in the Upper Midwest with being the worst-paid in the nation seeing the biggest make allowance bite coming right at them in this proposal — and very little Class I benefit to offset it. After 5 years of disrupted pooling by the ‘average of’ method, Order 30 has developed some bad pool-jumping habits that could linger in that region — even when fluid milk pricing returns to the higher of. Who knows?

If a two-thirds ‘yes’ vote is not achieved in Order 30, or any Order for that matter, the Market Administrator’s office there closes, immediately.

There is so much value in whey today, and it’s a byproduct of the cheesemaking process to begin with. It’s hard for this observer to resolve conflicts of logic in the size of this raise that USDA justifies based on voluntary surveys in which only a fraction of the plants that price report would offer their cost of processing data to determine.

In fact, even Dr. Mark Stephenson said it was more challenging this time to separate-out the costs for other products that are not price reported, but made in the same plants. He said today’s plants are more complex than in 2006 when the model was used on voluntary data to set the current make allowances that were implemented in 2008, the last time they were raised.

But folks, there’s no snubber, and for dry whey, that’s a problem. When farmers were losing their shirts last summer, they would have been giving away the ‘other solids’ in their milk for free — or paying processors a small fee to take them as though worthless — because the dry whey price at that time was equal to or fractionally less than what the new proposed dry whey make allowance would be!

It happened the last time make allowances were raised in 2008, just ahead of the 2009 dairy crisis. I’ll not soon forget farmers asking me if there is some way to avoid sending the ‘other solids’. Of course, that’s silly, but we get the point, and it’s sharp.

This is significant in the Upper Midwest, where it impacts over 90% of the milk because it’s a Class III market. But this also affects all Orders to some degree, depending on pool composition. With new processing capacity coming online, much of it cheese, in the next 12 to 24 months, other milk marketing areas will see Class III growth change their blend prices too.

The other thing to think about is USDA proposes to implement the new make allowances for all four commodities right away after the referendum in early 2025, but some of the other parts of the proposed rule will be delayed because of risk management impacts. Yet make allowances also impact risk management. They are also part of the formula for the Class III and IV milk prices — so this change also would immediately affect the futures board. In fact, that’s part of what happened in 2008.

Can you imagine an immediate $0.75 to $1.00 drop on the futures board due to higher processor credits? What’s the calculus there? The make allowance for dry whey affects the ‘other solids’ value as well as the Class III price.

And then we have the added insult of ‘pizza cheese’ being billed as ‘like mozzarella’ just moister because it’s a second process of the whey and water to congeal some secondary curd. It is essentially whey cheese with a different melting texture (I notice it browns cardboard-flaky on frozen pizza before the dough is done, but keeps some moisture. I don’t buy my once favorite frozen pizza brands anymore suspecting that’s the problem). It’s also used as a crust filler.

So, how much real mozzarella is being displaced, and how much near-mozz value are they selling this whey product for? That’s a price that never gets reported because it’s — well — not dry whey. It’s a proprietary value-added product.

The ubiquitous whey protein concentrates and isolates found in so many high protein drink and snack preparations are another hot ticket not getting price reported. And yet, here’s dry whey at 50 to 60 cents/lb for 6 weeks on the market-clearing CME, and the price going into the FMMO formulas is hanging back at 43 to 47 cents/lb over the same 6 week period.

Spot market red, not as bad as it looks

The whey market traded 6 loads on the CME spot sessions this week with a penny loss at 59 cents/lb Wed., Aug. 7 vs. the prior Wednesday. The weighted average for the week is still at just about 60 cents/lb.

The CME spot cheese market was mostly quiet again this week, but prices for blocks moved higher Wed., Aug. 7, when 40-lb block Cheddar was pegged at $1.9650 — up 4 cents from the prior Wednesday, with 4 loads trading the first three days. The 500-lb barrel cheese price, pegged at $1.95/lb was down 2 1/2 cents compared with a week ago; 3 loads traded. The NDPSR for week ending Aug. 3 was reported in reverse with a 4-cent barrel over block advantage at $1.9788/lb and $1.9390/lb, respectively.

Butter melted off 2 cents after last week’s 39-load haul came to a grinding halt Aug. 1st. Nothing traded from Aug. 2 through 7, and the spot butter price remained at $3.1025/lb Wed., Aug. 7. The weighted average was steady at just over $3.10/lb, off 3 cents from the NDPSR price of $3.1315/lb for week ending Aug. 3.

Grade A nonfat dry milk trade remained active the first three days this week with a whopping 23 loads changing hands, and the spot price pegged at $1.23/lb Wed., Aug. 7, down a penny and a half from the prior Wednesday. The weighted average for stood at $1.2317, and the NDPSR price continued to lag the past few weeks of spot market levels by three cents.

We see these headlines that the recent gains in farm milk prices are taking away the U.S. competitive advantage on the world market. Don’t believe them, folks. While it is true that nonfat dry milk is running above the global skim milk powder price, the reason is because we are not making nearly as much milk powder in the U.S. because milk is tight, cheese capacity has expanded, and cheese-vats are pulling in the available milk. Fluid milk sales are also up year over year. We are also not building powder inventory, so of course this means we’ll export less.

On the cheese and whey, there’s plenty of wiggle room between U.S. and global prices, judging by the recent Global Dairy Trade auction.

Global Dairy Trade index up 0.5%

The GDT biweekly internet auction on Tues., Aug. 6 added value to the mid-July gain — up 0.5% vs, July 16.

Here’s the kicker. The cheese index for Sept. 2024 through Feb. 2025 delivery was higher than the current U.S. market-clearing block and barrel prices. Meanwhile, lactose outpaced the current NDPSR drag on whey.

The big story is bulk mozzarella was up a record 8.4% with all sales contracted for delivery October 2024. The bulk mozzarella contracts are new. They have only been trading on the GDT since December 2023. Tuesday’s sales — all for Oct. 2024 delivery — are, by far, the highest yet of the 15 sessions in which bulk mozzarella was offered. The CME does not have a U.S. ‘clearing market’ for mozzarella. Furthermore, USDA does not include bulk mozzarella in the mandatory NDPSR weekly survey because mozzarella prices are not used in the FMMO milk pricing formulas. A proposal to add this was rejected by USDA in its recommended decision July 1st.

The GDT Industrial bulk cheddar index was up 1.3% compared with three weeks ago at an average $1.94/lb — 2 cents higher than the weighted weekly average on CME barrels and 4 cents over CME blocks. September delivery cheddar averaged $1.90/lb and October dipped to $1.89/lb, but product for delivery Nov. through Feb. moved toward $1.98/lb.

Meanwhile, USDA agreed with NMPF’s proposal to remove the 500-lb barrel cheese price from the weighted average used in the FMMO formulas. This will mean only the 40-lb block cheddar price will be used in the future to calculate the protein and Class III milk prices. Barrels have been trading over blocks recently, and during the FMMO hearing, IDFA witnesses (opposing the change) said they use the barrel price and dry whey price as the basis for pricing U.S. mozzarella for export sales.

Higher GDT indexes were also achieved Tuesday on the following products: Whole milk powder up 2.4%, averaging $1.48/lb; Anhydrous milkfat powder (AMF) up 1.2%, averaging $3.14; Lactose up a whopping 16%, at 42 cents/lb. Lower indexes were reported on Skim Milk Powder (SMP) down 2.7%, averaging $1.15/lb; and Butter down 2.4%, averaging $2.99/lb.

Milk futures mixed

Class III milk futures were generally steady this week, except near-term September took a 45-cent hit and 2025 contracts were mostly firm to a nickel higher, spots up 15 cents. Class IV futures were steady through 2024, but 10 to 30 cents lower on 2025 contracts. On Wed., Aug. 7, Class III milk futures for the next 12 months (Aug24-Jul25) averaged $19.41, down 3 cents from the same 12 months averaged on the previous Wednesday. The 12-month Class IV average at $20.82 was down a dime.

June DMC margin $11.66, up $8.00 above year ago program lows

As expected, the June DMC margin came in at $11.66, which is $2.16 above the highest tier one coverage level of $9.50/cwt. Announced August 2nd, the June margin was based on an 80-cent higher All-Milk price at $22.80/cwt and a 34-cent drop in feed cost at $11.14/cwt for a DMC margin that was deemed $1.14 higher than May and up by a whopping $8.00/cwt above year-ago program lows set in June and July 2023 at $3.65 and $3.52.

30-day H5N1 detections at 36 in 6 states, Colorado continues to be a breaking hot-spot, Iowa drops from the list, South Dakota returns

As of August 9, 2024, the current confirmed cases of H5N1 in dairy cows within the past 30 days stand at 36 herds in 6 states. Of these, 28 are in Colorado, where the most recent slew of 12 detections were reported for Aug. 5 and 6. Colorado remains the hot spot by a long shot. The state issued an order July 22nd to require mandatory bulk tank milk testing.

Iowa dropped from the 30-day list this week, but South Dakota returned to the list with 2 detections. Other states with confirmed cases within the past 30 days are: Minnesota (1), Idaho (1), Texas (2), and Michigan (1). Cumulatively, since the beginning of the outbreak on March 25, 2024, there have been 190 detections in 13 states.

Enrollments in the national voluntary dairy herd status bulk tank testing include 24 herds: Michigan (10), New Mexico (4), Pennsylvania (3), and 1 herd each in Kansas, Nebraska, North Carolina, Ohio, South Dakota, Tennessee, and Texas. Colorado herds (110) are now all being bulk-tank tested due to the state’s mandatory ruling on July 22.

Milk Market Moos: Could farmers be PAYING processors to take milk’s ‘other solids’ like in 2009 after the last ‘make allowance’ raise?

By Sherry Bunting, Farmshine, August 2, 2024

No ‘snubber’ on USDA’s higher whey make allowance proposal

The whey market is the one to watch right now as the daily CME spot market sped higher again this week, and the dry whey spot price is now above the 60-cents-per-poind mark!

No ‘snubber’ on new whey make allowance means farmers would have PAID processors to take the ‘other solids’ in their milk last summer.

One thing for the industry and USDA to keep in mind regarding the proposed rule announced July 1 is that the higher make allowances, if implemented, include a nearly 7-cents-per-pound raise in the dry whey processor credit. That can be a real bully when markets go south — considering there is no ‘snubber’ to keep farmers from having to give away these ‘other solids’ or to PAY processors to take them as though worthless.

USDA is proposing to increase the dry whey make allowance from $0.1991/lb to $0.2653/lb — a nearly 7 cents per pound jump.

Farmers would have PAID processors to take other solids last summer

Guess what? If we were having this conversation a year ago, looking at July 2023 Class and Component price announcements, we would be writing in this column that your ‘other solids’ price would be essentially zero, meaning processors would get the lactose and whey free, and last August, if the proposed new whey make allowance was in effect, farmers would have paid processors $0.003 to take these components as if they are worthless.

If the proposed 7-cents-per-pound increase in the dry whey make allowance were in effect in July and August 2023, the new $0.2653/lb make allowance would have been at or slightly higher than the dry whey price for those two months.

When the make allowances were raised in 2008, we saw months in 2009 when farmers literally paid their milk buyers to take the other solids in their milk because the dry whey price had fallen below the then-new make allowance, and there was no snubber to stop the bleeding at zero.

July Butterfat up at $3.57, Protein slips to $1.95

USDA announced mixed trends on July 31 for the Class and Component prices used in Federal Milk Marketing Orders for July milk. Class II and IV at $21.82 and $21.31, respectively, were around 20 cents per cwt higher than a month ago and 20 to 70 cents higher than the July Class I base price ‘mover.’

Class III milk, at $19.79, slipped 8 cents from June and continues to be the lowest of the four classes as it has been for most of the past two and a half years.

All components were higher, except for protein, which slipped 10 cents per pound back under the $2 mark at $1.95/lb. Butterfat gained 3 cents at $3.57 for July. Solids nonfat also gained, valued at just over $1.00 per pound for July.

Other solids also gained, at 26 cents/lb. This is derived from the dry whey price vs. make allowance.

June All-Milk price up 80 cents at $22.80, fully $5/cwt above year ago

USDA announced the All-Milk price for June at $22.80, up 80 cents from May and fully $5 higher than a year ago. The national average butterfat test moved down 0.07 at 4.10, but was still 0.09 above year ago. The Pennsylvania All-Milk price for June, at $23.30, was also 80 cents higher than the previous month, and fat test fell by 0.06, reported at 4.01, just 0.01 above year ago. The June DMC margin was not published or available by press-time, but with a higher All-Milk price for June announced at 3 p.m. July 31st, and moderating feed costs, the June DMC margin is likely to be well above the $9.50 trigger margin at around $11.50/cwt. (Update, June DMC margin was announced Aug. 2 at $11.66).

Milk futures mostly higher, especially Class IV

Class III milk futures were mostly higher this week, except near-term September and October were down a few cents per hundredweight. Class IV futures were steady to higher across the board. On Wed., July 31, Class III milk futures for the next 12 months (Aug24-Jul25) averaged $19.44, down 2 cents from the Jul24-Jun25 average on the previous Wednesday. The 12-month Class IV average at $20.92 for the 12 months Aug24-Jul25, also 2 cents below the Jul24-Jun25 average a week ago.

Whey and powder skyrocket, but formula price survey lags

Trade was active with high volume movement on Class IV products, butter and nonfat dry milk powder. Trade was light for Class III products cheese and whey.

The whey market is again the big story as the daily CME spot market continues trading at price levels well above the weekly National Dairy Product Sales Report (NDPSR). The NDPSR prices are the ones that USDA collects in mandatory processor pricing surveys to use in the Federal Milk Marketing Order end-product pricing formulas. The NDPSR whey price is the one USDA AMS plugs into the FMMO pricing formula for Class III and ‘other solids.’

While spot bids for dry whey rallied to a whopping 62 cents per pound Wednesday, July 31, with 3 loads trading the first three days this week, and the weekly average price at 60 cents… the NDPSR for week ending July 27 is still back at 46 cents/lb — a 14-cent per pound deficit vs. the spot market, and 9 cents lower than the previous week’s spot market.

The CME spot market for cheese was mixed with the barrel premium over blocks widening to 7 cents per pound this week as barrels traded firm while blocks moved lower. In the weekly NDPSR, barrels are a scant half-penny higher than blocks.

The CME daily spot market for 40-lb block Cheddar was pegged at $1.9150/lb Wed., July 31 ($1.93/lb average for the week). This is 2 1/2 cents lower than the prior Wednesday with 3 loads trading the first three days this week. The 500-lb barrel cheese price, pegged at $1.9750/lb was unchanged compared with a week ago; 3 loads traded Monday through Wednesday.

The NDPSR for week ending July 27 pegs block cheese at $1.9482/lb and barrels at $1.9533/lb.

In the Class IV product complex, butter firmed up to move higher this week, shrugging off the Cold Storage Report indicating inventories were running 7% above year ago at the end of June. A whopping 26 loads of butter were traded on the CME cash market Monday through Wednesday this week. On Wed., July 31, the spot price was $3.1275/lb — up nearly 4 cents from the previous Wednesday with the weighted average for the week just over $3.10/lb — right where the NDPSR butter price landed for the week ending July 27.

Grade A nonfat dry milk trade was active again this week on the CME spot market, advancing to $1.2450/lb by Wed., July 31, up another penny from a week ago with a whopping 20 loads changing hands the first three days.

Contrary to historical patterns, the NDPSR moved the opposite direction. Again, this is the price used in FMMO pricing formulas. Nonfat dry milk for the week ending July 27 hung back at the $1.18 mark, declining a penny from the prior week despite the 7-cent spot market advance last week. CME spot prices are now at a 6-cents-per-pound premium over the NDPSR.

Total packaged fluid milk sales in May continue outpacing year ago

U.S. fluid milk sales continued outpacing year ago in May, according to the USDA’s Estimated Total Packaged Fluid Milk Sales Report released last Friday, July 19.

The report showed May sales were up 0.3% compared with a year ago, following the big 5.9% jump in April. In fact, fluid milk sales have been higher year-over-year (YOY) for six of the past eight months.

Year-to-date (YTD) sales continue to beat year ago, up 1.3% for the Jan-May period, and when adjusted for Leap Year, YTD 2024 sales are up 0.6% vs. 2023.

Leading the charge again is the largest volume category: conventional whole milk sales, up 1.8% YOY in May, plus organic whole milk sales, up 28% YOY in May.

Conventional whole flavored milk sales were down 13% from a year ago in May — a function of what fat percentage is offered, not necessarily what consumers may have selected — as the reduced fat (2%) flavored milk sales rose 3.5% in May. By contrast, organic whole flavored milk sales were up 31% YOY in May.

Total Organic fluid milk sales of all fat levels were up 6.3% in May YOY and up 7.8% (Leap Year Adjusted) for the first five months of 2024 vs. year ago. They represent 7% of the YTD total of all fluid milk sales.

The ‘other fluid milk products’ category continues to make double-digit percentage gains, up 45% YOY in May and up 37% (Leap Year Adjusted) YTD vs. year ago. This category represents 2.2% of total fluid milk sales. The report does not separate out the ESL products in each fat percentage; however, lactose-free milk brands are included in the ‘other products’ category.

Year-to-date milk production down 1%

U.S. milk production fell 0.8% in June compared with a year ago, despite the national herd reportedly having 2000 more milk cows than a year ago, according to USDA’s monthly milk report this week. The report also revised the May total lower by another 0.2% or 30 million pounds.

Year-to-date milk production for the first half of 2024 is down 0.3% compared with the first half of 2023 even with an extra day of production in 2024! When adjusted for Leap Year, first half 2024 milk production trailed year ago by 1%. It would not be surprising to see USDA come back and trim the June tally lower, later.

In the Northeast and Midatlantic Milkshed, Pennsylvania’s production fell 2.2%, Vermont down 2.8%, and New York down 1.2%.

In the Southeast, Florida gained 4.9% with 4000 more cows while Georgia dropped 8.1%, losing 8,000 cows, and Virginia saw a 4.3% drop in production vs. year ago.

The Mideast Milkshed declined with Michigan down 0.9%, Ohio 0.6%, and Indiana 1.6%, with just a 1000-head loss in cow numbers across the three states.

In the Upper Midwest and Central Plains, Iowa grew production by 1.2%, despite being hit with bird flu in June, Minnesota was down 1%, South Dakota up 8.3%, and Wisconsin up 0.9%.

Western States saw production declines, except for Texas up 3.1% with 13,000 more milk cows than a year ago.

DMI / NMPF talk supply and demand

Fluid milk, yogurt, butter and other than American-type cheese all posted positive annual growth in domestic commercial use during the March-May 2024 period, according to the July edition of the joint DMI and NMPF market report released July 23rd. The report cites significant export growth for all types of cheese and whey protein concentrate and isolate. However, when looking at domestic and export sales of all products combined, the usage is described as “relatively flat to lower” in the March through May period.

The DMI / NMPF report observes that U.S. milk production has nearly had a year’s worth of volumes charting below prior year levels, but “continued increases in average component composition of producer milk has enabled U.S. dairy farmers to supply available demand for dairy products while keeping inventories of key products relatively stable,” the report stated.

Overall supply-and-demand balance in the industry has been good enough to move dairy product and dairy farm prices and margins higher in recent months, without significantly reversing the gradual reduction trend in retail dairy product prices that has occurred over the past year, according to the report.

While dry skim milk usage is down 48% in the March-May period, this is a function of the lower production of skim milk powder (down 24.5%) and nonfat dry milk (down 12.5%). Inventories at the end of May trailed year ago by 4%. Domestic and export markets can only ‘use’ what is ‘produced’ and available in a commodity category in the first place.

But the DMI / NMPF market report did not even mention imports… So here’s the deal:

The U.S. imported 41% more Whole Milk Powder in first-half 2024 vs. 2023,
up 150% vs. 2022
!

While U.S. milk production has trailed year-ago levels for the past 10 consecutive months, U.S. food manufacturers have been quietly ramping up imports of whole milk powder (WMP), which is essentially whole milk, dried.

WMP imports were running 170% above year ago, cumulatively, for the first four months of 2024. May and June totals have slowed down from the huge front-loaded volumes January through April. Still, the cumulative year-to-date WMP import volume at 5.5 million pounds for the first six months of 2024 is 41% greater on a volume basis compared with a year ago.

This is a stunning increase because the Jan-June 2023 WMP import volume was already 77% greater than the first six months of 2022. This means Jan-June Whole Milk Powder (WMP) imports have grown 150% in two years. That’s a volume increase of 1.49 million kgs or 3.29 million pounds. WMP is basically farm milk from another country, in bulk dried form, not a specialized product. It can be used in processing virtually any dairy product, containing all of the milk components — both fat and skim solids.

Total non cheese imports at 10.4 million kgs (21 million pounds) for the first half of 2024 are up 5.9% vs. 2023 and up 41.4% vs. 2022.

Cheese imports, on the other hand are up slightly from a year ago (1.4%) and down 6.27% from 2022.

On the export side of the ledger, the U.S. sold 2% less total milk solids volume overseas in May, which is mainly because skim milk powder, whole milk powder, and other milk protein powder exports were down 8 to 12% from a year ago. Butterfat exports were down 16%.

Cheese exports, on the other hand, were up 27% in May and dry whey product exporter were up 6%. Fluid milk and cream exports were up 2%.

This makes sense because the U.S. dairy processing paradigm has shifted. The U.S. is making less butter and powder (Class IV) and more cheese and dry whey (Class III).
The U.S. is consequently exporting less milk powder and butterfat (Class IV) and exporting more cheese and dry whey products (Class III); while at the same time importing more whole milk powder and non cheese products, while cheese import volumes remain stable.

30-day H5N1 detections drop to 33 in 6 states, hot spot Colo. requires milk testing

As of July 31, 2024, the current confirmed cases of H5N1 in dairy cows within the past 30 days decreased to 33 herds in 6 states. Of these, 24 are in Colorado, the hot spot by a long shot. The state issued an order July 22nd to require mandatory bulk tank milk testing, except raw milk dairies, which are encouraged to do so voluntarily.

Other states with confirmed cases within the past 30 days are: Minnesota (3), Idaho (2), Texas (1), Iowa (1), and Michigan (1). Cumulatively, since the beginning of the outbreak on March 25, 2024, there have been 173 detections in 13 states.

Enrollments in the national voluntary dairy herd status bulk tank testing include 21 herds: Michigan (7), New Mexico (4), Pennsylvania (3), and 1 herd each in Kansas, Nebraska, North Carolina, Ohio, South Dakota, Tennessee, and Texas.

Will we see PA milk bills moove?

The Pennsylvania State Assembly has a few dairy bills waiting to moove on through both chambers again towards the end of a two-year legislative session. We’ve seen this movie before, where the House votes to allow Pennsylvania whole milk produced on Pennsylvania dairy farms to be served in Pennsylvania schools, and where the House votes to allow the state-mandated Pa. Over Order Premium (OOP) to be collected and distributed to farms by the state instead of leaving it open to loopholes that strand the dollars through creative cross-border deals.

In prior years, such milk bills would move through Committee and even get passed by the House, only to be stuck in a chairman’s desk drawer in the Senate. If we look back far enough in the history of milk bills in the Pennsylvania legislature, we see on other occasions a long awaited milk bill passed the Senate only to be stalled out in the House. Will this year be any different? Who knows? Election years are funny-seasons.

Earlier this month, Senators Elder Vogel and Judy Schwank, the chair and ranking member, respectively, of the Senate Ag Committee introduced legislation to allow the state to collect the state-mandated OOP and distribute it to farmers. A similar bill had been introduced in the past two legislative sessions on the House side by Rep. John Lawrence, but Vogel and Schwank were unconvinced to move it in the Senate.

This time, Vogel and Schwank are introducing the measure after many years of multiple hearings, task forces, and other such discussions of what on earth to do about the state-mandated OOP to make sure all of it — 100% — gets into the pockets of Pennsylvania dairy farmers, as intended.

The Vogel-Schwank rendition would “empower” the Pennsylvania Milk Board (formerly known as the Pennsylvania Milk Marketing Board) to administrate the process of collecting and distributing the premium with involvement of the Pa. Dept. of Revenue. The state would distribute the funds to farmers, milk handlers and dealers using a formula that includes cost of production, price received, and other measures.

The current method of distribution only follows the $1 premium for milk that is produced, processed, and sold in Pennsylvania, but consumers pay this $1.00/cwt premium within the minimum retail price set by the Pa. Milk Board for ALL milk sold at retail in Pennsylvania — no matter where it comes from.

For decades the debate over the Pa. OOP has had its moments where farmers thought a change would come to prevent significant gamesmanship stranding millions of dollars in premiums intended for the dairy farmers.

Yes, I am cynical. We are five months away from the end of a 2-year legislative session and four months away from an election / re-election. Forgive my gut reaction: Ho-hum…. here we go again… time and money spent on spinning this wheel of fortune. Not buying it. Stay tuned.

In June, the Senate Ag Committee passed SB 1229, which would allow the Pa. Dept. of Agriculture to provide financial assistance to dairy farmers who enroll in the federal dairy margin coverage (DMC) program.

USDA recommends changes to milk pricing formulas and other Milk Market Moos

By Sherry Bunting, Milk Market Moos column in Farmshine, July 5, 2024 (with updates)

USDA issued a 332-page recommended decision on July 1 for changes to pricing formulas in all 11 Federal Milk Marketing Orders, which was later published in the Federal Register July 15.

The bottom line is a mixed bag of positives, negatives, and questions requiring further study.

USDA AMS professionals did yeoman’s work with the 49 hearing days across five months of proceedings on 21 proposals, yielding 500 exhibits; more than 12,000 pages of transcripts of testimony from farmers, cooperatives, processors and others, along with cross-examination; and over 30 post hearing briefs and correspondence.

Once the draft decision is officially published in the Federal Register in the coming weeks, the 60-day public comment period begins, followed by 60 days of USDA evaluation of the feedback, followed by a final rule, followed by a producer referendum.

According to the FAQ section at the USDA AMS national hearing website, only producers who are pooled in the selected representative month in each Federal Order will be eligible to vote. Each of the 11 Orders votes separately.

If two-thirds of those eligible dairy farmers OR two-thirds of the pooled volume they represent in an Order vote “yes,” then that Order continues, as amended. If neither two-thirds threshold is met, then that Order is terminated. *AMS answered our question on the two-thirds determination that it is determined by the number of eligible (pooled) producers who actually participate in the vote, stating: “If a producer receives a ballot but does not return it, the producer is not included in either the numerator or the denominator of the two-thirds calculation.”

Here’s what’s in the USDA recommended decision package:

1) Milk Composition Factors: USDA recommends updating the milk composition factors to 3.3% true protein, 6.0% other solids, and 9.3% nonfat solids. This would mainly affect Class I in all Orders and the other Class prices in the fat/skim priced Orders.

2) Surveyed Commodity Products: The recommendation here is to remove the 500-pound barrel cheese prices from the Dairy Product Mandatory Reporting Program survey and rely solely on the 40-pound block cheddar cheese price to determine the monthly average cheese price used in the Class III and protein formulas. National Milk Producers Federation (NMPF) proposed this and International Dairy Foods Association (IDFA) opposed it. American Farm Bureau Federation (AFBF) had proposed adding unsalted butter and 640-lb block cheddar to the survey, and California Dairy Campaign had proposed adding bulk mozzarella. Neither of these proposals were included in USDA’s recommended decision.

AFBF chief economist Roger Cryan discussed this recently on Farm Bureau Newsline, where he also talked about USDA decision not to include AFBF’s proposal to raise the Class II differential.

3) Class III and Class IV Formula Factors: USDA chose to recommend make allowance increases that fall in between the lower increase proposed by NMPF and the higher increase proposed by IDFA and Wisconsin Cheesemakers. The USDA recommendation is to raise these manufacturing allowances from current levels to these new levels: Cheese: $0.2504; Butter: $0.2257; NFDM: $0.2268; and Dry Whey: $0.2653. The recommended decision also proposes updating the butterfat recovery factor to 91%.

By our calculations, the proposed make allowance increase would equate to roughly an additional 80 cents per hundredweight deduction from milk checks embedded in the pricing formulas. Current make allowances total up to about $2.75 to $3.60 per hundredweight, depending on product mix. New make allowances would total up to about $3.25 to $4.50 per hundredweight, depending on product mix.

AFBF economist Danny Munch was interviewed by Brownfield Ag on July 2, noting the increase is 5 to 7 cents per pound. “When we loop that into a per-hundredweight value, that means farmers will be seeing 75 cents to 87 cents less per hundredweight on their milk checks because of the increased make allowance.” He says the data used for the make allowances was based on voluntary cost of production surveys. 

Farm Bureau president Zippy Duvall did not mince words: “We strongly believe make allowances should not be changed without a mandatory, audited survey of processors’ costs. Our dairy farmers deserve fairness in their milk checks and transparency in the formula, but the milk marketing order system can’t deliver that unless make allowances are based on accurate and unbiased data,” he said in an AFBF news release.

American Dairy Coalition CEO Laurie Fischer also weighed in: “We are disappointed that USDA has proposed higher make allowance credits for processors, which are — in effect — deductions from farmer milk checks that are embedded within the pricing formulas. The industry does not yet have mandatory, audited cost surveys, and there is no connection between increased processor credits and a transparent, adequate price paid to farmers,” she said in an ADC news release, adding that these two elements have been key policy priorities for ADC since January of 2022.

4) Class I differentials: USDA recommends updating Class I differential values to reflect the increased cost of servicing the Class I market. The base differential for all counties stays at $1.60, and the county-specific Class I differentials are specified in the decision at levels higher than they are currently, but by less than the increases that had been proposed by NMPF.

5) Base Class I Skim Milk Price: USDA recommends going back to the higher-of the advanced Class III or Class IV skim milk prices to set the Class I mover each month. However, the Department did not go with Farm Bureau’s request to do this on an emergency expedited basis.

And, here’s where it gets tricky, the higher-of method would only apply to fresh fluid milk, while adopting a rolling monthly adjuster that incorporates the average-of for milk that is used to make extended shelf life (ESL) fluid products, including shelf-stable milk.

This means ESL milk would be priced differently from conventional fresh fluid milk within the same Class I category. A simple averaging method would be used as part of this special ESL adjuster, which would incorporate a 24-month rolling average (with a 12-month lag) of the difference between the higher-of minus the average-of, which is added to the current month simple average-of, and then the current month higher-of is subtracted from that sum. This adjuster could be either a positive or negative number.

In fact, we’ve learned that this ESL adjuster, using months 13 through 36 counting backward from the implementation date, would allow milk for ESL products to recoup, over time, some of the very large prior losses experienced by all dairy farmers during the average-of method that has been in place since May 2019. Because a simple average is used for the adjuster calculation, without the 74 cents, more would be recouped than the actual loss difference experienced under the years of the average plus 74 cents method. On the other hand, the rolling adjuster look back will include months in which a smaller make allowance was in effect than could be the case in the future if USDA’s make allowance recommendation becomes final.

Meanwhile, producers of milk bottled as ‘regular’ fresh fluid milk would start right out of the implementation gate at the higher-of and recoup zero prior loss endured under the current form of average-of, and be subjected to the higher make allowance, which is built into the advance pricing factors. (More on this feature of the USDA recommended decision in a future article.)

In its ‘notice to trade,’ USDA states that the ESL adjuster was developed to “provide for better price equity for ESL products whose marketing characteristics are distinct from other Class I products.”

Meanwhile, in his July 3rd CEO’s Corner, NMPF’s Gregg Doud appears to embrace what is essentially a fifth milk class given the different pricing methods proposed in the recommended decision for Class I — depending on shelf-life classification.

Doud writes: “Recognizing the need to restore orderly milk marketing, USDA decided to go back to the higher-of, with an accommodation for extended shelf-life milk, thus granting NMPF’s request for the vast majority of U.S. fluid milk. USDA’s solution is, frankly, as innovative as it is fair – a classic case of two sides not getting all that everyone wanted, but everyone getting what they most needed.”

Splitting the baby was not part of any hearing proposal that we could find; apparently processors made their case with USDA as to needing the average-of method (with calculated adjuster) to sell ESL milk products deemed the new milk beverage platform.

During the national hearing in Carmel, Indiana, representatives from Nestle, a major maker of ESL fluid milk products, said their sales increased once the average-of method was implemented in May 2019 through legislative language in the 2018 farm bill. They testified that they could manage risk when providing 9 to 12 month future pricing on shelf-stable fluid products to foodservice and convenience stores. They lamented that losing the average-of would hurt their sales.

Representatives for fairlife testified that forward pricing of their ESL products was critical to their ability to grow sales and that losing the average-of would impact future plans, including the size of the new plant being planned for New York State and other expansions elsewhere in the future.

However, since this bifurcation of Class I was not a proposal subject to vetting, no one had the opportunity to present evidence on future impacts.

Public comments on the recommended proposals will be accepted for 60 calendar days after the decision is published in the Federal Register. Comments should be submitted at the Federal eRulemaking portal: http://www.regulations.gov or the Office of the Hearing Clerk, U.S. Department of Agriculture, 1400 Independence Ave., SW, Stop 9203, Room 1031, Washington, DC 20250-9203; Fax: (844) 325-6940.

OTHER MOOS — July 3, 2024

Milk futures swap trends: Cl. IV up, III down

Class III milk futures moved lower this week especially on August and Sept. 2024 contracts; while Class IV milk futures were higher on 2024 contracts, steady to firm for 2025. On Tues., July 2, Class III milk futures for the next 12 months averaged $19.28, down 24 cents from the previous Wednesday. The 12-month lass IV milk futures average was $21.19, up 14 cents. This put the spread between Class IV over III at nearly $2.00 per cwt.

Block cheese, whey higher

Pre-holiday trade was firm to higher with little volume moved on most products. But nonfat dry milk lost ground, and the 500-lb barrel cheese trade was active at lower prices.
The 40-lb block Cheddar price was pegged at $1.90/lb on Tues., July 2, up 2 cents from the previous Wednesday, with just 2 loads trading the first 2 days. The 500-lb barrel cheese market lost 2 cents, pegged at $1.88/lb Tuesday with 12 loads trading the first two days. (Update gained it back July 3 at $1.9025/lb with 2 loads trading). Dry whey gained a half-penny on the week at 49 cents/lb; one load traded.

Butter higher, powder weak

The butter market saw no trades the first two days this week. By Tues., July 2, the daily CME spot price was pegged nearly a nickel higher at $3.1375/lb. Grade A nonfat dry milk lost a penny and a half at $1.17/lb Tuesday with 4 loads changing hands. (Update, NFDM up July 3 at $1.18/lb, 2 loads traded)

May All-Milk $22.00, DMC margin $10.52

USDA announced the All-Milk price for May at $22.00, up $1.50 from April and $2.90 higher than a year ago. The national average fat test was 4.17, up 0.02 from the previous month and up 0.11 from a year ago. The Pennsylvania All-Milk price for May, at $22.50, was just 70 cents higher than for April, and fat test fell by 0.10 from April to May.

USDA announced the May Dairy Margin Coverage (DMC) margin at $10.52/cwt, up 92 cents from April and up a whopping $5.69 per cwt from the May margin a year ago. This is the third consecutive month in which no DMC margin payments were triggered as the margin remains above the highest coverage level of $9.50/cwt. The $1.50/cwt gain in the national average All-Milk price in May outpaced the 58 cents/cwt increase in feed cost.

H5N1 detections fall to 57 in just 7 states

As of July 2, 2024, the confirmed cases of H5N1 in dairy cows decreased to 57 herds in now just 7 states as South Dakota moved past the 30-day window and off the active map. Colorado has the most detections at 23 in the past 30 days, 27 cumulatively since April 25. This has created some questions as it represents 20 to 25% of the 110 herds in the 13th largest milk-producing state. Colorado is followed by Iowa (12), Idaho (9), Minnesota (6), Texas (5), while Michigan’s previously high numbers over 25 have dropped to one, and Wyoming still has just one. Michigan and Wyoming will be past their 30 days on July 7 and 12, respectively, if no new detections are confirmed.

MILK MARKET MOOS – Bad news in this week’s mailbox, but better views ahead!

By Sherry Bunting, Portions reprinted from the May 10, 2024 column with a few preview notes for the May 17 weekly Milk Market Moos, available exclusively in Farmshine Newspaper

This week’s settlement checks for April milk are hard hit by the record-low protein price of $0.83/lb and the $4 to $5 spread of Class IV over III that continues to depress the Class I price via the ‘average of’ method — resulting in depooling of higher value manufacturing milk. But the good news is the cheese markets have sustained a 5-week rally that has been heating up, pushing Class III milk futures higher, while tight supplies of nonfat dry milk moved briskly at higher prices to keep Class IV forging ahead too.

First the bad news: April FO blend prices are mixed with component-pricing lower, Fat/skim-pricing generally higher

The record-low April protein price of 83 cents/lb and second lowest Class III price of the year pushed the Federal Order (FO) blend prices 25 to 45 cents lower in six of the seven FOs that use Multiple Component Pricing (MCP). The Northeast, was off just 9 cents, given the fact that processors still pooled some milk used for higher value Class II and IV products, although not as much. De-pooling of Class II and IV milk was heavier in other MCP FOs due to the whopping $5 spread between Class II and IV ($20.23 and $20.11) over Class III ($15.50) and the fact that Class II and IV were $1.00 higher than the Class I ‘mover.’

The wide spread pushed the Class I ‘mover’ price $1.00 lower using the ‘average of’ calculation than it would have been under the previous ‘higher of’ method. The May Class I mover price is even more disadvantaged — down $1.73 vs. ‘higher of’ — based on the advance pricing factors at the beginning of April before the CME cheese market rally begins filtering its way into USDA weekly surveys and FO formulas.

Three of the four fat/skim priced FOs — Florida, Southeast and Appalachian — have April blends that are mostly 20 cents higher than March. Fat/skim priced FOs benefitted from the butterfat price at $3.33/lb and a solids nonfat (skim) price at 97 cents/lb that was 14 cents higher than the protein price. This is the first time such an inversion has occurred.

Meanwhile, the fat/skim-priced Arizona FO (131) saw its April uniform price fall by 19 cents due to Class II and IV depooling, which increased the negative effect of a higher Class III utilization percentage.

The uniform price in the three southeastern region FOs (5, 6 and 7) would have netted an additional 70 to 80 cents per cwt — if Class I had been priced via the ‘higher of.’ The Mideast (FO 33) would have netted 40 cents per cwt more; the Northeast, Central, and Southwest (FOs 1, 32 and 126) 29 to 30 cents; California and Pacific Northwest (FOs 51 and 124) 20 cents; Upper Midwest (FO 30) 6 cents. All MCP FOs would have benefitted from better alignment keeping more of the higher-valued Class II and IV milk in the FO revenue sharing pools. It’s hard to say whether or how much of the windfall profits of depooling are consequently shared with dairy farmers shipping the milk.

Once again, the Upper Midwest (FO 30) had the rock-bottom uniform price of $15.95 at 3.5% butterfat, with over 92% of the utilization being Class III. If the ‘higher of’ had been used for pricing Class I, the pounds of Class II and IV utilization would likely be greater, which may have contributed to a more positive uniform blend price while yielding a little more than a nickel of additional Class I contribution. Instead, the blend price included less than 2% Class II and IV, and just over 6% Class I.

The FO 30 market administrator saw fit to send a reminder letter to handlers in March that they must show separately how milk payments were calculated for producers having both pooled and depooled milk to ensure the pooled milk was paid at the FO minimum price. Even 100% pooled producers have been seeing ‘milk check gymnastics’ such as underpayment of the FO minimum for ‘other solids’, and then using the producer’s protein premium to make up the difference in order to achieve the regulated gross minimum.

According to USDA AMS, Federal Milk Marketing Orders with multiple component pricing, use individual component values to determine the minimum gross value due to producers. The FMMOs’ primary function is to ensure that the gross payment to the producer is at least equal to the minimum payment for their pooled milk. Enforcement of individual component values may be pursued by FMMOs to prevent handler deception and maintain transparency. In FMMOs where it is common to pool only a portion of a producer’s milk, proprietary handlers are required to send statements to producers indicating the separate amounts paid for pooled and non-pooled milk.

The April 2024 uniform prices and PPDs were announced May 12 through 14 as follow (+/- change from month ago):

Now the good news! What’s UP with Class III?

For 18 months, Class III has been the underdog in milk pricing, especially rough for dairy producers in the Upper Midwest struggling under the brunt of FMMO 30 blend prices built mainly on Class III.

In fact, the April protein price hit a record low, announced May 1st at 83 cents/lb, which is 14 cents below the 97 cents/lb price for solids nonfat. This inversion has never happened before, according to our search of class and component pricing archives.

The butterfat price for April is quadruple the protein price at $3.33, creating additional divergence issues in multiple component pricing orders.

Meanwhile, the Class III milk futures haven’t offered much of a breakeven price to spend money protecting with hedges or DRP…

Until now…

Class III milk futures continued higher — skyrocketing limit-up for nearby contracts Wed., May 8, putting the exclamation point on five straight week of gains that have added $3 per hundredweight to the remaining 2024 contract months, going from the $16s and low $17s to the $19s and $20s, with 2025 contracts well into the $18s. This is the first time the Class III milk futures board has seen a $20 mark in over 18 months.

Class IV futures also made solid 20- to 30-cent gains charting over $20 and $21 across the board.

If the current Class III rally goes too far, too fast in the near-term, we could see negative PPDs in some Federal Orders in June for May’s milk because the May Class I advance base price mover was already announced in mid-April, and includes the much lower advance pricing factors of the (Class III) cheese and whey markets during the first two weeks of April.

The ‘average of’ method disadvantaged the May Class I mover by $1.73/cwt, which will undoubtedly be a factor for milk pooling / depooling decisions at the end of this month as Class I, at a base price of $18.46, will likely be rock-bottom lowest class for May, except where location differentials are high enough to boost it.

$20 finally appears on Class III futures board (June), Spot cheese hits highest price in over a year.

On Wed., May 8 the Class III milk futures for the next 12 months (May24 through Apr25) averaged $19.04, up 54 cents from the previous Wednesday. Class IV milk futures averaged $20.86, up 22 cents from the prior Wednesday.

The milk futures rally is driven by the upward momentum in CME daily spot cheese markets, reaching levels May 8 that are 50 to 55 cents per pound higher than six weeks ago.

The 40-lb block Cheddar price roared 11 1/2 cents higher to $1.95/lb in a single trading session Wed., May 8, gaining 20 cents/lb on the week, and hitting the highest level since last fall, with a single load trading. For 500-lb barrel cheese, at $1.90/lb, the gain was a dime on the week, and the highest price in over a year, with zero loads trading.

(Spoiler alert, the spot price for 500-lb barrel cheese skyrocketed well north of $2 on Tues., May 14 with a single load trading at $2.06. Conversely, Tuesday’s trading session on 40-lb block Cheddar started out moving a load as high as $2.00/lb, which would have been a 2-cent gain for the day. However, after the dust settled on the brisk trading session that moved a whopping 14 loads of blocks in a few short minutes, the market was pegged at the lowest load price of $1.93/lb — down 5 cents from the day before. A bid came in at $1.92 and was ignored after such an abnormally large clearance of blocks for a single session. More on this in the May 17 Farmshine.)

All other dairy commodity prices were higher Wed., May 8, with no trades changing hands. Dry whey gained a penny at 38 1/2 cents/lb (where it continued trading on Tues., May 14 with 2 loads changing hands). May 8th Butter was up 2 cents at $3.02/lb (but traded 16 loads at $3.00/lb Tues., May 14 and 1 load at $2.99/lb, which was a 3-cent loss since the low price is the peg for the day). Nonfat dry milk (NFDM) was up a penny at $1.13/lb on May 8 (and gained 3 1/2 cents more on May 14 at $1.1650/lb with an incredible 26 loads moving in a single session’s narrow $1.16 to $1.1650/lb range).

Dairy farmers will not see these gains in their milk checks until June, if the trend is sustained.

In the face of lower overall dairy exports, analysts tout the record volume of cheese exports in March, which were no-doubt prompted by the cut-rate January through April pricing that doesn’t pay bills on the dairy farm.

We have to go back to 2019 to find a 4-month Jan-April average Class III milk price that was lower than the first four months of 2024. We have to go back to the Covid shutdown in 2020 to find an April Class III milk price that was lower than April 2024. But even then, protein held up at $2.48/lb, not the 83 cents per pound that USDA announced for April settlement.

The difference this time is that fat is so much higher (quadruple the protein price at $3.33/lb for April). This essentially pulls a credit out of protein as an adjustment in fat values for cheese vs. butter. This is a seldom-discussed and little understood function of FMMO multiple component pricing, and another downfall of the many months of wide Class IV over III divergence.

Better views ahead… Higher Class I sales and record-high made-to-order fresh mozzarella production compete with stored product output for reduced milk supply

While the rear-view mirror shows the rough road traveled, the view ahead is improving for Class III milk and the beleaguered record-low protein price. Milk production is down. Packaged Class I fluid milk sales are UP. Processors are making record amounts of fresh (made to order) mozzarella cheese, causing Cheddar production to slow. Meanwhile, Class IV product supplies are tight. (One reason overall U.S. dairy exports were down is that inventories and production of milk powder is down!)

The most recent USDA Dairy Products Report showed Cheddar cheese production down 3.3% year-over-year (YOY) in March, with all American style cheeses down 2.9%. A positive this year that was missing last spring and summer is the draw for milk to make Italian cheeses.

Mozzarella production set records in March, up 6.8% YOY, but those products are not price-surveyed, nor are they included in the FMMO Class III pricing formula.

In addition to Cheddar cheese, the Class III price is also made up of dry whey sales via the ‘other solids’ component. Whey production for both human and animal use is accelerating as inventories of value-added whey protein concentrate (WPC) and whey protein isolates (WPI) were more than 40% below year ago at the end of March, despite March WPC production being up 1% for human use and up 40% for animal use; WPI up 73% YOY.

Dry whey is the commodity used in the FMMO Class III pricing formula with production up 2.4% for human use and 19.2% for animal use in March.

On the Class IV side, butter production was up 1.5% YOY in March with inventories up 2%.

As for powders: Whole milk powder (WMP) production was down 14.6% with inventory 36.3% lower YOY; Skim milk powder (SMP), typically made for export orders, was down 41.7%; and Nonfat dry milk (NFDM) output was down 7.9% YOY in March with inventories off 20.3%.

On the flip side, milk protein concentrate (MPC) production was the contrarian — up a whopping 38.5% YOY in March. MPCs are often used to bump cheese yields higher per hundredweight of raw milk.

These factors beg questions: Why were Class III milk prices for the first four months of 2024 at 5-year lows and protein at a record-low 83 cents per pound for April? Was it the plan to crush Q-1 2024 spot cheese and Class III milk prices to generate record cheese export volumes in March? Are cheesemakers using some of that big increase in MPC production to make more cheese from each cwt of raw milk? Are bioengineered fermentation yeast proteins that are marketed in trade publications as ‘dairy protein analogs’ diluting the supply and demand equation fractionally?

Global picture improving

The global picture is also improving. New Zealand tallied a lower output for the season, and recent reports show stable to lower milk output in EU countries.

In the Global Dairy Trade (GDT) biweekly internet auction Tues., May 7, the all products index was up 1.8% over the previous auction on April 16. This includes a whopping 8% increase in the GDT price index for bulk Cheddar sales contracted out through November, plus a 2.3% increase in bulk Mozzarella sales for July.

In fact, GDT Cheddar contracts for June were up 6.5% in Tuesday’s auction; July up 3.9%; August and September had no sales. October and November contracts were up 11.2 and 12.5%, respectively, compared with three weeks ago.

Seeds of doubt being sown, Part III: Will it reduce butterfat supply and impact industry’s cheese-focused future?

By Sherry Bunting, Farmshine, March 1, 2024

EAST EARL, Pa. — As seeds of doubt are being sown internally within the dairy industry about whole milk in schools, we have discussed Confusion (will it help milk prices?) and Consternation (unfounded fear about what will processors do with ‘all that skim?’)

This week, we look at the third C: ‘Competition’: If schoolchildren are offered whole milk, will it significantly impact butterfat supplies, raise butter prices, and compete with the industry’s cheap milk cheese-focused future?

Every winter conference for the past few years has had at least one speaker telling dairy farmers that fluid milk sales are declining because Americans are eating more of their milk instead of drinking it. 

Fair enough. Cheese is the future, and the industry wants to make more of it. Lots more of it. So much more cheese, in fact, that inventory is growing. Analysts at conferences put up slides with the words “Export or perish!” in large font. 

Yes, U.S. Dairy wants to export more cheese, including mozzarella. U.S. Dairy wants to export more butter and cream products. U.S. Dairy wants to export more of the higher-value products. (And we want to sell more cream to the upscale coffee houses and downscale McCafe drinks we adults get to choose while junior sips a paltry half-pint of fat-free chocolate milk, sugar water, in the back seat. What’s wrong with us?)

This map shows the over $7 billion in new processing coming online between now and 2026. “There’s a lot of cheese on this map,” said IDFA CEO Michael Dykes, presenting at the Georgia Dairy Conference. This slide has also been popping up in other industry conference speaker powerpoint decks this meeting season. IDFA data

The industry also wants to take milk down to its molecular level – to turn the jug of milk into ingredients at the start — to make new function-targeted products for the beverage space outside of Class I parameters within an increasingly Class III dominated processing infrastructure.

Toward that end, new processing capacity won’t convert milk to traditional products, leaving elements to be marketed as ingredients. Instead, these new state-of-the-art cheese and ingredient plants start by taking milk apart to the ingredients-level to be used in making health beverages, bars, and other products, as well as to make cheese. 

At the Georgia Dairy Conference in January, IDFA CEO Michael Dykes mentioned IDFA’s support for the Whole Milk for Healthy Kids Act, giving attendees a QR code to weigh-in with their Senators. 

Later in his presentation, he noted that a shift to more fat in school milk would make a 3% impact on the butter supply.

“I’m a believer that the markets work, when you take it one place, you make a difference and change it someplace else. Those are the things we can work through,” said Dykes.

So, we reached out to Calvin Covington, a former cooperative CEO who is intimately familiar with component pricing as it became part of the Federal Milk Marketing Order (FMMO) system over 20 years ago. We asked his thoughts on how increasing fat in the school milk supply would impact butter. 

“Increased Cheddar cheese production has used millions and millions of pounds of butterfat. No one complains about this. Doesn’t the dairy industry want to increase demand for all milk components?” he replied and sent forth his own calculations, providing a spreadsheet showing his estimates of milk used in schools and the additional fat that would be needed for all of that milk to go completely to 3.25% (whole) milk.

Covington ran the numbers, moving methodically through assumptions on Table 1 to conclude the impact of shifting from a school milk fat percentage of 0.5% (half fat-free and half 1%) all the way to 3.25% (whole milk) would have a small impact on the butterfat supply — raising the school milk’s usage of butterfat from 0.25% of total butterfat production at the current national average fat test of 4.11% to being 1.47% of total butterfat production at the average 4.11% fat test.

Using the identified assumptions, Table 1 shows estimates on school milk volume and use of butterfat under today’s fat-free and 1% low-fat milk requirement compared with a scenario in which all school milk pounds were at 3.25% fat as standardized whole milk. Provided by Calvin Covington

He estimates public schools use 9.72% of all fluid milk, and for the purpose of the spreadsheet exercise, he assumed that half of those school milk sales are currently fat-free and half are 1%. If that is the case, then going to 3.25% (whole) milk for all pounds of school milk sales, the additional fat that would be needed is almost 114 million pounds, he reports.

“This should be a non-issue,” Covington concludes, using estimates that are based on all of those school milk pounds moving to 3.25% fat. 

The more likely scenario, however, is that schools would implement a more gradual increase in fat percentage. If it mirrored the national average for fluid milk sales at 2% fat, the increase would be smaller initially. Using Covington’s chart and assumptions, the additional fat that would be needed if school milk fat content averaged 2% is closer to 84 million pounds, going from using 0.25% of total fat production to 0.9% of total fat production.

Not all schools will choose to offer all milk at 3.25%. Some may offer 2% milk, which has also been banned since 2010 and would be given regulatory relief under the Whole Milk for Healthy Kids Act. 

Even if 3.25% fat milk is universally offered, some schoolchildren will continue to choose low-fat milk, as they did in the Pennsylvania trial, where the preference was 3 to 1 for whole 3.25% over low-fat 1%.

While a potentially higher fat content in school milk is being scrutinized for its impact on butter and butterfat, the impact of aggressive increases in cheese production is ignored. This speaks a bit to industry priorities.

“As butter and cheese consumption increase, processors do not argue against the increase because utilizing more fat would increase the fat price,” Covington observes, wondering why anyone would be concerned about the impact on butterfat supply if children get to choose whole milk while not being concerned about the impact on butterfat supply in any other sector.

“An increase in fluid milk sales, in schools, or anywhere, benefits all dairy farmers. With all things being equal, it would shift milk from Class III and IV to Class I, which is a (normally) higher milk price,” Covington explains. “If Class III or IV need more milk to replace the loss to Class I, more money would need to be paid by Class III and IV milk buyers, again, helping dairy farmers.”

So, what is the current status of butterfat production and usage? 

The national butterfat average is 4.11%. A decade ago, it was 3.69. From 2011 to 2022, total butterfat pounds produced on farms in the U.S. grew by 2 billion pounds from 7.3 billion to 9.3 billion. That’s a butterfat volume response to a price signaling demand.

Where’s it all going? Around 20% goes to butter production, 8% to ice cream and frozen desserts, 10% in fluid milk sales, and close to 50% is used in cheese production. And then there is this growing market for cream used in coffee drinks.

Meanwhile, dairy producers out West report receiving a letter from a large cheese plant, putting in a new base program at 1.5% over base. 

Another producer in an unregulated state in the West reported receiving a letter from his cheese plant stating they will reduce the butterfat multiple in their cheese milk payment, beginning April 1. The reason, according to the letter, is the farms are making too much butterfat, and the plant is having to buy condensed solids (skim) to pair with the additional fat or sell the extra fat as excess sweet cream at a loss.

During the FMMO hearing, fluid milk bottlers complained that the higher fat and component levels in milk today are more costly for them to deal with, that they must move the excess cream at a loss, and they have to clean the separator more often because of ‘sludge’ buildup. (I kid you not, one witness called it ‘sludge.’)

Processors have petitioned USDA with multiple proposals to get regulated minimum prices down to their definition of a ‘market clearing’ level that then allows them to add market premiums to attract new milk. Read that sentence again.

Who would be paying those premiums to grow milk supply? Not the processors. It would be revenue coming out of the regulated minimum price benchmarks for all farmers, including farmers that are not growing, to then get added back in by the processors wherever they want to direct growth.

Cheap milk is the name of the game, while at the same time, dairy farmers are being challenged to grow to meet the future ‘demand gap’ to fill $7 billion in new processing investments that will become operational over the next few years.

Dairy analysts tell how milk production expansion to meet this investment will not be as easy to do and will take longer than in the past because of the shortage in replacement heifers. 

We’re at a standoff, so to speak. 

Dairy producers have bred beef-on-dairy to bring margin back to their farms after 10 years of dairy margin compression. This strategy has been a good hedge against overproduction of milk in the era of sexed-semen, and it has helped protect farm balance sheets by reinforcing the value of the cattle as collateral.

So, what tool will be used now to drive consolidation and growth in dairy? Dykes told Georgia producers that, “Sustainability will be one of the biggest drivers of consolidation we’ve seen in a generation. Why? Because it’s going to take investment, and it’s going to take scale. We need to figure it out, to measure it, verify it, account for it, not double count it. We’re going to need investments to make sure we have the infrastructure.”

He said sustainability will become the gateway for exports where countries have mandates and carbon taxes for purchased ag products.

So, here we are back at the question about milk supply, butterfat supply, skim supply and school milk. Wouldn’t whole milk sales to schools offer a much-needed tug on the demand side to help shift some milk away from this runaway, market-depressing, buildup of excess cheese production that elicits the powerpoint headline: ‘Export or perish?’ 

Just think, if the fluid milk sales to schools increased as they did in the Pennsylvania trial by 52%, or even half that, by 25% as more kids choose milk instead of refusing it, market principles could work — gaining something in one place to affect it someplace else. 

Meanwhile, the industry can do some soul-searching and adapting amid the double-speak. If more milk, fat and components are needed, then farmers need to be able to make a living milking cows and producing fat and components.

Is the problem not enough milk? Or too much milk? Not enough fat? Or too much fat? Not enough skim? Or too much skim? Or is the problem rooted in making sure milk can be bought cheap and that farmers are forced to find revenue in other ways, such as carbon monitoring?

Let’s get it straight please.

On the horizon, we see: Checkoff-funded fluid milk innovations for new beverages that identify and separate specific milk molecules for specific benefits (sleep drinks, energy drinks, immune function drinks, specific protein type drinks)? More on that in Milk Molecules Initiative Part I and Part II

-30-

Seeds of doubt being sown, Part One, Confusion: ‘Will this bill really improve milk prices?”

By Sherry Bunting, Farmshine, Feb. 16, 2024

EAST EARL, Pa. — While decades of scientific debate in terms of childhood health and nutrition is the curtain opponents hide behind, the anti-animal agenda is the top hurdle for the Whole Milk for Healthy Kids Act in the Senate.

Senator Roger Marshall (R-Kan.) is the prime sponsor of the Senate bill, and he is a medical doctor in obstetrics and is taking a beating from billboards sponsored by Physicians Committee for Responsible Medicine (PCRM) in his home state of Kansas. PCRM is a known arm of PETA. This tells us quite a bit, doesn’t it?

Meanwhile, the top 3 C’s facing the bill within the dairy industry, itself, need to be addressed. 

1) Confusion… Will it really improve milk prices? Addressed in this article

2) Consternation (fear)… What will processors do with “all of that skim”? Addressed in Part II here

3) Competition… Will it reduce the butterfat supply and affect the ramp up in cheese manufacturing or other dairy products? Addressed in Part III here

Plus…. the Checkoff Commitments… Will it interfere with checkoff-funded Milk Molecules Initiative for new beverages that identify and separate specific milk molecules for specific benefits (sleep drinks, energy drinks, immune function drinks, specific protein type drinks)? 

All of these questions are quietly floating around and sowing seeds of doubt, leading to analysis-paralysis, while the industry focus is on innovation and exports, not on fresh milk, or a healthy next generation of U.S. milk consumers.

All of these questions will be answered one at a time over the next several weeks, starting with the first “C”: Confusion.

“Will this bill really improve our milk prices?” was the question I was asked by a few farmers at a recent farm show. My response was to ask them if they are concerned about kids having healthy milk options they enjoy and if they are concerned about seeing further erosion of fluid milk sales, and losing another generation of milk drinkers?

I reached out to Calvin Covington, former milk cooperative CEO in the fluid milk markets of the Southeast and a primary architect of pricing milk by component yield even before Order Reform during his years with American Jersey Cattle Breeders.

Covington ran the numbers using 2023 average prices, and calculating pounds of milk, fat, and skim, utilization, and values, which yield a gross value of a hundredweight of milk being used for fluid processing at different fat levels. 

“At a $3.00 Class I differential, a hundredweight of milk going for 3.25 fluid milk (whole milk as standardized), returns an additional 25 cents per hundredweight over skim milk,” Covington writes, noting that the difference will change based on different Class I differentials.

Even in the counties with small or zero location differentials on the map, the base differential of $1.60 per hundredweight is still included, which means at least a 13 cents per hundredweight difference.

Previously, Covington has noted in presentations that milk prices improve as the average fat level of total fluid milk sales increases. The current average of all sales, nationwide, stands at 2%. A few years ago, it was below 2%. A fractional change in either direction influences Federal Milk Marketing Order blend prices.

Fluid milk demand also plays a role in manufacturing class prices, affecting farmers in regions where prices are based almost exclusively on cheese. 

That’s especially true right now as cheese production has been exploding, and the Class III milk price has been imploding, creating a wide spread below Class IV and pushing FMMO blend prices lower as milk is not moving out of Class III to the higher value Class IV. But the Federal Milk Marketing Law gives Class I dibs to attract milk. So Class I demand is relevant for cheese milk pricing too.

As whole milk sales have increased year-over-year, whole milk became the largest category of fluid milk sales in 2021. It is a bright spot in the fluid milk category.

In 2023, gains in whole milk sales and in lactose-free milk sales are credited with boosting the entire fluid milk category for year-over-year gains in back-to-back months of October and November. This helped flatten the year-to-date loss-curve on total fluid milk sales that had been running 2 to 4% lower year-over-year to be just 1.5% lower cumulatively at year end compared with 2022, according to USDA’s December estimated packaged fluid milk sales report, released in mid-February.

Still, there is ground to make up, as fluid milk sales volume in 2023 is 7.8% lower than pre-Covid 2019, when volume totaled 46.24 billion pounds, down 1.8% from 2018. Then, during pandemic lockdowns, milk sales stabilized, putting the total at 46.2 billion pounds for 2020, virtually unchanged from 2019. In 2021, fluid milk sales volume declined 4.1% to 44.3 billion pounds, followed by a 2.4% decrease in 2022 to 43.3 billion pounds, and now a 1.5% decline in 2023 at 42.6 billion pounds.

NMPF chart, Circana Inc. full-year 2023 data

Meanwhile, the big news reported recently is that plant-based fake-milk beverages saw sales decline by 6.6% in 2023, the second straight year of declines and the smallest sales since 2019, according to data from Circana Inc reported recently. 

Real dairy milk sales volume of 42.6 billion pounds in 2023 is not only a much larger category than the lookalikes at 337.7 million pounds, real dairy milk outperformed lookalikes on a trend basis in 2023 — down just 1.5% vs. plant-based being down 6.6%.

By comparison, plant-based beverage sales volume in 2023 was a fraction of 1% (0.8%) the size of real milk sales volume.

Whole milk education and awareness have helped drive this result. Consumers are paying attention to food science, even if the Dietary Guidelines Advisory Committee, USDA (and FDA on labeling) continue to ignore it. Still, more education and freedom for children to enjoy milk is needed. The concern is that even though it is a smaller percentage loss, the 1.5% sales volume loss in the real milk category in 2023 represented 644 million pounds; whereas a 6.6% sales volume loss in plant-based beverages in 2023 represented 24 million pounds.

Speaking with a local milk bottler and ice cream maker recently – a producer handler – I learned he focuses on how his cows are fed to maintain their rolling average 5% butterfat during the summertime to make ice cream and satisfy consumer demand for whole milk. Their whole milk sales have skyrocketed, and this in turn, to the delight of the grocery store they are in, has helped boost sales of all fluid milk as a category in that store.

This has him thinking of doing a 5% butterfat, non-standardized, maybe even cream top, full-fat milk in glass bottles for the store. The store displays a 97 Milk banner at the entrance and 97milk.com website stickers at the dairy case.

Speaking with a manager at a different grocery store chain with stores in Pennsylvania and surrounding states, I learned their sales of whole milk have also increased by leaps and bounds in the past several years, boosting the entire fluid milk category by 14% at their stores throughout the region. They include the 97milk.com website and information in their sales circulars to their shoppers.

As for the schools — If even half of the schools offered a mix of milkfat choices as the Whole Milk for Healthy Kids Act would allow them to do, the amount of butterfat sold as Class I would increase. This would improve the fat side of the fat/skim pricing in the three Southeast Orders and Arizona. It would also help the Federal Order pool dollars reach after actual components are paid first in Multiple Component Pricing Orders everywhere else.

Total Class I fluid milk sales have dropped like a rock since Congress passed the Healthy Hunger Free Kids Act in 2010, which removed whole and 2% milk options from school meals, followed by USDA in 2012 further banning whole and 2% milk as a la carte or vending machine ‘competing beverage’ options in the Department’s Smart Snacks regulations.

Look at the graph above. It was shared as part of Dr. Mark Stephenson’s testimony in the recent USDA FMMO milk pricing hearing.

Improved total sales of school milk hold potential to increase total Class I fluid milk sales. A Pennsylvania school trial in 2019 showed a 52% increase in milk sales when whole and 2% milk options were offered. Students showed a 3 to 1 preference for whole milk over the 1% milk option.

When their options were expanded, more students chose milk instead of refusing it. Students were able to choose, and some of them continued to choose low-fat, and that’s okay! The Whole Milk for Healthy Kids Act is about choice.

A conservative estimate of a 25% increase in school milk sales can be anticipated if Whole Milk for Healthy Kids gets over the finish line in the Senate after its overwhelming passage in December in the House. That is half of the increase seen in the Pennsylvania school trial. If realized, a 25% increase in school milk sales equates to a little over one billion pounds of additional annual milk sales, which could raise the entire Class I fluid milk category by a little more than 2%.

This is based on the fact that kids aren’t just throwing away milk at school. Some are refusing to take the milk they are offered with school meals. This means sales are being lost.

Fluid milk sales declines will only get worse if USDA implements one of two draft proposals the Department announced a year ago. One would eliminate flavored milk from elementary and middle schools altogether. The other would require added sugar levels to be reduced dramatically in flavored milk at school. It’s widely known that when milkfat is retained in making chocolate milk, less added sugar is needed! 

Demand for whole milk is beneficial on both the milk fat and skim sides of the equation because whole milk sales move the nearly-complete product – the skim with the fat — leaving some of the fat through standardization, but not leaving any skim.

The result of these options in schools could be even better depending on how many schools choose to exercise these options.

If the industry doesn’t supply what consumers demand, sales are lost. Schoolchildren are already the dairy industry’s consumers, and they will hold the purse strings in the future.

Just as the Dietary Guidelines Committee and USDA continue to ignore science on milkfat, we are all ignoring our nation’s schoolchildren and what they are telling us about why they are turning away from nutrient-dense milk at a time when the nutrients milk delivers – that we may think they are receiving — have never been more important.

When the Pennsylvania school trial ended after one school year, a 95% reduction in the average daily volume of discarded milk was recorded. The school Student Council did an environmental project to measure this by measuring the volume of milk thrown away in unopened and partly consumed half-pint containers.

Shouldn’t we be listening to what the young people are telling us? They are our future, after all.

In the next part of this series, we’ll address the question: “What are the processors going to do with all of that skim?” Oh my!

In the meantime, consider this: Fresh fluid milk is the most notably locally-produced dairy product maintaining dairy farm relevance in regions and communities across America. What will the dairy industry look like five years from now, even one year from now? Maybe we should be asking the schoolchildren to answer that question.

As of Feb. 14, 2024, the Whole Milk for Healthy Kids Act, S. 1957, has 15 sponsors from 12 states as illustrated on this map. Graphic by Sherry Bunting

AFBF seeks ‘whisper of hope’ in request for USDA emergency decision on Class I mover

Farm Bureau economist Danny Munch closes FMMO hearing Jan. 30, 2024 with emergency request for USDA to return Class I ‘mover’ formula to ‘higher of’


By Sherry Bunting, Farmshine, Feb. 2, 2024

CARMEL, Ind. – Over 5 months and 500 exhibits have gone by in the nearly 50 hearing days since the long-awaited national hearing on Federal Milk Marketing Order modifications began Aug. 23, 2023. It ended Tuesday, Jan. 30th with a last-minute witness bringing forward American Farm Bureau’s request for an emergency decision by the USDA Secretary to restore the ‘higher of’ method for calculating the skim portion of the Class I ‘mover’ price.

This hearing went on longer than expected, and the implementation of any final decisions from a multitude of proposals in various areas of FMMO milk pricing are at least 12 to 18 months away under ordinary post-hearing processes, hence the AFBF request for emergency decision-making on the Class I mover to go back to the higher of.

“If USDA would implement this on an emergency basis, it helps with the confidence and perception piece of it. So, if there is a whisper of hope, to see that there will be a positive outcome coming soon, an optimistic change that is coming that fuels them. Do they see things getting better? Or are things going to stay the way they are? ” said AFBF economist Danny Munch while being cross-examined after reading into evidence the letter signed by Sam Kieffer, AFBF vice president of public policy.

The letter stressed that FMMO reform is in step 5 of a 12-step process and a long way from a final rule. Meanwhile, the change in the Class I mover formula was intended to be revenue neutral to farmers, but farmers have lost over $1 billion in 56 months of implementation. This does not even include further losses from depooling of manufacturing milk when the Class I fluid milk price has been out of alignment in FMMO revenue-sharing pools.

“The comprehensive process of amending federal orders, though important, means dairy farmers remain stuck with current pricing regulations until USDA publishes a final rule,” Kieffer wrote in the letter Munch read into evidence. “The current Class I mover was a well-intentioned policy misstep that has reduced dairy farmers’ checks, with little relief in sight. Emergency implementation of the ‘higher-of’ Class I mover formula will help buffer against persistent losses associated with mistaken and outdated policies that have left dairy farmers struggling to make ends meet.”

Munch noted that members re-affirmed going back to the ‘higher of’ calculation in policy meetings during the AFBF National Convention last week, and they voted to make it a priority of urgency.

“Dairy farmers are facing closure. A lot of our members are facing the hard decision about whether to sell their cattle or not. That’s a little window into what our members mentioned last week,” said Munch.

The other reality that is setting in is the fact that large losses are mounting quickly again. The Class IV over III divergence is quite wide – ranging $3 to $4.00 per hundredweight – and the futures markets show it could be above the $1.48 per cwt threshold through the end of 2024.

Farmshine’s Market Moos columnist Sherry Bunting has updated the graph showing how the supposedly revenue-neutral change from the ‘higher of’ to an averaging formula for the Class I mover May 2019 through March 2024 will have reduced Class I value in farm milk checks over 59 months of implementation. This graph of cumulative and year-to-year losses does not include additional losses many farmers have incurred when manufacturing class milk is out of alignment with Class I, and is depooled, with the revenue excluded from the FMMO pools and benchmarks.

In fact, the Class I mover prices announced for January and February 2024 could produce well over $80 million in losses in just the first two months of 2024 once the pounds of Class I milk are sold and counted.

Munch also took the opportunity to remind everyone that when AFBF held the dairy stakeholders forum in Kansas City in October 2022, returning the Class I mover calculation to the ‘higher of’ was the main item that got consensus from every table in the room.

When the difference between the manufacturing classes exceeds $1.48 per cwt, then pooled producers receive less money for their milk under the averaging formula compared with the previous ‘higher of’ formula. When the difference between Class III and IV is $3.48, for example, that lowers the Class I price by $1.00 per cwt. In an FMMO with 75% Class I utilization, that’s a 75-cent loss on all of the milk, not just Class I. In an FMMO with 25% Class I utilization, that’s a 25-cent loss on all of the milk.

Even members of Congress have been doing the math and have talked about putting reversion language in the Farm Bill. They are aware of their role in putting what they were told was a “revenue neutral” change into the 2018 Farm Bill that IDFA and NMPF at the time agreed upon, while adding language that USDA could hold a hearing in two years to vet it for the future. 

We are now nearly five years into this change, and it is just one piece of the hearing that just concluded, which included many proposed modifications from milk composition and price surveys, to make allowances and differentials.

Without emergency decision-making by USDA on the Class I mover piece, any potential changes from this hearing are a good 12 to 18 months away, depending on how the post-hearing processes move along, from post-hearing briefs due April 1st to rebuttles, draft decisions, comment periods, referendums, final decisions, and there are proposals that have asked for further delays after the process plays out to avoid “affecting” exchange-traded risk management instruments. 

Dairy farmers are just looking for some relief and transparency for the future, according to Munch. 

Meanwhile, IDFA and Milk Innovation Group (MIG) have opposed returning to the ‘higher of’ and have proposed several averaging methods for the Class I mover that would continually look backward to compare and change adjusters to make up past losses gradually out into the future.

Farmers have testified that this doesn’t help if it takes two to three years to get that money back after they’ve already lost the farm.

What it boils down to on the Class I mover is the industry wants to move toward more fractionation of milk, more aseptic and shelf-stable beverages, and away from fresh fluid milk. These are the products that can sit in a warehouse for 9 months and for which processors testified they do 9-to-12-month pricing contracts largely with foodservice and convenience stores. Fresh fluid milk already has advance pricing that aligns with the turnaround of that product so hedging on the futures markets is not typically done, and averaging is not needed.

When asked whether AFBF has looked at how the spread may continue in the future to make the averaging formula a loser for farmers, he said Class IV will likely persist above Class III, and yes, they expect the spread to remain large.

Earlier testimony by processor witnesses blamed these Class I formula losses on Covid disruptions, food box programs and large government cheese purchases, but as Munch pointed out, the driver of these losses is something else. When Class IV is over III, we don’t see it in a negative PPD, but milk is depooled, and the full extent of the depooling losses are incurred by farmers, they just aren’t easily enumerated.

“In 2020, the losses (in Class I value, alone, without including the impact of depooling) were over $700 million. In December 2023, the losses crossed over $1.05 billion as they have continued to add up,” said Munch. “The financial detriment is not solely due to a ‘black swan’ event. Some of our farmers were waiting to see if it showed markets shifting. Now, years later, this is still an issue.

“That’s another reason why we are asking for an emergency decision on this right now, and why it came up at our meeting at the convention last week,” Munch testified. “It was intended to be revenue neutral, but it has turned out not to be.”

During cross-examination, Munch also confirmed there hasn’t been much trust by producers to believe processors will replace the dollars they are asking to be removed from FMMO pricing by paying over-order premiums, instead.

“There is a lack of trust and not knowing where their price comes from. There has been a lot of concern about how their milk checks are calculated,” Munch related. “That’s one of the proposals that the American Farm Bureau put forward is more uniform, clear milk checks. There is a perception that things in milk checks have been manipulated. There is a perception of mistrust.

“If there are ways we can build back the trust, and if one of those ways that our farmers have targeted is switching back to the ‘higher of,’ then it’s easier for farmers to understand that calculation, and it has shown, in the most current of times, to be more advantageous to them.”

“It is my pleasure at 10:18 a.m. on 2024 January 30 to determine that this Hearing has ended,” said U.S. Administrative Law Judge Jill Clifton after 506 exhibits have been entered into evidence for and against 21 proposals in various areas of FMMO pricing modification during the 49 Hearing days that stretched over 5 months since its start on Aug. 23, 2023 in Carmel, Indiana. Screen captured from Hearing livefeed

-30-

USDA FMMO hearing resumes, Dr. Stephenson testifies for MIG proposal to end $1.60 Class I base differential

USDA’s cross examination reveals possible flaw in simulator model result

By Sherry Bunting, Farmshine, Jan. 19, 2024

CARMEL, Ind. — Shadow pricing, demand elasticity, commoditized loss of prior incentives, balancing cost, give-up cost, base differential, uniform differential, market-clearing price…

These terms ruled the day when the USDA National Hearing on Federal Milk Marketing Order (FMMO) proposals resumed in Carmel, Indiana this week after a more than four-week recess.

The hearing began in late August. It did not conclude by Fri., Jan. 19, so it will again recess until Jan. 29. 

American Farm Bureau estimates that another 270 days of post-hearing processes must follow before a USDA decision could be implemented, and even this is subject to proposals that seek a 15-month delay between decision and implementation due to potential impacts on CME futures-based risk management tools, such as Dairy Revenue Protection (DRP).

This is far from over, and hanging in the balance is the Class I price calculation, now based on an averaging method, under which farmers have lost more than $1.02 billion since May 2019 vs. the previous ‘higher of’.

Testimony Tues., Jan. 16 included Dr. Mark Stephenson, retired UW-Madison dairy economist on behalf of Milk Innovation Group (MIG), made up of ‘innovative’ and branded fluid milk processors, including fairlife, HP Hood, Anderson-Erickson, Danone North America, Shamrock, Organic Valley, Aurora Organic, and Pennsylvania’s own Turner Dairy Farms.

Dr. Stephenson delivered his bombshell for MIG that was based on analysis he did using 2016 data in a simulator model, from which he made “certain discoveries.”

First, Stephenson suggested that fluid milk is shifting to become price-elastic vs. the long-held belief that fluid milk sales are price-inelastic. This was followed up by fluid milk processor representatives showing post-Covid fluid milk sales volumes declined as prices rose.

Stephenson cautioned USDA to refrain from setting regulated prices too high, saying this would reduce returns to producers by reducing total fluid milk sales. 

This suggestion was challenged in cross examination. In fact, AFBF chief economist Dr. Roger Cryan noted the FMMO focus on fluid milk was originally partly predicated on its “public good” as a food staple, almost akin to a “public utility.”

In cross examination on Jan. 17, Stephenson also revealed he was paid by MIG to analyze the $1.60 base differential, and his work began before MIG finalized its proposal to remove the $1.60 per cwt. base differential all the way down to zero for all Class I milk, nationwide.

Currently, the $1.60 base differential is built uniformly into the Class I price for every regulated county across all FMMOs. The varied location differentials are added to the base differential and spread across the revenue-sharing pools.

Stephenson used the U.S. Dairy Sector Simulator Model (USDSS) to develop a map as though a “milk-dictator” could efficiently “move milk to its highest global use” through various constraints. 

In the marginal value map result, Stephenson said the U.S. average value of the differences was minus-38 cents, indicating on a national average, it is more valuable (cost saving) to the model to have milk in a cheese plant than in a fluid plant in most counties. The range goes from somewhat more than $2 per cwt more favorable to a cheese plant (in red) to somewhat more than $2 per cwt more favorable to a fluid plant (in green) in the Southeast. From this “potent revelation,” Dr. Stephenson concludes that, “The model result bolsters the argument to not dilute the value of the $1.60 into the pool if that value represents a balancing cost for fluid and an opportunity cost (give-up) for manufacturing plants. Rather, require the fluid plants to pay the $1.60, but let the fluid plants pay that directly to the farms, cooperatives or manufacturing plants who supply the milk” to the fluid plant.

The map showed the incremental differences in ‘Class I minus Class III “shadow pricing,” across the country.

These marginal value differences, said Stephenson, reflect the opportunity costs of getting manufacturing plants to give up milk to fluid plants in the Central U.S., where milk production exceeds population vs. the cost to balance fluid milk markets in the East, particularly the Southeast, as well as in California and southern Nevada, where population exceeds milk production.

It was the questioning from USDA AMS administrator Erin Taylor on the ‘shadow pricing’ figures in various anchor cities that prompted Stephenson to concede: “You may have caught a major flaw in what I have done here, so I would want to look at this more carefully.”

Yes, he will be back to address such questions when the ever-lengthening hearing resumes on January 29.

Notwithstanding exposure of a possible flaw in the simulator analysis, Stephenson said the ‘market-clearing’ price is the target to aim at, and the system of setting regulated minimum prices “should err on the side of being too-low instead of too-high.”

He said processors will pay premiums in the breach of a ‘too-low’ minimum price, but there are few options for processors to deal with a ‘too-high’ minimum price — other than to opt out of regulation for manufacturing plants (de-pool), but that fluid milk plants have no ability to opt out. They are required to remain regulated by FMMOs.

“Manufacturing is by far the largest use of milk in our dairy industry,” he said, noting that Class I fluid use at 18% of total U.S. milk production (regulated and unregulated). Therefore, he said, manufacturing use should no longer be treated in the FMMO system as “the trailing spouse in the marriage.”

On MIG’s behalf, he introduced a new way of looking at the marginal value between Class III and Class I, and a mechanical change that could be made in how the $1.60 base differential is paid as needed directly to producers, cooperatives and plants that actually supply milk to Class I plants, instead of being paid to the FMMO pools.

The $1.60 became a uniform part of the Class I price in the 1999 Order Reform. About 40 cents of this $1.60 was included to represent the cost of farmers transitioning from Grade B to Grade A. The rest represents ‘give up’ costs from manufacturing to Class I and balancing costs to serve the fluid market.

Stephenson backed up MIG’s assertion that farmers don’t need any of this $1.60 base differential because virtually all milk produced today is now Grade A. During cross examination, NMPF attorneys brought up the cost farmers have to maintain Grade A status. Don’t their costs count here?

Undeterred, Stephenson suggested that these costs are accounted for in the classified pricing since all milk for all uses is Grade A, today. He said that USDA uses ‘minimum pricing’ as a tool so that the regulated price leaves space for voluntary premiums that processors can pay to “incentivize something else.”

“Being chronically above the market-clearing price creates a surplus product, which the market can’t clear,” said Stephenson. “Our dairy markets have always walked on a knife’s edge. Being plus or minus 1% on milk supplies can cause some pretty big swings in prices as the markets do attempt to clear that.”

As for removing the $1.60 uniform price differential either from the price or the pool, Stephenson said it is like “other premiums” that have become “commoditized.” 

He likened it to the rbST premium and milk quality premiums, saying those premiums have also become “commoditized.” 

For example, when farmers were first asked to give up rbST and sign pledges, a premium was offered. Now, that premium is not paid, he said, because the practice of abandoning rbST is now “commoditized.” 

Likewise, said Stephenson: “Milk quality (low SCC) has improved so much that those premiums are not there anymore. They have also become commoditized.”

So, the better dairy farmers get, the more their incentive premiums — and even big chunks of their regulated minimum price — are at risk to be cannibalized by milk buyers because the farmers have now done what they’ve been incentivized to do, so they don’t need to be paid to do it.

MIG also seeks to stop NMPF’s proposal to tweak and raise location differentials across the Class I surface map, putting on the stand some of their members to show how unfair competition arises between independent bottlers and cooperatively owned fluid milk plants in the same region.

For his part, Stephenson noted the concept of pulling the $1.60 base differential out of the pool may discourage non-productive distant pooling.

This week was certainly eye-opening as MIG is all about the processor costs with zero regard for producer costs. They even put an HP Hood representative on the stand who included the $120 million recently announced for expanding the Extended Shelf Life (ESL) plant in Batavia, NY as a “balancing cost,” that somehow justifies giving back the base differential to processors even though processors can pass their costs on to consumers, whereas farmers cannot. 

Under cross examination, Hood’s representative admitted that plant-based beverages are also bottled in those so-called ESL ‘milk balancing’ facilities, along with premium products like Lactaid.

Meanwhile farmers continue to incur costs associated with a whole host of improvements that were at one time incentivized. It appears the processors expect farmers to forgo being paid for those costs simply “because everyone’s doing it” and incentives are no longer needed.

The idea here is to deflate regulated minimum prices as much as possible in search of the elusive and not-well-defined Holy Grail: the market-clearing price. 

Processors want cheaper milk, and they’ve got multiple proposals to accomplish that. They want to deflate the regulated minimum milk price to free up their ability to pay premiums for “something else.”

In fact, in his testimony, Stephenson admitted that as these costs and premiums are “commoditized,” space is freed up to “pay premiums for something else.”

What is the “something else” that processors will pay to incentivize after they potentially succeed in reducing the regulated minimum price in multiple ways through multiple proposals?

Are climate premiums the next thing coming once the milk price is deflated far enough? Will USDA buy what MIG and IDFA are selling?

Stay tuned.

-30-

New Year, New Hope: 2024 will be year of reckoning, Part One

From whole milk in schools to farm bill to climate-warped food transformation, scientists and lawmakers are getting busy, farmers need to get busy too


In the global anti-animal assault, real science must lock horns with political science and defend American farmers — the climate superheroes that form the basis of our national security. Photo by Sherry Bunting

By Sherry Bunting, Farmshine, Jan. 5, 2024

EAST EARL, Pa. – It’s a New Year, and we have new hope on several fronts that are all linked together, in my analysis.

Top 2023 headlines for dairy farmers revolved around dairy markets that underperformed, successes and challenges in the quest to get Whole Milk choice back in schools, a plethora of draft USDA and FDA proposals that dilute real dairy, farm losses and governmental hearings on federal milk pricing, negotiations and extensions for the farm bill, and acceleration of ‘climate-smart’ positives and negatives buckling down for business in an area where political science is trumping real science on the rollercoaster ride ahead.

All of these headlines are inextricably linked. There is a global anti-animal assault underway, but people are wising up to the not-so-hidden agenda that is grounded in climate transitions and food transformation that give more power and control over food to global corporations while diminishing what little power farmers have in Rural America where our national security is at risk.

Real science locks horns with political science

As we head into 2024, a bit of good news is emerging as scientists are mobilizing to defend the nutritional, environmental and social honor of livestock — especially the much-maligned cow.

After an international summit of scientists in October 2022, work has been underway to bring together an international pact.

Dubbed the Dublin Declaration of Scientists, experts around the world have authored and are getting colleagues to sign-on to this document that calls for governments, companies, and NGOs to stop ignoring important scientific arguments when pushing their anti-animal agendas in the name of climate, transformation, and the Global Methane Pledge.

To date, nearly 1200 scientists have signed the Dublin Declaration, aimed foremost at the Irish government’s proposal to slaughter cows to meet methane targets. The Dublin Declaration represents the work of scientists across the globe for a global audience beyond Ireland.

Here in the U.S., we are sitting on the cusp of Scope 3 emissions targets of global milk buyers that have been hastily formulated based on the science of greed, not the science of greenhouse gas emissions. It’s time for the dairy organizations and land grant universities that represent, serve and rely on farmers to drink up on their milk and strengthen their spines.

Farmshine has brought readers the news about what has been happening in Europe, such as in the Netherlands and Ireland, regarding proposed farm seizures and cow slaughter, and the response of farmers there has been to challenge the political establishment.

The U.S. is not far behind. At COP28 recently, American cattle industries were criticized, and even Congressional Ag Leaders are miffed by what they heard. 

Still, some of our dairy organizations brag about being at COP26, 27, 28 and taking part. Even the dairy farmers’ own checkoff program is caught flat-footed. They’ve already caved to the Danone’s, the Nestles, the Unilevers, and such.

In fact, DMI’s yearend review touted its increase in U.S. Dairy Stewardship Commitment adopters to 39 companies representing 75% of the milk supply with membership in the Dairy Sustainability Alliance standing at 200 member companies and organizations. But what are they doing with those relationships to STAND UP ON SCIENCE FOR THE COWS?

The Stewardship Commitment includes DMI’s Net-Zero Initiative, where the cyclical short-lived nature of methane and the role of cattle in the carbon cycle is still not appropriately accounted for and is one of the points made in the Dublin Declaration of Scientists.

In the U.S. dairy industry, the trend on GHG revolves around DMI’s Innovation Center for U.S. Dairy, which placates large multinational corporations in the development of voluntary programs, telling farmers they are in control with their organizations as a sort of gatekeeper. That is, until those programs become mandatorily enforced by those milk buying corporations, while the science on methane and the cow’s role in the carbon cycle as well as U.S. data vs. global data continue to be ignored when they are sitting in the midst of UN Food Transformation Summits, COP26, 27 and 28, and the WEF at Davos.

In fact, during the annual meeting webinar of American Dairy Coalition in December, U.S. House Ag Chairman G.T. Thompson of Pennsylvania was asked his thoughts on some of the statements that came out of COP28 recently criticizing American dairy and livestock consumption.

“My first response was to find it laughable because it really shows you the difference between political science and real science,” he said. “It’s sad when people are so illiterate about the industry that provides food and fiber that they don’t understand how livestock contribute to carbon sequestration.

“We have a real battle,” Thompson said, adding that those putting out such statements criticizing American livestock “don’t even know which end the methane comes from. The world needs more U.S. farmers and less UN if we want a better world. The facts and the science are on our side. Let’s not let the other side control the narrative.”

Bottomline for Thompson is this: “The American farmers are climate heroes sequestering 10% more carbon that we emit. No one does it better anywhere in the world. Let’s be speaking up and speaking out. We can push it back with the facts and the science. I would encourage each of us to do that and become effective just telling that story,”

In the same ADC webinar in December, Trey Forsythe, professional staff for Senate Ag Committee Ranking Member John Boozman of Arkansas agreed.

“The language coming out of COP28, a likely European-led effort, shows what we are up against from people with no background on the role of dairy and livestock. We have to keep beating that drum on the efficiency of U.S. dairy and livestock farms,” he said.

In the same accord, scientists are getting busy, and we all need to get more involved.

In a dynamic white paper released last year, scientists made 10 critical arguments on this topic of livestock greenhouse gas emissions (GHG). Here’s what the scientists behind the Dublin Declaration are saying and why it’s so important for our land grant university scientists to sign on.

“Livestock agriculture creates GHG emissions, which is a serious challenge for future food systems. However, arguing that climate change mitigation requires a radical dietary transition to either veganism or vegetarianism, or the restriction of meat and dairy consumption to very small amounts is overly simplistic and possibly counterproductive,” the scientists wrote in a recent description of the Dublin Declaration.

“Such reasoning overlooks that dietary change has only a modest impact on fossil fuel-intensive lifestyle budgets, that enteric methane is part of a natural carbon cycle and has different global warming kinetics than CO2, that the rewilding of agricultural land would generate its own emissions and that afforestation comes with many limitations, that global data should not be generalized to evaluate local contexts, that there are still ample opportunities to improve livestock efficiency, that livestock not only emit but also sequester carbon, and that foods should be compared based on nutritional value. Such calls for nuance are often ignored by those arguing for a shift to plant-based diets,” they continued, listing these 10 Arguments with scientific explanations for each one.

Here is how the growing number of international scientists, including Dr. Frank Mitloehner of UC-Davis, situate the problem:

Argument 1 – Global data should not be used to evaluate local contexts

Argument 2 – Further mitigation is possible and ongoing

Argument 3 – Only a relatively small gain can be obtained from restricting animal source foods

Argument 4 – Dietary focus distracts from more impactful interventions

Argument 5 – Nutritional quality should not be overlooked when comparing foods

Argument 6 – Co-product benefits of livestock agriculture should be accounted for

Argument 7 – Livestock farming also sequesters carbon, partially offsetting its emissions

Argument 8 – Rewilding comes with its own climate impact

Argument 9 – Large-scale afforestation of grasslands is not a panacea

Argument 10 – Methane should be evaluated differently than CO2  

These arguments take nothing away from the technologies that are being developed to help dairy and livestock producers further reduce emissions and sequester carbon. Technology has a role in amplifying the cow’s position as a solution, not to cure a problem she does not have! And farmers deserve to get credit for what they’ve already achieved.

Farm, food, and national security interdependent

The 2018 Farm Bill was extended for another year at the end of 2023, but the urgency to complete a new one continues as a big priority for House Ag Committee Chairman G.T. Thompson. In the recent ADC annual meeting webinar, he said: “You don’t want us writing farm bill legislation — or any legislation — just listening to voices inside the Beltway in Washington. It would not work out well.”

He thanked and encouraged farmers for being part of the process, saying there’s more to do.

“We’re building this farm bill listening to your voices, the voices of those who produce, those who process, and those who consume — all around the country,” said Thompson, noting nearly 40 states were visited for nearly 80 listening sessions over 2.5 years on the House side.

“This farm bill is about farm security. It’s about food security. And it’s about national security – all three of those are interdependent,” he added.

The extension and funding of the current farm bill for another year — while Congress works on the new one — means programs like Dairy Margin Coverage will continue for 2024, but the enrollment announcement has not yet been made by USDA.

In past years, the enrollment began in October of the previous year and ended at the end of January for that program year. When DMC first replaced the precursor MPP, enrollment was announced late and continued into March of the first program year (2019). At that time, farms could sign up for five years through 2023 or do it annually.

In 2023, DMC paid out a total of $1.27 billion in DMC payments for the first 10 months of the year.

Chairman Thompson noted that effective farm policy is the key, and the extension means no disruptions, he said: “We attached good data for dairy with policy changes, including for DMC, and some positive changes for the nutrition title within the debt ceiling discussion.”

On DMC, the supplemental production history was added in the legislation extending the current farm bill that was signed by the President at the end of November.

“It provides our dairy farmers the certainty that their additional production will be covered moving forward,” Thompson confirmed, adding that they are looking at moving up the tier one cap to be more reflective of the industry.

The farm bill is also being crafted to use no new tax dollars by reworking priorities, looking at the Inflation Reduction Act (IRA) funds, administrative funds and shoring up funds from the Commodity Credit Corporation (CCC) priorities to secure the farm bill baseline for the future.

The $20 billion in IRA funds being thrown about for conservation and environmental programs as well as ‘climate-smart’ grants is already down to $15 billion without spending a dime because of how it is designed to phase down and go away in 2031 and the fact that USDA is believed to not have the authority to keep these funds outside of the farm bill, Thompson explained. Negotiations are considering bringing this into the farm bill baseline so that it is there – and used for farmers – now and in the future.

“(The IRA) is not a victory if agriculture does not get the full benefit of these dollars. We can make that happen in this farm bill,” said Thompson. “Reinvesting the IRA dollars into the farm bill baseline will allow us to perpetually fund conservation in the future.”

Conservation programs are historically oversubscribed and underfunded.

Thompson expects crafting and advancing of the next farm bill to continue in earnest. He hopes to have a chairman’s mark of the bill released by the end of January and have it before the House by the end of February. Much of this timeline depends on House leadership, and the Senate has its own time frame, said Thompson.

He urged dairy farmers to spread the word to their members of Congress that farm security and food security are national security.

He also noted that the nutrition title had some of its toughest elements ironed out during the continuing resolution process in which the farm bill was extended. 

“I’ve managed this in such a way that we’ve accomplished already the hard things in that title,” said Thompson.

Deploying dairy farmers on legislative efforts

“Passage of the Whole Milk for Healthy Kids Act is good for kids good for the dairy industry, and good for the economy. It simply restores the option, the choice, of whole milk and flavored whole milk, and holds harmless our hardworking school cafeteria folks by making sure the milkfat does not count toward the meal recipe limitations,” Thompson reported.

He wanted well over 300 votes for H.R. 1147 in the House to send a strong message to the Senate. On Dec. 13, the House gave him 330 ‘yes’ votes for Whole Milk for Healthy Kids.

“I would like to deploy you now on the Senate. The bill in the Senate (S. 1957) has the same language and it is tri-partisan with Republican Senator Roger Marshall, a medical doctor, Democrat Peter Welch and Independent Angus King as original sponsors,” said Thompson to dairy farmers gathered virtually for the ADC annual meeting webinar.

“There are other co-sponsors as well (12), and from my state of Pennsylvania, Senator John Fetterman is a cosponsor. Our other Senator (Bob Casey, Jr.) has not cosponsored and seems to be in opposition to it,” he said. “We need you to weigh in with your senators that this is about nutrition and health of our kids and the health of our rural communities. You are in a good position to tell the story of what happened in 2010 when fat was taken out of the milk in schools.”

Thompson noted that, “As you are doing that, you are developing relationships that will help us in the farm bill also. On the farm bill, talk about return on investment, the number of jobs and economic activity and taxes from agribusinesses, about the food security and national security and environmental benefits, science, technology and innovation in agriculture,” he said. 

“Less than 1.75% of what we spend nationally is the farm bill. That’s a big return on investment, again, for food security and national security.”

Questioned about the milk labeling bill of Pennsylvania Congressman John Joyce, a doctor, Thompson said it is a strong bill. He confessed his dismay with USDA caving on this question and called FDA “a problem child” on milk labeling. 

“This bill is not self-serving for dairy. This is about consumers having the information to make proper decisions on their nutrition,” he said.

To be continued