Covering Ag since 1981. The faces, places, markets and issues of dairy and livestock production. Hard-hitting topics, market updates and inspirational stories from the notebook of a veteran ag journalist. Contributing reporter for Farmshine since 1987; Editor of former Livestock Reporter 1981-1998; Before that I milked cows. @Agmoos on Twitter, @AgmoosInsight on FB #MilkMarketMoos
EDITORIAL: This time it’s Senators Chuck Schumer of New York and Ben Luján of New Mexicoblocking forward progress in the Senate
By Sherry Bunting, Farmshine, Aug. 15, 2025
EAST EARL, Pa. – Congressman Glenn “GT” Thompson has been busy. He recently held a Pennsylvania Ag Republicans webinar, then hosted his 7th annual Ag Summit in Pleasant Gap on Aug. 11, before heading to Ag Progress Days Aug. 12-14.
At these events, Thompson updated farmers on the farm bill — 80% completed in the One Big Beautiful Bill Act passed in June — and efforts to finish the remaining 20%, dubbed the “skinny” farm bill or “farm bill 2.0.” He reminded participants that SNAP “cuts” are really a return to pre-pandemic levels with measures to ensure states enforce work requirements that are already on the books.
Thompson also addressed his signature legislation: the Whole Milk for Healthy Kids Act. H.R. 649 passed the House Education and Workforce Committee in February and the Senate version (S. 222) cleared the Senate Agriculture Committee in late June, three months after a warm bipartisan reception during an April 1 hearing.
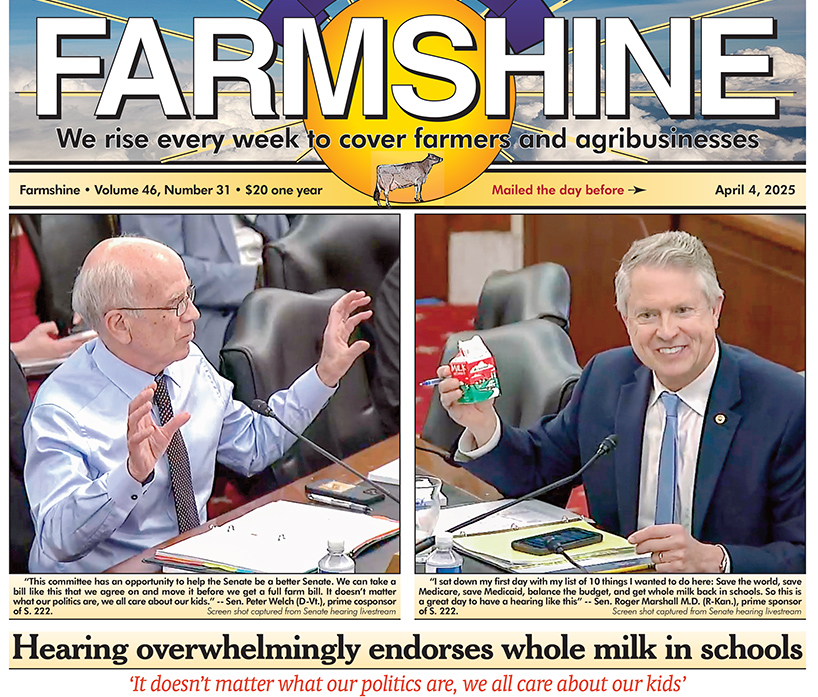
At that hearing, Sen. Peter Welch (D-Vt.) urged colleagues to fast-track the bill to the Senate floor to prove the chamber can act on bipartisan measures.
The Senate version (S. 222) includes an amendment allowing “nutritionally equivalent” milk alternatives in schools — a concession meant to secure the 60 votes needed in the Senate.
Even Senate Majority Leader Chuck Schumer (D-N.Y.) has told New York dairy farmers he’s “not against” the bill. But he’s not helping move it forward either!
Despite these facts, here we sit, with the bill stalled — again — in the Senate.
During a July webinar before the August Congressional recess, GT said the bill was “sitting on Chuck Schumer’s desk.” Senate leaders from both parties would need to agree to “hotline” the measure — sending it directly to the House for a vote without floor objections. The House previously passed the bill 330–99 in December 2023 and must vote again in the current Congress.
Instead, Thompson shared Monday at the Ag Summit that three Senate Democrats are holding the bill hostage, led by Sen. Ben Ray Luján of New Mexico.
Luján reportedly wants to trade his support for expanding universal free school meals, despite praising whole milk in the April hearing and recalling drinking raw whole milk as a child.
My thoughts are this: “Good for you, Sen. Luján! But what about the kids in your state receiving two meals a day, five days a week at school? Where is their whole milk choice?”
S. 222 passed the Senate Ag Committee, where Luján is a member, on a voice vote with no objections. Now, he’s among those blocking its forward progress.
Scott Holcomb, District 1 manager for USJersey, attended Monday’s Summit and noted that the bill “is being stalled by the Senator from New Mexico.” He assured GT that USJersey fully supports the measure, joining a growing list of dairy and nutrition groups with official policy supporting it and taking time to speak out.
In 2019, over 30,000 signatures from every state were also presented to Congress in support of whole milk choice in schools. Surveys show more than 80% of parents prefer whole or 2% milk for their children (both are federally prohibited in schools).
New York dairyman Dale Covert reported to Farmshine that he recently received a letter from Sen. Schumer thanking him for his support of S. 222 and outlining the bill’s history.
Schumer wrote, “I will continue to monitor the progress of this bill and any related legislation that comes before the Senate.”
At the time, the bill was literally on his desk!
The rest of Schumer’s three-page letter listed his legislative record on school meals, SNAP, and WIC, ending with a swipe at the Trump Administration over “cuts to hunger assistance” and vowing to “fight for funding hunger assistance.”
Children from low-income households rely on school meals as their primary source of nutrition — two meals a day, five days a week, most of the year. Others may get to drink whole milk at home, but disadvantaged kids may only get offered the skim milk they get at school, which many discard.
The result? Wasted nutrition, wasted taxpayer dollars. The USDA buys the milk, schools pay for waste removal. Kids do not benefit.
Restoring whole milk choice could improve intake and student health without new spending. But first, it must be made legal, then we get to work on more education for schools and creative solutions.
This issue dates back to 2012, when federal rules quietly removed whole milk from schools, even locking up or changing the contents of FFA vending machines containing whole milk for sale.
Grassroots volunteers have tirelessly pushed for its return ever since this clandestine act of prohibition was discovered.
America’s children are watching, and they are not impressed that D.C. can’t even get simple things done — simple truths that are self-evident!
While Congress is in recess, constituents should press their Senators to act, especially in New York and New Mexico.
Contact Sen. Schumer via schumer.senate.gov or call 202-224-6542, fax 202-228-3027.
Messages should be short, polite, and clear: Support the Whole Milk for Healthy Kids Act so children can choose milk they’ll drink, not waste. Millions of kids are depending on it. If you want to help them so much, then get this done.
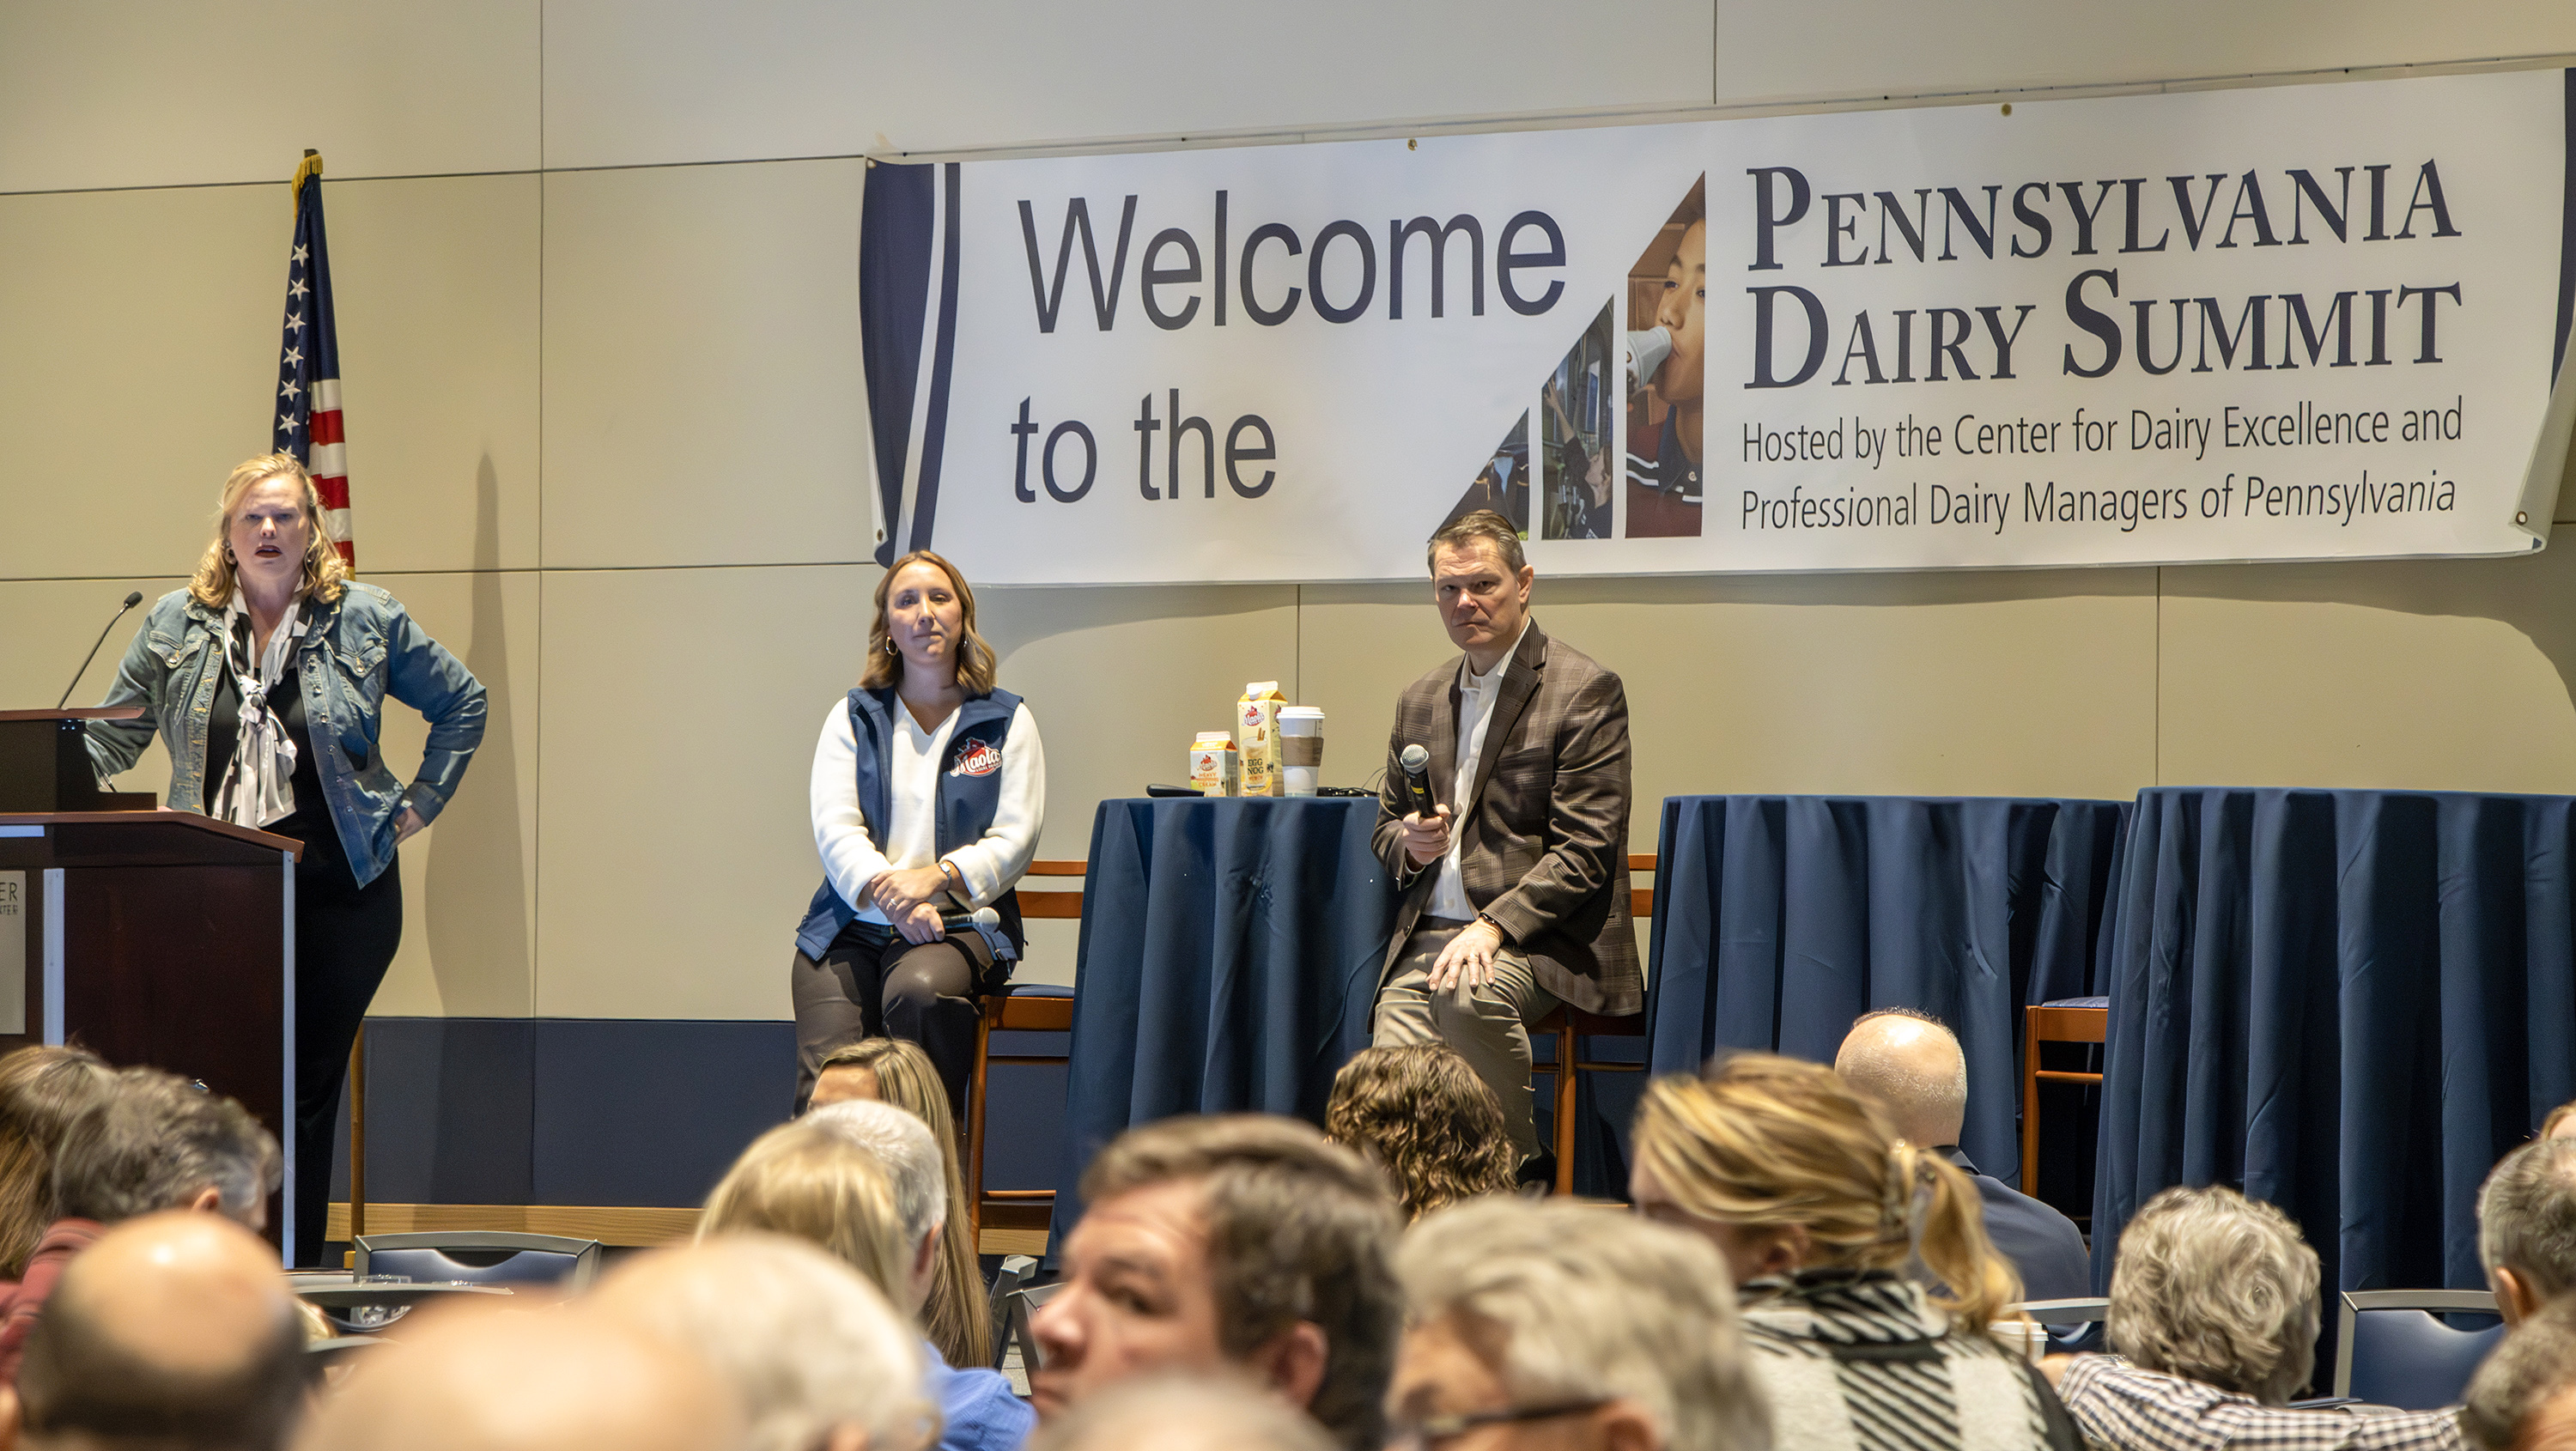
Dairy checkoff: ‘If we focus on whole milk, we miss these market optimizers’ Really? At the 2025 Pennsylvania Dairy Summit, Paul Ziemnisky, DMI’s head of wellness, innovation, and business development, and Rebecca Pfeffer, Maola brand manager, with moderator Amy Mearkle (left) spoke about fluid milk innovation in which extended shelf life (ESL), otherwise known as ultra pasteurized (UP) milk, is seen as the gateway to new products aiming to meet ‘functional needs’ of consumers.
By Sherry Bunting, Farmshine, March, 2025
STATE COLLEGE, Pa. – Food-as-medicine, food-and-medicine, fun-and-portable, young kids talking about pre-aging, on-the-go snack and beverage convenience, the quest for guilt-free ways to unwind with fewer calories than wine, the growing double-income-no-kids (DINK) consumer landscape that is focused on wellness, consumer shifts from coffees to teas, the surge in protein demand, and the growth in sales of lactose-free milk…
These are some emerging trends mentioned during a panel about extended shelf life (ESL) milk as the gateway to dairy checkoff’s Milk Molecules Initiative during the Pennsylvania Dairy Summit last month.
In the Feb. 21st Farmshine, we brought you part one, a panel overview in this three-part series. In this second installment, we dig into what Dairy Management Inc (DMI) is doing with protein in the fluid milk space, and the technologies they are working on to separate molecules.
This public launch of the Milk Molecules Initiative (MMI) comes after 10 to 15 years of work through the pre-competitive industry collaboration vehicle – The Innovation Center for U.S. Dairy, a 501c6 established by DMI in 2008.
What we’ve learned is that MMI — as a fluid milk strategy — began even before the formation of DMI’s Fluid Milk Innovation Task Force seven years ago. It goes all the way back to 2010, right about the time whole milk choice was abolished in schools.
This strategy has been developed to discover, strip out, and repurpose the “functional benefits” of specific bioactive compounds, or molecules, in milk. The concept goes back to the early alliance between Fonterra and DMI, with headquarters less than three miles apart in the suburbs of Chicago around O’Hare Airport.
This strategy has been under development via research grants from USDA, NIH, and the National Dairy Council to the Dairy Research Institutes at four university locations, including the Barile Lab at the University of California-Davis. There, researchers have worked on isolating compounds from both human and bovine milk, and more recently, student researchers have been working on a DMI project “building a digital ecosystem and platform for these milk compounds.”
The Feb. 2022 memorandum of understanding between DMI and Mayo Clinic in Rochester, Minnesota, is tying-in the human health linkages to specific bioactive compounds in milk, and the Feb. 2024 DMI partnership with PIPA, an artificial intelligence (AI) platform, is accelerating the knowledge gain in how to break down milk’s so-called “bioactive family tree” to leverage functional milk products with new health benefits.
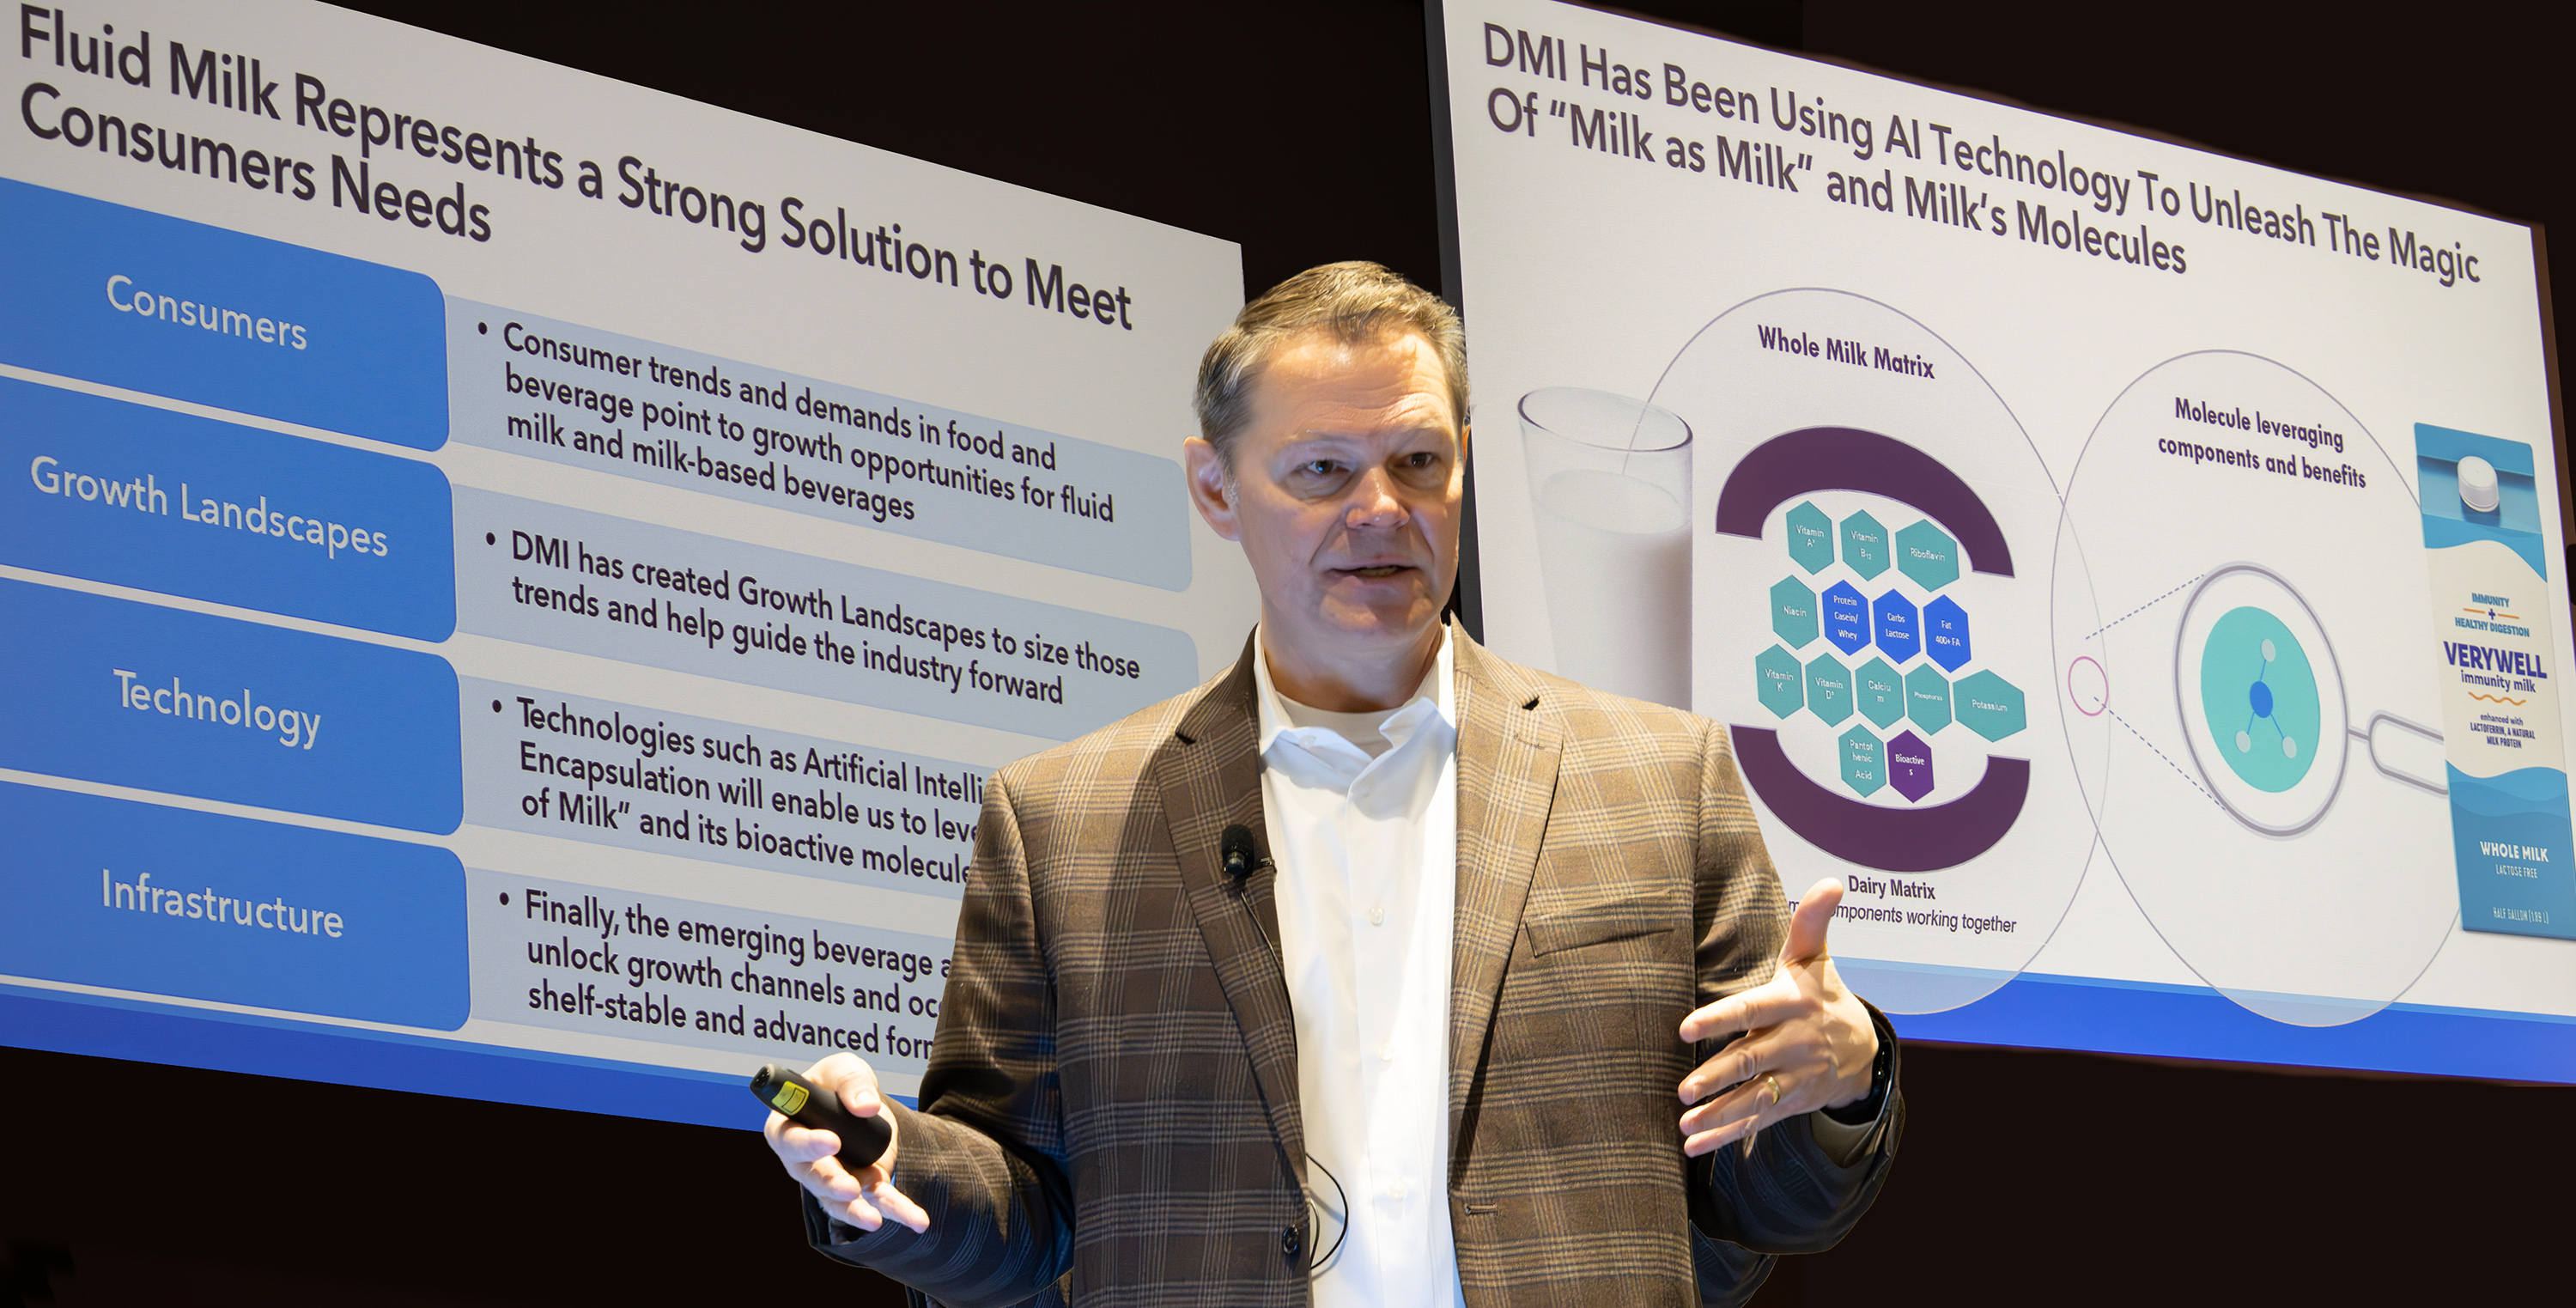
“We are finding the molecules in the whole milk matrix and picking things that are on the ‘whey stream’ as one area of focus, such as stripping out the lactorferrin,’” said Dairy Summit panelist Paul Ziemnisky, head of wellness, innovation and business development for Dairy Management Inc. (DMI), who has spearheaded the work of the Fluid Milk Innovation Task Force.
“We have partners talking about building a lactoferrin plant centered on just one of thousands of molecules in milk. We are looking at how to protect this molecule so it doesn’t lose its bioavailability, so we can put it back into dairy (post-processing),” he said.
Ziemnisky observed how past checkoff messaging has touted things like: “chocolate milk as a recovery beverage.”
Today, he said, “We’re going beyond that. We’re looking at ways to add milk to milk and to use these concepts to give it a different look and to capture huge value potential.”
How does DMI plan to partner with industry to capture this value? By linking milk and technology to create new products.
According to Ziemnisky, the MMI is looking aggressively at encapsulation and separation technologies as well as drying technologies that can be patented while testing the concepts with consumers to “learn how to talk about it.”
“If we focus on whole milk, we miss these market optimizers,” Ziemnisky declared. “Whole milk is for the 17% of traditionalists. We must innovate this category. We’re giving consumers a reason to understand what they need.”
He says MMI and ESL are pathways to get “milk” into more top-demand moments to capture a larger share of the $159 billion total beverage category.
(More ultra processed beverages are just what global consumer packaged goods companies are famous for. But is this what consumers really want? And will the ‘huge value potential’ trickle down to farm milk checks?)
According to Ziemnisky, there is at least $2 billion in new investment coming into the beverage space across geographies. “But it’s not your father’s Oldsmobile. Those new plants are filtration and separation, and we can add functionality to it.
“There are things we know of that we can’t even talk about yet,” he said as he gave a snapshot of where MMI is, and what is yet to come.
He cited a proliferation of ESL milk beverages that are mainly lactose-free, high protein milks as the gateway to molecular separation. Examples included the ESL capabilities at the Maola plant in Philadelphia, the national launch of Milk50 by DFA, the new nutrition line of beverages developed by Dairy Gold, Nestle’s new line made exclusively for Target, and others.
Asked if these new products are taking sales away from non-milk alternatives or traditionally branded milk, Ziemnisky said DMI’s work with MilkPEP shows that the plant-based beverages – on a volume and value basis – are “over-shelved.”
“They haven’t grown their category, their volume is declining. Those guys are eating themselves — going after each other. They’re not going after us anymore because they can’t. We win with nutrition and value. When we see all the innovation that is coming into dairy, we’re taking our space back by meeting the functional needs of the consumer. The quality of the protein is in demand now,” he said, confirming data showing that, “People are coming back to us because of the nutrition and the quality of the protein.”
During questions, he dug into the health and wellness “playbook” that checkoff has created with the help and blessing of USDA and has put into the hands of the top people at all of the big companies in food processing and retailing.
“We’ve traditionally undersold our nutritional benefits, and that’s changing,” he said.
Where MMI comes into the picture is to identify the bioactive molecules for separation and marketing linked to specific health claims that can go on a label.
A graduate student in the audience said the presentation gave her “a lot of hope in the future as a scientist.” She asked if DMI has noticed any difference in regional trends related to consumers, and specifically wondered what is happening in California?
Ziemnisky said California was moving the other direction. “They like to try things out there,” he said, explaining that the dairy industry is so volume- and scale-focused that pilot products are not the norm.
“California is coming back. California has assets that do smaller runs to try things. Last year, California grew (beverage milk sales) at a faster pace, whereas the Northeast market is so heavily regulated,” he said, adding that government regulation puts pressure on local retailers who want to try things.
DMI’s role is to test and learn, he explained: “We help processors prove these markets to retailers. Value-add is 30% of the dollars in the fluid milk category today. We went to 30% from just 10% just 10 years ago. We are targeting both volume and value with our retail and direct sales teams.”
One attendee asked what checkoff can do about the out-of-stock issues at retail, noting that perhaps fluid milk sales would increase if the dairy cases were consistently well-stocked.
“When we ask the store people, they say we don’t do the orders, it all comes from above us,” the questioner said.
Ziemnisky replied: “They are not telling you the truth. The real out of stock rate nationally is 3%. The problem is they are not managing their inventory. The inventory is there, but not the labor.”
“What we run into is the problem is store help,” said John Chrisman of ADANE, jumping into the conversation, noting new laser-system camera technologies are coming within the next five years to issue alerts about what is “flying off the shelves.”
In the meantime, he told attendees to report out-of-stocks to ADANE so they can get it resolved.
Another question asked was how farmers can feed or manage their herds to hit higher levels of functional bioactives like lactoferrin.
Ziemnisky said that’s a question for the milk buyers’ field service personnel, but in general, feeding cattle to hit higher component levels will raise the functional level of milk molecules like lactoferrin.
This reporter asked Ziemnisky what DMI is doing to know if there is any change in the protein structure with the further processed options: “How are we protecting that message on whey protein by protecting its structure through the ultra pasteurization process?”
(The only published research we could find was an NIH study showing heat and mechanical processes of ESL packaging change the structure of the protein, namely the whey protein.)
Ziemnisky replied that DMI is “doing significant work” on the nutrition research side to prove the efficacy of dairy’s high quality protein vs. other proteins.
“And on the product science side, we’re investing significantly in everything from the clarity of protein, so you can put it into other products, to the quality as it goes through different processes that it stays stabilized. We work with the industry on what are the needs we can solve,” he assured.
On follow up questioning about protecting the protein, he added that, “Encapsulation is just one technology we’re doing to preserve the bioactive pull, and we have other things underway as well. We also look at the byproducts. What do we do with lactose coming through on the lactose-free? What do we do with the permeates on the cheese, the passive whey? These are where we’re doing work to create products from the bioplastics all the way to the functional ingredients.”
Bottom line, he said: “Whey was the bastard child, and now it is the largest gaining market share because of demand for high quality proteins. We are seeing the fractionation piece of this, the precision nutrition, the new players coming in and doing research on different compounds, driving whey to where it is today vs. 20 years ago.”
With an estimated 6300 molecules in milk identified by artificial intelligence, all located within the 13% of milk that is the solids, Ziemnisky expressed excitement about the future.
“We are at the cusp of this, and with our artificial intelligence partnerships, we are getting the learnings in 2 to 3 years that used to take 10 years,” he suggested. “This is moving fast toward a sustainable future with zero-waste circular milk plants.”
Paul Ziemnisky reported that DMI has implemented the Milk Molecules Initiative, or MMI, which focuses on the functional benefits in milk and uses their proprietary AI model to accelerate research and development to identify the molecules, create prototypes, and bring to market health and wellness branded value-added dairy beverages, using ESL (extended shelf-life) and shelf stable milk as the base.
By Sherry Bunting, Farmshine, February 2025
STATE COLLEGE, Pa. — Forward-looking presentations from farm to processing and promotion were highlights of the 20th Pennsylvania Dairy Summit attended by over 350 people at the Penn Stater Conference Center Feb. 5-6.
Many questions and much discussion came from the general session panel on the second day, entitled “Emerging Market for Fluid Dairy: Aseptic Milk and Milk Molecule Maximization.”
Sponsored by American Dairy Association Northeast, it was presented by Paul Ziemnisky, the head of wellness, innovation and business development for Dairy Management Inc (DMI), and Rebecca Shaw Pfeffer, brand manager for Maola Local Dairies — positioned as “embracing innovation and pursuing new market opportunities for fluid milk.”
Several attendees expressed how uplifted they were by this presentation. Others had thought-provoking questions that were not entirely answered.
DMI has had a seven-year partnership with the industry through the Fluid Milk Innovation task force’s response to fluid milk demand “that has struggled.” The response has focused on milk molecule separation for value-added growth – all of which starts with extended shelf life (ESL), ultra-pasteurized, aseptic, shelf-stable milk, as the base beverage or gateway to the opportunities.
The bottom-line is dairy checkoff is focused on guiding the industry into new spaces in the beverage category, such as health and wellness. DMI develops concepts and prototypes to help guide industry investments, using its proprietary artificial intelligence (AI) database to “unlock the growth opportunities.”
Ziemnisky reported that DMI has implemented the Milk Molecules Initiative, or MMI, which focuses on the functional benefits in milk and uses an AI platform for dairy research and development.
He said DMI’s AI model has identified 6300 molecules in milk, and the MMI is just getting started on what to target, and how.
“We are seeing growth in ultra-pasteurized and value-added, and we are taking our space back with the molecules and magic of milk,” said Ziemnisky, who oversees DMI’s domestic growth programs, much of it hinging on checkoff-funded health and wellness research, including 41 active projects with Mayo Clinic.
Part of this work is identifying the health and other associations linked to specific molecules, like lactoferrin. “We identify them and size the trends to see how to attack the spaces,” he said.
MMI is the innovation plan to get dairy past the 15% it currently holds of the $159 billion retail beverage category. To that end, Ziemnisky talked about changes in technologies that DMI is working on to “take advantage of the bioactives in milk through separation and put them back in milk or other products, using AI to accelerate our learning, faster.”
He confirmed $10 billion in new processing coming online in the U.S. in the next two years, saying “a lot of this is in the fluid milk space, using filtration and separation for functionality.”
DMI has broken the market into three categories: snacking and entertainment, vital performance, and clinical cuisine. Ziemnisky spent much of his time on the latter as the new and growing ‘food as medicine’ trend.
He talked about DMI partnering with the Calm App to produce a prototype that would add the separated molecule of tryptophan to ESL milk, for a prototype ‘calm’ or ‘sleep’ beverage.
However, Ziemnisky spent much of his time talking about the lactoferrin molecule and the technology to encapsulate and separate it during dairy processing to be added to milk to make “immunity milk” with a Very Well brand prototype.
He talked of Nestle’s new ESL lactose free milk, marketed as high protein, low sugar, called Pioneer Pastures, and available only at Target, as well as DFA’s new Milk 50 beverage as slim and fit.
He talked about how shelf-stable milk is the vehicle to deliver wellness or vitamin claims, like has been done with water drinks.
DMI is also working on bringing MMI into the arena of competing with bone health supplements in the vitamin aisle.
“We’ve baked the cake and are looking for the products to use this technology to steal market share from these areas,” he said.
“We’re looking at the molecules in the whole milk matrix,” he explained, highlighting lactoferrin with 1758 health associations in the scientific literature.
“But you’d have to drink 20 glasses of milk, so we’ll take it out and put it back into one glass of milk and call it ‘immunity milk,’” he said.
In fact, DMI has created a ‘family tree’ of milk’s natural bioactives to then pick channels, to size the growth potential, design prototypes, and look for partners.
According to Ziemnisky, DMI has 46 proposals for women’s health, alone, and there is talk of building lactoferrin processing capacity as this molecule is also being looked at for beauty and skin health.
“But we have to make sure it doesn’t lose its bioavailability in the processing,” he said, referencing the encapsulation technology, similar to what is used to make infant formula, which is needed “to protect the molecule, and put it back into dairy.”
By combining milk with MMI technology, Ziemnisky said a molecule can be targeted, extracted, and then added back into the milk at a higher volume for a wellness claim.
“Now we can marry it out to the big retail beverage growth spaces, where there is $159 billion in consumer spending to show the industry where we (milk) can play,” he said.
“We’re adding milk to milk with some of these concepts, with a different look and a huge value. We are testing concepts with consumers and learning how to talk about it, and patenting our technology for our farmers,” he continued.
“People ask, why not just promote whole milk?” Ziemnisky noted.
His answer? “Only 17% of the market is ‘traditionalist.’ We have to innovate the category and do the research to understand what our consumers need. We’ve been baking the cake, working with the industry, doing the concepts to gain share in the top demand-moments that we only have a 15% share of now. MMI represents a really strong opportunity for us to do that.”
Extended shelf life, ultrapasteurized, and aseptic shelf-stable milk processing is the gateway to this ‘promised land,’ according to Ziemnisky, and DMI is testing proof of concept, working with startups and processors to get geared up to move prototypes from concept to consumer.
“People are realizing the value of milk,” he said. “Our biggest opportunity is making sure there is a good intro marketing plan for retailers to drive the products. If we can win the first six months, we usually can stay on the shelf. That’s our biggest opportunity to make sure they have a plan to drive awareness and trial the products.”
DMI and MilkPEP are working with companies and retailers on this, providing tools and tactics to get the higher-level consumer engagement. This includes developing the sell-story to new buyers.
“Milk is on fire in the category, and we often look at conventional milk, which is 82% controlled by the retailer,” Ziemnisky stated, emphasizing that DMI tells processors that they have to educate the retailers. “Using our analytics, there is a piece of winning even on the conventional milk side in this trajectory. Everything we’ve touched in the industry has grown.”
He showed the value-added products on the market today that were prototyped through checkoff, including high protein, lactose free, and flavored.
“Conventional has held us back because, again, we have to get the retailers using the health and wellness playbook to educate the consumers,” Ziemnisky said, noting that value-added is more than 30% of the fluid milk category dollars and when he started at DMI nearly a decade ago, it was less than 10%. (Note that value-add products are more expensive, so dollar growth does not necessarily correspond to volume growth, and that conventional whole milk is already a large volume of the category that has been consistently growing).
In part two from this discussion, we look at what DMI is doing with protein in the fluid milk space, and our question about what DMI is doing in terms of research to ensure protein structure is protected from impacts of ultra-pasteurization.
By Sherry Bunting, Editorial in Farmshine May 30, 2025
While the landmark MAHA Commission was working on its initial report released May 22 on the chronic childhood disease crisis, Pennsylvania state lawmakers have been assembling a “Healthy PA Package” that includes five bills – H.B. 1130, 1131, 1132, 1133, and 1134 – that would either ban or require specific labeling for foods containing certain artificial dyes and preservatives; provide statutory definitions for terms like “ultra-processed foods,” designate August as Wellness Month, and provide incentives for cover crops based on their use in producing healthier crops using less chemical herbicide…
But there is one state bill that should be part of this Healthy PA Package, and that is S.B. 463, the “Allowing Whole Milk in PA Schools Act,” reintroduced in March by State Senator Michele Brooks, a Republican representing Mercer County. It would simply allow Pennsylvania schools to purchase and serve whole and 2% milk produced within the state instead of being limited to offering only 1% and fat-free milk.
After all, the MAHA Report describes whole milk as “a rich source of calcium, vitamin D and bioactive fatty acids, which support bone health, help regulate inflammation and may reduce the risk of type two diabetes.” And the MAHA Report could reform some key elements of the anti-fat Dietary Guidelines. But it was lawmakers in Washington in 2010 that specifically singled out whole and 2% milk in a passage within the Healthy Hunger Free Kids Act and states are left to bow down to King Vilsack, who drove the school bus on that deal.
In the previous session of the Pennsylvania State Senate, Sen. Brooks’ bill on whole milk had been reported out of the State Senate Ag Committee but never made it to the Senate floor for a vote. In the House, Rep. John Lawrence’s companion bill was passed by the full House last session, but was never approved by the Senate before the legislative session ended in Dec. 2024. At that time, there were murmurings of USDA canceling state school lunch reimbursements or other state funds from mighty USDA after a certain general farming publication mentioned the stance of Vilsack’s USDA in terms of the legality or illegality of such a state measure.
Meanwhile, Tennessee and North Dakota have passed state legislation to pave a path for whole milk in their schools. If more states did this, even if it is tough to implement, it sends a message, and perhaps the leadership log-jam in Washington would break down and run the Whole Milk for Healthy Kids Act and get-it-done already. It appears to have broad bipartisan support, at least that’s what all of the lawmakers seem to want to portray in front of the cameras.
So, here we are in the 2025-26 legislative session at the state and federal levels having to start all over again, covering the same ground, talking the same talk, pointing out the same points that have been discussed, written about and testified to numerous times over the past 10-plus years.
“The (federal) Healthy, Hunger-Free Kids Act of 2010 put restrictive regulations on the consumption of whole milk in schools. In the first two years this legislation was enacted, 1.2 million fewer students drank milk with their lunch, yet still had access to sugary drinks that offer no nutritional value. This not only has terrible health and nutrition impacts on children, but major economic impacts, especially in Pennsylvania,” writes Sen. Brooks in her memo to colleagues seeking cosponsors for reintroduction.
In her memo, she cites testimony from a Senate Majority Policy Committee public hearing in June of 2021, in which the Grassroots Pennsylvania Dairy Advisory Committee volunteers and 97 Milk supporters testified, along with other industry leaders and officials.
She cites dairy’s economic importance to the Commonwealth, and the testimony showing the improved physical and brain health that whole milk’s unique matrix of fatty acids provides, noting “this fat is necessary in the daily diet and energy to support cell growth. Other health benefits of milk include improved bone health, lower blood pressure, and reduced risk of cardiovascular disease and Type 2 diabetes.”
Again, here we are with words upon words but no one’s running the votes upon votes to get it done.
Let’s stop talking and just do it. Lawmakers in Harrisburg and Washington can talk until they are blue in the face about doing something for dairy farmers or doing something to feed hungry children or deliver better childhood health and nutrition. They can come up with all kinds of elaborate schemes to make factions happy or align the stars on the curious realities of milky politics.
My message to folks at both Capitols is simple: We live in the United States of America — land of the free and home of the brave, where our valiant soldiers have fought and died to give and maintain our liberty – yet their children, grandchildren, great-grandchildren, and great-great grandchildren are prohibited from choosing whole milk as an option with school meals they rely on two meals a day, five days a week, three-quarters of the year. Heck, even our soldiers are limited because mess halls have to subscribe to those low-fat dogmas as well.
One of the biggest obstacles for this bill early on was that most Americans laugh in disbelief when you tell them this. Absurd! They say. My kids have milk at their school, they laugh. And the federal government pays for all that milk to go straight into the trash… Oh, tell me more.
Can I be frank? My husband hears me talk on the phone about whole milk in schools and he laughs at the absurdity that I’m still talking and nothing has been accomplished. I am just one of many. As more voters see the absurdity, respect for elected officials wanes. I find it absurd that we are still talking about something that should have been finished long ago already. If we can’t do the simple stuff that has obvious bipartisan support, how in the world are we ever going to do the tough stuff? What’s the hold up? Is it industry? Is it leadership? Is it lip-service? Is it PETA? Is it Vegans? Is it the brainwashing game of the Heart Association as a pawn of Big Food and Big Pharma? What gives?
After 10-plus years, farmers, children, parents, teachers, school boards, and communities that have worked on this issue deserve an answer. Fess up to the real reason it’s still stymied or VOTE for goodness sakes – VOTE in both chambers – now—so these federal and state whole milk bills can get to the President’s and Governor’s desk in time for schools to actually put it in their food plans for the next school year. Time is running out. And the delays are now tiresome.
If these chambers aren’t going to vote, then they better tell us what the real holdup is and start naming names. Some of us have children and grandchildren who are anxiously waiting and hoping. Some of us have cows that are offended to know their nature’s most perfect food can’t be offered to children without being fooled around with. And some owners of those cows need to have hope that the hard work they do to provide high quality whole milk is reflected in what America’s children get to choose at school where they spend most of their time and eat two meals a day, five days a week, three-quarters of the year.
(Excerpts from Sherry Bunting’s Milk Market Moos column in the Apr. 25 and May 2 Farmshine. Get the full Farmshine delivered weekly at a low subscription rate at farmshine.net)
The current dairy trade is ignoring the calendar composition on key reports — adding to bearish sentiment that has forced key dairy commodity prices lower and pushed mailbox milk prices below year ago, despite earlier 2025 forecasts had suggested a raise this year for dairy farmers.
Cheese inventory was down 4% year-on-year (YoY) at the end of March, according to USDA’s April 24 Cold Storage Report. The percentage of the YoY deficits did shrink from January to February and February to March, so some in the trade believe this means stocks are building, and that this trend will worsen as plants ramp up newly commissioned capacity as the year progresses.
But the trade is ignoring the calendar composition. Daily production of cheese actually increased (leap-year-adjusted) during the first quarter of 2025, making this small erosion in the March margin of YoY deficit less worrisome in its reality.
Let’s look at the February Dairy Products Report released on April 3. It stated to the trade that cheese production was lower YoY. But this statistic did not adjust for the extra leap day on the February 2024 calendar. When we adjust the February figures to reflect the extra day of processing last year, we see a much different picture.
The leap-year-adjusted total cheese production for February was UP (not down) 1.3% YoY. American-type cheese production in February was UP 2.2% YoY. And the leap-year-adjusted production of fresh Italian cheeses (made to order) was UP 3% YoY. Despite heavier cheese production, we still had an inventory deficit in February and again in March. We won’t see March cheese production totals until the USDA releases them on May 6.
Bottomline, the leap-year-adjusted numbers show: U.S. manufacturers — in reality — are making more cheese YoY and storing less cheese YoY.
Let’s look at butter. Stocks were up 4% YoY at the end of March. This compares to a 17% overage reported at the end of February, which had one less day to eat it and sell it vs. year ago. Still, the March stockpile was the second largest March inventory in three decades.
But again, let’s review the calendar! The 2025 Easter and Passover holidays were much later than normal this year — occurring past the mid-point of April. How much holiday butter was moved after the March inventory report? We’d wager on this! USDA Dairy Market News mentioned heavy retail featuring of butter and cheese in its weekly reports for weeks ending April 4, 11 and 18. We will reserve judgement on butter sales and inventory until the March production totals are reported on May 6 and end of April inventory figures are released on May 23.
The butter trade, meanwhile, has reacted bearishly to the YoY comparisons without considering calendar composition factors. Today’s wholesale butter pricing on the CME spot market shows U.S. butter can be bought by domestic and international buyers at a substantial 40 to 45% discount compared with the uptrending Global Dairy Trade indexes. Was that severe discount necessary to move it? Or was it speculative and opportunistic?
Meanwhile, farmers will pay the piper (Fig. 1) while processors bemoan the slow response of dairy farmers to what they describe as “a market signal for milk production growth.”
Really? Maybe try checking the batteries on those lights believed to be lit in the Bat Signal. By no means are producers flooding the market with milk, and yet here we are with the 2025 milk price forecast lowered nearly $2 from the January WASDE to the April WASDE.
Meanwhile, processors wonder why dairy farmers are making so many beef crosses instead of dairy heifers, which is keeping a lid on milk growth by large throughput dairies to fill new processing expansions. Dairy farmers began managing their heifer inventories with beef crosses in 2015. Ten years later, American Farm Bureau economists estimate 72% of dairies are doing it as beef semen sales to dairies have jumped from indicating over 111,000 beef-on-dairy calves in 2015 to 3.2 million in 2024.
The real all-cost profit margin on that beef-on-dairy wet calf is larger than the margin on the milk from its dam all year. It’s math.
U.S. dairy trade paradigm shift underway
Several market factors are converging simultaneously: 1) The new tariff uncertainty; 2) The dairy trade’s preparation for new FMMO formula rules on June 1st; 3) Historic foreign investment in U.S. dairy processing growth with sights set on growing international sales as low-cost-producer; and 4) U.S. dairy product prices are at steep discounts below the Global Dairy Trade (GDT).
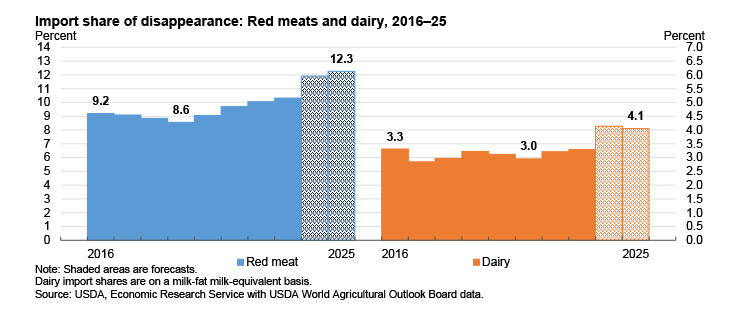
U.S. dairy has gone from running trade deficits on a value and volume basis before 2007 to running significant trade surpluses, especially from 2014 to 2022. In 2023-24, dairy exports flattened alongside growth in dairy imports from 2021 to 2024. On a volume basis, U.S. dairy exports represented 16% of U.S. milk production on a milk solids equivalent (MSE) basis for 2023 and 2024. This is four times the volume of imports, which grew to 4.2% MSE in 2024. Tariffs, a weaker U.S. dollar, and discounted U.S. product prices should lower U.S. dairy imports in 2025.
On the export side, the dairy trade paradigm has shifted to exporting higher-value products like cheese, and doing so as low-cost producer. 2024 saw record volumes of exported cheese (+17%) and butter (+7%). This continued into 2025 with Jan-Feb cheese export volume up 7% YoY, butter up a whopping 236%.
In its Apr. 18 weekly report, USDA Dairy Market News stated: “Demand for butter from international buyers is strong.” No surprise, considering U.S. butter at $2.32/lb is discounted 45% at $1.16/lb below the global butter price index of $3.48/lb (Fig. 3). U.S. cheese is attracting international interest at a nearly 30% discount as U.S. 40-lb block cheddar ($1.76/lb) undersells the global index ($2.32/lb) by 55 cents per pound (Fig. 2).
Meanwhile, the GDT index on whole milk powder (WMP) was higher for the past few sessions and the global pulse market in between pegged WMP at its highest price level in three years.
These global market trends would normally boost U.S. dairy markets. Not so today. The undercurrent of drilling down the price to be low-cost-producer of high-value overseas sales categories began last summer and has been exacerbated in Q1 2025 by the threat of retaliatory tariffs. At these discounts, plenty of U.S. product can move offshore, tariff or no tariff. If the market suppression has been in vain, meaning no retaliatory tariffs from trading partners for cheese, and in relation to domestic retail prices that may or may not come down — someone stands to make a lot of money, and it won’t be the farmers.
March & Feb. milk production up 0.9%
USDA’s March Milk Production Report on Apr. 22 tallied 19.8 bil. lbs, up 0.9% year-on-year (YoY). Feb. was revised higher, up 0.9% also (leap-year-adjusted). Milk output per cow grew by 0.3% YoY in March, and U.S. dairy farms milked 57,000 more cows YoY.
No. 3 Texas added 45,000 head, with milk up 9.4% YoY. For the first time in 4 years of major losses in production and cow numbers, neighboring New Mexico reported 2000 more cows making 1.5% more milk. South Dakota added 9000 cows and 5.1% more milk. No. 4 Idaho milked 29,000 more cows making 4.3% more milk. Kansas added 8000 cows with 4.4% more milk. No. 1 California continued lagging, down 2.1% as bird flu continues, though it is diminishing. No. 2 Wisconsin was up 0.1%, with 5,000 fewer cows. In the Mideast, 2000 more cows were milked, collectively, with Michigan’s milk up 1.3%, while Indiana and Ohio both gained 0.8%.
In the East, No. 4 New York increased production 1.3% with no added cows. No. 8 Pennsylvania as well as Virginia had milk production equal to a year ago, and both milked 1000 fewer cows. Vermont’s output grew 0.5% with 2000 fewer cows. Georgia grew by 4.1%, without adding cows. Florida declined 3.6% with 5000 fewer cows.
Even with two consistent back-to-back gains just shy of 1% in U.S. milk production, growth is still around half the annualized average growth curve that the U.S. dairy industry was on pre-Covid. Milk production growth, post-Covid — whether by cow numbers, output per cow or even the big jump in component levels — still lags the overall pre-Covid growth curve of 1.8% per year.
This was explored recently in a Milk Production webinar by National Milk Producers Federation in conjunction with Dairy Management Inc and McCully Consulting. They looked at the future for milk growth to support capital investments in processing.
Noted was the fact that planned growth in dairy processing tends to locate where milk growth is concentrated. From 2015 through 2024, milk production grew 8% nationwide, but was mostly concentrated in the Southwest, Idaho, and the Upper Midwest (including Michigan, Ohio, Indiana). Of course, Texas was tops, up 65% over the past decade. South Dakota was up 110% but represents less new volume than the Texas gain.
Webinar leaders circled western New York as a subset growth area, pushing the No. 4 state up 14% over the decade, whereas pretty much of the rest of the eastern seaboard was down, including Pennsylvania off by 9% since 2015. Georgia gained 20% trading off for its neighbor Florida, down 21%.
Questions come to mind in these Eastern numbers:
What role did the base programs play? They were installed by most co-ops and some processors and tended to focus on subduing (or even reducing!) production growth on the coasts vs. the interior. They were prevalent over the past decade, until fairly recently.
Industry leaders in the milk production webinar insist the market is signaling for more milk, but producer response has been slow. They said 1 to 2% milk solids equiv. growth via components has helped some, but not enough.
How strong is that market signal for more milk, when dairies are diversifying or exiting? Input costs and milk check deductions have increased over the past decade. The DMC milk-over-feed margin does not tell the whole story. Dairy farmers don’t get a “make allowance” for rising energy, labor, and insurance costs.
Will the5 to 7 cents/lb increase in make (take) allowances, effective June 1st, dampen what processors describe as their ‘market signal for milk growth’? With the 2025 milk price and DMC margin forecasts already sliding lower, a 5-cents/lb increase in the “make” (take) for cheese translates to about 50 cents off a hundredweight of Class III milk, the nearly 7 cents/lb ‘make’ on dry whey and the interplay of butterfat impacts bump the total Class III ‘take’ to almost $1.00/cwt.
Does THAT signal scream: “More milk please?!” Maybe, if milk check bonuses return and deductions disappear.
(Even if processors bring back milk check bonuses and reduce or erase milk check deductions once they receive the higher take-allowances, how will those milk check adjustments be targeted in terms of dairy farm location, size, type, and/or incorporation of certain ‘sustainability’ technology. We’ll see.)
WASHINGTON, D.C. – We need to be the change-makers that our students and farmers both need. We need to bring back the ability to offer milk fat choice in schools, including nutrient dense whole milk – which, by the way, is just 3.25 to 3.5% fat,” said Krista Byler, a witnesses during the hearing by the U.S. Senate Committee on Agriculture, Forestry, and Nutrition to “review the Whole Milk for Healthy Kids Act, S. 222, and improve children’s health.”
April 1st, the day of the hearing, was a great day for America’s children and dairy farmers, and that’s no April Fools joke!
The livestreamed hearing opened with a reminder from Senate Ag Chairman John Boozman (R-Ark.) that the whole milk bill had passed the House in the last Congress “by an impressive 330 to 99 vote” and his desire to “make progress in the Senate.”
Ranking Member Amy Klobuchar (D-Minn.) expressed her support for the bill and thanked Sen. Roger Marshall (R-Kan.) for introducing it. She also set the stage to broaden the hearing to other school nutrition matters. (To be covered in a separate article at another time).
The hearing ended with universal expressions of bipartisan support, thanking the Senate’s ‘milkman’ Marshall. Several Senators urged moving the bill forward as a standalone without delay.
“If we can do something that’s good, let’s do it, and then we’ll do the next thing that’s good,” said Senator Peter Welch (D-Vt.), the bill’s prime cosponsor, addressing the Chair. “This committee has an opportunity to help the Senate be a better Senate, we can take a bill like this that we agree on and move it before we get a full farm bill. It doesn’t matter what our politics are, we all care about our kids. I hope as we pursue this whole milk opportunity for our kids and our farmers that it’s the beginning of a real commitment to nutritious, locally produced, natural foods.”
In between the open and close, the Senate Ag Committee heard from and questioned five witnesses, spending the first chunk of time with Dr. Eve Stoody, Director of the Nutrition Guidance and Analysis Division at the Center for Nutrition Policy, within the Food Nutrition Service of the USDA.
She is tasked with supporting the development of the Dietary Guidelines (DGA) since the 2010 edition and is the self-described career subject matter expert on the DGA process.
She revealed that 90% of Americans don’t consume the daily recommended amount of dairy, a statistic that has worsened over time, setting the stage for nutrient shortfalls.
“Across the board… whatever the form is, we need to have greater consumption of dairy,” she said, citing national survey data showing that on any given day, the percentage of adolescents reporting drinking milk was 75% in the 1970s, just under 50% in the early 2000s, and about 35% in the most recent data.
Chairman Boozman asked what justification was used to remove whole and 2% milk from schools in 2010?
Instead of addressing that question, specifically, Dr. Stoody said the current Dietary Guidelines recommend “most” dairy be low-fat or fat-free, but the guidelines (10 years later) in 2020 were constructed as overall dietary patterns with more flexibility.
“It’s also a reality that we kind of have a number of calories that individuals should consume, so across the guidelines we recommend consuming foods from all of those different food groups and that most should have little to no added sugars or saturated fat to help us stay within those calorie limits,” she said. “We don’t have a lot of room in the calories of the diet to consume milk and dairy with higher fat.”
Stoody parsed this as a population-level guideline: “That doesn’t mean whole milk and higher fat dairy can’t be part of a healthy diet, but it’s really important to look at the overall diet. The DGAs are there to provide flexibility based on needs and preferences.”
(This confusing ambiguity opened the door for the next panel to walk through, even though only two of the remaining four witnesses talked about the whole milk bill, while the other two talked exclusively about USDA’s recent cuts to programs like the local farm-to-school cooperative grants and concern about changes to how school lunch eligibility. Even those witnesses agreed that simplifying regulations and providing flexibility allows schools to focus on the quality of the meals instead of being bogged down by red tape.)
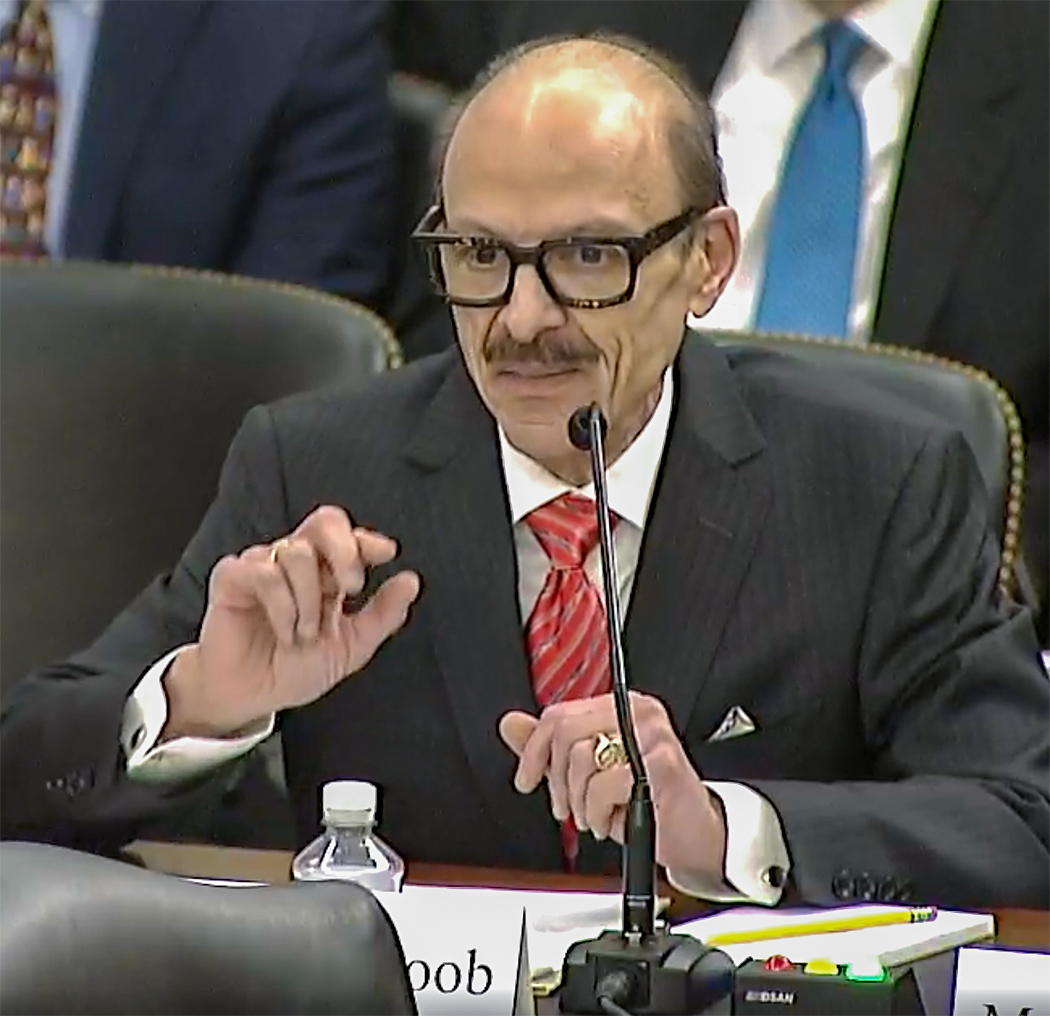
“I’m here because this issue matters to the children I serve, so it matters to me,” said witness Dr. Keith Ayoob, Associate Professor of Pediatric Nutrition at the Albert Einstein College of Medicine in New York City. He runs a diagnostic and treatment clinic working with mostly low-income children, and their families, in the Bronx.
“A plethora of research demonstrates consumption of cow’s milk provides children with better bone health, a lower risk of type II diabetes, and a lower risk for cardiovascular disease,” he shared, as he zeroed-in on milk’s 13 essential nutrients, including 3 of the 4 under consumed nutrients calcium, potassium and Vitamin D.
He said saturated fat does not occur in foods in isolation, and new research shows the protein-fat matrix “behaves differently” in the body. “While other foods that are lower in saturated fat can also lower cardiometabolic risk, they can’t deliver the 13 essential nutrients in milk. Milk delivers a package I’ve not been able to find in any other food or beverage.”
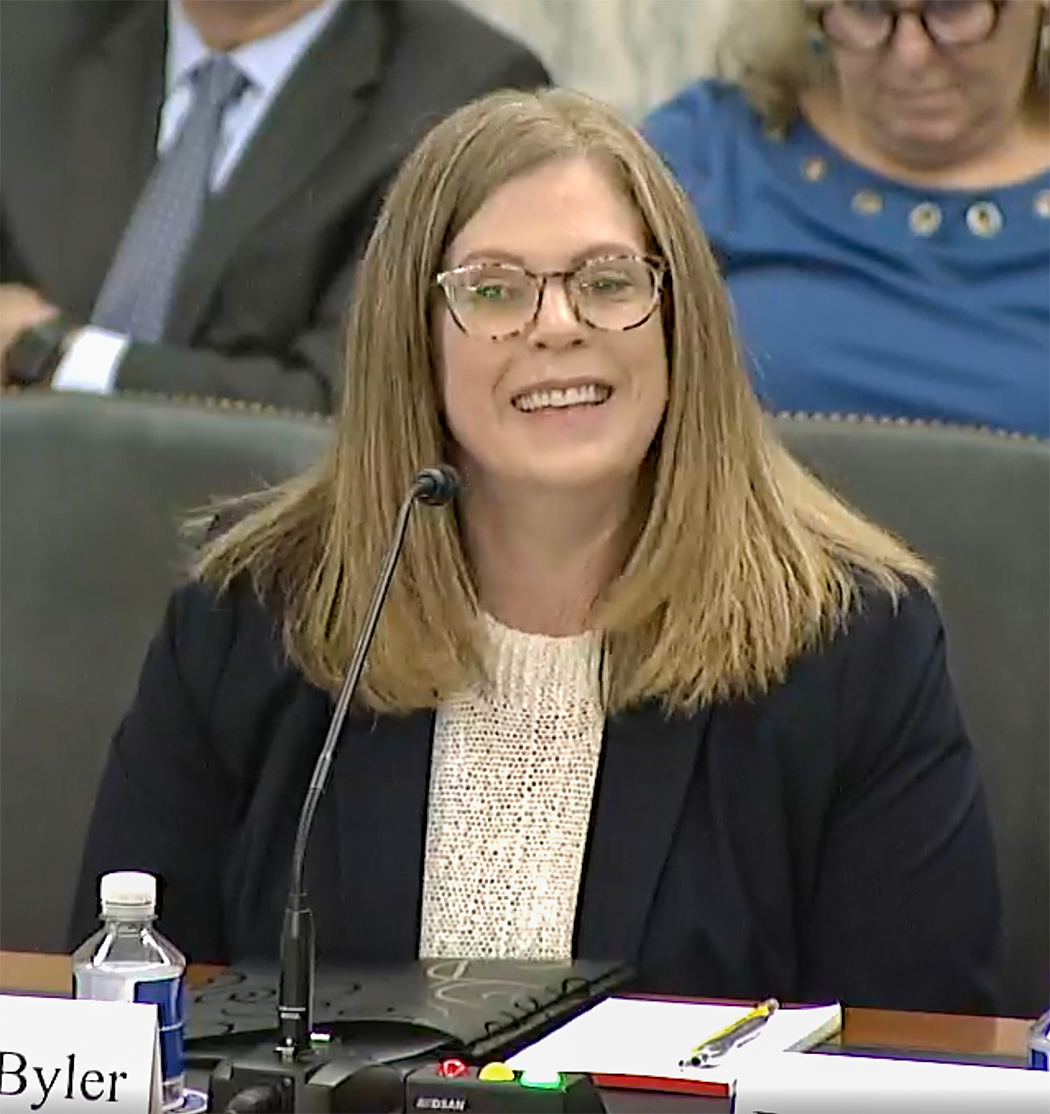
Krista Byler of Spartansburg, Pennsylvania testified next. She is the Foodservice Director and District Chef for the past 20 years at Union City Area School District, or as she puts it: “The professional chef turned lunch lady.”
The granddaughter and wife of former dairy farmers, she was the one witness to bring a combined experience in dairy farming, culinary arts, and childhood nutrition, saying she believes “access to good quality nutrient dense whole food is a basic right of education.”
Byler spoke from the heart, bringing experience and data. She described the impact of the 2010 Childhood Nutrition Reauthorization’s school milk changes on students and dairy farm families.
“It was heartbreaking… we were seeing a huge increase in waste and a huge decline in the amount of milk that I was actually ordering because our children were not choosing to take the milk,” she said.
In 2018, Byler attended an event with the School Nutrition Association where she met Rep. Glenn ‘GT’ Thompson (R-Pa.) – the decade-long champion for The Whole Milk for Healthy Kids Act.
At that meeting, Byler said she heard her peers also talking about the large amounts of waste. She was later introduced to the Grassroots Pennsylvania Dairy Advisory Committee of dairy farmers and school-involved parents, affiliated with what later became the separate milk education nonprofit 97 Milk.
(The Grassroots PA Dairy Advisory Committee is chaired by Bernie Morrissey, with current participants that include dairy farmers Nelson Troutman of Berks County (the Milk Baleboard painter), along with Dale Hoffman and Tricia Adams of Potter County, certified RN school nurse Christine Ebersole of Blair County, Dr. Ed Silverman, a retired internal medicine physician, Mike Sensenig of Sensenig’s Feed Mill, and this reporter who helps in communication. Like the separate board comprising 97 Milk, all the work is done by volunteers without compensation.)
This grassroots committee invited Byler to do some data collection. She explained that in the 2019-20 school year, with the blessing of her school board of directors, they conducted a school milk choice trial at the middle and high school, offering all levels of milkfat, both flavored and unflavored.
“The results are astounding.” Byler said, referencing her written testimony to find more complete data and survey results.
“What I want to really drive home are two main data points: The 50% increase in milk consumption (evidenced by ordering more milk) and the 95% — that’s right – the 95% reduction in milk waste, just because we offered a variety of milk choices that fit our students’ needs,” she said to the visibly astonished Senators who had previously unsuccessfully asked the first witness from USDA for such data.
“That’s incredible. It’s amazing when we give a little education and we give the choices, eventually the consumer makes the right choice,” said Sen. Marshall who is a medical doctor and prime sponsor of the bill in the Senate. He described his frustration in seeing the impact of osteoporosis and osteopenia, when bone density has not been built in the first 26 to 28 years of life.
Byler explained that the school student council helped collect, measure, and document the waste, and they “took a little heat after the 2020 school year when we (ended the trial) and went back to not being able to offer the variety. Overwhelmingly, students said they want something that is satisfying. Athletes, especially, were very vocal about wanting something that sticks with them. It’s a perfect recovery drink.”
Dr. Ayoob agreed: “My kids in my clinic have said that they find skim milk ‘watery.’ They may take that carton of milk. The school will get reimbursed. But I’m concerned that they drain that carton, not just take a few sips. Not only is there less food waste but more nutrition goes into the children.”
Sen. Ben Ray Lujan (D-Calif.) reminisced that he didn’t grow up with much money in the bank, but was blessed to have a dairy down the street. “Today when I get a carton of milk at the store, my habit is still to shake it because growing up that cream rose to the top, and we knew we had to shake it if we were going to enjoy it.”
“Our kids want to do better. They want to eat better. We have their attention,” said Sen. Jim Justice (R-W.V.), who spent his days with students as a longtime coach. “We have an opportunity here to step up. I am absolutely, wholeheartedly in favor of moving forward with whole milk.”
Every Senator present and asking questions expressed or implied support from both sides of the aisle.
With a nod to “the milkman Sen. Marshall,” Sen. Dick Durbin (D-Ill.) said he had to read through the list he had been provided of the organizations that are opposed to the bill, including the American Heart Association, American Academy of Pediatrics, and American Academy of Nutrition and Dietetics. He then asked the USDA representative what health organizations are for it? Dr. Stoody said she didn’t have that information.
(Perhaps more to the point, were her continued circular answers that forced this realization: The “population-level guidelines” get drilled down to individuals in governmental feeding environments, which then feed into the health and nutrition organizations and back again. Meanwhile, individual health and nutrition practitioners are out there seeing real people as individuals every day, wondering how to get off the spinning merry-go-round.)
Chairman Boozman asked Dr. Ayoob how policymakers have gotten it so wrong in drawing a correlation between whole milk and obesity?
“Actually, the correlation is inverse,” Dr. Ayoob declared. “A review of the studies in my written testimony show that greater consumption of dairy foods, including whole fat milk, has been associated with less obesity and less cardiometabolic risk.”
He said in 2010 when whole and 2% milk were first removed from school meals, obesity prevalence was about 17%. Since that removal, it has increased. “It’s now 21%, and it’s higher, about 25%, in black and Hispanic children, the population that I work with.”
Ranking Member Klobuchar came back to calcium, asking Dr. Ayoob to explain why it’s so important at this stage.
“We don’t have our whole lives to build our bone bank. We have the first 25-ish years,” he replied. “If they skip milk in school, that might seem like it’s no big deal for a day, maybe even for a week. But if they forgo a glass of milk every day they are in school for 12 years, we’re going to graduate kids with a diploma and not very good bones. We owe our kids better than that. Osteoporosis and osteopenia are really pediatric diseases with adult consequences.”
Sen. Marshall drove this point home in his questions for all witnesses. He talked about the milk fat as carrying key vitamins and facilitating absorption. He and Dr. Ayoob talked back and forth about how replacement beverages, like soda, take the missed opportunity with milk and add further negative impacts.
“No matter what type of milk is offered in school, none of it is nutritious until students drink it, and they don’t drink it often enough, which presents nutrition and dietary gaps, especially in low-income groups, where 77% of a child’s opportunity for milk intake is from school meals,” said Dr. Ayoob.
“Chef Byler, what’s your advice to us as we look at bringing whole milk back to schools?” asked Sen. Marshall.
“It’s been said very well by others today, that we can do better,” she replied. “If we just bring back the milk choice to schools, we would see a huge increase in consumption, a huge decrease in waste, and satisfaction for our students would be through the roof.”
By Sherry Bunting, Farmshine, Feb. 21, 2025 (with updates after print publication)
WASHINGTON – Upon reading the Feb. 14 news release about USDA’s 78 terminated contracts totaling $132 million, as identified in the ongoing review by the Department of Government Efficiency (DOGE), we noticed only 10 examples were given, totaling only $4.21 million. Reports had surfaced about Conservation Districts receiving project or program termination notices via email, and a few farmers communicated their concern about frozen funding for grant reimbursements.
So, we looked into it.
One email notice that Farmshinewas able to view, dated Feb. 14, for a project in a Colorado Conservation District, stated the reason in the subject line: “The project no longer effectuates agency priorities regarding diversity, equity, and inclusion programs and activities.”
However, the notice also clearly stated that final payments would be made on work already conducted for the terminated project — as long as the final reports and final payment requests are submitted within 120 calendar days of the notice.
We emailed the USDA press office on Feb. 18, as follows:
“A few farmers have communicated about canceled contracts or frozen funds related to conservation projects, some in which projects were started or planned, and these farmers were expecting reimbursement through grants. The news release about the $132 million in canceled contracts lists 10 things as examples outside of the core mission of USDA, but these examples only total $4.21 million, not $132 million. Where can we find a list of the balance?”
The press office turned our request over to the Freedom of Information Act (FOIA) officer at the USDA Farm Production and Conservation Business Center, who promptly responded by email on the very same day, Feb. 18, directing us to a government information specialist who could help us file an official FOIA request.
The specialist answered our call on the first try that same day (Feb. 18). Our official FOIA request was modified to seek a listing of the 78 terminated contracts referenced in the USDA press release. This experience runs contrary to what some in the mainstream media have reported about FOIA officers being “gone.”
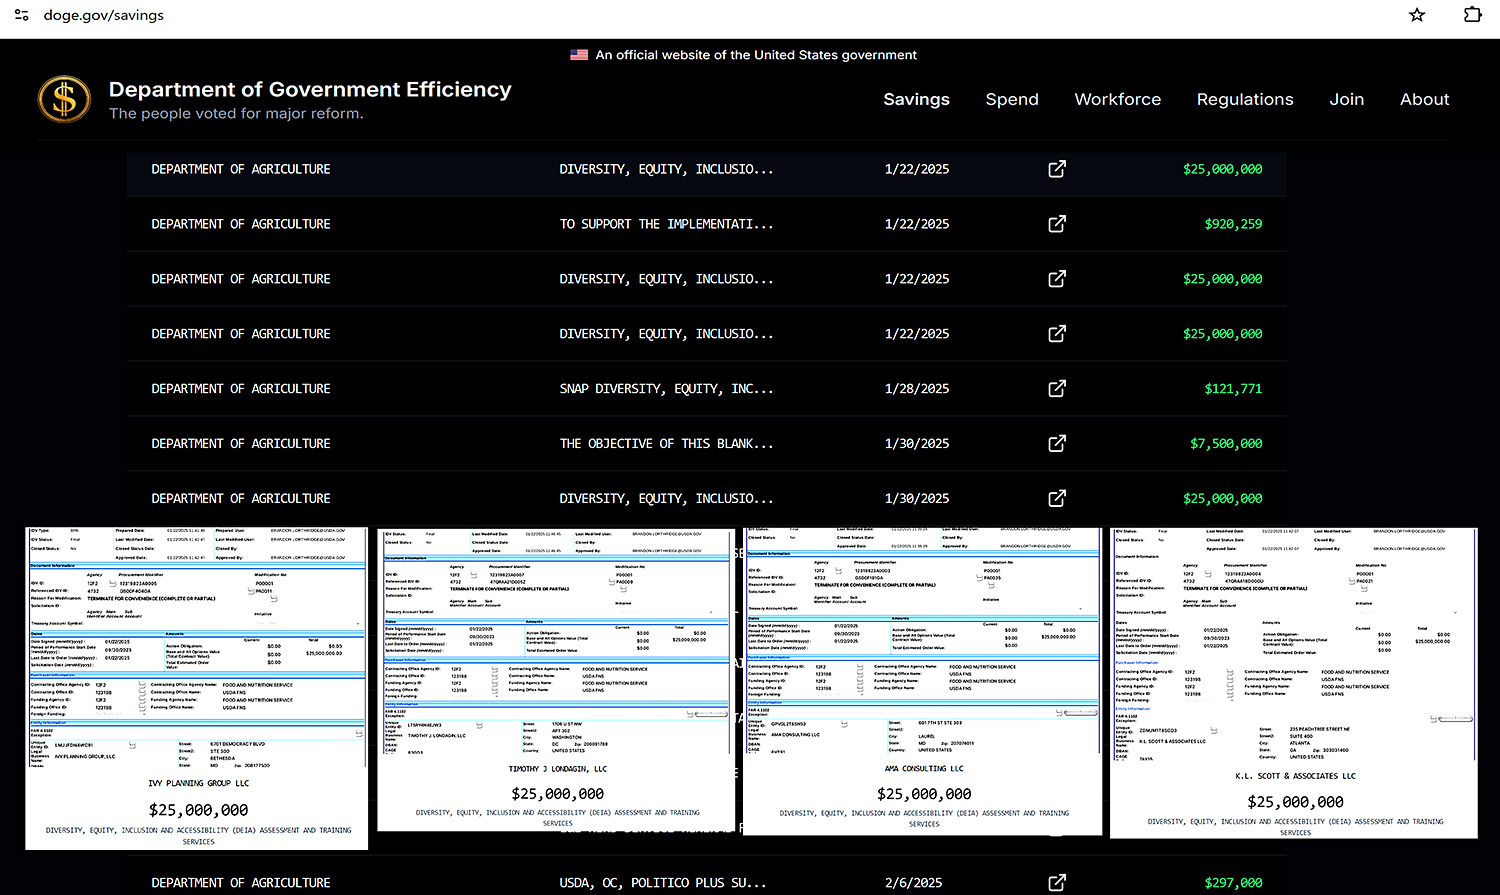
In fact, we received a follow up email the next morning (Feb. 19) with additional information and a link to https://doge.gov/savings, where all terminated contracts throughout all federal agencies will be updated twice a week. USDA ranks 5th in the top 10 federal agencies in amount of savings as of Feb. 18.
A look at the listing shows zero terminations of any on-farm conservation project contracts.
Furthermore, $100 million of the $132 million is accounted for in the four separate $25 million contracts with four separate consulting companies, mostly located in the Capitol region, for “Diversity, Equity, Inclusion and Accessibility (DEIA) Assessment and Training Services” within the USDA’s Food and Nutrition Service, or FNS.
(Just think how much of the currently banned whole milk — which former Ag Sec. Vilsack said schools cannot afford anyway — could be purchased for the FNS-controlled National School Lunch Program with such savings!)
Also terminated was a contract with a Vermont consulting firm for “Environmental Compliance Services for the implementation of Partnership for Climate-Smart Commodities.” Even though this $8.2 million award had already been paid, the termination prevents additional orders.
While the government information specialist cannot answer abstract questions, she did indicate that conservation projects through EQIP and NRCS — that are attributed to the farm bill — are not included in the contract terminations. However, Climate Smart projects under the Inflation Reduction Act (IRA) were included in the funding that was ‘on hold’ for review.
Then USDA announced in a Feb. 20 press release that, “Secretary Rollins will honor contracts that were already made directly to farmers. Specifically, USDA is releasing approximately $20 million in contracts for the Environmental Quality Incentive Program, the Conservation Stewardship Program, and the Agricultural Conservation Easement Program.”
This is the first tranche released from the ‘pause’ as USDA continues to review IRA funding “to ensure that we honor our sacred obligation to American taxpayers—and to ensure that programs are focused on supporting farmers and ranchers, not DEIA programs or far-left climate programs,” the press release stated.
We also learned from other sources that commodity checkoff programs are part of the broader DOGE review of all USDA activities for the purpose of evaluating, and potentially reforming both spending and policy in agriculture.
The dairy promotion and research program, funded by the 15 cents per cwt checkoff, is one of 22 such mandatory commodity programs overseen by USDA AMS. According to repeated statements by dairy checkoff leaders over the past five years, this oversight involves USDA AMS reviewing all checkoff-funded activities, including for USDA staff attending all DMI meetings “even conference calls.”
This oversight comes at a cost. Of the 2022 and 2023 financial statements available for Dairy Management Inc (DMI), National Dairy Promotion and Research Board (NDB) and the consolidated United Dairy Industry Association (UDIA) and National Dairy Council (NDC), only the NDB listed USDA Oversight as a line item under its operating costs, totaling just under $1 million annually, along with a collections and compliance line item totaling just over $500,000.
How might the DOGE algorithms decipher these costs and engagements, given both USDA and DMI have contracted with NGOs like World Wildlife Fund (WWF)?
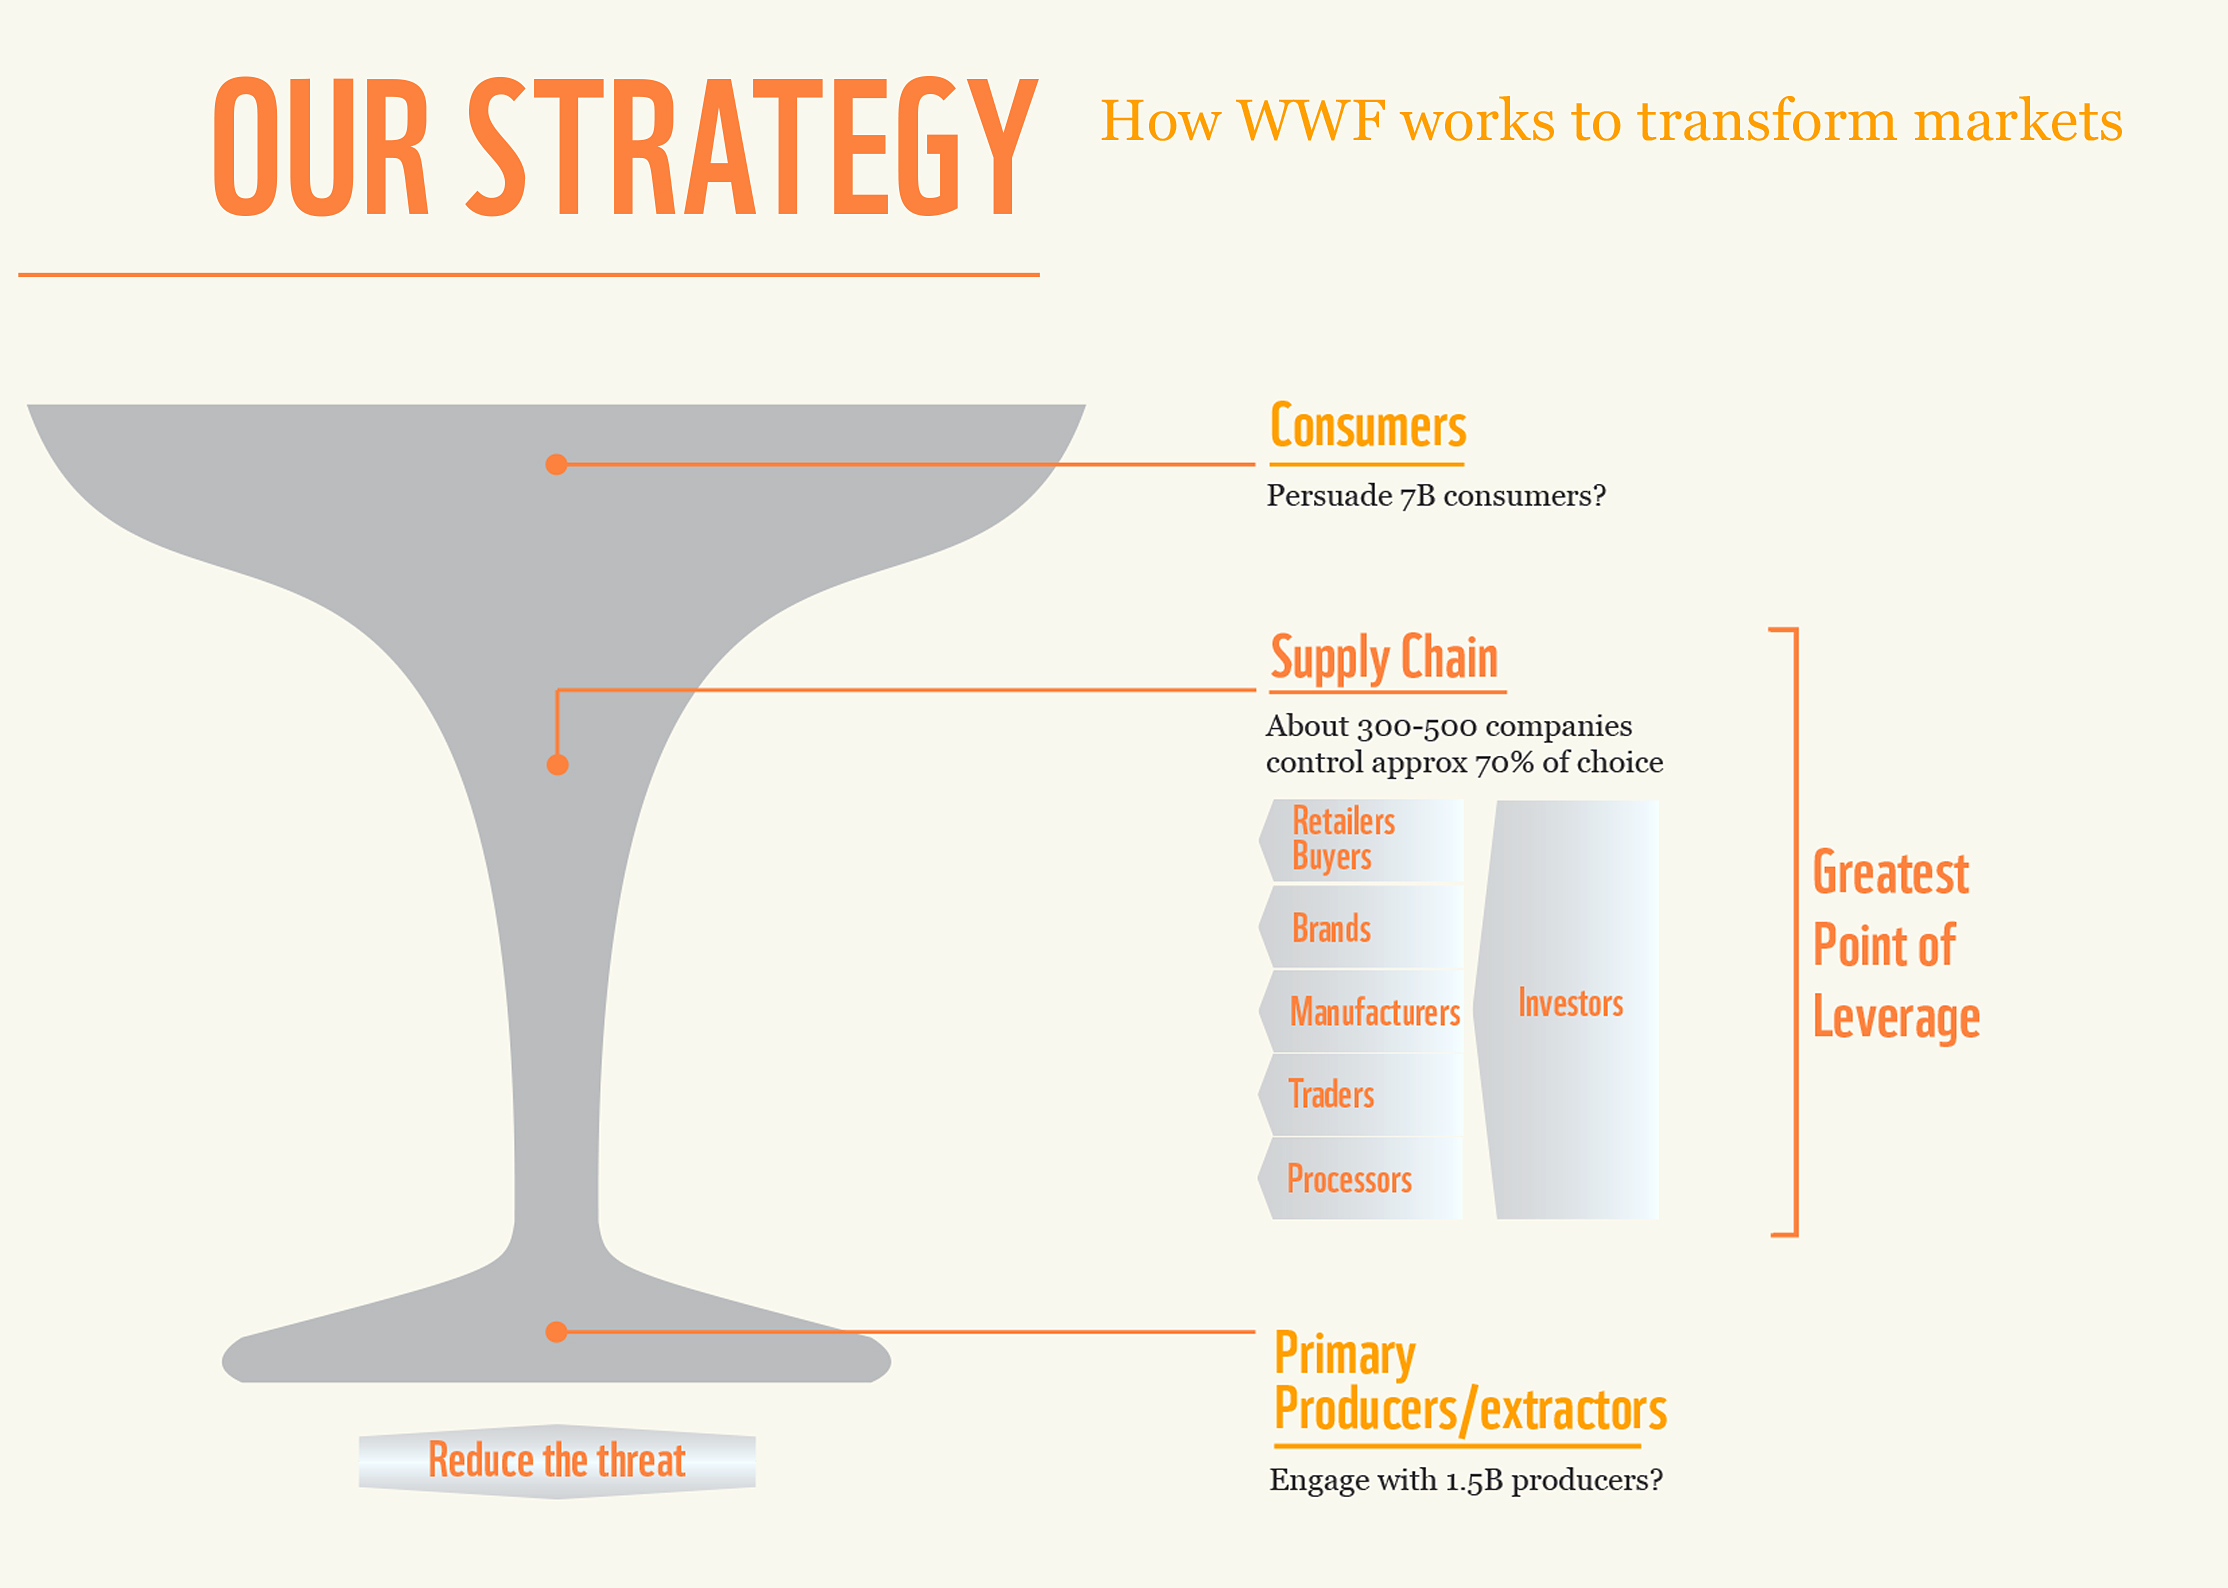
How might it interpret WWF’s published playbook of leveraging the supply-chain of 300 to 500 companies controlling 70% of consumer food choices?
WWF’s playbook uses the consolidation in the middle (above) to move the much larger number of food producers and food consumers toward implementing their sustainability goals, the so-called ESGs (Environmental, Social, Governance) that focus on DEI, biodiversity, and their particular take (and flawed math) on the climate impact of methane emissions from cattle, disregarding the carbon cycle that is the essence of life.
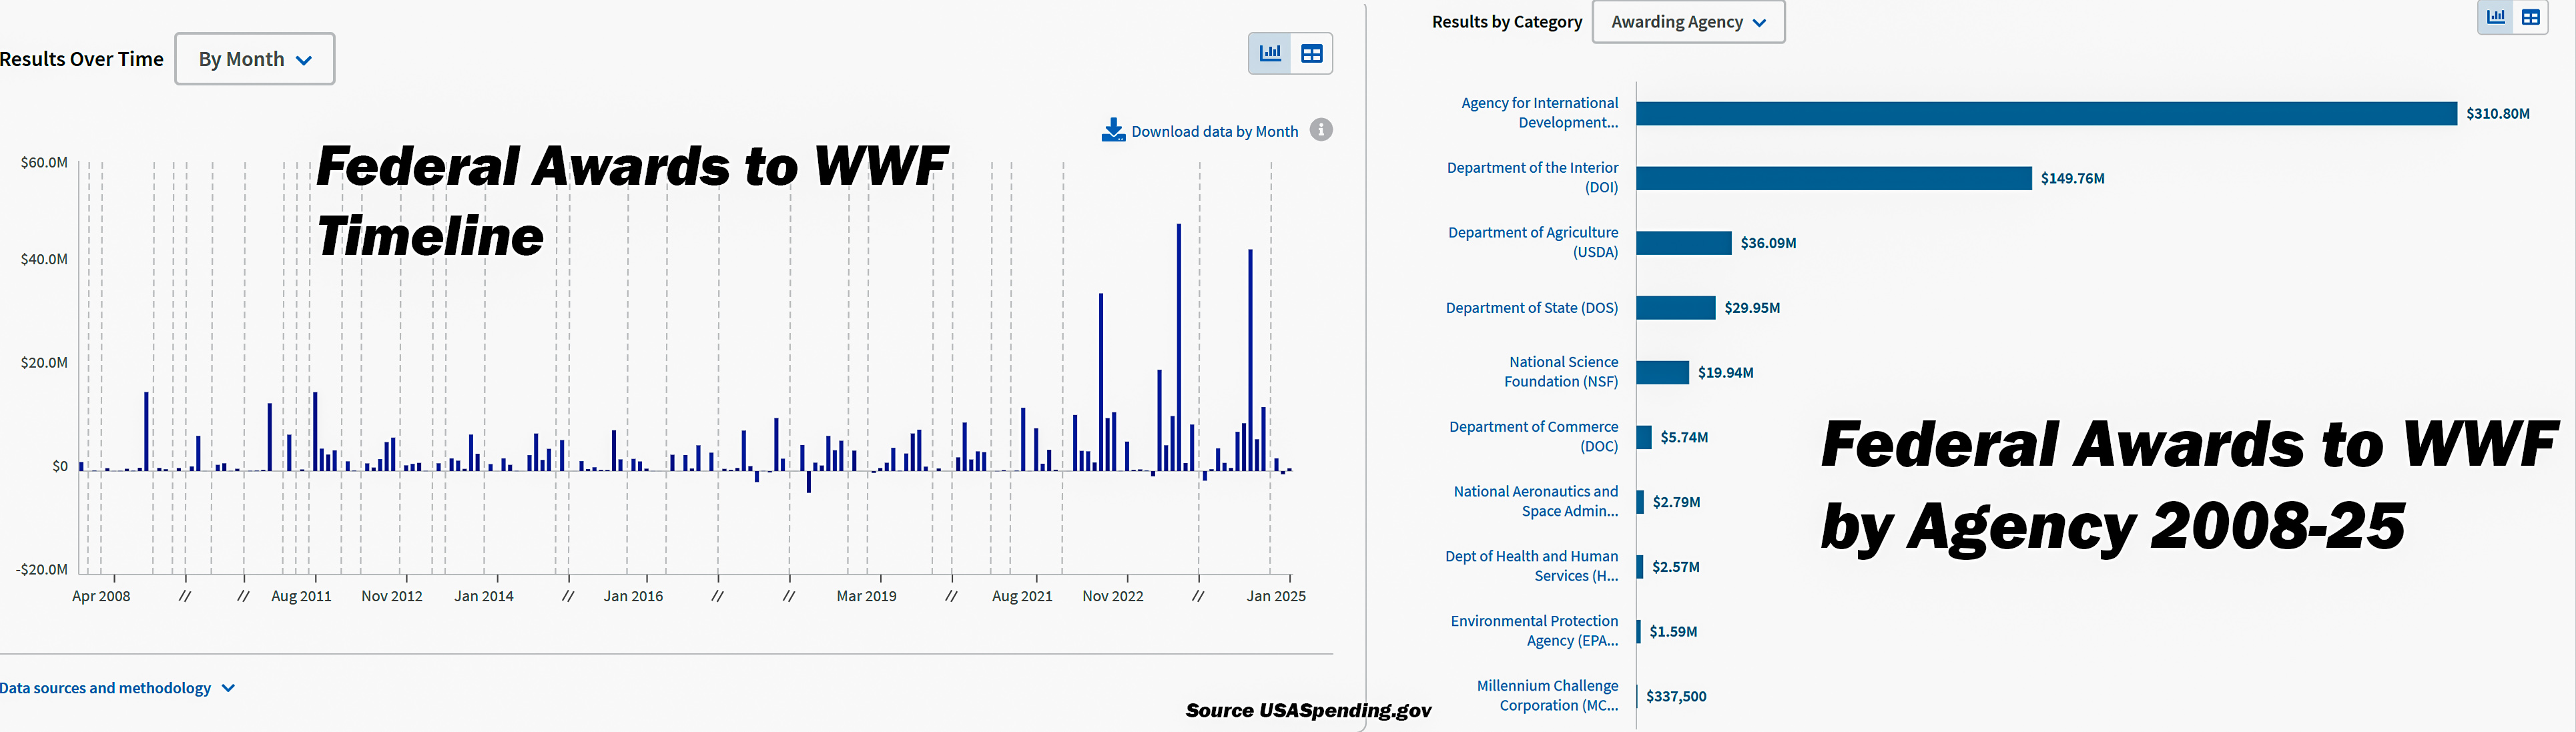
In fact, upon being provided with the link to USA Spending as part of the response we received from the current administration regarding our FOIA request, we found that the federal government has awarded the NGO World Wildlife Fund (WWF) more than $500 million since the start of the Obama administration in 2009. The bulk of the funds were awarded in 2022-24 during the Biden administration.
Of the over $500M, USAID awarded WWF $310M; the Department of Interior awarded WWF $149M; and USDA awarded WWF $36M, with other federal agencies rounding out the total. ($500M is a large sum that the mainstream media refer to as “merely a rounding error” next to the $36T (trillion) in national debt, but where else do these layers lead in terms of money and policy?)
We already know that the dairy and beef checkoffs began their alliances with WWF in the 2008 to 2010 time frame — when the work to develop their Net Zero and Sustainability platforms for dairy and beef producers began, and really ratcheted up by 2021.
Contracts with NGOs in other departments of the federal government have also been terminated through the DOGE reviews, especially via USAID, according to repeated press reports. What more may we learn from the DOGE review on potential entanglements between USDA, checkoff programs, NGO’s like WWF, and the food industry — that are not truly farmer-led but impact farmers?
To-date, there are no indications that the USDA AMS administration of the Federal Milk Marketing Orders are part of the DOGE review; however, it’s possible, depending on how these FMMO administration costs are allocated.
According to the Congressional Research Service (CRS), the 1937 Agricultural Marketing Agreement Act gives USDA several authorities in Federal Milk Marketing Orders (FMMO) that are administered through Dairy Programs under AMS. The associated costs of FMMO administration, according to the CRS “are partly covered by an assessment levied on handlers at no more than five cents per cwt., which is often passed on as deductions on farm milk checks.
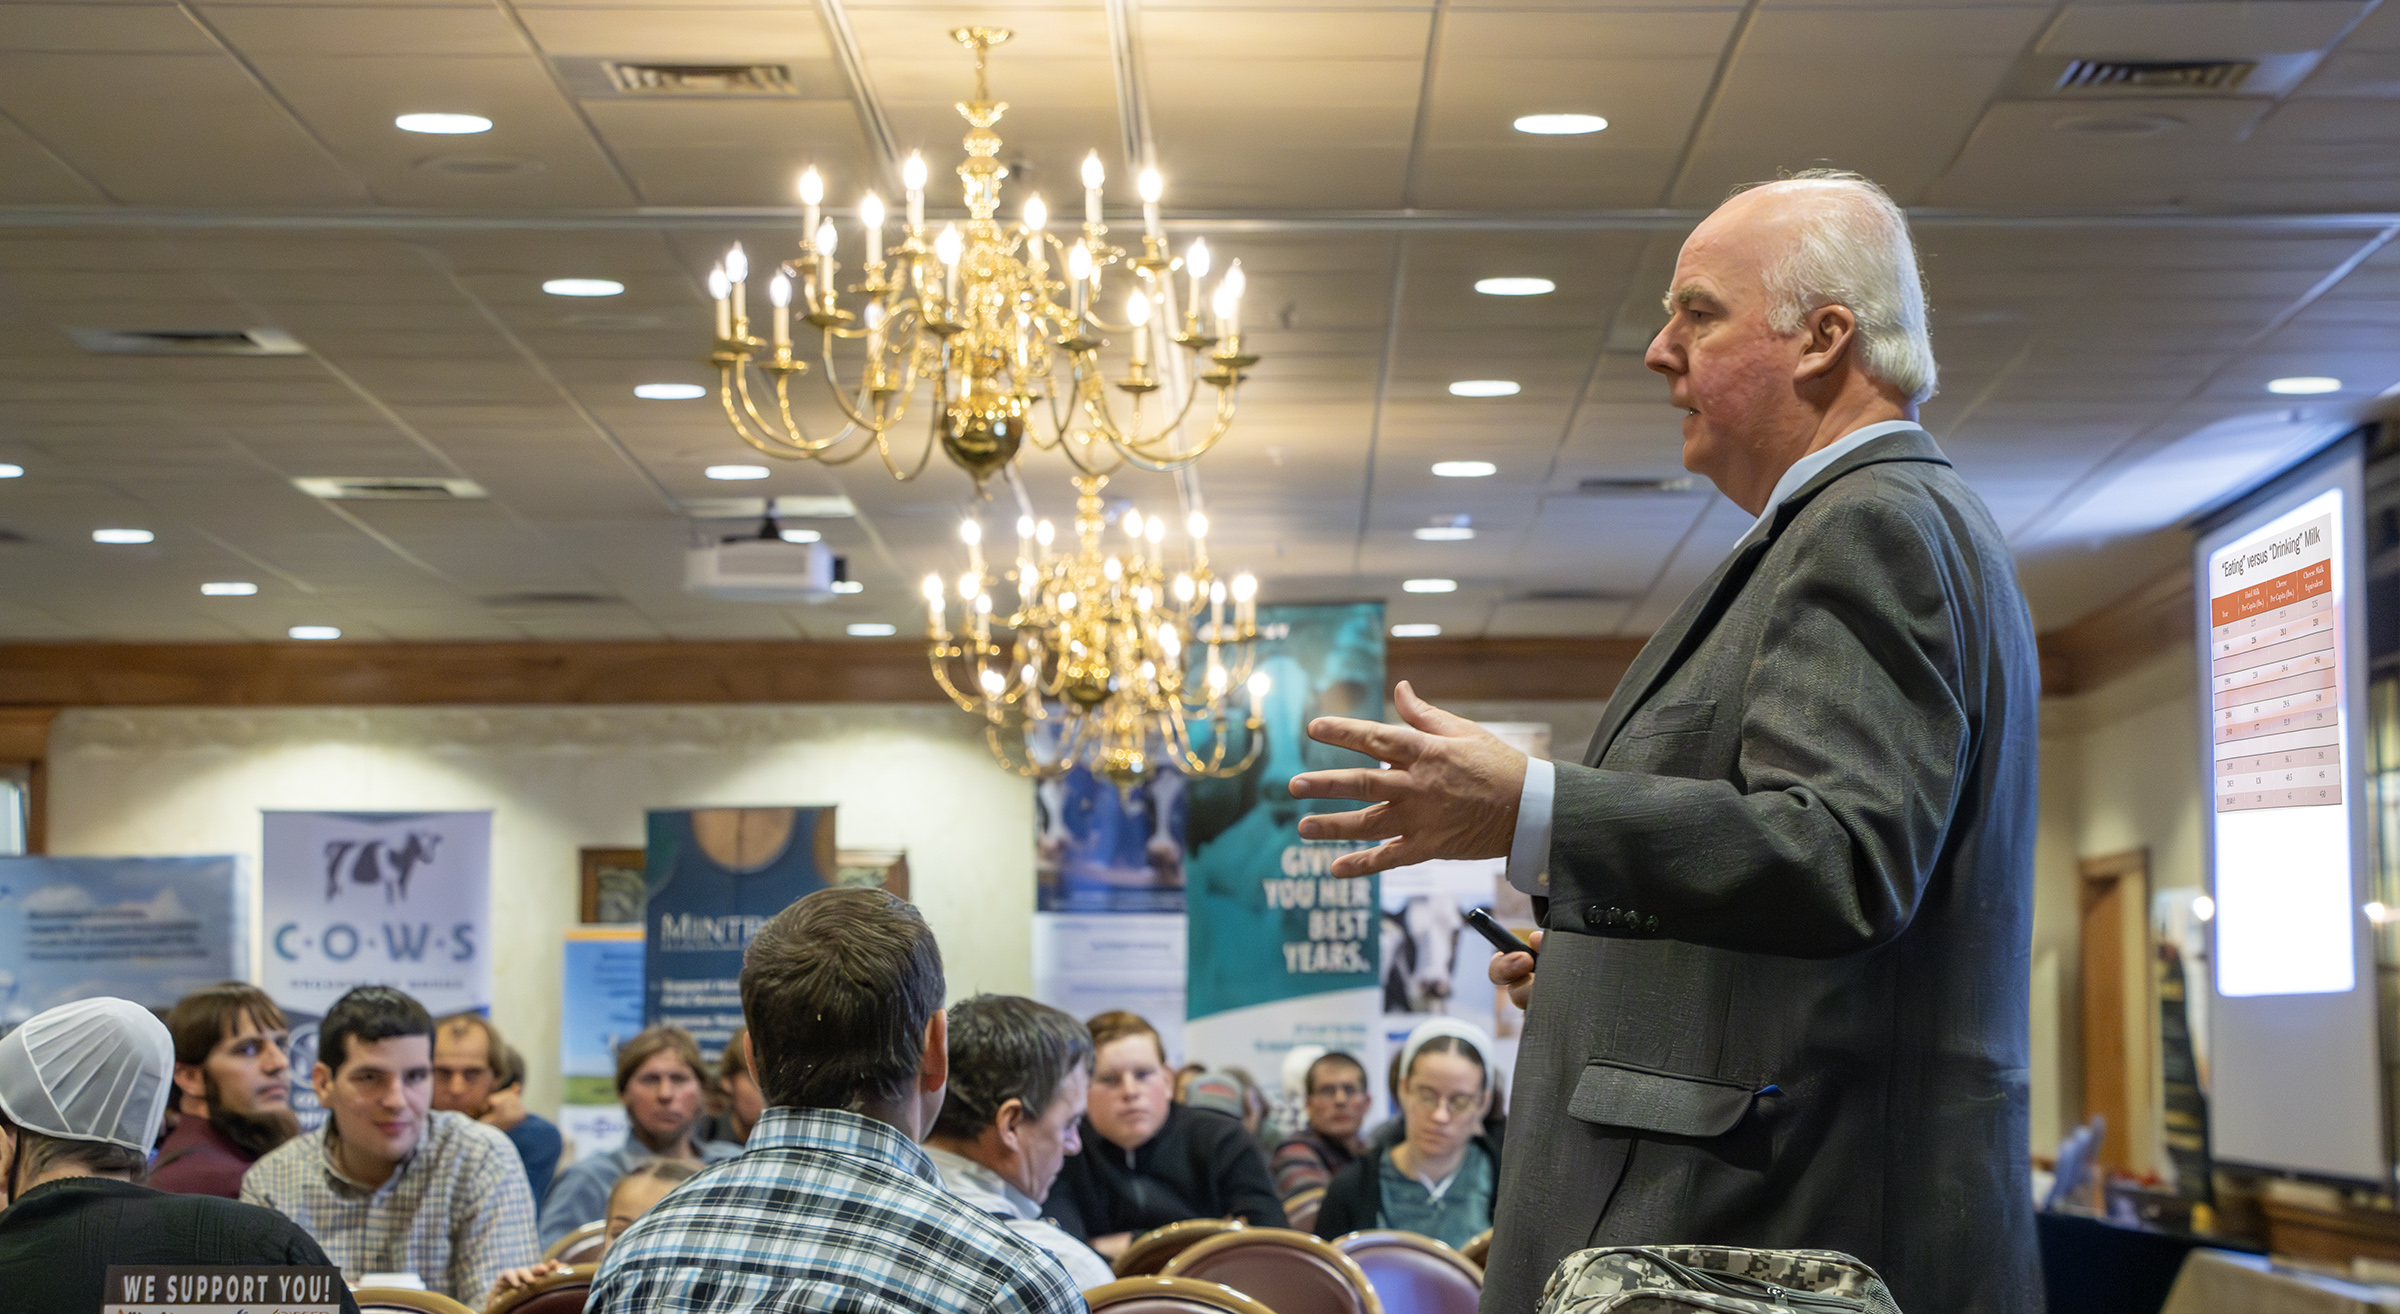
Pennsylvania dairy producers were treated to a forward look at Calvin Covington’s milk market radar during R&J Dairy Consulting’s annual seminar. The bottom line is cheese, cheese, and more whey. Photo by Sherry Bunting
Cheese and whey, will continue driving bus,with big growth in processing capacity on the road ahead
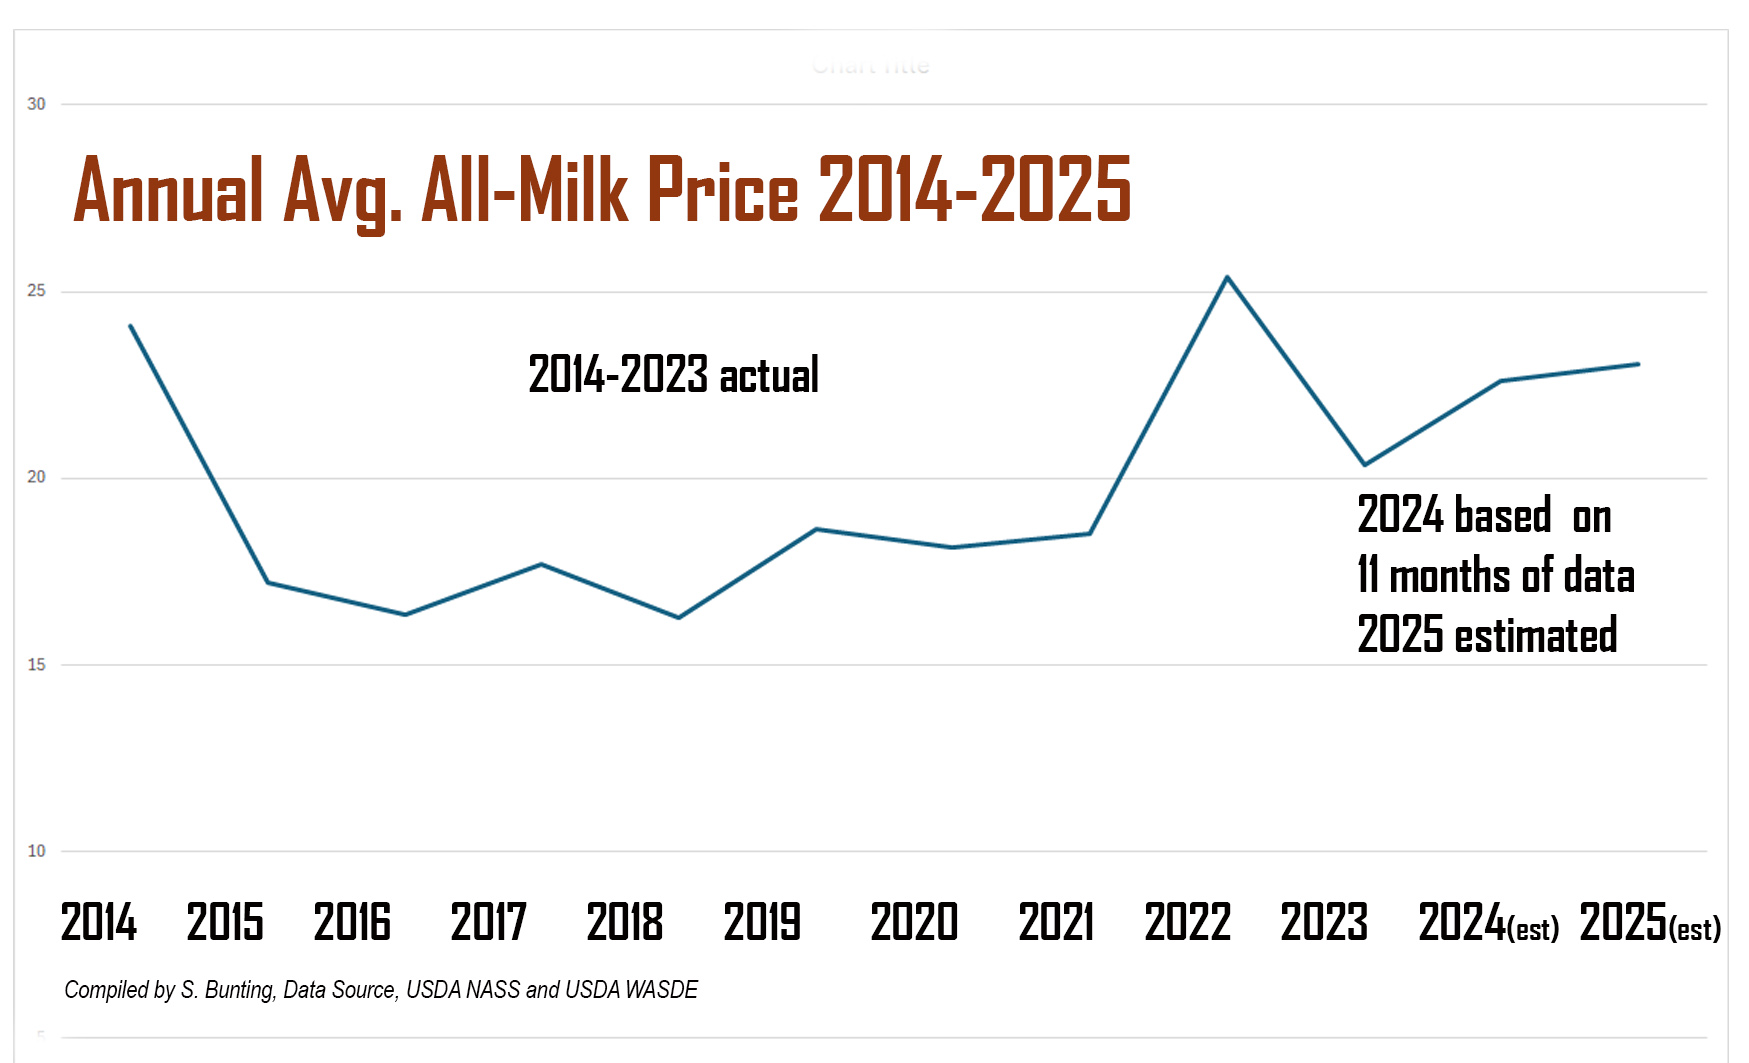
EAST EARL, Pa. – Looking at the milk markets for 2025, Calvin Covington sees farm-level milk prices in the Northeast averaging 25 to 75 cents per hundredweight higher this year. He said milk margins, nationally, averaged $11.86 for the first 11 months of 2024, and he expects similar good margins to prevail in 2025.
The caveat? These are forecasted averages, and farmers should expect price volatility in their income and input costs, along with the mixed bag of positive, negative, and unknown impacts from the Federal Milk Marketing Order changes implemented in the second half of the year. He expects butterfat prices to remain good, but lower in 2025; whey prices will be higher, but more volatile; and protein may be lower as huge new cheese processing capacity comes online
Covington mostly shared what’s on his radar for the next 3 to 5 years during R&J Dairy Consulting’s 18th Annual Dairy Seminar, attended by more than 250 farmers at Shady Maple Smorgasbord in eastern Lancaster County, Pennsylvania on Jan. 28th.
He remarked about the number of young farmers in the crowd, and pointed out that Lancaster County is the consummate dairy county in the U.S. — with more than 1100 Grade A dairies, producing over 2 billion pounds of milk last year, which is 4.5% of total U.S. output and more milk than half of the state totals across the nation.
Consumers: more cheese, more fat, more solids
“Cheese is driving the dairy industry, and consumers are consuming more milkfat. That’s what makes stuff taste good,” he said. “Cheese is one-third fat, and that’s one reason why milkfat consumption is growing.”
He also showed how increased fat consumption is demonstrated in fluid milk sales, with “whole milk coming up.”
This trend toward consuming products with more solids is also evident in ice cream sales, which are down, but the fat content is up; and in yogurt sales, which are flat, but move “more milk in the yogurt” in the form of more solids.
Now retired, Covington, a previous National Dairy Shrine Guest of Honor and World Dairy Expo Person of the Year, spent over 50 years working for dairy farmer organizations, including as a DHIA milk tester, CEO of American Jersey Cattle Breeders Association, and CEO of Southeast Milk Inc.
He said the total solids growth in the dairy sales is expected to continue, up from 27 billion pounds total a decade ago to 31 billion pounds in 2024.
The caveat, he said, is that “exports peaked a couple years ago at 17% of total milk solids, and last year (2024) was down at 16%. Exports are a big part of your market, but they have started to level off.”
When asked about imports, Covington said “they keep going up, especially on butterfat” as the U.S. now imports almost as much milkfat as it exports.
He noted increased consumer demand for Irish butter, which is made differently than U.S. butter, with more butterfat. “I hope we start making better-tasting butter in the U.S. instead of importing it,” he shared.
Amid the demand for milk solids, Covington said “it’s amazing what you are doing with your milk components as dairy farmers.” In the Northeast, producers are averaging 4.21 fat and 3.29 protein due to genetics and “the job farmers are doing with their nutritionists and feed companies.”
Covington demonstrated with 2023 vs. 2024 comparisons that farmers are increasing the amount of products made by increasing components year over year, instead of milk production and cow numbers.
Components are the big story on the supply side, a trend he also sees continuing. He doesn’t expect dairy cow numbers nor milk output per cow to go back to the year-over-year gains seen in the past any time soon.
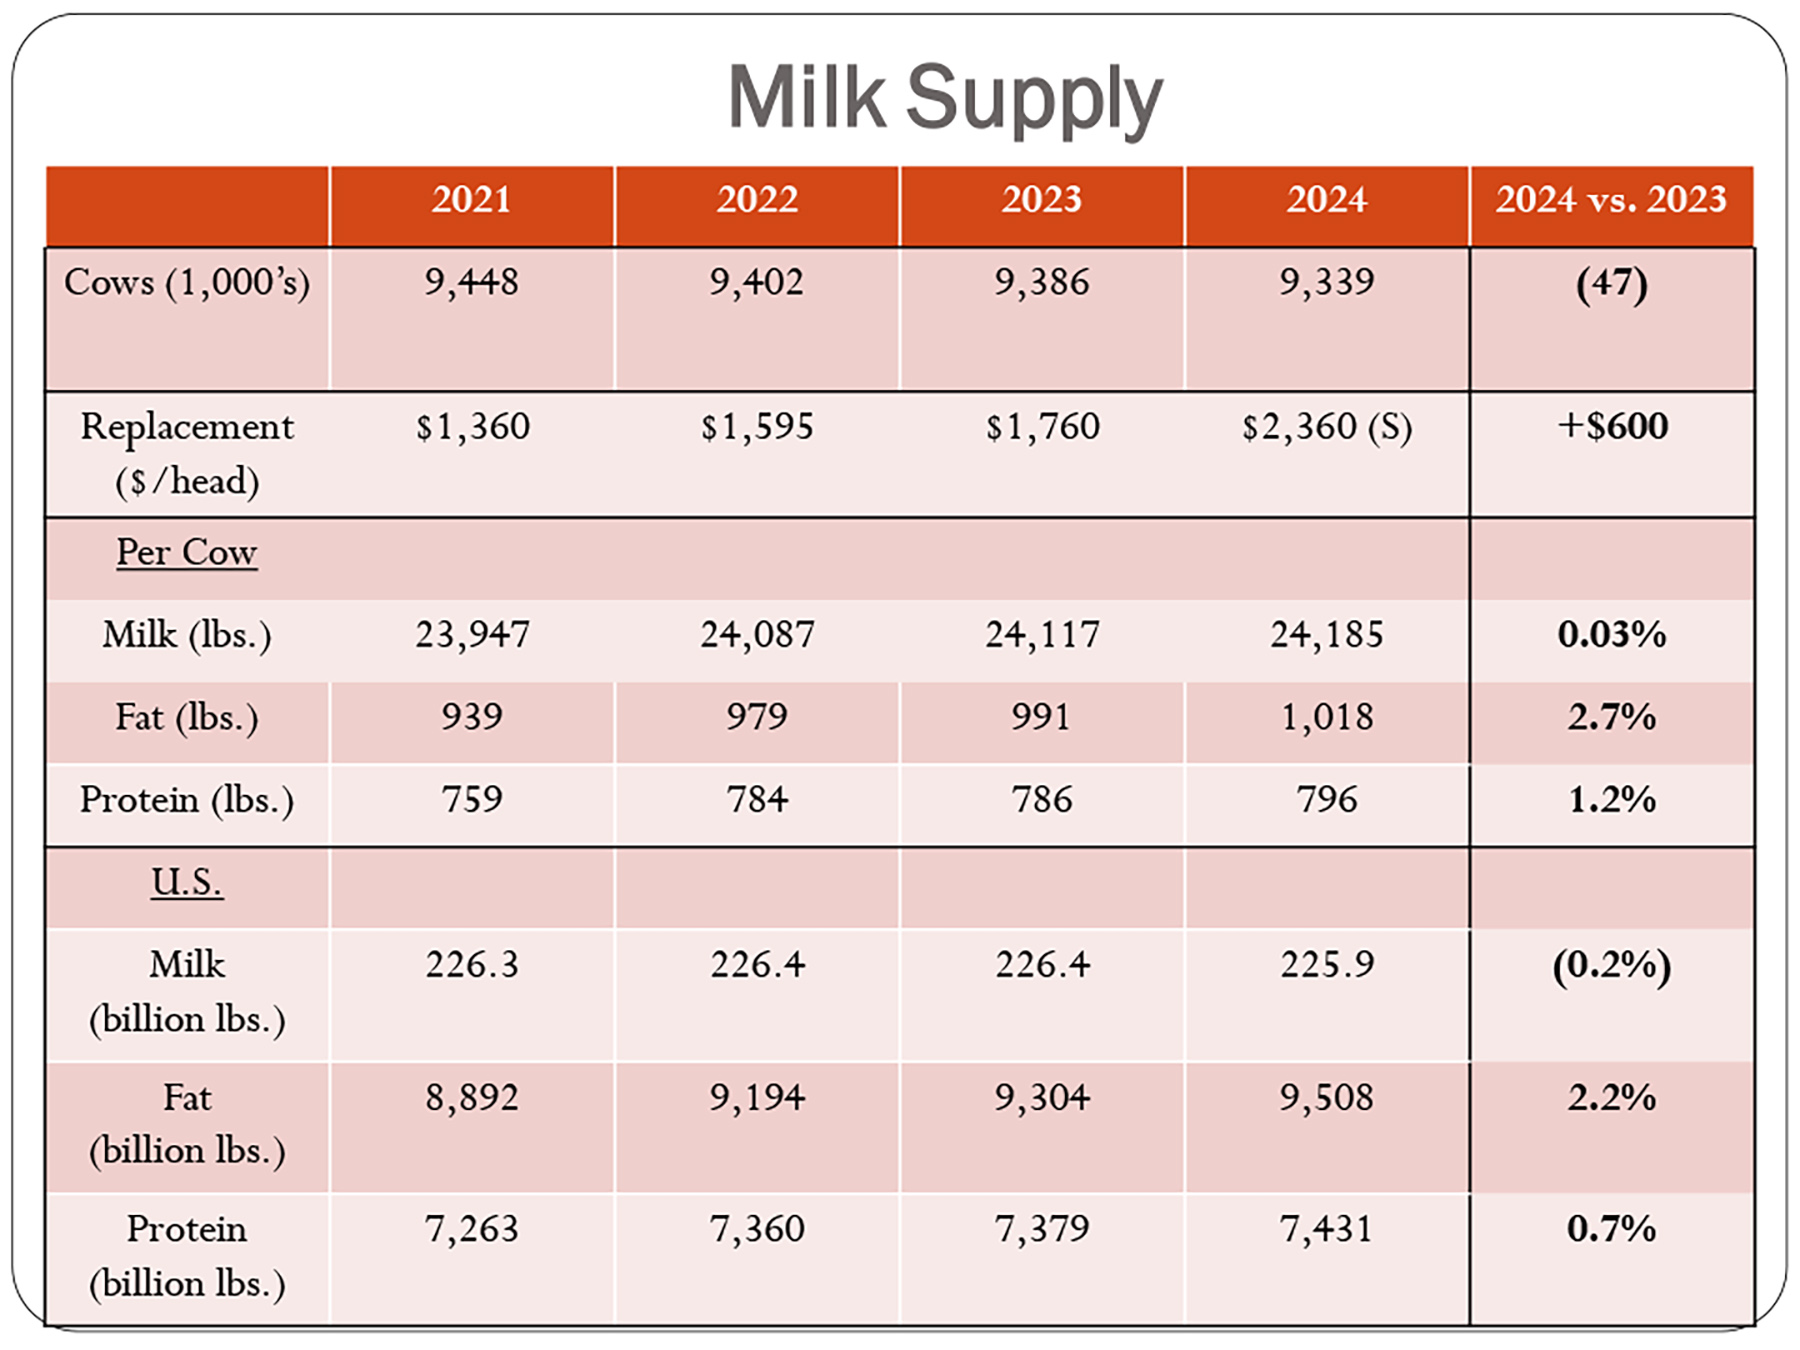
With a chart he showed the stark 2024 vs. 2023 data: Cow numbers are down 47,000 head; replacement heifers sell for $600 more per head; average milk output per cow is flat; but average fat pounds per cow is up 2.7% and average protein pounds per cow up 1.2%. This means that even though total U.S. milk production at an estimated 225.9 billion pounds is down 0.2% from year-earlier, total fat pounds at 9.508 billion pounds are up 2.2%, and protein pounds at 7.431 billion pounds up 0.7%.
“You’re doing it with your components,” he said. “And that’s going to continue.”
Cheese (or maybe whey) is driving the bus
Putting aside the import and export caveats, Covington demonstrated that as the overall dairy market is growing, almost all of this growth has been in the cheese market, which has become a much bigger piece of the much bigger pie.
“Cheese has been driving the dairy industry for several years, and everything points to it driving the industry going forward,” he said, showing a chart of the product mix in the year 2000 when 167.4 billion pounds of milk was produced in the U.S., sold as half cheese, and one-third fluid milk, with 15% other products. This compares with 2024, when 225.9 billion pounds of milk was produced and 58% of the sales were in cheese, 20% fluid milk, and 22% other products.
Per capita trends also show “consumers are eating more of their milk instead of drinking it,” said Covington. “We have seen tremendous change since 1986, when consumers first started consuming more of their milk as cheese than as fluid milk. Look at 2023, people consumed 405 pounds of milk (equivalent) in the form of cheese and 128 pounds in the form of fluid milk.”
While home milk delivery is rare today, Covington said it happens now in the form of pizza.
“If I drive around the city on a Friday night, I’ve got to get out of the way of the pizza delivery people. I figure, on average, it takes a little over a gallon of milk to make one average size pizza. Just think how much home delivery we have today of milk, but in the form of something else, not the milkman dropping off half gallons,” he said.
“The market is changing, and it’s going to keep on changing.”
Why is cheese growing so much? Covington pointed to things he hopes are lessons for other products: 1) Convenience, innovation in packaging and varieties, with pizza accounting for 42% of all cheese; 2) Brand identity, there’s still a lot of this in cheese, not making it a commodity to try to get to the lowest price like in other dairy products (i.e. fluid milk); and 3) taste, people love cheese.
Big bets on the future
Big bets are being made for more cheese growth, and the revenue stream of whey ‘byproduct.’
“We are in a slurry right now of a pile of money being spent on new plant construction,” said Covington, listing the states of Kansas, Texas, South Dakota, Minnesota, Wisconsin and New York.
When all of this new construction is complete over the next year or so, Covington expects the need for 30 million pounds of milk a day to fill the new plants or expansions, which he estimates represent investments of at least $5 billion and are owned by private companies or groups of farmers or individual farms that are not cooperatives.
“This kind of money and growth is not being put out there unless there is confidence in getting a return on investment with cheese and whey product growth both domestically and internationally,” he pointed out.
New cheese plant construction, when completed over the next year or so will take in more than 30 billion pounds of milk a day, and they gain a lot of additional revenue from what they do with the whey that smaller traditional cheese plants don’t have the equipment to do.
These new plants making all of this cheese will also have a lot of whey.
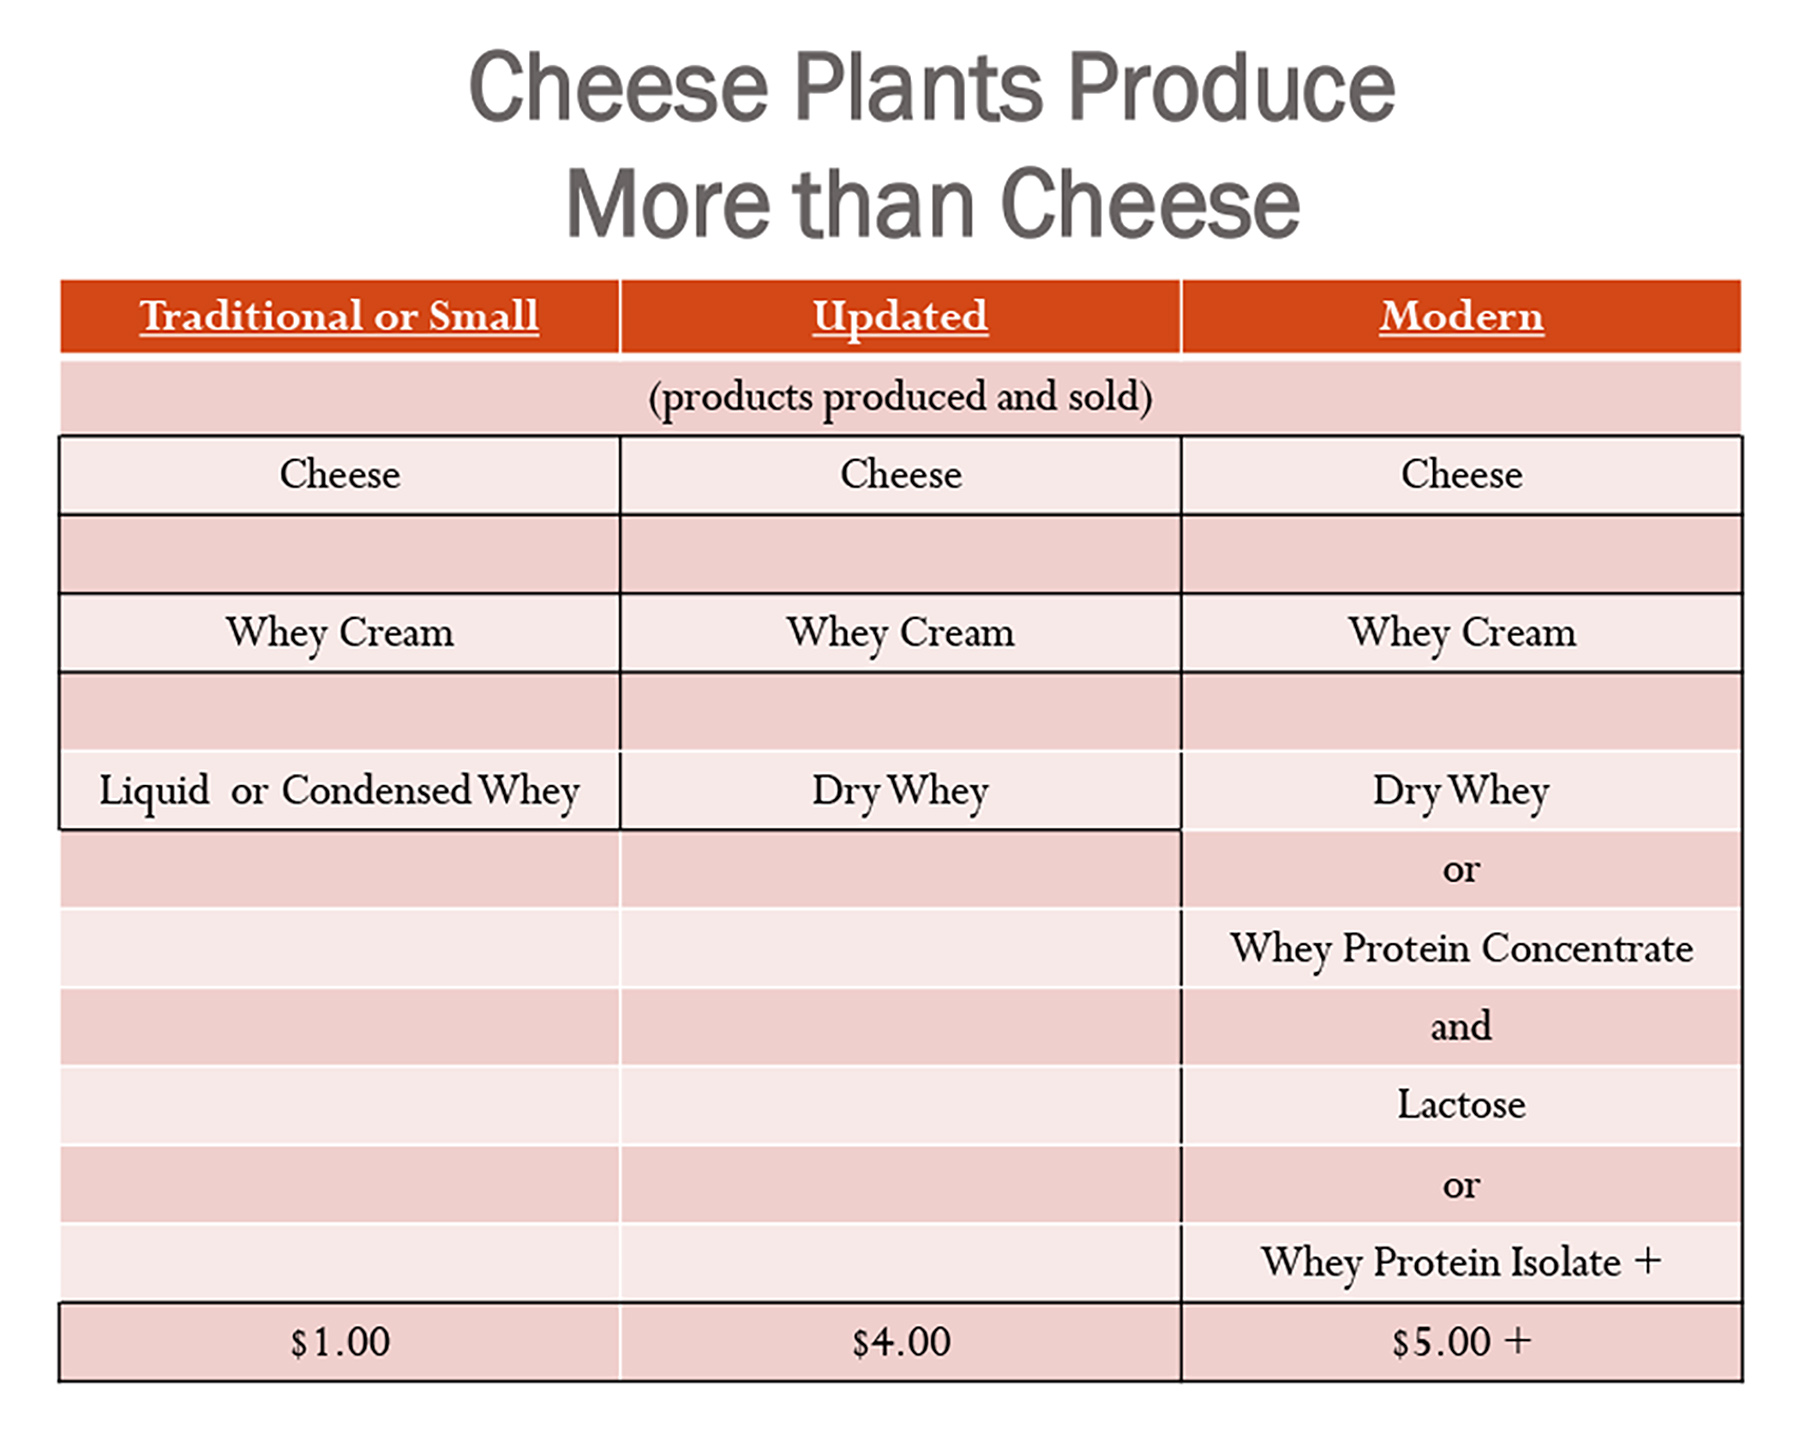
He explained that small plants get about $1.00/cwt for the whey cream and have the liquid whey to do something with. Some plants might dry it and get $3 per cwt for the dry whey plus the $1 for the whey cream, so that’s $4/cwt.
“Small traditional cheese plants can’t afford the equipment to do what some of these new plants are doing. These new companies not only dry the whey, they fractionate it to make whey protein concentrates. They separate out the lactose for whey protein isolates,” Covington said, rattling off a few items on the expanding list for everything from snacks and beverages, to pharmaceuticals and cosmetics, to milk replacers, to counter-top items, ‘pizza cheese,’ artificial seafood, canned hams, and more.
“It’s just amazing, and it brings in more revenue. When we think about cheese, it’s more than just the cheese, it’s also the income from the whey that’s left over,” he said, adding that the CEO of a large cheese company once told him: “Sometimes I think the cheese is the byproduct.”
With this kind of investment, the new plants are going to be making big volumes and getting income from the whey.
“This puts a crimp on the small cheese plants that can’t do this, and they’re going to have to get it out of the cheese end,” Covington observed, suggesting some potential structural change on the cheese side of the dairy industry with significant domestic and international sales growth needed to stay a step ahead.
On the positive side of the fluid milk industry, in addition to growing whole milk sales, Covington highlighted new investments. He sees a future with more dominance by grocery stores, pointing out the two new Walmart plants going into Georgia and Texas, which will be the largest in the country, processing 50 to 55 loads of raw milk a day.
Other big investments in the fluid milk sector in the Northeast are ultrafiltration and ESL packaging, such as the new fairlife plant under construction in western New York, new ESL expansion at the former Hood plant owned by Maola, and aseptic shelf-stable milk packaging at Cayuga Milk Ingredients.
Editorial Analysis: Tumultuous 2024 spills over into 2025 – Part Three
By Sherry Bunting, Farmshine, February 7, 2025(updated with additional information after print edition published)
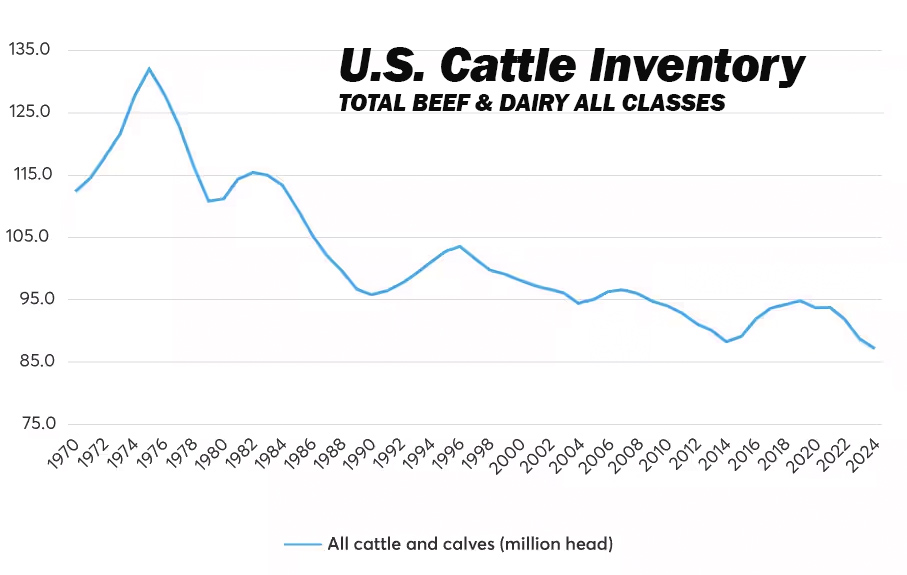
EAST EARL, Pa. – A tumultuous dairy and beef market in 2024 is bound to be even more so in 2025. The long-awaited Jan. 1 Cattle Inventory Report is in, and we all saw the kerfuffle about tariffs and trade this week.
The bottom lines are…
— The U.S. beef cow herd continues to shrink, while both the beef and dairy heifer replacement numbers are notably smaller, signaling less domestic beef production and stable, if not reduced milk production in the face of strong domestic demand for beef and dairy products.
— U.S. import volumes of live feeder cattle as well as beef and dairy products have climbed over the past five years.
— Uncertainty prevails about U.S. trade policy, but export volumes of beef and dairy have leveled off already in the past several years. Dairy exports are bound to get a boost in the short-term as U.S. prices are mostly trailing current global prices. Tariffs on Canada and Mexico and potential retaliations are paused.
— Will the dairy herd continue maintaining itself at these shrinking heifer ratios now that we are five years out from the time of plentiful heifers.
Report highlights include…
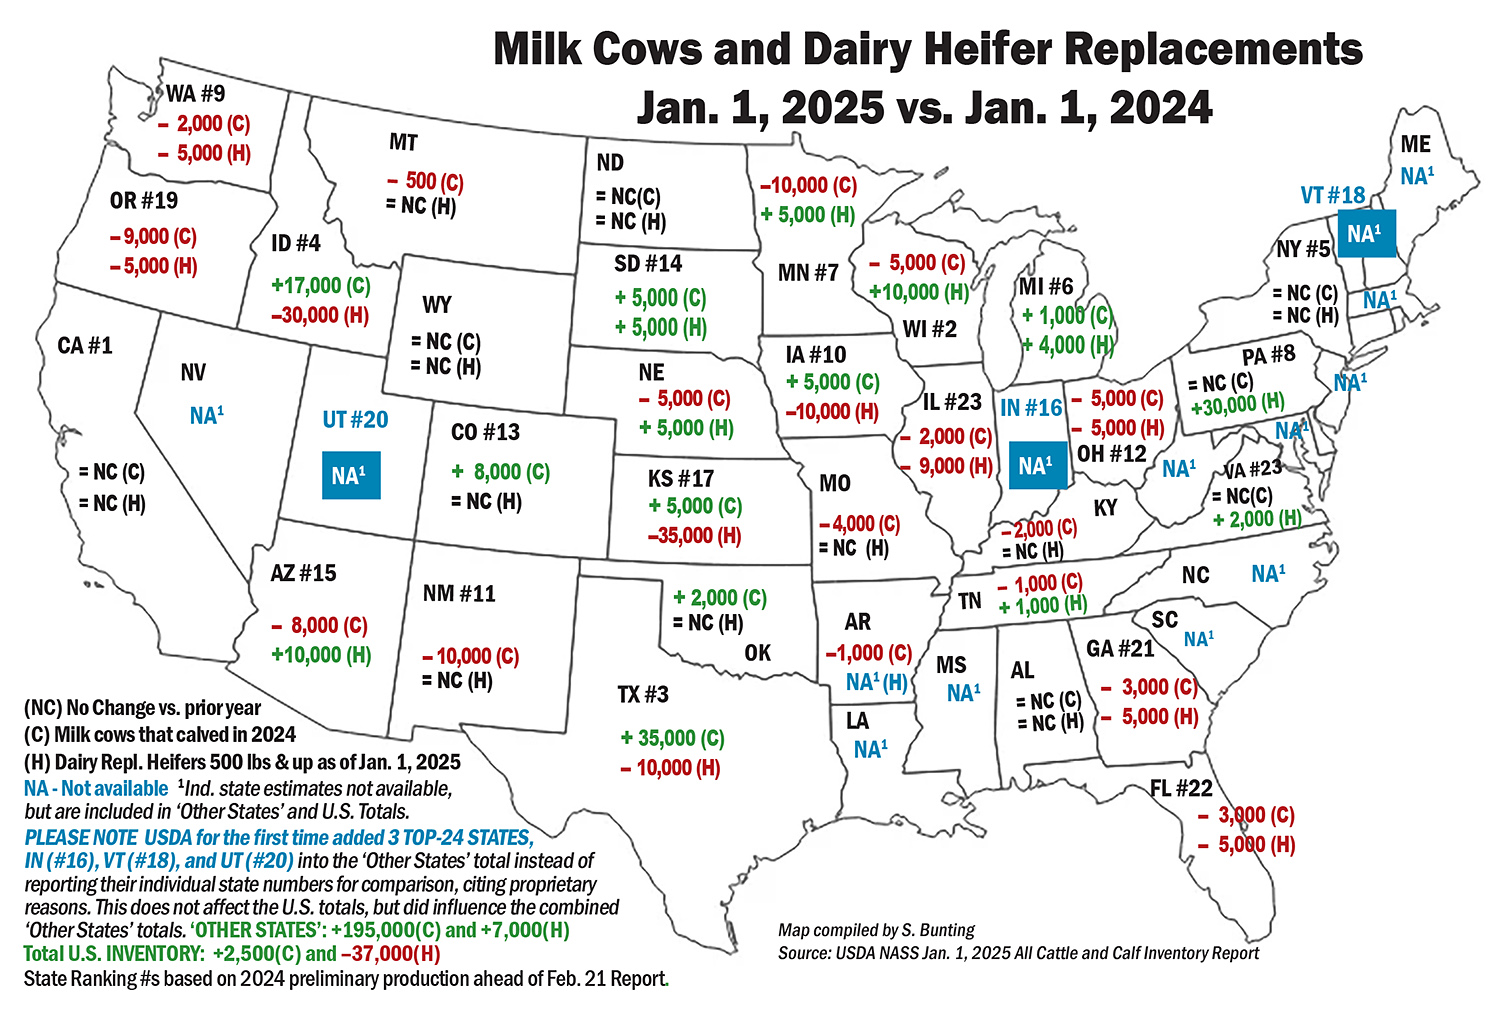
Milk cow inventory has remained relatively stable over the past five years, ranging from 9.34 million head on Jan. 1, 2020 to the 5-year high of 9.45 million head on Jan. 1, 2021, then back down to just shy of 9.35 million head on Jan. 1, 2024 and Jan. 1, 2025. However, the number of dairy replacement heifers has dropped by 16% over the past five years from 4.61 million head on Jan. 1, 2020 to 3.91 million head on Jan. 1, 2025. This number is down almost 20% — or nearly 1 million head — from the record high 4.81 million dairy replacement heifers recorded on Jan. 1, 2016.
Are milk cows milking longer? Is the average dairy cow getting 16 to 20% more productive life (an additional half lactation)? Is the age at first calving continuing to decline, and are herd culling rates also declining significantly enough to maintain the current cowherd size on 16 to 20% fewer heifers expected to calve vs. 5 and 10 years ago?
According to the Jan. 1, 2025 Cattle Inventory Report, there are not quite 27 heifers expected to calve this year for every 100 cows in the current U.S. dairy herd, and a national cull rate of 29% based on January through December 2024 dairy cow slaughter totals. Five years ago, there were just over 31 heifers expected to calve for every 100 milk cows in the similarly-sized U.S. dairy herd.
Will these trends collide at the 5-year mark this year, given the average productive life of a dairy cow based on the most recent data (2020) is not quite three lactations or roughly 5 years of age? How will the $5 to $10 billion in new processing capacity be filled, or will we see existing plant closures in their stead? Are the investor dairies that put up 10, 20, and 30,000 cow facilities each year filling new barns with milking animals raised on their own calf ranches coming in under the reporting-radar of USDA NASS? Or is the pace of dairies exiting the business on one end mirroring the growth on the other end?
One inescapable conclusion is that the milk cow herd remains relatively stable, while the dairy replacement heifer numbers have shrunk by 16% vs. five years ago and by 20% vs. 10 years ago, and the record-high prices paid for dairy replacements is proof of tight supplies.
This is part three in a four-part series. Part one was published Jan. 3, 2025; Part two on Jan. 17, 2025.
CME graph using USDA NASS Inventory data
U.S. cattle herd down… again
U.S. total cattle numbers on Jan. 1, 2025 are down 1% year-over-year (YOY), according to the All Cattle and Calf Inventory Report released by USDA on Fri., Jan. 31st.
At 86.66 million, the report counted 500,000 fewer head than last year’s total, which was already the smallest in 74 years (Jan. 1, 1951).
The total number of all cows and heifers that calved is down 0.4% YOY at 37.21 million head. That is 147,000 fewer beef and dairy cows on farms as compared with the revised-lower totals a year ago, which were already the smallest in 84 years (Jan. 1, 1941).
The total number of all heifers over 500 pounds on Jan. 1, 2025 (including heifers destined to become beef) was down 1% YOY at 18.18 million head. That’s 140,000 fewer head counted than on Jan. 1, 2024, which was already the smallest total heifer number in 34 years (Jan. 1, 1991).
In the Jan. 1, 2025 report, USDA NASS revised-lower its Jan. 1, 2024 and July 1, 2023 estimates of total animals that had calved, as well as the calf crop in those 12 to 18 month prior Inventory Reports. Statisticians went back and compared the prior estimates to the official slaughter data, the import and export data, and the relationship of this new survey information to the prior surveys.
This means the Jan. 1, 2025 numbers are now estimated at levels below the revised-lower prior reports that had already set records! (A mid-year 2024 inventory would have been helpful, but was canceled by former Ag Secretary Tom Vilsack, claiming insufficient USDA funds).
Chart compiled by S. Bunting with USDA NASS Inventory data
Milk cows flat, heifers shrink
The number of milk cows on Jan. 1, 2025 was essentially unchanged vs. year earlier, up only 2,500 to just shy of 9.35 million head.
However, the dairy replacement heifer total is down 1% YOY at 3.91 million head. At this rate, the number of heifers heading to careers as milk cows is 16% below the 5-year comparison on Jan. 1, 2020.
At 3.91 million head, there are 37,000 fewer dairy replacement heifers than a year ago, which was already the smallest number of dairy replacement heifers in 47 years (Jan. 1, 1978).
As the graph above illustrates, milk cow numbers have held relatively stable over the past five years, while the number of dairy replacement heifers has significantly declined. Are cows experiencing longer productive life? Or are the multi-site investor dairies filling their own expansion sites via their own calf ranches, and escaping the USDA reporting radar?
According to the most recent data (2020), average dairy cow productive life in the U.S. is just shy of three lactations, roughly five years of age. With the number of dairy replacement heifers declining 16% over the past five years, will these two trends collide in the next 12 to 24 months to reduce the U.S. milking herd while escalating the already record high dairy replacement cattle prices? And, what role might HPAI H5N1 play as longer term impacts emerge?
USDA NASS reports that the average auction value of ‘average’ milking cows has increased by nearly $800 per head to $2650 for 2024 vs. $1890 for 2023; $1100 per head higher vs. the $1720 average for 2022; and double (+$1300) the average value reported at $1350 and $1300 per head four and five years ago for 2021 and 2020, respectively.
The average cost to raise dairy replacements has been estimated at $1700 to $2400 per head, which means the value of ‘average’ replacement heifers at $1720 to $2660 from 2022 to 2024 is finally starting to mirror the cost to raise them — on average.
Many dairy producers continue producing only the heifers they need, which is reducing the availability of heifers in the marketplace for those wanting to expand.
Producers continue to respond to the lure of the 3-day-old dairy-on-beef crossbred calves offering substantial margins of $800 to $1000 per head — with no investment, no rearing, no revenue-wait, and no risk.
Basically, a dairy cow can produce $800 to $1000 in revenue for the dairy as soon as she drops a live crossbred calf, no matter what the milk price or margins are doing, and with her whole lactation in front of her.
The Jan. 1 Inventory Report shows the U.S. beef herd continues to shrink, suggesting beef-on-dairy crossbreds will continue to offer bigger per-head margins than growing extra dairy heifers to sell as herd replacements — unless they are premium dairy heifers.
Expanding dairies are having to really plan ahead to raise the animals they need for growth or scramble to get them. Additional upward price momentum may be seen on dairy replacements in the next 12 to 24 months as the more abundant heifers available five years ago ‘age-out’ of the system, statistically speaking, at five years old, which is the industry average age of a milking cow in the U.S.
With the Jan. 1, 2025 U.S. milking herd holding steady at a level that is 1.1% smaller than it was in 2021, the expanding dairies are buying up the herds of the exiting dairies at high prices that make dairy farmers think about selling the cows and hanging on to the heifers, for now, if they do not have a next generation to continue the dairy.
Turnover of existing Holstein herds to include other breeds is also occurring, along with genetic improvement within the Holstein breed, as producers work to raise heifers that calve into the milking herd at younger ages, produce more component yield per hundredweight of milk, have improved productive life traits and fewer days open for a tighter average calving interval.
With a 2024 national dairy herd of 9.35 million milk cows and a 2024 national dairy cow slaughter of 2.726 million, the national culling rate last year was 29%. At that rate, even if the average age at first calving is 22-months, the U.S. dairy industry would need 28 dairy heifers to calve successfully in the next 12 months for every 100 milk cows — just to maintain the current size of the U.S. dairy herd.
According to the Jan. 1 Inventory Report, there are 2.5 million dairy heifers expected to calve in 2025 (down 0.4% or -9000 head). This calculates to 27 (actually 26.75) dairy replacement heifers expected to calve in 2025 for every 100 cows in the U.S. dairy herd as of Jan. 1st.
In 2016, when dairy replacement heifer numbers reached their peak at 4.81 million head, 3.11 million head were expected to calve that year, and the total U.S. dairy cow inventory was 9.31 million head, meaning there were 31 heifers expected to calve for every 100 cows in 2016. This has steadily eroded in part because dairy producers have stopped spending the money to grow extra heifers that were worth less than the cost to grow them until this year. They also worked to reduce age at first-calving, days open across the herd, higher component levels in the milk, reduced death loss, longevity, and began gradually re-introducing beef crossbreeding, which has become a pretty big deal over the past five years.
Some parts of the country are down significantly in heifer replacements as of Jan. 1, 2025, while others are up. For example, Pennsylvania has 15% more dairy replacement heifers on farms vs. year ago.
These estimates indicate milk production will be flat to lower for the next 12 to 24 months.
What this does not account for is the increasing milk component levels generating more dairy products per 100 pounds of milk and the increasing volume of dairy imports, particularly cheese, butter, and whole milk powder. But those increases can only do so much in the face of $5 to $10 billion in new processing assets coming online in the next 6 to 18 months.
CME graph using USDA NASS Inventory data shows continued overall contraction of total cattle inventory as new cycles mostly fail to breach prior cycle ceilings, floors, and midpoints.
Beef herd shrinks more
The Jan. 1 Inventory shows the U.S. beef herd continues to shrink. At the national level, there are no signs of rebuilding, as the total number of heifers heading to careers as beef mama cows is down 1% YOY. However, in some parts of the country, such as Virginia, more heifers were retained as beef cow replacements and fewer were earmarked for feedlots.
At 4.67 million head, there are 46,000 fewer beef replacement heifers in the U.S. vs. year ago, setting another record low as the smallest number since 1948.
Even more striking is the beef replacement heifers that are expected to calve in 2025 are down a whopping 2% YOY (-50,000) nationally.
Meanwhile, the beef-on-dairy feedlot placements, while a growing segment of the beef industry, are not enough to reverse the downward beef production trend as evidenced by declines in the number of animals over 500 pounds on Jan. 1st heading to feedlots: Steers and bulls are both down 1% (-157,000 and -21,000 head YOY, respectively). Heifers over 500 pounds heading to feedlots are down 0.6%, and the number of cattle on feed as of Jan. 1, 2025 is down 1% YOY at 14.3 million head (-130,000 head).
The Inventory Report came on the heels of the January Cattle on Feed Report, which showed 3% fewer feedlot placements as of Jan. 1, perhaps because of the Mexican border closure to the live cattle imports, due to concerns about transmission of the screw-worm parasite.
Even the total number of all calves (heifers, bulls and steers) weighing under 500 pounds dropped 1% lower YOY at 13.46 million head (-30,000).
These estimates suggest domestic beef production will decline for at least the next 12 to 24 months, maybe longer.
What this does not account for are the number of live cattle crossing the border into U.S. feedlots from Mexico and Canada and the increasing amounts of beef the U.S. imports from other countries, including from Canada, Mexico and South America.
Map compiled by S. Bunting with USDA NASS Inventory data
Significant geographic dairy shifts
Breaking the dairy inventory numbers apart, we see big geographic shifts.
The West added 78,000 more milk cows in 2024 vs. 2023, except for California’s numbers being unchanged. On the other hand, the East and Upper Midwest had equal or fewer milk cows, down collectively more than 75,000 head YOY, except Michigan was up just 1000 head.
The biggest 2024 gains were tallied in Texas, up 35,000 head, and Idaho, up 17,000 head. Colorado grew by 8,000 head; Iowa, Kansas and South Dakota by 5,000 each; and Oklahoma by 2,000.
The biggest milk cow declines were in Minnesota and New Mexico, down by 10,000 head each; Oregon down by 9,000; Arizona by 8,000. Wisconsin, Ohio, and Nebraska by 5,000 each; Missouri by 4,000; Florida and Georgia by 3,000 each; Illinois, Kentucky, and Washington by 2,000 each; and Tennessee by 1,000. Smaller unranked states collectively accounted for the remainder of milk cow losses.
Interestingly, USDA pulled three Top-24 Milk Production States into the ‘Other States’ category, choosing not to report their cow and heifer numbers for proprietary reasons. They are Indiana (#16), Vermont (#18) and Utah (#20). Thus the ‘Other States’ category saw an increase of 195,000 cows simply because these three Top-24 states were included anonymously in the total.
The geographic breakdown is interesting when it comes to dairy replacement heifers as the growth is noted in the areas where the cow numbers have declined and vice versa. These shifts could reflect changes in the way heifers have tended to move across state lines for rearing, especially in light of the dairy-adapted B3.13 strain of HPAI H5N1.
Pennsylvania is the biggest outlier as the cow numbers are unchanged YOY, but farmers reported 30,000 more dairy heifers in the Commonwealth on Jan. 1, 2025 vs. year ago.
Elsewhere in the East, Virginia dairy heifer replacements are up 2,000 head; Tennessee up 1,000 head; New York and Kentucky unchanged; Georgia and Florida down 5,000 head each. Again, the ranked states of Indiana, Vermont and Utah had their replacement heifer numbers lumped into the ‘Other States’ category, which consequently showed a gain of 7,000 heifers vs. year earlier when those states were not included in that category.
Beef replacement heifers and feedlot heifers are down a combined 10,000 head in Pennsylvania, while Virginia showed signs of beef herd rebuilding, reporting 4,000 more beef replacement heifers and 4,000 fewer heifers heading to feedyards.
Looking at the Mideast, Michigan had 5,000 more dairy heifer replacements, while Indiana’s numbers were unreported. Ohio is down in dairy heifers by 5,000 head. Beef replacement heifers in that region are up by 7,000 head and feedlot heifers are up by 3,000 head.
The Upper Midwest grew their dairy replacement heifer numbers, while the West significantly decreased them. Wisconsin is up by 10,000 head YOY; while Minnesota and South Dakota grew by 5,000 head each.
In the West, the following states with significant growth in milk cow numbers had significant losses in dairy replacement heifer numbers: Kansas down a whopping 35,000 head in dairy replacement heifers; Idaho down by 30,000 head; Texas, Pacific Northwest and Iowa down 10,000 each. Dairies in Kansas, Idaho, Texas, and Iowa contended with avian influenza in 2024.
Meanwhile, in California, New Mexico, and Colorado (all three having dealt with H5N1) the number of dairy replacement heifers was reported as unchanged YOY, but Arizona, which has not had H5N1, grew its dairy heifer numbers by 10,000 head.
USDA Economic Research Service graph
Trade is uncertain(Imports up, Exports leveling off)
Dairy and beef imports are growing, and the industry is responding to ‘tariff talk’ with statements showing fear of trade wars harming farmers or possibly gaining concessions in the context of Agriculture’s current annual trade deficit of $45.5 billion.
On Friday, Jan. 31, the spot cheese and Class III milk futures markets plunged lower in response to U.S. tariff announcements of 25% on goods from Canada and Mexico and 10% on goods from China.
This fear was short-lived, however, because the planned tariffs on goods from Canada and Mexico were promptly paused three days later on Monday, Feb. 3, when leaders agreed to support and combine efforts on U.S. border security, while putting teams together with the pledge to work through U.S. trade issues over the next 30 days.
The announced 10% tariffs on China went into effect Feb. 4, but discussions between the U.S. and China are said to be resuming for phase one of the trade deal struck in the prior Trump Administration just before the Covid pandemic hit globally.
Meanwhile, the total volume (not value) of dairy exports has leveled off on a total solids basis in the past two to three years as the U.S. exports more cheese and less skim milk powder and much less whey – the latter because we domestically produced less commodity SMP and far less commodity dry whey in 2024. Inventories are down for both, meaning domestic demand is using what is produced.
On the flip-side, the U.S. imported more cheese, butterfat, and whole milk powder during the first 11 months of 2024 YOY.
We will take a closer look at the trends in U.S. dairy farm numbers, production, and trade after final 2024 trade and production data are released in late February, and with more information, perhaps, on how U.S. agricultural trade policy may be shaping up for 2025.
Editorial Analysis: Tumultuous 2024 spills over into 2025 – Part Two
By Sherry Bunting, Farmshine, January 17, 2025
EAST EARL, Pa. – Year 2024 was tumultuous, and 2025 is shaping up to be equally, if not more so. Here’s a look at how supply, demand, and other market factors are shaping up for milk prices and dairy margins heading into 2025. This is part two of a four part series, see part one here and part three here.
We are a few weeks away from a few key yearend reports that will give us a better handle on production and cattle inventories, but the current market fundamentals favor a forecast for higher milk prices into 2025.
Better prices
In fact, the Jan. 10th World Agriculture Supply and Demand Estimates (WASDE) just raised by 50 cents per cwt the estimated 2025 All-Milk price average at $23.05 after having lowered it the month before.
Based on 11 months of official data, however, the January WASDE shaved another nickel off the 2024 average All-Milk price, now estimated at $22.60, which would be $2.20 higher than the average All-Milk price of $20.40 for 2023 but $2.80 lower than the decade’s high point of $25.40 in 2022.
At an estimated $22.60, the average All-Milk price for 2024 would be the fourth time in the past decade and the third consecutive year that the annual average All-Milk price was above the $20 mark. (Fig. 1).
Strong demand
Positive supply and demand fundamentals for 2025 include the reported strong domestic and international demand for cheese and butter; tighter than expected milk supplies; tight to adequate dairy product inventories; growth in year over year (YOY) sales of fluid milk; and strong domestic demand for skim solids in the form of nonfat dry milk, dry whey and whey protein concentrate coupled with reduced production of these products limiting the availability for export.
A sustained price rally in the CME spot market-clearing price for the market indicator product dry whey reached a multi-year high of 75 cents per pound by the end of the 2024 and is holding at near 74 cents per pound into mid-January. Trouble is, this market-clearing price has been tardy all year in translating to sales reported on the USDA weekly price survey used in the Federal Milk Marketing Order (FMMO) price formulas.
Despite the positive supply and demand fundamentals, we saw fourth quarter 2024 milk prices decline $1 to $1.50 from the year’s high point at $25.50 in September, and even though dairy products are holding steady on the CME spot cash markets, the CME milk futures markets took a tumble into below-$20 territory across the board this third week of the New Year.
So what’s the deal? Uncertainty.
Fewer cattle?
Uncertainty prevails about future cattle inventories after Sec. Vilsack canceled the mid-year 2024 Cattle Report last summer. The Jan. 1 Cattle Inventory Report comes out Jan. 31st. It’s unlikely to show any big surprises in the two-year trend toward reduced cattle numbers, including dairy replacement heifers. USDA says this report will give the trade an indication of producers retaining dairy heifers for their milk herds.
With prices skyrocketing $800 to $1200 per head above year ago levels for fresh cows and springing, bred, and open heifers, a sudden rise in replacement heifer numbers is unlikely.
Meanwhile, beef-on-dairy calves continue to give dairies an immediate $800 to $1000 check on a 3-day-old bull calf requiring very little input cost. That’s $900 in income per cow for dropping a calf, even before she starts her lactation.
The tug-of-war on breeding decisions for future dairy farm calf crops continues as the total U.S. beef and dairy calf crop, by the way, has already declined 1.6 million head in the two year period from Jan. 1, 2022 to Jan. 1, 2024. On Jan. 31st, we’ll see what the Jan. 1, 2025 numbers say.
Global trade
Uncertainty also exists around global trade amid ‘tariff talk’ against the backdrop of YOY growth in export volume, that is tempered by YOY growth in import volume. The January WASDE expects the trend of export volume growth to continue, but also expects the larger import volumes to continue. While the report specifically mentions cheese and butter, USDA FAS data show growth in the imported volume of skim milk powder, and especially YOY growth in whole milk powder (WMP) imports in each of the past four years.
FMMO changes
Uncertainty about the implementation of USDA Federal Milk Marketing Order (FMMO) price formula changes in the second half of 2025 that will impact risk management. The updated make allowances will trim class and component index prices by 75 cents to $1.00 against a CME milk futures markets that bases contracts on the FMMO formulas. That changeover will have to be dealt with.
Uncertainty about how new, efficient expansions of cheese and ingredient production capacity may be tied into sourcing from multi-site dairy farms that have planned expansions with internal heifer replacement models. What will be the impact on the rest of the industry when they start cranking out tons more cheese on the new and higher make allowance margin.
H5N1 impacts
Uncertainty about milk production trends after the impact of the bird flu outbreak in California dragged down total U.S. milk output well below expectations. The next report for December milk output will be released on Jan. 24th.
The January WASDE reduced its total milk production forecasts for 2024 and 2025, driven by “lower milk cow inventories and lower expected milk output per cow.”
This came on the heels of the November milk production report released in late December, showing California’s 9.3% drop in state-wide milk output, attributed to HPAI H5N1 hitting at that point half of the state’s dairy herds. This drove the total U.S. output down an unexpected 1% YOY.
The WASDE also forecasts “slower growth in output per cow” in its rationale for reducing the milk production estimate for 2025. This means what producers have been reporting is now showing up in the USDA data. Producers in areas hit by H5N1, especially California, report an initial 30 to 40% herd level production loss that only comes back about half-way, six to eight weeks later.
Producers also indicate a 2% increase in herd-level mortality and increased culling. Both veterinarians and producers in previously affected areas are now reporting impacts on dry cows and springing heifers, aborted calves, shaved production peaks, and emerging questions about milking performance in the following lactation.
According to APHIS data, as of Jan. 10, the virus was detected in 708 dairy herds in California since the outbreak was first reported there in September. That’s nearly 75% of the state’s dairies affected to-date. In the past 30 days, 66 California herds have been affected, with the most recent detection on Jan. 10.
Apart from the California outbreak, the only other detections of H5N1 on U.S. dairies in the past 30 days is one herd in Michigan on Dec. 30. This is good news, considering that 13 states have now been fully brought into the National Bulk Milk Testing Program announced on December 6th as a mandatory program for all 48 continental states.
Those initial states include California, Colorado, Indiana, Maryland, Michigan, Mississippi, Montana, New York, Ohio, Oregon, Pennsylvania, Vermont, and Washington.
Better margins
For 2024, the milk over feed cost margin only fell below the Dairy Margin Coverage (DMC) program’s highest payment trigger level of $9.50/cwt in the first two months of the year. In fact, Sept. 2024 saw the highest DMC margin on record at $15.57 with an All-Milk price of $25.50 and a feed cost at $9.93. Since then, Q4 margins have declined to $14.50 as the All-Milk price fell and feed cost remained fairly constant.
This measure does not account for the higher fuel and energy costs, higher labor costs, rising cost of insurances, higher interest rates on capital, and generally higher costs for other inputs that keep a dairy farm going.
Labeling games
Other market factors may increasingly play a sidebar role. On the demand side, FDA’s new draft rule on Jan. 14 requires front-of-package labeling (Fig. 2 example above), which in addition to listing grams of saturated fat and percent of total recommended daily value, will now use a rating system to mark the saturated fat content of foods and beverages as high, medium, or low as the outgoing Administration attempts to further push consumers into the low-fat Dietary Guidelines regime.
Despite the noise around low-fat and anti-animal, USDA reports strong demand for real beef and dairy, with whole milk the top volume growth category in the fluid milk market.
FDA also issued new draft guidance on Jan. 14 for ‘best practices’ in naming and labeling of fake plant-based foods that are marketed and sold as alternatives for animal-derived foods. This guidance applies to fake meat, eggs, seafood, and dairy products, but does not include the labeling of fake beverage milk. FDA reminded the trade of its 2023 draft rule for plant-based fake milk.
his follows the same pattern as the previous fake milk guidance – recommending that the plant-based food be “qualified by type of plant source” when using the name of a standardized animal product such as cheese or beef. (Fig. 3 above)
This is how FDA has treated fake milk for the past 15 years, by allowing for example, the ‘almond’ qualifier in front of the word ‘milk.’ The FDA’s 2023 guidance on milk, specifically, recommends, but does not require, additional nutrition statements to clarify nutritional differences.
Frankenfoods
Likewise, on the supply side, fake Frankenfood is emerging as FDA continues mulling a draft rule on what to call the products of lab-creation seeking to replace real animal-derived foods.
For dairy, this comes in the form of microbes bioengineered with bovine DNA to excrete fake dairy protein and fat analogs that USDA refers to as “precision fermentation protein products” while lab-created gene-edited cells growing into blobs of fake meat, egg, seafood, even dairy analogs are referred to as “cell-cultured” chicken, seafood, beef, dairy etc.
In late December, the USDA Economic Research Service (ERS) released its first ever report on “The Economics of Cellular Agriculture.” This means the Department has now recognized Frankenfood as part of the Agriculture domain. Yes, we’re talking about fake food from a factory, not a farm.
The 45-page ERS report notes that for 25 years, scientists in the public and private sectors have been “actively researching methods for producing food products that are physically and chemically equivalent to livestock- and poultry-produced foods (i.e., meat, dairy, eggs) but that minimally rely (if at all) on animals.”
By 2023, more than 200 private firms existed worldwide, and cumulative invested capital in the cell-culture and precision fermentation industries exceeded $5 billion. As of 2024, more than 100 patents have been filed. U.S. food agencies (FDA, USDA and FSIS) have been developing regulatory frameworks to accommodate and ensure the safety of these products, according to the report.
To-date cell-cultured fake chicken meat has been commercialized in Singapore and the U.S., largely through unique restaurant chains. This led to states like Florida banning the stuff.
Meanwhile, “precision fermentation-derived fake dairy protein analogs have been commercially available more broadly,” according to the ERS report.
These Frankenfoods tout smaller carbon footprints, less land and water usage, but ERS authors observe that, “Open questions remain concerning the design of bioreactors and important elements of the production process, including cell source, growth medium, and energy requirements, as well as the optimal size and configuration of production-processing plants.”
The report states so-called “precision-fermented dairy products are already on the market in the U.S., and, like their plant-based counterparts, sell for a premium over animal-based. For example, the company Perfect Day partners with other companies that sell products like ice cream and milk featuring their precision fermentation animal-free whey protein.”
In this way the fake dairy protein analogs are marketed as an ingredient in a business-to-business vs. business-to-consumer model.
According to the ERS, precision fermented protein products (fake dairy analogs) are increasingly available in U.S. markets, while cell-cultured products (fake meat and seafood analogs) are not.
Short run profitability, according to ERS, will rely on consumer willingness to pay for these products with current consumer attitudes described as “mixed.” But the labeling guidance remains unclear as the fake dairy protein analogs are actually the harvested excrement of the bioengineered microbes, not the DNA-altered microbes themselves. Consumers need to know what they are buying.
The ERS report also states that despite some of these companies and investors releasing bold lifecycle ecosystem claims, the “environmental impacts are largely unknown.”
Part III in a future Farmshine will look at the yearend reports due later this month.