Covering Ag since 1981. The faces, places, markets and issues of dairy and livestock production. Hard-hitting topics, market updates and inspirational stories from the notebook of a veteran ag journalist. Contributing reporter for Farmshine since 1987; Editor of former Livestock Reporter 1981-1998; Before that I milked cows. @Agmoos on Twitter, @AgmoosInsight on FB #MilkMarketMoos
By Sherry Bunting, republished from FARMSHINE NEWSPAPER, April 8, 2022
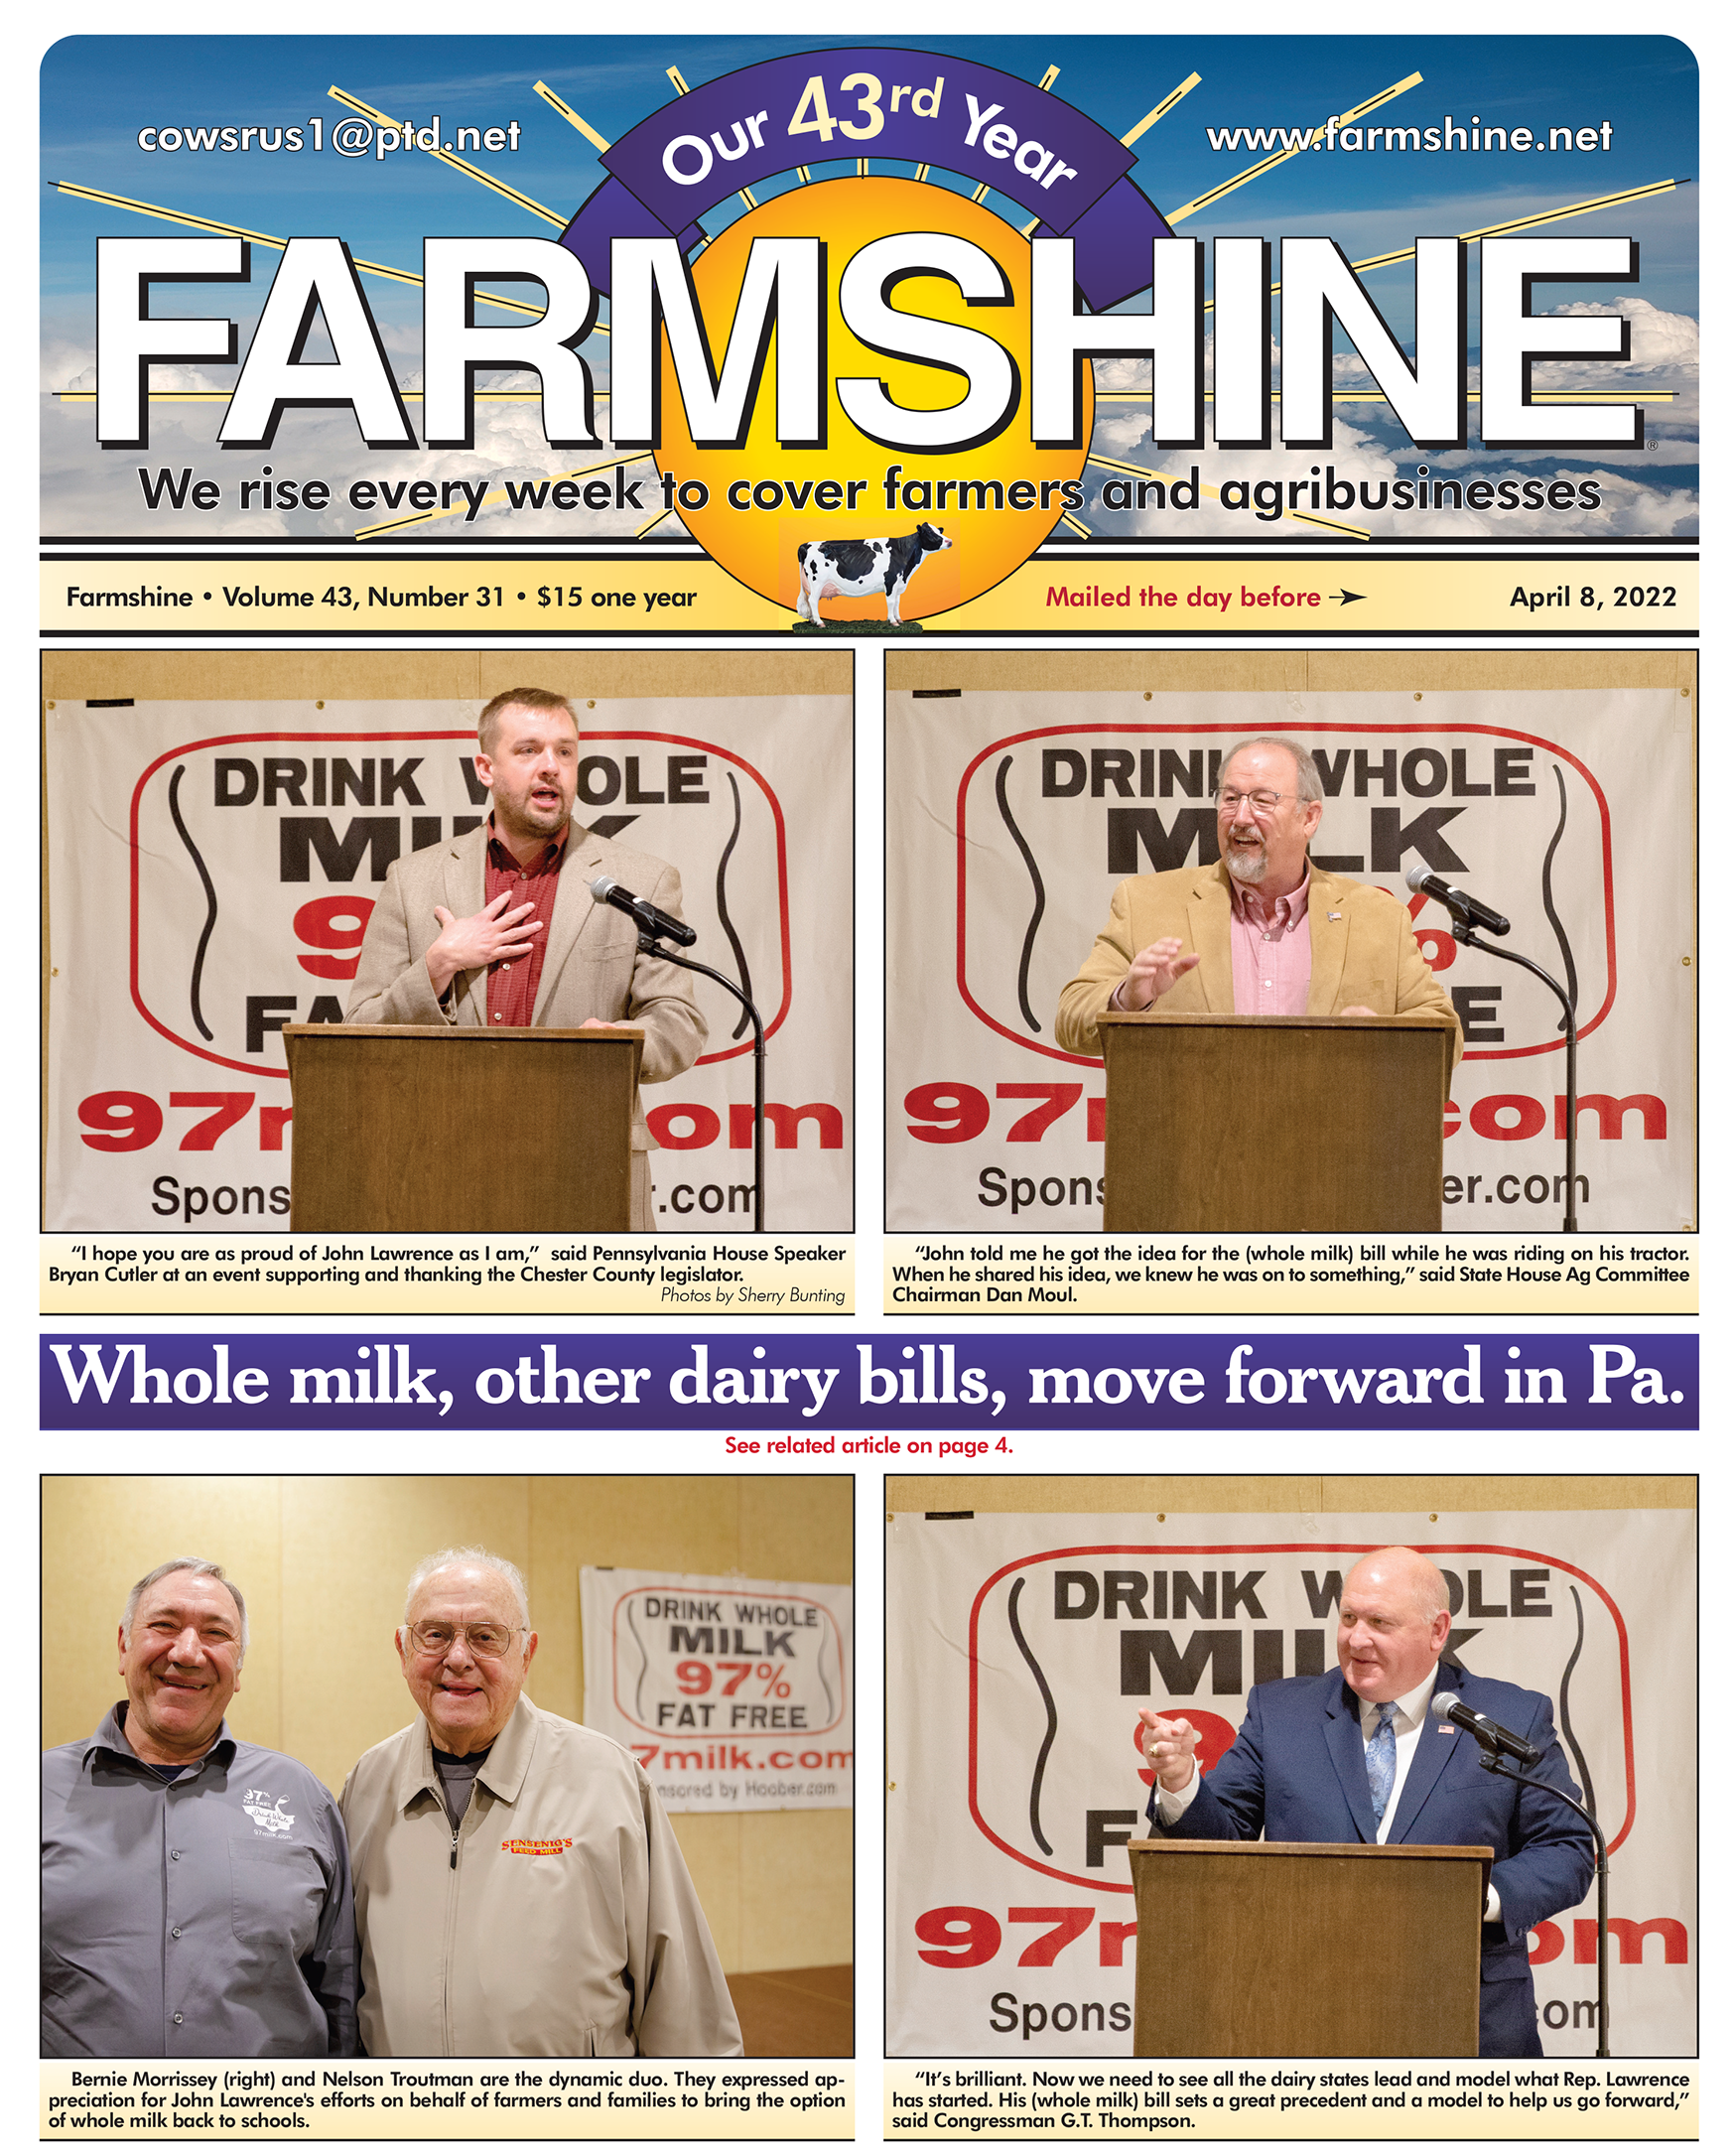
NEW HOLLAND, Pa. — Dairy farmers, agribusiness leaders, current and former legislators and friends came out to Yoder’s Restaurant here Monday (April 4) to support Pennsylvania State Representative John Lawrence of Chester County. He was lauded by his peers as a respected and knowledgeable leader on ag and dairy issues, someone who understands what farmers and other small businesses face, someone who continually brings good ideas to the table.
The fundraising gala was attended by around 50 people and raised more than $30,000 for Friends of John Lawrence, according to retired agribusinessman and dairy advocate Bernie Morrissey. He and Berks County dairy farmer Nelson Troutman, known for his painted round bales that launched the whole milk movement, along with other members of the Grassroots PA Dairy Advisory Committee, helped raise some of these funds from individuals in the community.
Efforts to end the federal prohibition of whole milk in schools was very much front-and-center in the luncheon discussion with enthusiasm shared by state and federal lawmakers on the progress of Rep. Lawrence’s bill seeking to deal with the issue at the state level – a powerful model for getting action at the federal level.
“We are all here because of how much we love John Lawrence,” said Kerry Golden, who took a personal day from her work with the House Ag Committee to support a leader she and others respect as much for his knowledge and hard work as for his humility.
Lawrence, himself, could not attend his own gala as he was recovering in the hospital from a medical issue. His father led the group in prayer for John, and local agribusiness leader Don Hoover led the group in prayer for elected leaders at local, state, and national levels.
“John told me he got the idea for the bill while he was riding on his tractor,” said State House Ag Committee Chairman Dan Moul. Lawrence has said he does some of his best thinking while mowing.
“He sits down with us and goes over his ideas, before putting them into words… he brought us these bills a couple months ago, and last week, we had what I call ‘Dairy Day’ in Pennsylvania and passed them out of our committee with bipartisan support to the House floor,” said Chairman Moul.
In addition to the whole milk bill (H.B. 2397), the other two bills include H.B. 223, which provides for Keystone Dairy Opportunity Zones, where new and existing processors can receive tax credits for processing expansion, and H.B. 224, which provides the Pa. Milk Marketing Board with additional authority to collect and distribute the state-mandated over-order premium.
“Too many times, that premium does not find its way back to farmers,” said Moul. “We are losing way too many dairy farms in Pennsylvania. We have a great industry here, and we need to save it.”
When Moul got to the whole milk bill, specifically, the room erupted in applause.
“While John was on his tractor, he came up with this idea. He finally figured it out. We’ve been wanting to do something on this ever since whole milk was taken out of schools under the Obama administration,” he said.
Congressman G.T. Thompson lauded the PA-Preferred framework of the bill in his remarks as well.
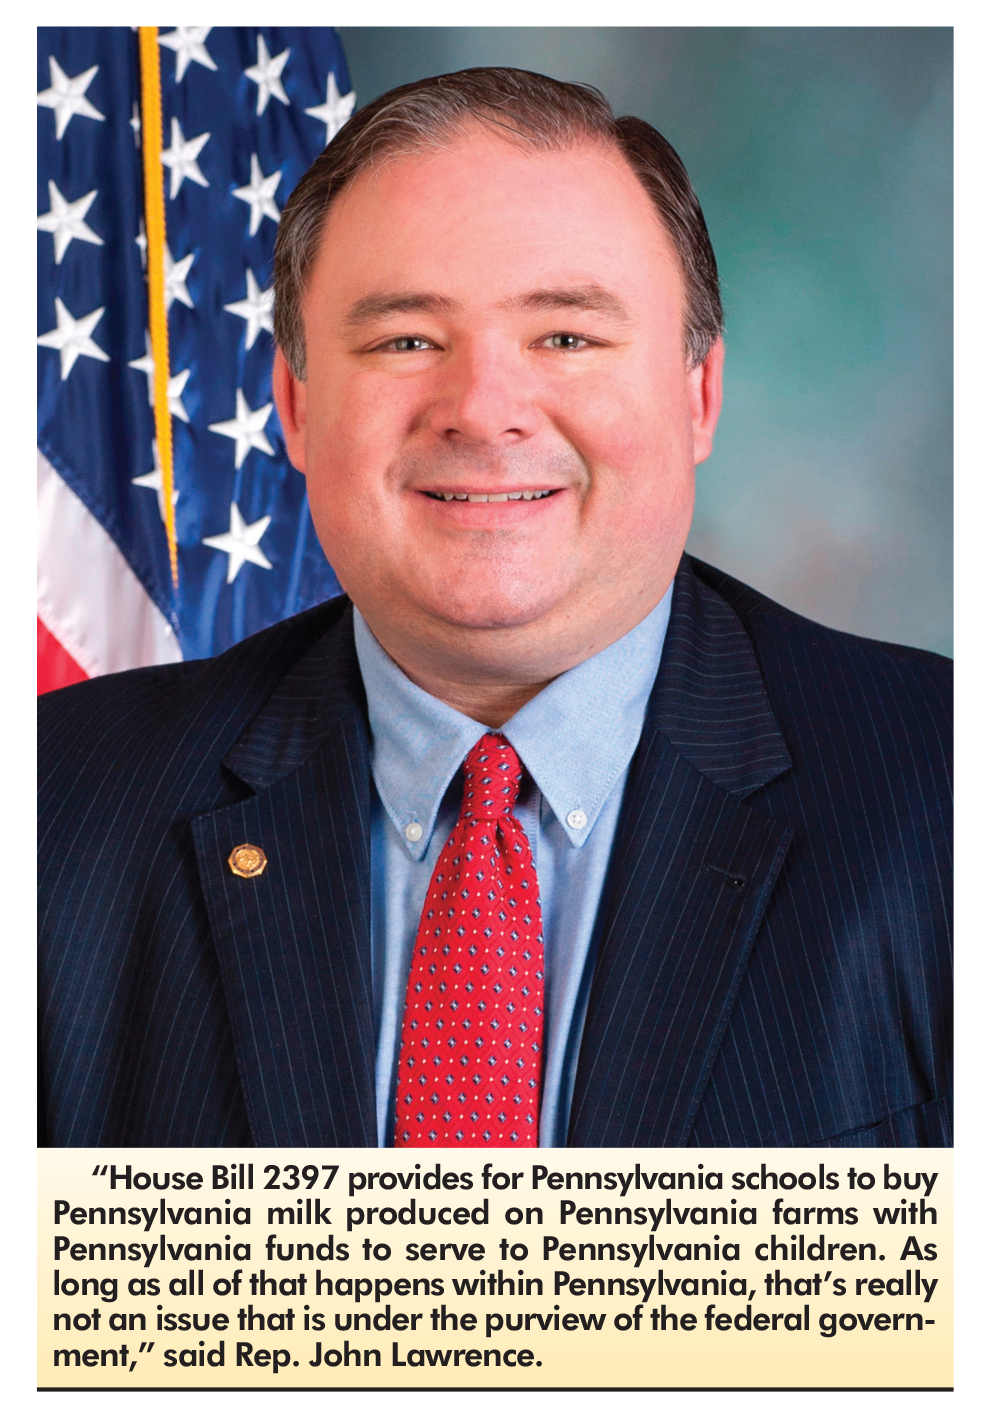
Bottomline, if the entire transaction from farm to school is intra-state, then the federal jurisdiction does not apply because the U.S. Constitution is silent on education and agriculture except where interstate commerce (sales between states) are concerned. That’s the basis of the bill, reported in detail in previous editions of Farmshine.
“When he shared his idea, we knew he was on to something,” said Moul. “The federal government can’t withhold funding from schools if this (whole milk) is intra-state. I give John the credit. He really thought it through. There is a time and place for government… but when it comes to nurturing, raising and what we feed our children, that’s no business of the federal government.”
State House Speaker Bryan Cutler of Lancaster County thanked the event attendees for supporting John, and he described John’s “servant’s heart.”
He said John is someone who wants to get the job done rather than concerning himself with who gets the credit for it.
“Sometimes government is what gets in the way,” said Cutler, noting the federal prohibition of whole milk in schools as a prime example of getting in the way of parents and schools with “their definition” of what’s healthy.
“John is someone who consistently rises to that challenge. I hope you are all as proud of him as I am,” said Speaker Cutler.
“We’re blessed in Pennsylvania,” said Congressman Thompson. “We are coming up on a challenging year, an election year. We need a strong State House and Senate.”
At the federal level, the stakes are equally high. In fact, if Republicans take back the majority in the U.S. House of Representatives this fall, Congressman Thompson, representing the largest geographic district in Pennsylvania and serving as Ranking Member of the House Ag Committee, could make history as the first Ag Committee Chairman from the Keystone State since 1859.
Thompson shared a bit of his vision for the Ag Committee, noting how important agriculture is, everywhere, representing one in every seven jobs in Pennsylvania, for example.
“We have to make sure we are doing the right policies to restore robust rural economies, to create the conditions to rebuild, repopulate, and regrow our rural communities,” said Thompson. “Agriculture is really a bipartisan issue. With inflation at 42-year highs, we are seeing high prices for commodities, but things are not so peachy. It’s the margin that makes the difference.”
He expressed concern about EPA regulations, the return of Waters of the U.S. (WOTUS), and other areas of impact to agriculture where politicians make decisions that don’t often make sense and cost farmers plenty.
“The world needs American farmers to increase yields when we look at what is happening in Ukraine,” said Thompson. “We’ve got to love these people standing up for freedom. They are the breadbasket of Europe with 40 million people but growing food for 400 million. We are hearing the grim news that by fall, we may see massive hunger and famine, starting in the Middle East.”
Thompson reflected on the ‘Arab Spring’ in 2011, when food scarcity played a large role in a series of anti-government protests in the Middle East after international food prices shot up, unemployment rose, and frustration with political systems peaked.
He cited predictions right now that people will flee these countries facing famine and arrive at the U.S. southern border. He said farm productivity in the U.S. will be essential.
“Food security is national security,” said Thompson, thanking ‘the Pennsylvania farm team’ of legislators and agriculturalists. “Everything we rely on is provided by our hard-working farmers, who deserve to earn a good living.”
As prime sponsor of the Whole Milk for Healthy Kids Act (H.R. 1861) in the United States Congress, Thompson also lifted up what Rep. Lawrence has done at the state level in Pennsylvania with H.B. 2397.
“It’s brilliant,” said Thompson. “It’s a formula for PA-Preferred. Now we need to see New York, Ohio, California — all the dairy states — lead and model what Rep. Lawrence has started.”
He explained that if other key dairy states would put forward similar legislation for whole milk in schools, it would be powerful in getting Congress to act on his legislation at the federal level and for the federal government to “undo the insult” it dealt to children when removing flavor and health from school milk options over a decade ago.
“Everyone blames Michelle Obama, but it was really the Congress under Speaker Pelosi who demonized milkfat. That 3 to 3.5% milkfat is what their bodies need. We’re standing with the children,” he said.
Thompson sees this as becoming a truly bipartisan issue, including bipartisan support for his bill at the federal level and the bipartisan action on it in the Ag Committees of the State House and State Senate. He said Lawrence’s bill “sets a great precedent and a model to help us go forward.”
As of April 6, 2022, Congressman Thompson’s Whole Milk for Healthy Kids Act (H.R. 1861) at the federal level has 93 cosponsors from 32 states but has not yet been taken up by the House Education and Labor Committee.
In the Pennsylvania State Assembly, Rep. Lawrence’s Whole Milk for Pennsylvania Schools Act (H.B. 2397) was passed unanimously out of the House Ag Committee on March 30th and is expected to be voted on by the full House after April 11 when they return to session.
Meanwhile, the State Senate Ag Committee unanimously passed S.B. 1181 on April 5th. This bill was put forward rapidly by Sen. Michele Brooks, representing Northwest Pennsylvania counties, and it precisely mirrors Lawrence’s House Bill. It could be voted on by the full Senate as early as this week.
(Author’s Note: Stay tuned on these whole milk bills and join me in prayers of gratefulness for the efforts of leaders like Rep. John Lawrence and for his healing and continued strength for the important work ahead.)
‘We need to figure outa way to get farmers’ voices incorporated into this discussion’
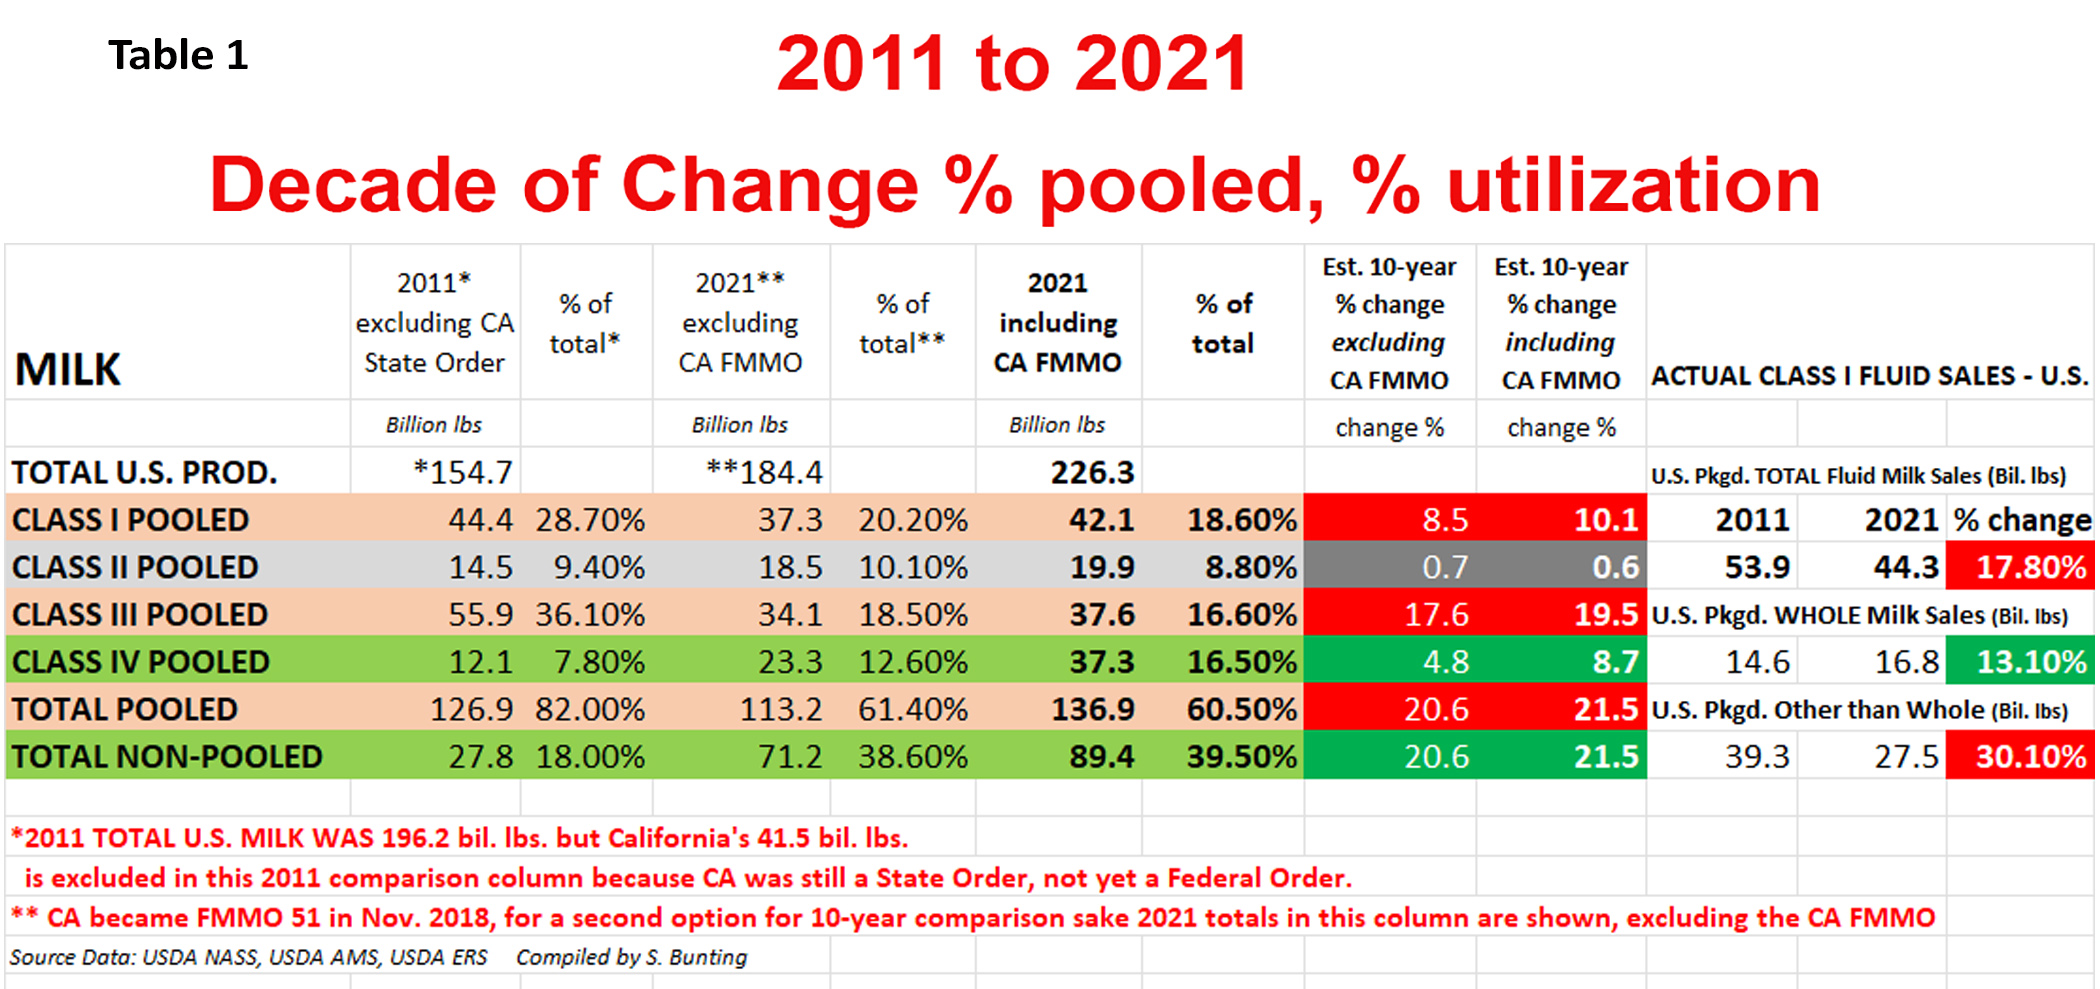
Table I reflects a decade of change in FMMO participation as total U.S. milk production grew 13.3% from 2011 to 2021, and the percentage of milk pooled on FMMOs fell from 82% in 2011 to 60.5% in 2021. California became an FMMO in 2018 after previously being a state order, so California’s production is not included in the 2011 pooling comparison so the pooling percentages are relative to production in FMMO and unregulated regions. Class I pounds as a percent of total production fell from 28.7% in 2011 to 18.6% in 2021. Figures for 2021 are shown both ways, including and excluding California to compare to 10 years ago when the number one dairy state had its own state order with different pooling and classification rules and incomplete data, but the percent of change is nonetheless eye-opening. Chart compiled by S. Bunting
By Sherry Bunting, published in Farmshine, Feb. 18 and 25, 2022
GREEN BAY, Wis. — Do dairy farmers want to save the baby, save the bathwater, change the flow of the bathwater, or tighten the plug on the drain before the bathwater drains to the point of taking baby with it?
That’s a brutal take after 90 minutes and a lot of information, starting with the basics and hearing perspectives and questions during the American Dairy Coalition’s Future of Federal Milk Pricing Forum on Feb. 15.
It was a first step in what ADC sees as a continuing conversation and effort to engage dairy farmers to lead the process. They said the next forum will be in March.
Geared specifically for dairy farmers, the forum attracted 160 participants from across the country, representing every element of the dairy industry — including dairy farmers.
The virtual format was moderated by Dave Natzke, markets and policy editor with Progressive Dairy magazine. Featured presenters were Calvin Covington, retired co-op COO with 45 years of experience in federal and state marketing orders; Frank Doll, a third generation Illinois dairy farmer involved in American Farm Bureau’s dairy policy committee, and Mike McCully, industry consultant on the IDFA dairy ingredients board and economic policy committee.
Included were comments presented by attendees, who pre-registered for three-minute slots. Others typed into the queue.
“This is complicated, and many people say it can’t be fixed, but we have a great amount of expertise and value here. We covered a lot,” said Laurie Fischer, CEO of ADC at the end of the forum. “We can’t just let this drop. We need to continue to move forward.”
“We heard a lot of good information that has everyone’s wheels turning,” added ADC president Walt Moore of Walmoore Holsteins, Chester County, Pa. He encouraged producers to reach out and engage to tackle the hard topics.
The goal of this initial forum was to inform dairy producers on the Federal Milk Marketing Orders (FMMO) and pricing process to become engaged and have a greater voice in guiding future policies.
For its part, American Farm Bureau Federation spent the past couple years going through a similar working group with policy recommendations coming from states to national and back to states.
Several commenters concurred with the position of ADC, Farm Bureau and other organizations that Class I pricing should return to the ‘higher of’ method until future policies can go through what could be a long hearing process of potential revision for the future.
In fact, one eye opener during the Forum was Doll’s confirmation that Farm Bureau policy now includes support for going back to the ‘higher of’ — plus adding 74 cents — in the calculation of the Class I mover price, while remaining open to other ideas.
Doll said consensus was hard to find in the Farm Bureau working group of 13 members from across the country due to regional differences in the makeup of processing. But general recommendations found agreement, including the reference to Class I as well as modified bloc voting where co-ops can vote for their members on Federal Orders, but farmers can cast their own votes and be encouraged to do so.
Several attendees cited the need for a vehicle for producers to have real input without fear of retribution, that farmers should collectively ask questions of their cooperatives, seek better representation and together, hold their cooperatives accountable to represent their interests.
“We need to figure out a way to get farmers’ voices incorporated into this discussion. I hear from producers all the time, but there is fear of retribution, the threat that your milk is not going to get picked up. If you are on a board and speak up, you’re not there very long,” said Kim Bremmer, representing Venture Co-op in Wisconsin, a third-party ‘testing co-op’ qualified by USDA.
She addressed bloc voting, saying: “What’s the point of having a hearing if producers can’t vote? We don’t have great representation from some of the groups that say they represent us.”
Bottomline, said Bremmer: “We have to address how to get more of the producer voice and not just the processor voice — because they’re not the same.”
She asked: “Is it a conflict of interest if you’re a processor and you’re marketing milk and you’re also advocating for producers? I think that’s an important question that needs to be answered. We need to stay engaged in this and be able to ask the tough questions and demand some answers.”
ADC’s Fischer said the organization wants to work with farmers and their state and national organizations to provide a vehicle to bring farmers together and compose a list of pricing policy items to explore further with experts.
One clear change in the dairy industry formed the crux of the discussion: The growth of milk production in the U.S. — in concert with growing export sales and declining fluid milk sales — put export sales volume above Class I volume as a percentage of total milk solids in 2021.
McCully described this as “a seismic change.”
Covington confirmed that Class I sales — as a percentage of total milk production — fell below 20% in 2021. The percentage of Class I milk within the 137 billion pounds pooled on 11 FMMOs in 2021 was about 30%.
Contrary to the widely held belief that FMMOs regulate a majority of the milk, they simply do not. Covington confirmed that the 137 billion pounds of milk pooled on 11 FMMOs in 2021 represents only about 60% of U.S. milk production.
The FMMOs aren’t designed for this direction that the dairy industry is going toward global markets, according to McCully.
He said the world will look to the U.S. as the “go-to market,” claiming New Zealand and the EU are maxed out. He described the “white gallon jug” as being the most prime example of a low-margin commodity and predicted ‘value-added’ products will return more dollars to farmers in the future. These are recurrent themes heard from speakers at winter meetings this year.
(Author’s note: In contrast, current industry-wide discussion on the ‘sustainability’ side is for a ‘stable’ U.S. cattle herd to be an indicator of dairy’s climate neutrality. If exports grow, and the U.S. herd remains ‘stable’, then export milk will have to come from growth in output per cow and displacement of Class I production. One can see how geographic camps can set up, since fresh fluid milk sales are vital to the viability of dairy farms in areas outside of the earmarked growth areas for dairy manufacturing in the Central U.S. — the question is how to bridge it.)
At the same time, dragging feet doesn’t seem to be much of an option.
If dairy policy remains ‘status quo,’ leaving the FMMOs ‘as-is,’ they could eventually cover less and less milk and potentially collapse, according to McCully.
Covington also addressed this, noting that FMMOs “were designed for fluid milk, but today, fluid milk is a minority use. People used to drink their milk, now they are eating their milk.”
McCully noted the need for dairy innovation. He said make allowances have facilitated large-scale commodity plant construction supplied by large-scale farms, suggesting it is these built-in make allowance ‘margins’ that favor commodity production and deter innovation.
“If end-product pricing continues, the make allowances will have to be raised,” he said, citing a new make allowance study “fresh off the press.”
In 2019, USDA commissioned Dr. Mark Stephenson, dairy economist at University of Wisconsin-Madison, to do the study. Stephenson recently announced it is complete and will soon be released by USDA. McCully’s glimpse at the report shows make allowance calculations to be “significantly higher” than the amounts embedded currently in end-product pricing formulas.
Western Pennsylvania dairy nutritionist Harry Stugart offered his concise, data-driven argument that the make allowances be removed from the formula for the ‘advance’ Class I mover price because these make allowances do not pertain to fluid milk. In January 2022, he said they amounted to $2.67 per hundredweight.
Another crucial part of the discussion was how FMMOs actually work and what they do, besides pricing.
Covington gave attendees a primer of key points to think about as discussions move forward. What he shared may be old news to some, but it’s surprising how many people do not know these facts:
— FMMOs are not required by law, they are simply “enabled” to exist by law. This means producers vote to have them (California in 2018) or to terminate them (Idaho 2004).
— Only Class I fluid milk plants are required to be regulated under FMMOs.
— Class II, III and IV plants participate voluntarily, and they tend to do so “when it’s economically feasible.” Rules of participation vary from Order to Order.
— FMMOs establish other things besides minimum pricing for regulated plants. This includes setting payment terms, providing market information and market services such as testing and auditing.
— The last FMMO reform (2000) was complicated and took four years. It was a combination of legislation (1995 Farm Bill) and an administrative rulemaking process.
— Today, there are four classes of milk, but that was not always the case.
— Today, the Class I mover (base price), as well as the Class II, III and IV prices are established to be the same in all FMMOs, but in the past different FMMOs had different mechanisms.
— Cooperatives are not required to pay FMMO minimum prices even if they own regulated Class I plants because cooperatives are viewed by the FMMOs as one big producer and can make their own decisions about distributing the revenue received to their farmer-members.
— Today, over half of the Class I fluid milk plants in the U.S. are either owned by cooperatives or by large retail supermarkets. Over the past 60 years of consolidation, FMMOs have gone from regulating 2250 fluid milk plants in 1960 to just 225 in 2021.
— Cooperatives balance the Class I market at a cost. Excess milk can go to unregulated buyers at a price that is several dollars below the minimum price. Some co-ops run their own balancing plants. These costs can result in paying farmers below minimum price.
“Milk pricing should return a fair cost to producers, processors and retailers. A chain is only as strong as its weakest link,” said Sherry Bunting, speaking on behalf of the Grassroots PA Dairy Advisory Committee. She also highlighted the Whole Milk for Healthy Kids Act, H.R. 1861, explaining how support for this legislation is essential — no matter how milk is priced.
“In the process of working on this legislation, our (Grassroots PA) committee has identified other concerns. It is hard for producers to advocate when even such a simple and good thing as whole milk in schools is rebuked,” said Bunting. “Farmers hear from leaders and inspectors: ‘If we sell whole milk in schools, do you think we can just stop making cheese and other products?’ Or ‘All you are doing is disrupting markets and creating a butterfat shortage.’ Or ‘Be careful what you wish for.’ These are veiled threats.”
Bunting highlighted the need for greater competition, accountability, transparency and timeliness of price reporting.
“Dairy farmers have farms to run, cows to care for, and they become paralyzed by the complexity and lack of transparency in the system and their milk checks. They become overwhelmed and unconfident, even fearing retribution,” she said.
“We have members with attorneys that cannot interpret their milk checks. That has to stop,” said Bremmer. “Why wouldn’t processors want to show farmers what they are paying them? What is the reason? To have attorneys and others looking at it and they can’t figure it out, that’s a real problem. We think they’re probably re-blending some things to make another ‘make allowance’. We know these things are happening all across the United States.”
Payment terms are critical in this conversation. Even the best-made plans for risk management mean nothing if farmers don’t receive timely and consistent payments for their milk due to the high capital costs and cash flow needs of running a dairy farm.
One commenter said farmers want their income to come from consumers, not from the federal government. He wondered why Federal Milk Marketing Orders (FMMOs) are even needed to guarantee payment.
“Why? So you get paid,” replied panelist Covington. “The FMMOs all establish dates when advance and final payments are made. Having been a co-op manager working with fluid milk plants, I can’t emphasize enough how important this is.”
He also pointed out the important auditing, weights and measures, and market information the FMMOs provide.
McCully said these other services provided by FMMOs are “something we need more of going forward. We need less (price) regulation and more (market) information,” he added. “What’s not working is the milk pricing.”
Here’s where the crux comes into play: The FMMOs are not set up to regulate a global product market, and the industry has set its sights on exporting even more. This is leading the dairy industry to look at how other countries price milk as it relates to the U.S. pricing system and its ability to “be globally competitive.”
As the percentage of Class I sales have declined in relation to growth of U.S. milk production over the past decade, the percentage of milk pooled on FMMOs has also declined from 82% in 2011 to 60% in 2021 (See Table I).
Covington explained how pooling plays out within the FMMO system: “A regulated plant is required to pay its direct shippers and any co-op supplying milk a minimum blend or uniform price. Each Order takes the revenue from each class at the minimum price and pulls it together into one pool to come up with the uniform price.”
He said Class I differentials “have two purposes, to move milk to fluid use and to gain additional revenue for dairy farmers.” They range from $1.60/cwt in the extreme northern U.S. to $6.00/cwt in Miami, Florida and are added to the base Class I mover price.
The regulated Class I plants pay the difference between the uniform price and the Class I minimum price into the FMMO. Other class plants voluntarily participate to take a draw from the FMMO to add to what they pay their producers. That’s how it has worked most of the time – until now.
Diminished Class I sales as a percentage of total milk flip this switch, and the 2018 Farm Bill change to averaging Class III and IV skim plus 74 cents — instead of the ‘higher of’ — along with the advance pricing element, have increased the de-pooling pressure on this system, especially during times of volatility.
When asked about wide price inversions that occurred in some months over the past two years, both Covington and McCully observed the impact on bottlers paying above minimum prices to attract milk away from then higher-value Class III.
In thinking about the future, Covington reminded attendees of the past. He said at one time some Orders had individual handler pools — not marketwide pools — a nod to the idea of how FMMOs could continue to regulate Class I, if handlers in the other classes lose interest in participation.
Back when California was a state order, virtually all milk was pooled. Plants had to make decisions about pooling annually by January 1.
McCully contended that this scenario led to dumping of milk and inefficient transport to other areas. According to his analysis, the idea of making the pooling rules more restrictive and uniform across all FMMOs would lead processors to completely leave the system, and they can do that because their participation is voluntary, except for Class I.
Risk management was on the mind of several commenters, including Doll. He pointed out how the ‘holes’ in the Class I pricing change were exposed by the pandemic volatility. (Significant losses to Class I value are occurring again in the February and March 2022 Class I price.)
Joining Doll as a fellow Illinois dairy farmer was Bryan Henrichs. He said the class price inversions during the pandemic left many farmers on the losing end of what they thought were ‘safe’ $18 Class III forward contracts. The up to $9 negative PPDs kept them from achieving that price when the Class III price exceeded the contract level, but the farmer didn’t receive that price in the milk check — a double whammy.
Henrichs and others noted that milk should be priced competitively and simplified. Henrichs mentioned the idea of pricing milk at one price — no matter what it is used for — allowing market participants, including farmers, to manage risk and trade location basis, like for corn.
Arden Tewksbury’s comments from Progressive Agriculture Organization based in Meshoppen, Pennsylvania were presented by Carol Sullivan — highlighting the need for cost of production in the pricing equation, along with a realistic supply management program.
Annual FMMO pooling decisions (instead of in and out), and his longtime support for whole milk in schools were other key points offered by Tewksbury.
One attendee stated that if processors are looking to raise their ‘make allowances,’ why not add a ‘make allowance’ for producers?
On cost of production, McCully pointed out that the range is wide between a 50,000-cow dairy in western Kansas and a 40-cow dairy in northern Vermont, for example. He said interstate movement of milk and the fact that FMMO participation is voluntary for over 80% of the milk outside of Class I creates issues for using a blanket national average cost of production.
McCully said ‘cost-plus’ contracts are being used today by some processors and producers, but this is only for milk sold outside of the FMMO system.
As confirmed by Covington, 40% of the U.S. milk supply was priced outside of the FMMOs in 2021. He said this could increase as Class I becomes a smaller slice of the growing pie, especially in areas of the country where Class I is already quite small.
Milk Market Moos, by Sherry Bunting, is a weekly feature in Farmshine. Portions are republished below with the prices updated to Fri., Feb. 25 after the print edition went to press Wed. evening, Feb. 23.
Milk production in all U.S. states collectively during January fell by 1.6% vs. year ago. In the 24 major reporting states, the decline was 1.4%. December’s production was also revised lower than the estimate last month.
January’s production decline came from a combination of reduced output per cow and 63,000 fewer cows compared with a year ago. Cow numbers in January are 5000 fewer than December.
This trend could go on for some time, as we noted recently in this column, that the Jan. 1 semi-annual All Cattle and Calf Inventory Report recently showed a 1% decline in milk cow numbers compared with Jan. 1 2021 and a whopping 3% decline in replacement dairy heifer numbers vs. year ago.
The 2021 production total for the U.S. was also released in the Feb. 23 USDA Milk Production Report showing last year’s U.S. milk production total was 1.3% above 2020.
At the same time, the average number of licensed herds in the U.S. during 2021 (not an end-of-year number) was reported at 29,858 — down 1,794 compared with the average number of licensed herds in 2020 and the first time the number fell below 30,000.This is a 5.7% decline in the average number of licensed dairy herds nationwide. In 2020, there was a 7.5% decline as the nation lost 2550 dairy herds that year.
In the Northeast and Midatlantic milkshed, among the major reporting states, Pennsylvania’s production was 2.9% below year ago in January with 6000 fewer milk cows on farms; 2021 production in the Keystone state was 1.6% below 2020 and the average number of cows on PA farms last year was 8000 fewer than in 2020.
January’s production in New York was down 0.6% with 5000 fewer cows; 2021 production in the Empire State was up 1.6% with the average number of cows on NY farms in 2021 numbering 1000 more than in 2020.
Vermont’s cow numbers fell by 1000 head in January 2022 vs. Jan. 2021 and milk production was off by 1.8%; 2021 production in the Green Mountain State was down 1.4% vs. 2020 with 2000 fewer cows as an average for the year.
The average number of licensed herds in Pennsylvania in 2021 was 5200, down 230 from 2020 (4.3% drop); New York 3430, down 220 (6% drop); and Vermont 580, down 60 (a 9.4% drop); Virginia 421, down 54 (11% drop).
In the Southeast milkshed among major milk producing states, Florida’s average number of herds was 75 in 2021, down 10 from 2020 (11.8% drop); Georgia 110, down 20 (15.4% drop). Production and cow numbers were mixed with Georgia growing output by 1.4% in 2021 vs. 2020 with 1000 additional cows; Florida’s production declined 5.1% with 5000 fewer cows, and Virginia’s production was down 3.4% with 2000 fewer cows.
Georgia’s production last month was up a whopping 5.1% as one of only 5 states to show a year over year production increase in January 2022 with 3000 more cows than a year ago even though the number of farms fell by over 15%.
By contrast, January’s production totals in Florida and Virginia were down 3.5% and 3.8% with 4000 and 3000 fewer milk cows, respectively.
Four other states gained production in January vs. year ago, (in addition to Georgia). They were: Iowa, up 1.7% with 3000 more cows vs. year ago; Idaho up 0.6% with 4000 more cows, Texas up 3.5% with 12,000 more cows, and South Dakota up a whopping 18.3% with 28,000 more cows.
The two largest milk production states saw a pullback in January: Wisconsin’s production was off fractionally while California, the largest producing state, saw a 1.9% decline in year over year production in January.
New Mexico’s trend deepened. 2021 production was 4.5% lower than 2020 with 12,000 fewer cows. In January 2022, production was below previous year by 12.1% with 42,000 fewer milk cows. New Mexico’s average number of licensed herds in 2021 came in at 120, down 20 (down 14.3%).
Texas also saw 20 fewer licensed herds last year, at 340 (down 5.6%). However cow numbers grew 27,000 in in the Lone Star State during 2021 with production beating 2020 by 5%.
Texas officially surpassed New York as the 4th largest milk producing state with 15.6 billion pounds of milk vs. New York’s 15.5 billion pounds in 2021. The January 2022 figures show 12,000 more cows and 3.5% more production vs. year ago in Texas.
South Dakota lost 15 herds at an average 165 for 2021 (down 8.4%). However, South Dakota gained 21,000 cows and 15.5% in milk production for 2021 vs. 2020. Neighboring Minnesota, the 7th largest milk producing state gained 13,000 cows and 3.7% in production in 2021 at 10.5 billion pounds — putting more daylight ahead of Pennsylvania, the 8th highest producing state at 10.1 billion pounds in 2021.
Look for more analysis of the yearend report in the next print edition of Farmshine and here at agmoos this week.
Cl. III and IV milk futures mixed,12-mo. Cl. III avg. $21.51, IV $23.25
Class III and IV milk futures were mixed when Farmshine went to press at midweek, Feb. 23 — before global reports showed a shrinking milk supply and before the Russian invasion of Ukraine commenced. Figures in the Farmshine print edition of Milk Market Moos have been updated using milk futures quotes at the close of Friday, Feb. 25 trade below.
Class IV split the trend with first half 2022 steady to lower, second half firm to higher, while Class III was mostly higher, except March and April contracts under downward pressure. In the Class III trading, new contract highs were set for August through December 2022.
The bullish USDA milk production report came out at the close of CME trade on Feb. 23 — prompting after hours trade to tick higher Feb. through Aug. by 25 to 65 cents on Class III, strengthening further at the end of the week on news of global supply deficits tempered by the uncertain impacts of war in Eastern Europe.
Class III milk futures recouped twice as much as was lost last week, averaging $21.63 for the next 12 months on the close of trade Wed., Feb. 25. This is 29 cents higher than the average a week ago,
Class IV futures averaged $23.46 for the next 12 months, generally steady at midweek compared with the previous week’s average, but gaining 22 cents Thursday and Friday on the average.
The average spread between the Class III and IV milk futures contracts for the next 12 months Feb. 2022 through Jan. 2023 stood at $1.83/cwt on Feb. 25 — 10 cents narrower than a week ago with Feb. through August contracts $1.80 to $2 apart and narrowing to right around the $1.48 threshold by September.
CME spot dairy commodities lose ground
CME spot dairy prices moved higher on Class III products (cheese and whey) before turning lower at the end of the week. For Class IV products (butter/NFDM) the trend started lower and continued lower through week’s end.
By Fri., Feb. 25, butter lost two-thirds of last week’s huge gain, pegged at $2.5785/lb with 2 loads trading. This was 20 cents lower than the previous Wednesday, with 8 cents of the loss occurring in a single session Friday.
Grade A nonfat dry milk (NFDM) lost 5 pennies this week then gained one back on Wed., Feb. 23 when the spot price was pegged at $1.86/lb — down 4 cents from a week ago with 12 loads trading. Thursday’s trade saw a penny and a half increase, which was lost Friday, to end the week at $1.86/lb.
On the Class III side of the ledger Wed., Feb. 23, 40-lb Cheddar blocks were firm at $1.99/lb, gained 3 cents Thursday, but lost 7 cents Friday, Feb. 25, when 40-lb blocks were pegged at $1.9450/lb, down 4 1/2 cents from a week ago with a single load changing hands; 500-lb barrels at $1.90/lb were 1 1/2 cents lower than a week ago with 2 loads trading Friday.
The spot market for dry whey gained a penny, at 81-cents on Wed., Feb. 23, with no loads trading, but then lost 3 cents in end of week trading, pegged Fri., Feb. 25 at 78 cents, no loads traded.
Grain market rallied
Corn rallied 10 to mostly 30 cents per bushel higher last Wed., Feb. 23 on the eve of the Russian invasion of Ukraine, most strength near term; soybean meal $10 to $30/ton higher with far off contracts $5 to $10/T higher than a week ago. Those levels followed wheat higher on the news in the wee hours of Thursday morning of the Russian invasion of Ukraine, a global exporter of wheat, corn and other grains and oilseeds, number one crop being sunflowers.
By Friday, Feb. 25, the run-up had tamped down, but with near-term contracts still much higher than a week ago — May corn closed at $6.55 down from highs over $7 the previous day; May soybean meal closed at $442.70 Friday.
Auction prices for market cows, calves, dairy fats backoff a bit after big gains two weeks ago
Market cows, fat dairy steers, and return to farm Holstein bull calves, especially beef crosses, jumped significantly higher two weeks ago and edged off a bit in the Feb. 17 to 22 auction market trade in Lancaster County. Choice and Prime Dairy steers averaged $115.00, Breaking Utility cows $81.10, Boning Utility $74.50, Lean cows $65.75. Holstein bulls 90 to 125 lbs averaged $143.00 with beef crosses bringing more than double, averaging $340.00; 80-100 lb $130.00, beef crosses $280.00.
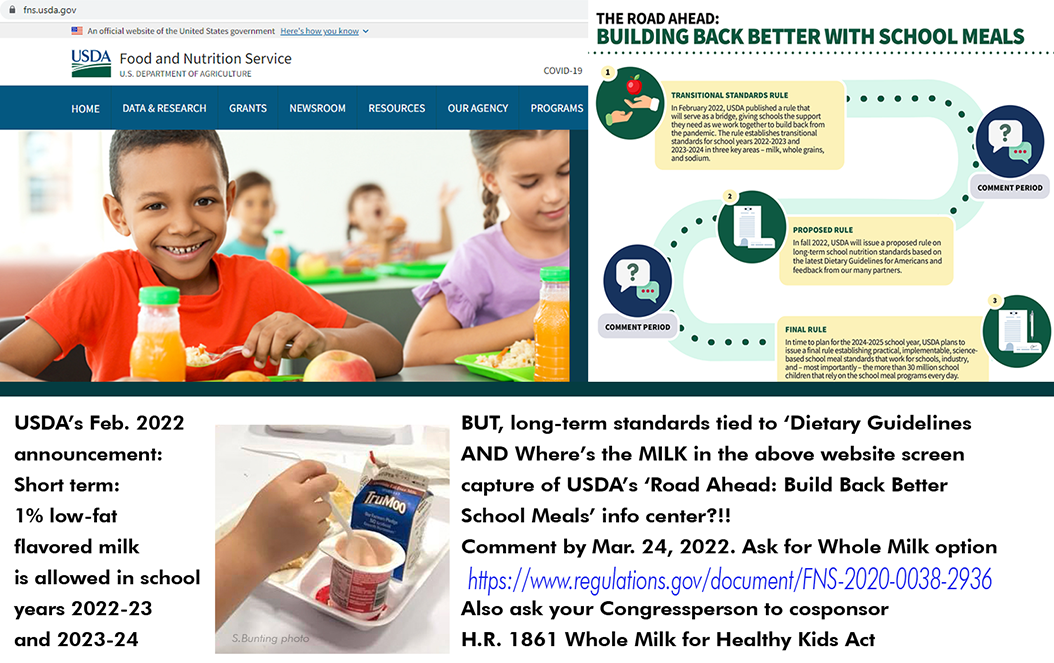
Photo credit (Top) USDA FNS website screen capture from https://www.fns.usda.gov/building-back-better-school-meals and (bottom) fat-free flavored milk and fat-free yogurt on a local school lunch tray. Screen capture and lunch tray photo S.Bunting
By Sherry Bunting, published Farmshine, Feb. 18, 2022
WASHINGTON — As reported in the Feb. 11 Farmshine, USDA announced a ‘transitional standards’ rule on Feb. 4 for milk, whole grains, and sodium for school years 2022-2023 and 2023-2024.
The transitional standards are only in place while USDA works with stakeholders on long-term meal standards through a new rulemaking.
The proposed rule for the longer-term is expected to come from USDA in fall 2022 and will become effective in school year 2024-25. It will be based on the Dietary Guidelines for Americans 2020-2025, but USDA says it is conducting a public comment and review process related to the standards and to the “gradual implementation” plan it will develop based in part on stakeholder input.
In the official transitional standards rule, USDA notes that full implementation of its 2012 meal pattern requirements for milk, grains and sodium have been delayed at intervals due to legislative and administrative actions. “Through multiple annual appropriations bills, Congress directed USDA to provide flexibility for these specific requirements.”
Now is the time to comment before March 24, 2022 and to call for an end to the prohibition of whole milk in schools. Request that USDA restore the choice of whole milk in schools by commenting at the online rulemaking portal https://www.regulations.gov/commenton/FNS-2020-0038-2936
Comments and questions can also be sent to: Tina Namian, Chief, School Programs Branch, Policy and Program Development Division—4th Floor, Food and Nutrition Service, 1320 Braddock Place, Alexandria, VA 22314; telephone: 703-305-2590. Include FNS-2020-0038-2936 in your correspondence.
In a rare move Feb. 7, the American Association of School Superintendents (AASA) made a public media statement on the transitional standards — pointing out their concern that the long-term standards will be ‘more stringent’ due to the restrictive Dietary Guidelines that were approved by USDA and HHS in 2020.
The Association of School Superintendents stated: “It is important to acknowledge that healthy meals are only healthy if students eat them.”
Agreed! This applies to the milk also. Students miss out on 21 minerals, 13 vitamins, complete high quality protein, a healthy matrix of fat and several nutrients of concern when they don’t actually consume the milk offered or served at school. Those nutrients ‘on paper’ are then not realized. Many key nutrients of concern are also fat-soluble. A study at St. Michael’s Children Hospital, Toronto, showed children consuming whole milk had 2.5 to 3x the Vit. D absorption compared with those consuming low-fat milk, and they were at 40% less risk of becoming overweight! Details were presented in a June 2021 hearing in the Pennsylvania Senate, listen here
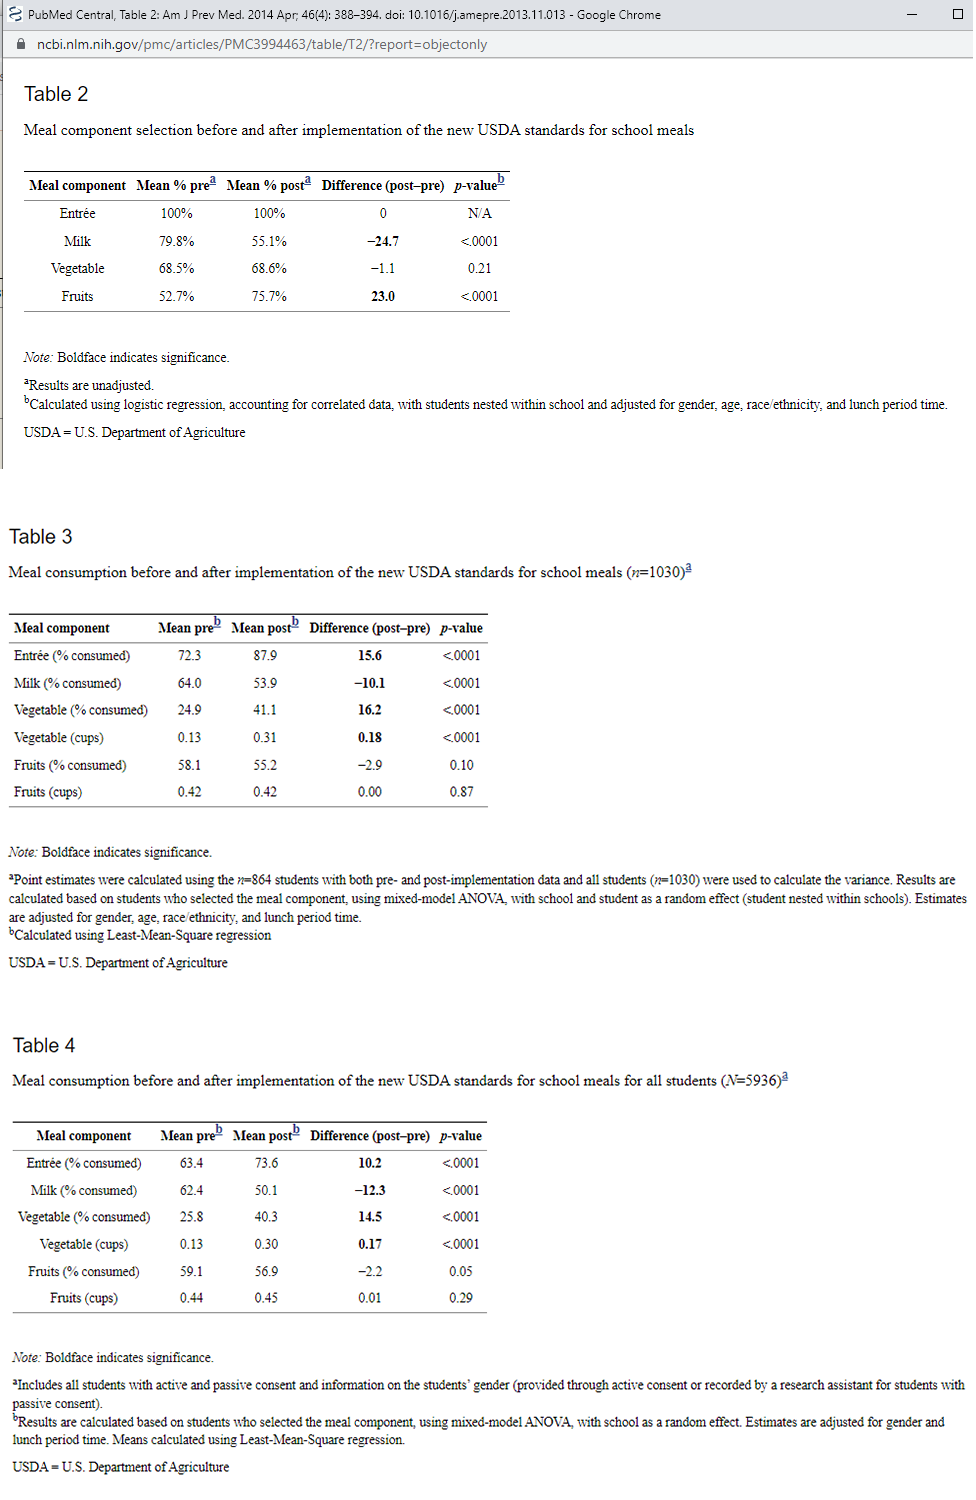
Milk consumption plummeted and waste skyrocketed since USDA’s 2012 fat-free/low-fat milk rules were set for both ‘served’ milk and competing a la carte offerings. Studies by USDA and others show milk is now one of the most discarded items at school. In fact, USDA did a plate waste study comparing 2011 to 2013 (pre-/ and post-change) They focused on fruits and vegetables, but saw milk decrease significantly, waiving it off as though it were due to an “unrelated policy change.” Technically, it was the smart snacks rules for beverages and it WAS related to the 2012 standards as both were implemented together.
See the losses in Tables 2 through 4 below in ‘selection’ and ‘consumption’ of milk from the USDA study reflecting a 24% reduction in student selection of milk (offer vs. serve) after the 2012 fat-free/low-fat implementation and 10 to 12% reduction in consumption among those students being ‘served’ or selecting the restricted fat-free/low-fat white milk option or fat-free flavored milk option. That’s a double whammy for childhood nutrition and for dairy farm viability. Since 2012, at least one generation of future milk drinkers has been lost.
Charts above are from a USDA study published in 2015 to assess school meal selection, consumption, and waste before and after implementation of the new school meal standards in 2012. Those standards impacted a la carte offerings as well as beverages, not just served meals. The method for the USDA study was: Plate waste data were collected in four schools in an urban, low-income school district. Logistic regression and mixed-model ANOVA were used to estimate the differences in selection and consumption of school meals before (fall 2011) and after implementation (fall 2012) of the new standards among 1030 elementary and middle school children. Analyses were conducted in 2013. The authors note that prior to the full implementation of new nutrition standards in 2012, a variety of fat levels of milk were offered to students and no restriction upon flavored milks. See the report here—– Additionally, a PA school trial offering all fat percentages, including whole milk, revealed a 52% increase in selection of milk and 95% reduction in discarded milk, netting a 65% increase in consumption of milk in 2019.
“Everyone prices milk differently depending on what they want you to do,” he said, showing a scattergram of milk check data from various coops and buyers.
“It’s impossible to compare it,” Bozic declared, noting that in Australia, all milk pricing data are public so anyone can see how everyone compares in payment by region. In Ireland something similar is also done, where each buyer’s protein and butterfat price is published as well as a price for the liquid portion.
“They see what different processors pay. They don’t have Federal Orders. This transparency keeps everyone honest,” said Bozic.
He knows about pricing around the world because — in addition to being an associate professor of applied economics at the University of Minnesota — Bozic is founder and CEO of Bozic LLC, a global provider of technology for commodity markets analytics and risk management, with around 100 clients on four continents. He is also an advisor to several dairy trade associations.
“While it’s not easy to switch (milk markets) today, milk check transparency would allow producers to hold boards accountable and hold management accountable,” said Bozic. “Having this information, seeing the patterns, a producer can ask the question: Are you doing everything you can to make sure I am successful?”
Bozic announced his new Milk Check Transparency Report, which he said will be a monthly report generated from producers submitting their milk checks to him. The purpose is to make milk checks easier to understand and to benchmark across processors to improve price discovery.
He has been working on this project with 12 processors, mainly in Wisconsin, so far. The first report is due out in the next few weeks, and the goal is to gain more input covering more buyers in more regions.
He said he hopes to have 90 to 95% of the processors included within the next six months to be able to generate a national Milk Check Transparency Report every month.
Specifically, all data is collected from producers’ milk check statements. The collaboration is confidential and a non-disclosure agreement is signed protecting the producer. Bozic and an assistant input the data. No one else sees the individual milk check submissions.
Once enough data are collected to have a high degree of confidence in the estimates, processors are contacted to offer them the opportunity to validate or comment before publishing.
Bozic has a multi-step process for standardizing the information at national average component levels (4.0F and 3.3P). He appreciates having a document describing how premiums are set by the milk buyer. Representative hauling is also incorporated and other formulas so price discovery comparisons can be made.
“Then we can work with any milk check,” said Bozic.
He said a large number of farms from Washington to Florida and from California to New York are or will be participating in this project, and he urged producers to get involved by writing to him at marin@bozic.io
Bozic was quick to point out there are other considerations and benefits a cooperative or private milk market may provide that go outside the scope of the report. He said the Milk Check Transparency Report is not meant for ranking. Instead, it is a way to look comparatively, so producers can have better market price discovery, input and accountability.
Another goal of the report is to eventually have a calculator option, where a producer can slide the pounds of volume or components, even milk quality, and see how it changes the pricing outcome.
“We are then better able to design risk management,” said Bozic, whose proprietary company owns the intellectual property he developed as the infrastructure behind risk management programs like Dairy Revenue Protection (DRP).
He believes with better information, even the Dairy Margin Coverage can be improved, and the calculators and sliders could allow producers to see how they are paid against a national index allowing them to make changes that would improve profitability and better inform how to manage the price risk they have.
Negative PPDs (producer price differentials) made headlines the past two years, Bozic acknowledged.
“There’s an impression that all this milk was de-pooled and a feeling that processors could have their cake and eat it too,” he said. “The Milk Check Transparency Report puts everyone on notice that whether differentials are positive or negative, they are in there.”
In this way, he said, the report can “promote good behavior in an unregulated way.”
On the variation in how producers are paid, Bozic said a big problem is lack of clarity on how farmers can achieve a better price.
“It’s astonishing to me that processors do not have brochures detailing how their incentives are based so farmers know how to meet them,” said Bozic.
The Milk Check Transparency Report is something Bozic is doing, for free, on his own time. He is not relying on the University of Minnesota. He said he knows he’ll get some ‘hate mail’ but believes it is important.
When asked why he is doing this, Bozic brought his reply to a personal level. He mentioned his mother, who is ailing, saying that she inspired him all his life to help people. He said it is hard for anyone to do this, but that he is fortunate to have built a technology company over the years and believes he is in a position to do something good.
On contract fairness, Bozic noted that Australia has required structures in their milk contracts, but they do not have regulated pricing.
“It’s their contracts that put them on an even keel,” he said.
For example, no cooperative or milk buyer should be able to prohibit their producers from doing third-party milk weight and test samples. Contracts should protect farmers from being ‘failed’ in inspections simply because they are ‘prickly’ or ‘vocal’ producers.
He also noted that in countries, like Australia, milk buyers or cooperatives are not allowed to require exclusivity while also doing two-tiered pricing for base and over-base milk at the same time.
“It’s one or the other,” said Bozic. “When those two lanes cross at the same time, we have a traffic accident.”
“Organizations like ADC and Edge are fighting for some of these interests of farmers, but they need more voices,” said Bozic.
He pointed out that the combination of exclusivity and base programs in the East may be insulating against production growth and surplus.
“That ‘insulation’ may be fine right now,” said Bozic. “But what about 10 years from now?”
What happens to dairy in the Northeast, for example, when processing has been built up everywhere else where production is being allowed, even encouraged, to grow?
USDA announced a ‘transitional standards’ rule on Feb. 4 for milk, whole grains, and sodium for school years 2022-2023 and 2023-2024. In short, the transitional standards are only in place while USDA works with stakeholders to strengthen meal standards through a new rulemaking for the longer term. The proposed rule for the longer-term is expected in fall 2022 and will be based on the Dietary Guidelines for Americans 2020-2025 — effective school year 2024-2025. A “gradual implementation” plan for the long-term standards will be developed by USDA based on ‘stakeholder input.’Read the transitional standards rule and comment here. Stay tuned for proposed long-term standards rule and comment period this fall. Even the American Association of School Superintendents (AASA) made a statement this week, believing the long-term standards will be ‘more stringent’ due to the Dietary Guidelines, and that “it is important to acknowledge that healthy meals are only healthy if students eat them.” That goes for the milk also. Milk consumption plummeted and waste skyrocketed since USDA’s 2012 fat-free/low-fat milk rules were set for both ‘served’ milk and competing a la carte offerings.
By Sherry Bunting, Updated (above) since published in Farmshine, Feb. 11, 2022
WASHINGTON — USDA announced ‘transitional’ nutrition standards on Friday, Feb. 4 that put low-fat 1% flavored milk back on the menu next school year, without the cumbersome waiver process. The announcement also delays the planned sodium reductions, helping the cheese side of school lunches.
National Milk Producers Federation (NMPF) and International Dairy Foods Association (IDFA) came out with hearty applause for the news, thanking Congressmen G.T. Thompson (R-Pa.), author of the Whole Milk for Healthy Kids Act, and Joe Courtney (D-Conn.), author of the School Milk Nutrition Act, for their leadership on this issue through the years, using words that treat this USDA announcement as though it’s a done-deal, and all is good to go.
But let’s hold our horses and examine the USDA announcement — described clearly as “transitional” based on schools “needing more time to adjust” post-pandemic.
USDA stated that future nutrition standards will be proposed in the fall of 2022 as part of the administration’s “Build Back Better with School Meals, input will be gathered, and those will be the standards that go into place beginning with the 2024-25 school year.
USDA also made it clear that these future long-term standards “will line up with the Dietary Guidelines” and input from schools and industry will be sought in “how to gradually implement them.”
In 2010, the Healthy Hunger Free Kids Act of Congress tied government food and nutrition programs, like school lunch, to the Dietary Guidelines. By 2012, under President Obama’s USDA — with Tom Vilsack at the helm then as now — had banned whole milk as an a la carte offering in the ‘Smart Snacks’ rules. At the same time, the Department required flavored milk to only be offered if it was fat-free and required unflavored milk to be either fat-free or low-fat 1%.
Milk sales plummeted and waste increased.
Then, the Trump-USDA in 2018, under Ag Secretary Sonny Perdue, “rolled back” some of the 2012 USDA standards, delaying the sodium rules and allowing low-fat 1% flavored milk to be offered through a waiver system at the state level. Some states, like Pennsylvania, made blanket waivers available, and many schools began offering low-fat 1% flavored milk over the next few years.
Then, a lawsuit took the Trump-era USDA to court for the rollbacks. The court ruled that the Trump-USDA did not use a proper public comment process before doing the rollbacks. So, beginning with the 2021-22 school year, the low-fat 1% flavored milk was again bumped out of school menus — except where waivers were sometimes granted for pandemic-related supply disruptions as justification for serving a higher fat milk.
Over the past year, USDA Food Nutrition Services has received comments about how to gradually implement nutrition standards to line up with the Dietary Guidelines on sodium, whole grains, and milkfat. Friday’s announcement on ‘transitional standards’ was accompanied by a detailed and lengthy rule that will be implemented July 1, 2022.
“USDA is giving schools time to transition from current, pandemic operations, toward more nutritious meals. In 2022, USDA will continue to prioritize supporting schools as they navigate the challenges of the pandemic and related operational issues,” the announcement said, adding that USDA “is also planning for the future by engaging with school meal stakeholders to establish long-term nutrition standards beginning in school year 2024-2025 that will be achievable.”
Ag Secretary Tom Vilsack was quoted in the announcement blaming the pandemic disruptions of the past two years for making schools “unprepared to fully meet those standards at this time” for milk, whole grains and sodium.
“These transitional standards are step one of a longer-term strategy to lean into the school meal programs as a crucial part of improving child health,” said Vilsack.
“Over the coming months and years, USDA will work closely with its school meal partners to develop the next iteration of nutrition requirements. We’ve got to find the right balance between standards that give our kids the best chance at a healthy future based on the latest nutrition science, and ensuring those standards are practical, built to last, and work for everyone,” Vilsack added.
The purpose of the “transitional” standards, according to the USDA announcement, is to “give schools clarity for the coming school years, allowing them to gradually transition from the extraordinary circumstances caused by the pandemic to normal program operations and meal standards that are consistent with the latest nutrition science, as required by law.”
Specifically, the transitional standards beginning with the 2022-23 school year are as follows:
1) Milk: Schools and childcare providers serving participants ages six and older may offer flavored low-fat (1%) milk in addition to nonfat flavored milk and nonfat or low-fat unflavored milk;
2) Whole Grains: At least 80% of the grains served in school lunch and breakfast each week must be whole grain-rich; and
3) Sodium:The weekly sodium limit for school lunch and breakfast will remain at the current level in SY 2022-2023. For school lunch only, there will be a 10% decrease in the limit in SY 2023-2024. (This affects school cheese).
The expressed linkage of long-term USDA nutrition standards to the anti-fat 2020-25 Dietary Guidelines was mentioned throughout the USDA announcement, giving an indication of where the school milk standards are headed, long-term.
That is, unless Congress acts to remove all doubt and make fuller fat milk — whole milk — a legal option for schools in the future.
For a true solution for the long-term, Congressional leadership is needed on the school milk issue.
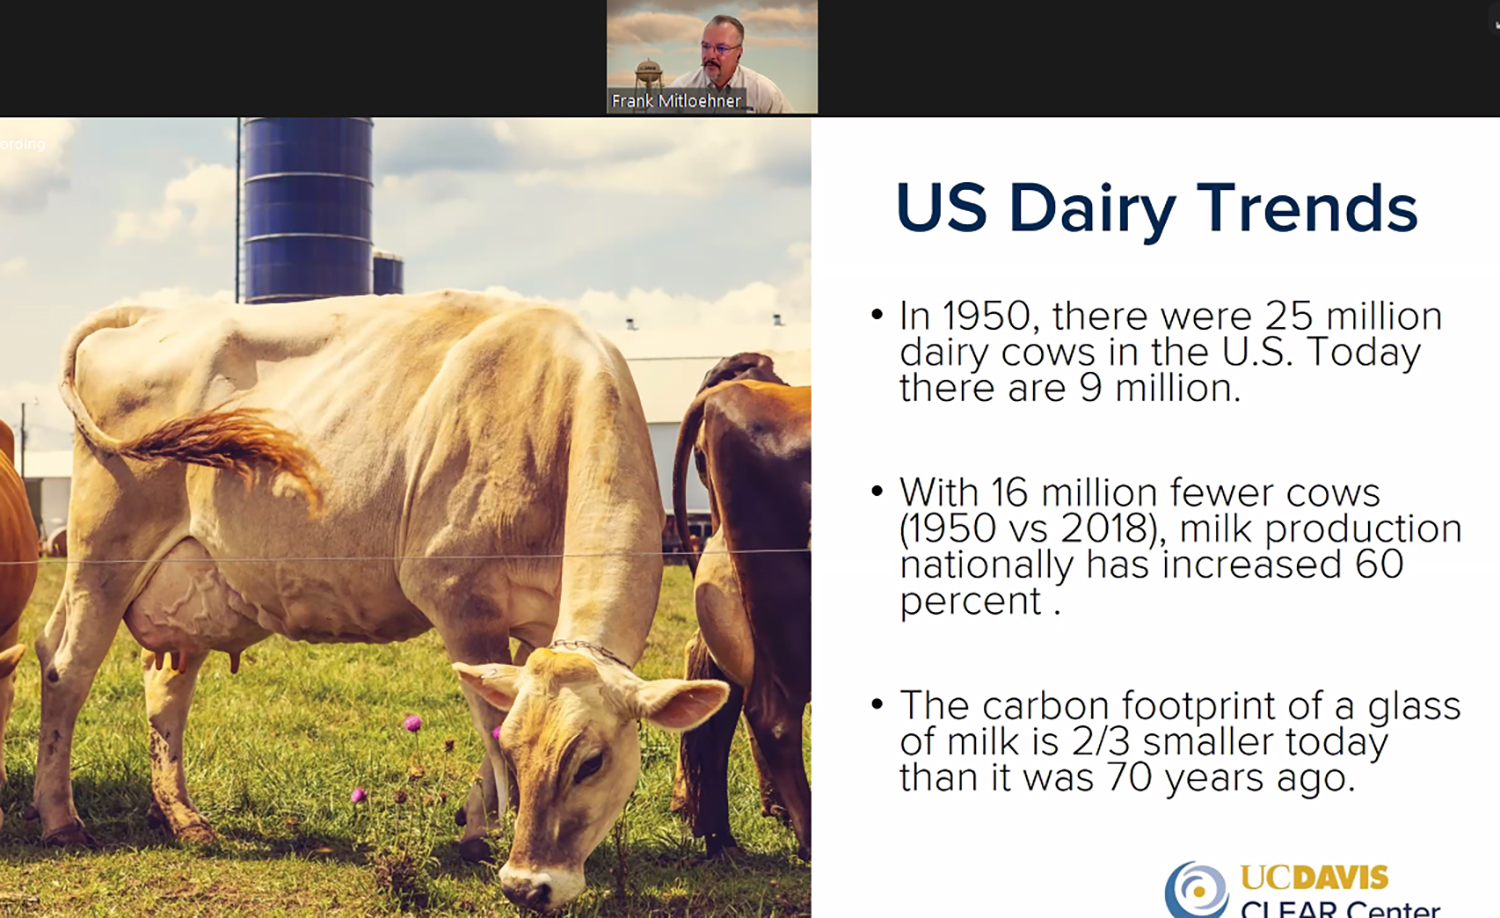
Dr. Frank Mitloehner is a foremost authority on animal science and greenhouse gas emissions. Find him on Twitter @GHGGuru and @UCDavisCLEAR (Screen capture from American Dairy Coalition webinar)
‘Climate neutrality, not net zero carbon, should be dairy’s goal.’
By Sherry Bunting
‘Net zero’ seems like a simple term, but it’s loaded, according to Dr. Frank Mitloehner, professor and air quality specialist with the Department of Animal Science at University of California-Davis.
He firmly believes dairy can be a climate solution, but the first step is to accurately define dairy’s contribution to the climate problem. Setting the record straight is his prime focus, and he also researches ways dairy, like every industry, “can do our bit to improve.”
Presenting on what ‘net zero’ really means for dairies, Mitloehner answered questions during the American Dairy Coalition (ADC) annual business meeting in December, attended by over 150 producers from across the country via webinar.
Based in Wisconsin, ADC is a national producer-driven voice with a regionally diverse board. President Walt Moore, a Chester County, Pennsylvania dairy producer, welcomed virtual meeting attendees, and CEO Laurie Fischer shared a federal dairy policy update.
She said the ADC board is nimble, moves quickly, and wants to hear from fellow dairy farmers. She encouraged membership to make ADC stronger and shared about the organization’s federal policy focus in 2021 — from pandemic disruptions and assistance, Federal Order pricing, depooling and negative PPDs to real dairy label integrity, whole milk choice in schools, and farmers’ questions and concerns about dairy ‘net-zero’ actions.
“Too often, farmers think they may not understand something, so they don’t speak up,” said Fischer. “But we get calls and so much great advice from our farmers. We know you get it, you know it, because it is happening to you.”
From this farmer input, the net-zero topic became the ADC annual meeting focus.
“We are rethinking methane, and this is influencing and shaping the discussion,” Dr. Mitloehner reported. He urged producers to use the information at the CLEAR Center at https://clear.ucdavis.edu/ and to do better networking, to have a better presence on social media.
This is necessary because the activists are well-connected, and methane is the angle they use in their quest to end animal agriculture. He said Twitter is a platform where many of these discussions are happening. His handle there is @GHGGuru and the Center is @UCDavisCLEAR.
“This is something I have told the dairy industry. They say ‘net-zero carbon’, but they shouldn’t say that because it is not possible, and it is not needed. We need to be saying ‘net-zero warming’. That’s the goal. Then, every time you reduce methane, you instantaneously have an impact that is inducing a cooling effect,” said Mitloehner.
‘Climate neutrality’ is the more accurate term he uses to describe the pathways for U.S. dairy and beef. But it requires getting accurate information into policy in a fact-based way.
It requires arming people with the knowledge that the constant and efficient U.S. dairy and livestock herds produce no new methane, that they are climate-neutral because not only is methane continuously destroyed in the atmosphere at a rate roughly equal to what is continuously emitted by cow burps and manure, that process involves a biogenic carbon cycle in which the cow is a key part.
One of the issues is how methane from cattle is measured, he said. Current policy uses a measurement from 30 years ago that fails to acknowledge the carbon cycle and ‘sinks’ alongside the ‘emissions.’
Mitloehner said accurate information is beginning to change the narrative. This is critical because methane is the GHG of concern for dairy, and the narrative about it has been incomplete and inaccurate.
As a more potent heat-trapping gas than carbon dioxide, methane becomes the ‘easy’ target to achieve the warming limits in the Paris Accord. Methane was the focal point of ‘additional warming limits’ during the UN Climate Change Summit (COP26) in Glasgow in November.
Putting together the inaccurate narrative alongside international agreements to specifically reduce methane, it becomes obvious why cattle are in the crosshairs. Producers are already in the middle of this in California as methane regulation and carbon credit systems began there several years ago.
As the narrative is beginning to change, Mitloehner sees opportunities. He described the current California ‘goldrush’ of renewable natural gas (RNG) projects where large herds both in and out of state cover lagoons to capture and convert biogas into RNG. The state’s investments and renewable fuel standard provide a 10-year guarantee with the RNG companies typically owning the offset credits that can be traded on the California exchange from anywhere.
Getting the numbers right is mission-critical
“We are far and away an outlier because of our efficiency in the U.S with all livestock and feed representing 4% of the GHG total for the U.S,” Mitloehner confirmed. “Dairy, alone, is less than 2% of the U.S. total.”
This is much smaller than the 14.5% figure that is thrown about recklessly. That is a global number that includes non-productive cattle in India as well as the increasing herds in less efficient developing countries. This number also lumps in other things, such as deforestation.
He said the true global percentage of emissions for livestock and manure is 5.8%. Unfortunately, activists and media tend to use the inflated global figure and conflate it with these other things to inaccurately describe the climate impact of U.S. dairy and livestock herds as 14.5%.
The efficiency of U.S. production and the nutrient density of animal foods must be part of the food and climate policy equation.
Methane is not GHG on steroids
“Without greenhouse gases, life on earth would not be possible because it would be too cold here,” said Mitloehner. “We need GHG, but human activity puts too much into the atmosphere, and the toll is large concentrations.”
The way all GHGs are measured has to do with their intensity as determined 30 years ago when scientists wanted one global warming potential (GWP) unit to compare cows to cars to cement production and so forth. They came up with GWP100, which converts methane to CO2 equivalents based on its warming potential.
Methane traps 28 times more heat than CO2, but it is short-lived, Mitloehner explained.
“Looking just at the warming potential, you get this idea that methane is GHG on steroids and that we need to get rid of all of it and all of its sources,” he said.
But is this the end of the methane story? No.
Sinks and cycles must count
Mitloehner described how ‘methane budgets’ look at sources and their emissions but ignore the carbon sinks that go alongside and ignore the chemical reactions that result in atmospheric removal of methane as well.
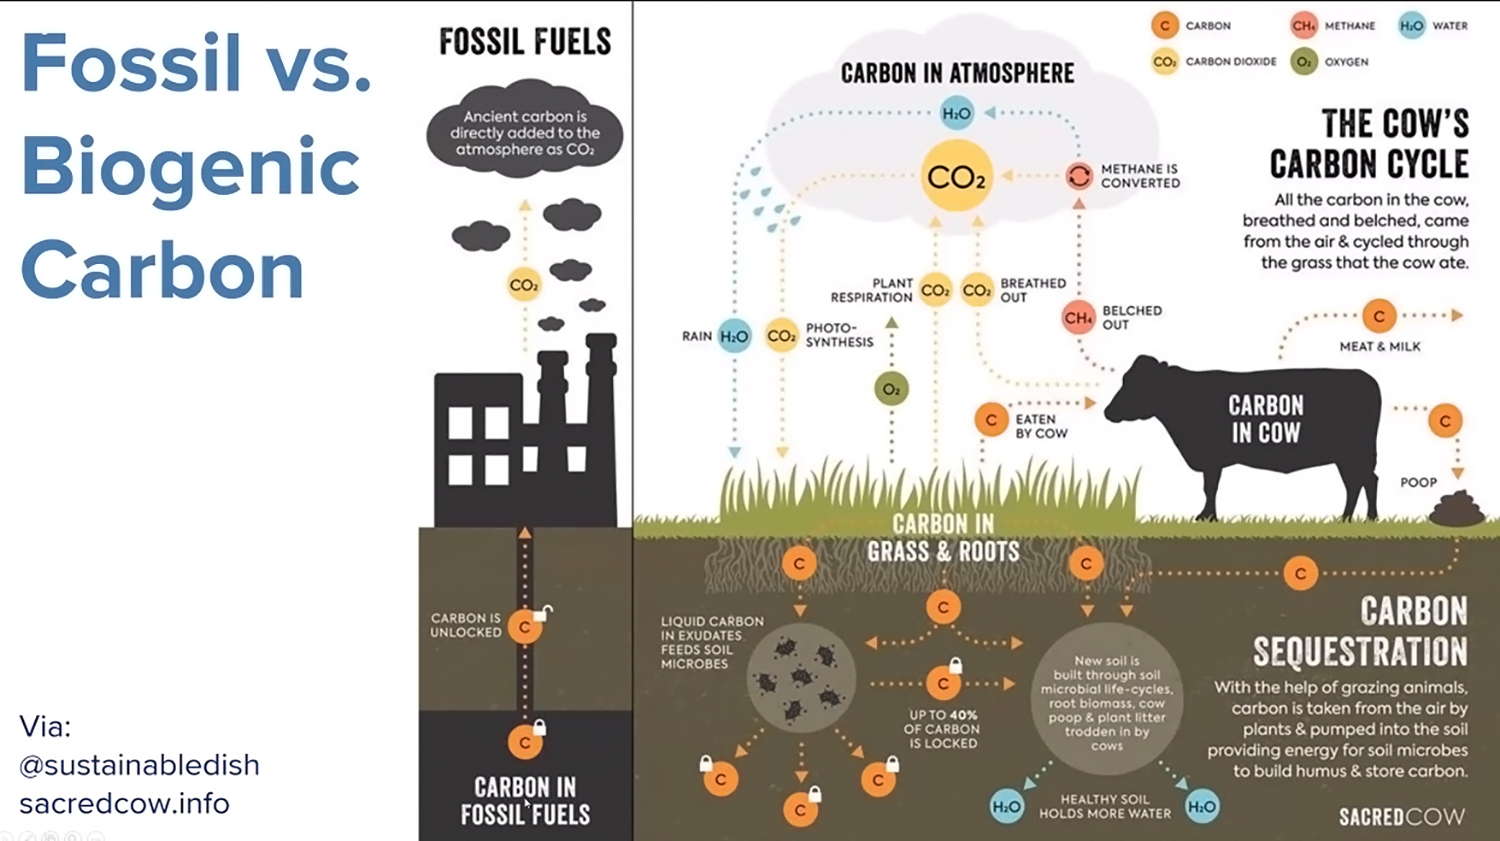
“Plants need sunlight, water, and a source of carbon. That carbon they need comes from the atmosphere to produce oxygen and carbohydrates,” he said, explaining how cows eat the carbohydrates and convert them to nutrient dense milk and beef. In that process, the rumen produces methane.
“Is this new and additional carbon added to the atmosphere? No it is not. It is recycled carbon,” he said.
“Say you work off the farm. You drive and burn fuel, adding new CO2 in addition to the stock in the atmosphere the day before. Stock gases accumulate because they stay in the environment. Currently, agencies treat methane as if it behaves the same way. But methane is a flow gas, not a stock gas. It is not cumulative,” said Mitloehner.
If the same farm has 1000 cows belching today and 1000 belching 10 years ago, those 1000 cows are not belching new methane because in 10 years it is gone from the atmosphere. It is cyclical.
“The take-home message is the carbon that our constant livestock herds produce is not new carbon in the atmosphere. It is a constant source because similarly to it being produced, it is also destroyed. The destruction part is not finding its way into the public policy system… but it will in the future,” he predicts.
Methane drives Paris Accord and COP26
Methane targets are driving intergovernmental agreements wanting to limit the “additional warming impact” of nations and industries.
Currently, cattle are viewed as global-warmers because they constantly emit methane. However, as Mitloehner drilled numerous times, this is not new methane, it is not additive, it is not cumulative. It is recycled carbon.
“If you have constant livestock herds, like in the U.S., then you are not causing new additional warming,” said Mitloehner.
Burning fossil fuels is much different.
“Fossilized carbon accumulated underground. Over 70 years, we have extracted half of it and burned it, so where is it now? In the atmosphere. We added new and additional CO2 that is not a short-lived gas. It is a one-way street from the ground into the air,” he explained.
The problem for dairy and beef producers is their cattle are being depicted as though their emissions are additive, cumulative, like fossil fuels, which is not true, he said.
Signs the narrative is changing
One promising sign that the message is getting through has come from Oxford researchers acknowledging the constant cattle herds in the U.S. and UK are not adding new warming.
They acknowledge the GWP100 “grossly overestimates” the warming impact of cattle and are working on a new measurement that recognizes constant cattle herds are not adding new warming, said Mitloehner.
Another promising sign is that the International Panel on Climate Change (IPCC) issued a statement recently acknowledging that the current GWP100 overblows the warming impact of cattle by a factor of four. This new information is not in current policy, but it is making its way there.
Tale of two bathtubs
Mitloehner believes it is important to visualize climate neutrality. He described two bathtubs. One has a CO2 faucet with no drain, the other a methane faucet with a drain. Open the faucets, and even at a slow and steady rate, the CO2 bathtub continues to rise, while the methane bathtub drains as it fills to remain at a constant level.
He also explained that over the past 200 years the U.S. hasn’t seen any real change in that methane bathtub because prior to settlement in America, 100 million ruminants — buffalo and other wild herds — roamed. Today, there are around 100 million large ruminants in the U.S. dairy and beef industries.
What has changed is the U.S. does have more liquid manure lagoon storage that is producing more methane than solid manure storage. “But we know of ways to further reduce that,” he said.
Mitloehner pointed out how the current GWP100 poorly estimates the warming impact three example scenarios. If, over 30 years, methane is increased 35% from a source, or reduced 10%, or reduced 35%, the GWP100 would show significant continuous addition of cow-sourced methane in CO2 equivalents for all three scenarios because the destruction of the methane – the drain that operates with the faucet – is ignored.
The proper way to look at this, if the methane increased a lot, is that it would add a lot. But if it is balanced, then there is no new or additional warming. And, in that third scenario, he said, “where we pull a lot from the atmosphere when we reduce methane, it has the same impact as growing a forest.”
Bottom line, said Mitloehner, “We can be a solution and take it to the market and get paid for that,” but current policy does not yet reflect the neutral position of the constant and efficient U.S. herd.
Bullish about the future
‘Net zero’ is a term that is not yet clearly defined, said Dr. Frank Mitloehner several times during the American Dairy Coalition annual meeting by webinar in December. He sees the real goal as “climate neutrality,” to communicate the way constant U.S. dairy herds contribute “no additional warming,” in other words “net zero warming.”
The climate neutrality of U.S. cattle must be part of public policy, he said. Only then will dairies truly be on a path to marketing their reductions as ‘cooling offsets.’
Mitloehner, a University of California animal scientist and GHG expert is bullish about the future of “turning this methane liability into an asset, so if we manage toward reducing this gas, we can take that reduction to the carbon market,” he said.
“When we hear ‘net zero’, we think about carbon, but that would mean no more GHG is being produced, and that is not possible. I have told the dairy industry this for years. Why is (zero GHG) not possible? Because cows always belch, and we can’t offset that, and furthermore, we do not need to offset that because it is not new methane,” said Mitloehner.
On the other hand, “If we replace beef and dairy made in the U.S., this does not create a GHG reduction at all. This is because we are the most productive and efficient in the world,” he said.
Just stopping beef and dairy production here in the U.S. — and picking up the slack by producing it somewhere else or producing something else in its place — creates ‘leakage.’ This leakage, he said, is where the biogenic carbon cycle becomes disrupted. In other words, the bathtub has a faucet that is out of sync with the drain.
California’s RNG ‘goldrush’
Mitloehner touched on the strict California standards that mandate a 40% reduction of methane be achieved by the state by 2030. Again, methane is targeted because of its warming potential per the Paris Accord.
The good news, he said, is California is using incentives to encourage covering manure lagoons to capture a percentage of the biogas bubble so that it doesn’t go into the atmosphere but is trapped beneath the tarp and converted into renewable natural gas (RNG) that can be sold as vehicle fleet fuel to replace diesel.
Because this RNG comes from a captured and converted methane source, it is considered a most carbon-negative fuel in the state’s low-carbon fuel standard.
Those credits equate to $200 per ton of CO2 replaced with a carbon-negative renewable, said Mitloehner.
“This is a huge credit. This is why dairies are flocking to get lagoons covered to trap and convert. These credits are guaranteed for 10 years in California, but the anti-agriculture activists are fuming over them,” said Mitloehner.
Of all California investments made toward achieving the 40% methane reduction goal, dairy has received just 3% of funds, but has achieved 13% of reductions so far.
This “carrot” approach has incentivized the biogas RNG projects assuming $4000 income per cow, making an estimated $1500 to $2000 per cow per year on a 10-year California fuel standard guarantee.
Mitloehner noted that the carbon intensity of the reduction is presently viewed as greater when RNG is used in vehicles vs. generating electricity, but right now there is not enough RNG suitable for vehicle use. He sees the fuel use increasing in the future and explained that dairies anywhere can sell into the California market if they capture biogas and convert it to RNG.
The state’s 10-year guarantee has stimulated companies seeking to invest in RNG projects on large dairy farms, where they then own or share the credits.
Mitloehner answered a few questions from producers about the caveats. If the bottom and top of the lagoon are covered, what happens to the sludge that accumulates? He acknowledged there is no satisfactory answer to that question presently.
Another drawback is the technology only works for larger dairies because smaller lagoons won’t have the same breakeven. Community digester models are emerging as well, he said, but they also use clusters of large farms working together.
Soil carbon sequestration
Mitloehner cited soil carbon sequestration as a way dairy farms of any size can be a solution.
It’s the process by which agriculture and forestry take carbon out of the air via the plant root systems that allow the soil microbes to take it into the soil — unless the soil is disturbed by tilling or it is released through fires. With good forest and grassland management, as well as low- and no-till farming practices, carbon can be sequestered to stay in the ground forever, according to Mitloehner.
“Agriculture and forests are the only two ways to do this,” he said, adding that USDA seeks to incentivize practices that take and keep more of the atmospheric carbon in the soil.
Answering questions from producers, he noted that he has not yet seen a scheme that would incentivize soil carbon sequestration through marketing offsets, but the discussions are heading in that direction.
“Many of the environmental justice communities are running wild on this. They do not want farmers to get any money for it. They are putting on significant pressure and threatening lawsuits, so it’s not settled yet,” he reported.
There is also a lot of confusion around soil carbon sequestration and “regenerative” agriculture. One big problem is that producers who are doing some of these things, already, won’t get the opportunity to capitalize on those practices when offset protocols are eventually developed — if those practices are not deemed “additive.”
“If you are doing something now and are not covered by a policy of financial incentive, then four years from now, if it is developed, they’ll say you don’t qualify because you are already doing it,” said Mitloehner.
“They are calling it ‘additionality.’ It’s about the change to doing it to qualify. That seems crazy, but it’s like if you bought an electric vehicle 10 years ago when there was no tax credit, you don’t get a tax credit now for already owning an EV because the improvement is not ‘additional,’” he explained.
What about the burps?
For farms with under 1000 cows, other technologies like feed additives can be used on any size dairy with effects realized within a week, said Mitloehner, noting one product that is commercially available and several others on the docket.
If a 10 to 15% reduction can be achieved in enteric (belching) methane reduction, then it will be marketable. Right now, these reductions are not marketable. If an offset protocol is developed for this in the future, it will be taken to the carbon market, he said.
In the meantime, incentives are being offered within supply chains, according to Mitloehner. Companies like Nestle, Starbucks and others are doing pilot projects and buying feed additives for the farmers within their supply chains to reduce their products’ GHG. He said there is some evidence these products can enhance components and feed efficiency. This is a big area of research right now.
A question was also asked during the webinar, wondering about Amish farms using horses instead of tractors. Are they contributing to cooling?
Mitloehner replied that he has not yet seen a calculation for this, and while the impact of horses would be less than the impact of burning fossil fuels, there is still an environmental impact to calculate.
Since the international focus is on ‘additional warming impact’, methane is – like it or not — the target. Whether a dairy farm is managed conventionally or in the Amish tradition, the cows, the methane, and how governments and industry measure the ‘additional warming impact’ of cow-sourced methane, is still the crux of the issue for all dairy farms. If efficiency is reduced, then the ability to position the dairy farm as ‘cooling’ may be more complicated, or less significant, he said.
In addition to accurate definitions that acknowledge climate neutrality of constant cattle herds producing no new methane, Mitloehner’s wish is for federal policy to also take productivity (and nutrient density) into stronger consideration when evaluating emission intensity “instead of just counting heads of cattle.
“This can be good for large or small dairies with a high or low footprint. When the relative emissions are determined by how you manage the dairy, the hope is that this is more about the how than the cow.”
Class I price under the new ‘average-plus’ formula vs. the previous ‘higher of’ formula and the net loss dairy farmers have missed out on over 34 months — May 2019 – Feb 2022
By Sherry Bunting
USDA announced the February Class I ‘mover’ on Jan. 20 at $21.64. The good news is this is $1.93 higher than the January mover and $6.10 higher than a year ago. The Class I mover is the base price paid for milk going to fluid beverage use before location differentials are added.
The bad news is the February Class I mover is 51 cents less under the current ‘average-plus’ formula ($21.64) than it would have been under the previous ‘higher of’ formula ($22.15).
During the Georgia Dairy Conference this week, retired co-op CEO Calvin Covington, author of the Dixie Dairy Report, gave a positive outlook for 2022. He noted the year begins globally with modest product inventories, reduced production of milk and strong demand for dairy.
When asked about risk, Covington noted that it doesn’t take much change in these factors to swing markets the other way. The higher milk prices go, the more downside risk there is for producers to protect.
When asked about federal order reform ‘consensus’ building and the Class I mover formula, Covington said the reform process was navigated in the past through a hearing process involving the USDA Dairy Division. He also said the Class I mover formula should return to the previous ‘higher of’ method because the costs of serving the Class I market continue to climb while the Class I price takes a back seat to other classes in some months under the ‘averaging’ method.
That may be the case in January and February when final prices are announced, and the possibility exists that this inversion could continue.
For February 2022, the advanced Class III skim milk pricing factor, based on cheese and whey prices in the first two weeks of January, is pegged at $10.43 while the Class IV skim pricing factor, based on butter and powder, is pegged at $12.97. That’s a spread of $2.54 per hundredweight.
This spread has been widening since November — now more than erasing the 74-cent adjuster applied under the current skim ‘averaging’ method. In the February calculation, it was the uptrending butterfat value at $2.7537/lb that softened the blow.
The entire formula figures the average of the two skim pricing factors (Classes III and IV) + 74 cents x 0.965. It also multiplies the butterfat price by 3.5. Then the resulting numbers for skim and fat are added together to form the Class I advance base price – or as it is called, ‘the mover.’ When Class I is highest, milk is sure to ‘move’ to those fresh fluid milk needs, which is one of the main stated purposes of the Federal Milk Marketing Orders.
The February Class I price announcement is the first since June 2021 to fall below the old method using the new method. This happened every month in the second half of 2020 and first half of 2021 as well as three months in 2019. The new method was implemented by USDA in May 2019 due to a legislative change in the 2018 Farm Bill that did not go through a Federal Order hearing process.
From July through December 2021, producers gained 27 to 70 cents from the averaging method as Classes III and IV traded close together. Those brief gains netted around $100 million, which paled in comparison to the approximately $780 million in net Class I value losses to producers from May 2019 through June 2021. With January and February 2022 figured in (no benefit in January and a 51-cent loss in February), the net Class I value loss is now estimated at $687 million for the 34 months since the Class I pricing change began in May 2019.
Supply and demand shocks, supply chain disruptions and other fundamentals are creating the double-impact of rapidly rising dairy product prices and the widening spread between Classes III and IV. The combination is creating a situation where Class I is well on its way to becoming the lowest-priced class, even in some FMMOs after the location differentials are applied.
In fact, if these differences lead to a lot of de-pooling and negative producer price differentials (PPDs), those location differentials will also be shaved in the blend price to producers.
It will be interesting to see how this plays out perhaps differently now that Class IV is leading Class III by a wide margin instead of the other way around as previously.
Here’s what’s been happening since November.
When the Class I mover was calculated for December at $19.17 based on early November pricing factors, dairy farmers benefitted from most of the 74-cent adjuster because the Class III and IV ‘advance’ pricing factors were close together with just a 12-cent spread. By the time the December class and component prices were announced on January 5, Class I mover was surpassed by Class IV at $19.88 and Class II $19.84, but Class III was still behind Class I at $18.36.
Then, when the January Class I price of $19.71 was announced four weeks ago based on the pricing factors back in the beginning of December, the factors began shaping up for the Class I mover to be dead-last by the time the January class and component prices are announced on Feb. 2. It would have been far behind II, III and IV had the block cheese price not lost 21 cents on the CME Spot market this week, pulling futures markets back $1.00 during the Jan. 19 and 20 trading sessions.
With one week of trading to go before January closes, odds are the Class I mover will be surpassed by all other class prices when the final announcement comes out on Feb. 2. Class IV will likely be highest in the mid-$22s, Class II will be close to Class IV, Class III will most likely be over $20 unless block cheddar takes another hit, and Class I will clock in at the previously announced $19.71.
In the January Class I ‘mover’ calculation of $19.71, the Class III and IV pricing factors diverged by precisely $1.48. This is the magic number because the adjuster to the average is 74 cents and 74 x 2 = $1.48. With the January Class I price spot-on equal to what it would have been under the previous ‘higher of’ method, no benefit was received by producers for that ‘adjuster’, and therefore, the issue of Class I being potentially the lowest priced class in the blend price for January is due entirely to the advanced pricing 4 to 6 weeks before the other classes.
February’s pressure on Class I relative to II, III and IV looks to be steeper and will be based on two factors – the 6-week difference in determining the values in a rising market and the widening of the spread between the Class III and IV skim pricing factors.
Looking out across the milk futures months of 2022, the spreads are much wider now than they looked a few months ago, even as the brakes were applied unevenly putting Class III and IV futures trading in reverse adjustment mode today and yesterday.
(NOTE: The USDA Pandemic Market Volatility Assistance Program, PMVAP, authorized $350 million to be paid to farmers at a rate of 80% of their July-Dec 2020 Class I value loss — on up to 5 million pounds of milk per farm via their milk co-ops and handlers and calculated only on FMMO-pooled milk value. But these payments are delayed in most cases, and will fall well short of the real value missed in the milk checks of many dairy farmers across the country as the Class I losses influenced other aspects of FMMO pooling and payment as reflected in negative PPDs.)
Updated Market Moos, by Sherry Bunting, a weekly feature in Farmshine
2022 Class III futures avg. $20.10, Class IV $21.10
Milk futures surged to levels not seen since 2014 this week on the heels of previous weeks’ gains, and the Class III milk futures contracts for 2022 now average over $20 with Class IV over $21 as of Dec. 29, 2021.
Class III milk futures first broke into the $20s last week, hitting new contract highs daily since Wed., Dec. 22 on all 2022 contracts. The closeup contracts for Dec. 2021 and Jan. 2022 were flat in pre-Christmas trading, but see-sawed toward gains in post-Christmas trading.
On the milk futures close Wed., Dec. 29, Class III contracts for the next 12 months (Dec. 2021 – Nov. 2022) averaged $20.01, up $1.35 from a month ago, with January through October 2022 contracts all at or above $20.00.
Class IV futures broke the $21 mark for the Feb. 2022 contract last week, and then continued marching higher after Christmas with January through October 2022 contracts all at or above $21. At the close of trade Wed., Dec. 29, the next 12 months (Dec. 2021 through Nov. 2022) averaged $21.05, which is $1.89 higher than a month ago.
Excluding the lower and expiring current month contract, the 12-month average of 2022 futures contracts averaged at $20.10 for Class III and $21.10 for Class IV.
Class IV continues to dominate the board, and the average spread between the two widened to $1.00 this week with December’s contract pegged at a Class IV over III differential of $1.45; January’s $1.29.
Butter’s impressive gains lead the spot-market
Butter is leading the charge as CME spot dairy products moved mostly higher in pre- and post-Christmas trade. Cheese prices had weakened in pre-holiday trade while butter, nonfat dry milk and whey all made solid or impressive gains. In the post-Christmas spot calls, impressive gains were made on both cheese and butter while whey held firm and milk powder weakened.
On Class III dairy product spot markets at the CME Wed., Dec. 29, the 40 lb block Cheddar price was pegged at $1.95/lb — recovering all of the pre-holiday loss and then some. A single load traded at $1.94 and a spot bid to purchase at $1.95 was left on the table by sellers. Barrels have seesawed almost daily but moved decidedly higher on a nickel upswing Wed., Dec. 29, when 500-lb barrel Cheddar was pegged at $1.69/lb and 5 loads changed hands.
Dry whey gained 6 cents last week and held firm at that 75-cent level Dec. 27, 28 and 29, although zero product changed hands.
In the Class IV products, the spot butter market was very active, and the spot price was pegged at $2.43/lb on Wed., Dec. 29, up a whopping 24 cents from the previous Wednesday and 33 cents higher than two weeks ago. On Mon., Dec. 27, a whopping 10 loads of butter traded with the price pegged at $2.30. On Tues., Dec. 28, another big round of 12 loads traded with the price pegged at $2.40/lb. Then on Wed., Dec. 29, another rally resulted in 3 loads trading with the spot price reaching $2.43/lb with sellers on the sidelines holding their offers at $2.45.
Grade A nonfat dry milk had added a penny last week but lost two pennies this week. On Wed., Dec. 29, the NFDM spot price was pegged at $1.6475/lb with 5 loads changing hands.
November milk production fell 0.4% vs. year ago amid increasingly obvious geographic patterns
U.S. milk production was 0.4% lower than a year ago in November, but for the major milk states, the decline was 0.1%.
Cow numbers dropped 10,000 head nationally in the month of November, alone. Almost one-third of them (3000 head) left the count in Pennsylvania between October and November. Compared with a year ago, cow numbers across the U.S. were down 47,000 head.
In Pennsylvania, cow numbers at 472,000 head were down 10,000 vs. year ago with production off 3.5%. Elsewhere in the Northeast milkshed, New York’s production was down 0.2%, but cow numbers were up 2000 head. In Vermont, milk production fell 1.4% while cow numbers were stable compared with a year ago.
(Producers in Pennsylvania and through most of the Northeast and Midatlantic region report continued penalties on overbase milk, continuance of the 12% cuts in Northeast/Midatlantic producer base allotments instituted by the largest national footprint cooperative during the height of the pandemic. This, despite USDA Dairy Market News reports confirming very tight milk and cream supplies in the eastern markets, and increasing evidence of store shortages based on consumers facebooking their photos of empty dairy and milk shelves at prominent regional supermarket chains throughout the Northeast and Midatlantic states. The recent revelation that the iconic Readington Farms in New Jersey — that supplies ShopRites and other stores in the Wakefern Foods retail group throughout New England, New York, Pennsylvania and the Delmarva — will begin procuring milk for these stores from former Dean plants now owned by Dairy Farmers of America (DFA) also sent shockwaves throughout the Northeast last week)
In the Southeast, Florida dropped 6000 cows with production down 3.4% from a year ago. Georgia gained 1000 cows and 1.4% in production.
In the Mideast region, Ohio, Indiana and Michigan collectively lost 14.000 cows and were down 1.6% in milk vs. year ago.
Growth in the Central Plains continued. States that gained both cows and production vs. year ago include South Dakota, up 22,000 head and 16.7% in milk; Minnesota up 6000 cows and 1.9% in milk; Iowa up 6000 cows and 2.7% in milk; Wisconsin up 18,000 cows and 2.2% in milk; and Texas up 17,000 cows and 2.8% in milk.
California produced 1% more milk than a year ago but lost 1000 cows.
January Class I mover $19.71, Class IV pricing factor tops Class III by $1.48 per cwt.
The Class I mover for January 2022 was announced Dec. 22 at $19.71. That’s 54 cents higher than December’s mover and $4.57 higher than January a year ago.
By the hair of its chinny-chin-chin, the January Class I base price is identical under the new formula as it would have been under the old. Based on USDA AMS prices for cheddar, butter, nonfat dry milk and whey in the first two weeks of December, the January 2022 Class IV advance pricing factor was calculated by USDA to be 12.21 while Class III figured at $10.73.
Averaging the two advance pricing factors together and adding 74 cents is how we get to that $19.71 Class advance base price for January 2022 — under the new Class I formula. This is also the price it would be using the previous ‘higher of’ Class I formula because the $1.48 spread between the Class III and Class IV advance pricing factors (74 cents x 2) is the magic number that keeps the new method from calculating a Class I base price that is lower under the new method than it would have been under the old method. Any wider than $1.48, and the difference becomes negative.
Class IV is projected to be higher than Class III throughout 2022, if the current futures markets and market fundamentals hold out. This means the ideas circulating to change the Class I formula to a Class III-plus would be negative over the duration of time that Class IV beats Class III.
In volatile markets, where the dairy industry is vulnerable to market shocks, the use of the ‘higher of’ formula for Class I did help prevent further disparities that lead to de-pooling and negative PPDs, which affect not only producer milk checks but also their risk management.
Secretary Vilsack says bring me consensus, first
Last week during a farm visit in Wisconsin, Secretary of Agriculture Tom Vilsack told dairy producers he wants to see the dairy industry come together with a consensus on Federal Milk Marketing Order changes before holding USDA hearings.
Three weeks ago, Senators Kirsten Gillibrand (D-NY), Patrick Leahy (D-Vt.) and Susan Collins (R-Me) introduced the Dairy Pricing Opportunity Act of 2021, a bipartisan bill in the U.S. Senate that would direct the Secretary of Agriculture to provide notice of, and initiate, national hearings to review Federal milk marketing orders … “which shall include review and consideration of views and proposals of producers and the dairy industry on the Class I skim milk price, including the ‘‘higher of’’ Class I skim milk formula…”
In the past, whenever USDA has initiated administrative hearings to make specific FMMO changes, a consensus was typically sought before such hearings.
On the other hand, if the Senate bill becomes law, a more open process appears to be described that could make national hearings a review of the system, consideration of proposals, and specifically a look at the Class I formula change, which had been made legislatively without hearings, comment or a producer referendum in the 2018 Farm Bill.
Perhaps national FMMO hearings could open a consensus-building process.
PMVAP payments delayed
The Pandemic Market Volatility Assistance Program (PMVAP) payments related to the Class I formula losses from July through December 2020 will be delayed until late January or into February or March, according to Erin Taylor, USDA AMS. She told dairy farmers in a Dairy Industry Call hosted by the Center for Dairy Excellence this week that eligible producers should have been contacted by their milk cooperative or handler by now requesting proof they meet the Adjusted Gross Income limits of USDA payment programs.
USDA is in the process of finalizing agreements with each eligible handler that had any milk pooled on any FMMO during that time period and is providing workbooks with methodology on how the payments should be made to their producers based on how they were paid during the July-Dec 2020 period. Look for more information in the Jan. 7 edition of Farmshine and click here.
Whole Milk for Healthy Kids Update
There are 84 Congressional cosponsors from 30 states (including the prime sponsor, G.T. Thompson of Pennsylvania) who are now supporting the Whole Milk for Healthy Kids Act, H.R. 1861. However, for those readers who live in the New England states as well as Maryland, Delaware, South Carolina, West Virginia and several western states, representation is absent.
To-date, there are no cosponsors yet from the following states: Colorado, Connecticut, Delaware, Hawaii, Maine, Maryland, Massachusetts, Montana, Nevada, New Hampshire, New Mexico, North Dakota, Oklahoma, Oregon, Rhode Island, South Carolina, Utah, Vermont, West Virginia, and Wyoming.
This bipartisan bill was introduced in March by Congressmen G.T. Thompson (R-PA) and Antonio Delgado (D-NY), to end the federal prohibition of whole milk in schools. It gained 18 new cosponsors over the past two weeks to reach 84 from 30 states, but needs at least 100 cosponsors representing all 50 states to get moving in committee toward the goal line.
Consider contacting your Representative with thanks or a request to cosponsor this bill that simply allows school children the healthy milk choice they love and will drink. To find your Representative, enter your address at https://www.govtrack.us/congress/members
istock photo purchased and used with permission As shortages of cream products become more obvious in retail and foodservice channels, USDA’s Dec. 8 fluid milk and cream report acknowledged raw milk cream supplies are “tight to extremely tight” in the eastern U.S. at the same time that processors nationwide are trying to ramp up production of cream cheese, butter and seasonal products to meet sustained strong demand. In the midwestern markets, USDA notes Class I bottling needs have risen instead of declining like they normally do in December, and in the eastern markets, Class I bottlers are taking in more milk for steady to strong sales. istock photo
By Sherry Bunting, Farmshine
BROWNSTOWN, Pa. — What’s the real story with the availability of cream products and whole milk, especially in the population centers of the eastern U.S., and why the continued base penalties, base reductions, warnings of greater deductions on future milk checks — even for the base-obedient producers? Why the talk of overproduction of milk — especially in the Northeast and Mid-Atlantic region — when headlines are noticing a crimp in supplies?
A paradox, for sure.
One clue that makes this a true supply and demand situation — as opposed to purely a sign of supply chain disruptions — is the most recent USDA dairy products report showing 1.6% less butter was produced in October compared with a year ago, attributable to increased demand for cream and declining milk production.
The U.S. also exported more fat in the product mix than prior years.
In relation to this, October butter stocks, according to USDA NASS, are down 13% from September and 6% lower than a year ago after being double-digit percentage points higher than year earlier for the previous two to three years. The seasonal increase of 11.2% more butter produced in October than September was not as robust as previous years and it met an increased drawdown that has left cold storage stocks short heading into the holiday baking season in competition with cream product-making season.
While processor leaders from IDFA did a second Washington D.C. fly-in last week, talking with members of Congress about the trade disruptions, exports have continued strong and domestic shortages of milk and cream products are popping up all over the place – especially in the Northeast and Mid-Atlantic region.
It’s clear that trucking and worker shortages contribute, but it’s also clear the issues go beyond the frequently-cited packaging shortages, given the fact that bulk product is also becoming limited in foodservice channels.
So much so that the Dec.4 New York Times covered what has become a worsening cream cheese shortage in New York City. This pertains to the bulk cream cheese base that bagel shops purchase to tailor-make their own schmears. Consumers report retail packs of cream cheese in short supply at chain stores in New York while the bulk cream cheese base is tenuous for foodservice.
In both New York and Pennsylvania, shoppers confirm scarcity of cream cheese and other cream products while stores are placing limits on purchases. Reports from Boston indicate stores are “screaming” for half and half. Others observe that eggnog production is exacerbating already tight cream supplies, but acknowledge the issues are bigger than just the seasonal beverage production.
Fox News picked up the story Dec. 6 and 7. They interviewed NYC bagel shop owners to learn how they are navigating the problem. One owner talked about begging his vendors for product, then locating some cream cheese in North Jersey and driving 90 minutes in his own truck three times to transport a total of 2000 pounds of the schmear.
The Fox and Friends morning hosts checked with Kraft-Heinz, the parent company of Philadelphia Cream Cheese, conveying the company’s statement that they are seeing a 35% spike in demand for the product, which they then blamed on panicking restaurateurs stockpiling it.
“We continue to see elevated and sustained demand across a number of categories where we compete. As more people continue to eat breakfast at home and use cream cheese as an ingredient in easy desserts, we expect to see this trend continue,” Kraft-Heinz spokesperson Jenna Thornton told Fox News in a written statement.
Fox and Friends host Steve Doocy, who does a lot of cooking, chimed in that he can’t find cream products, and they all wondered out loud, what’s the deal with no whole milk in the stores?
Facebook responses to queries about what’s happening in different areas confirm many are having trouble finding half and half, heavy cream, cream cheese, even butter, and some reported spot depletion of whole milk or all milk.
A Pennsylvania store owner texted a note claiming he simply can’t get whole or 2% milk for his store.
A ‘Lunch Ladies’ group on facebook discussed numerous incidents of milk order shortings, delays and non-deliveries lasting more than a week, in some cases several weeks.
In both eastern and western Pennsylvania, shoppers are reporting purchase limits and limited or non-existent supplies of whole milk and cream products at major supermarket chains. (In my own shopping over the weekend, a Weis location just outside of Lancaster had a decent supply of milk, but only a few off-brand unsalted butter packages in the case. I was lucky to pick up the very last Land O’Lakes butter pack lingering way back in the corner. In the baking aisle, the canned evaporated milk shelf was bare.)
A reader from Virginia reached out to say her local Walmart was full with milk Saturday, but not a jug to be found Sunday.
An anecdotal report from a shopper in Florida, after stopping at two stores, found no half and half, no heavy cream, limited fluid milk, a buying limit on cream cheese – but “lots and lots of non-milk ‘milk.’”
Coffee houses are also randomly affected, with reports out of New York and New England. in the Twitterverse noting both real-milk and oat-milk shortages as people tell of stopping at multiple locations for morning lattes. Mothers were also tweeting frustration this week over limited supplies of infant formula in some areas.
Perhaps complicating the issue – waiting in the wings — is the foray of DNA-altered yeast-excrement protein analogs being tested in the supply chains of large global corporations – like Starbucks. A headline from three weeks ago read “Perfect Day’s Dairy-identical Alt Milk lands at Starbucks.”
Starbucks is among the multinationals testing Perfect Day’s DNA-altered yeast-excrement deemed as dairy analogs in select West Coast locations. The Perfect Day company claims to be “on a roll” with the brand valued at over $1.6 billion and recently raising $350 million in its admitted efforts to “remove cows from the dairy industry, without losing the dairy.”
One aspect of the Perfect Day ramp up is the company works B2B with processors, not making their own consumer-facing products. If other companies are experimenting with the goal stated by Perfect Day last year of 2 to 5% augmentation of dairy processing with the yeast-excrement protein analog by 2022, there’s a scenario in this to think about: These protein analogs may be deemed “identical” to whey and casein in processor application, but they do not bring along the healthy fats, minerals, vitamins and other components of real milk.
Could current chaos in cream markets and product availability be a glimpse of future disruptions by protein analogs as the B2B model seeks to dilute real dairy under the guise of cow climate action? That’s a story for another day, but it bears watching in the context of the current paradoxical supply and demand situation right now.
For its part, USDA Dairy Market News reported Dec. 1 that milk output was rising in the East, but demand was still beating it. Then the Dec. 8 report said Northeast milk production had flattened under the pressure of rising input costs and penalties on overbase production.
Specifically, USDA DMN cites steady to higher bottling demand and active cheese production schedules soaking up supplies.
“Cream demand is strong throughout the East,” the Dec. 1st report said. “Some market participants have noted that widespread logistical issues – including driver shortages and delivery delays – pose a greater hindrance to cream-based operations than the tighter cream availability, itself, at this point.”
By December 8th, USDA DMN reported that eastern handlers were working to secure milk spot loads from other areas as local supplies are tight, noting that eastern cream supplies are “tight to extremely tight,” and some dairy processors reported very limited spot load availability.
The report also sought to explain the cream cheese shortage in retail and foodservice channels, noting multiple factors, including “logistics bottlenecks, labor issues and supply shortages at manufacturing facilities.”
While the report indicated stepped up butter production this week, one Pennsylvania milk hauler observed two empty silos and no trucks to be seen at the Carlisle butter/powder plant at the start of this week, which is unusual.
Related to cream cheese production in Northern New York, producers there say they were told plant worker shortages this fall meant less processing of their milk. This resulted in multiple occasions of having to dump milk that could not be processed, but the incidents were deemed “overproduction” with producers footing the bill.
Meanwhile, USDA DMN indicated more outside milk coming East to meet processing needs.
At the same time, dairy producers from multiple cooperatives in the Northeast and Mid-Atlantic region confirm they are still incurring stiff penalties on over-base milk. While some of the penalty levels have softened a bit from earlier highs, most are still being held to their base levels, or in the case of DFA, the Northeast and Mid-Atlantic producers are still being penalized for milk that is above 88% of their base.
This means in the face of reduced supply vs. strong demand, DFA continues its 12% reduction in base allotments that became prevalent, especially in the Northeast and Mid-Atlantic region, at the start of the pandemic.
Furthermore, producers with other cooperatives report they have been warned to expect further deductions on their milk checks this winter – even if they did not exceed their bases — because there is still “too much milk,” they are told.
Attempts to gain further insights on the situation from major milk cooperatives and USDA went unanswered at this writing, so stay tuned for updates.