What’s on Covington’s 5-year milk market radar?

Pennsylvania dairy producers were treated to a forward look at Calvin Covington’s milk market radar during R&J Dairy Consulting’s annual seminar. The bottom line is cheese, cheese, and more whey. Photo by Sherry Bunting

Cheese and whey, will continue driving bus, with big growth in processing capacity on the road ahead

By Sherry Bunting, Farmshine, Feb. 7, 2025

EAST EARL, Pa. – Looking at the milk markets for 2025, Calvin Covington sees farm-level milk prices in the Northeast averaging 25 to 75 cents per hundredweight higher this year. He said milk margins, nationally, averaged $11.86 for the first 11 months of 2024, and he expects similar good margins to prevail in 2025.

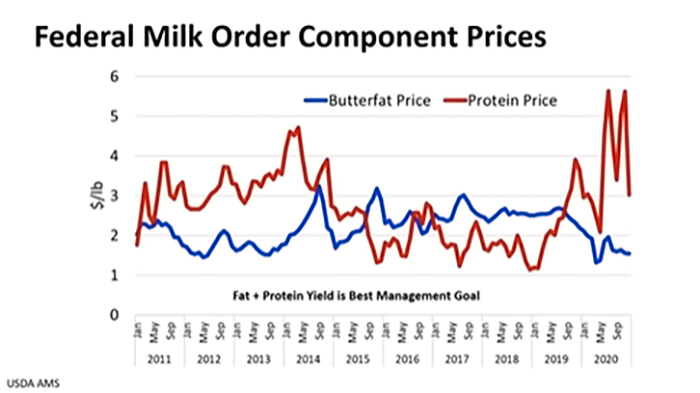
The caveat? These are forecasted averages, and farmers should expect price volatility in their income and input costs, along with the mixed bag of positive, negative, and unknown impacts from the Federal Milk Marketing Order changes implemented in the second half of the year. He expects butterfat prices to remain good, but lower in 2025; whey prices will be higher, but more volatile; and protein may be lower as huge new cheese processing capacity comes online

Covington mostly shared what’s on his radar for the next 3 to 5 years during R&J Dairy Consulting’s 18th Annual Dairy Seminar, attended by more than 250 farmers at Shady Maple Smorgasbord in eastern Lancaster County, Pennsylvania on Jan. 28th.

He remarked about the number of young farmers in the crowd, and pointed out that Lancaster County is the consummate dairy county in the U.S. — with more than 1100 Grade A dairies, producing over 2 billion pounds of milk last year, which is 4.5% of total U.S. output and more milk than half of the state totals across the nation.

Consumers: more cheese, more fat, more solids

“Cheese is driving the dairy industry, and consumers are consuming more milkfat. That’s what makes stuff taste good,” he said. “Cheese is one-third fat, and that’s one reason why milkfat consumption is growing.”

He also showed how increased fat consumption is demonstrated in fluid milk sales, with “whole milk coming up.”

This trend toward consuming products with more solids is also evident in ice cream sales, which are down, but the fat content is up; and in yogurt sales, which are flat, but move “more milk in the yogurt” in the form of more solids.

Now retired, Covington, a previous National Dairy Shrine Guest of Honor and World Dairy Expo Person of the Year, spent over 50 years working for dairy farmer organizations, including as a DHIA milk tester, CEO of American Jersey Cattle Breeders Association, and CEO of Southeast Milk Inc.

He said the total solids growth in the dairy sales is expected to continue, up from 27 billion pounds total a decade ago to 31 billion pounds in 2024.

The caveat, he said, is that “exports peaked a couple years ago at 17% of total milk solids, and last year (2024) was down at 16%. Exports are a big part of your market, but they have started to level off.”

When asked about imports, Covington said “they keep going up, especially on butterfat” as the U.S. now imports almost as much milkfat as it exports.

He noted increased consumer demand for Irish butter, which is made differently than U.S. butter, with more butterfat. “I hope we start making better-tasting butter in the U.S. instead of importing it,” he shared.

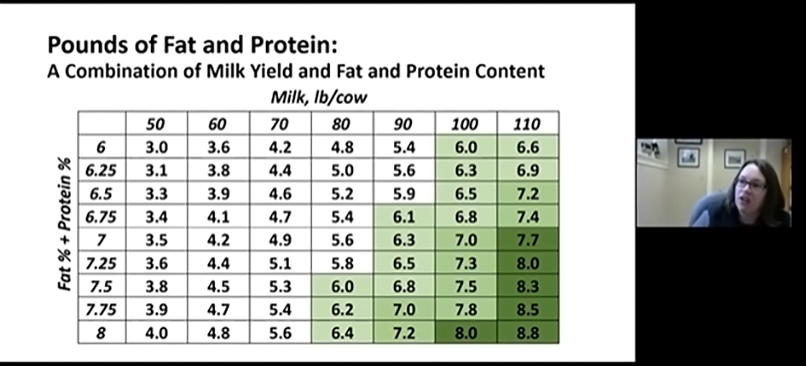
Amid the demand for milk solids, Covington said “it’s amazing what you are doing with your milk components as dairy farmers.” In the Northeast, producers are averaging 4.21 fat and 3.29 protein due to genetics and “the job farmers are doing with their nutritionists and feed companies.”

Covington demonstrated with 2023 vs. 2024 comparisons that farmers are increasing the amount of products made by increasing components year over year, instead of milk production and cow numbers.

Components are the big story on the supply side, a trend he also sees continuing. He doesn’t expect dairy cow numbers nor milk output per cow to go back to the year-over-year gains seen in the past any time soon.

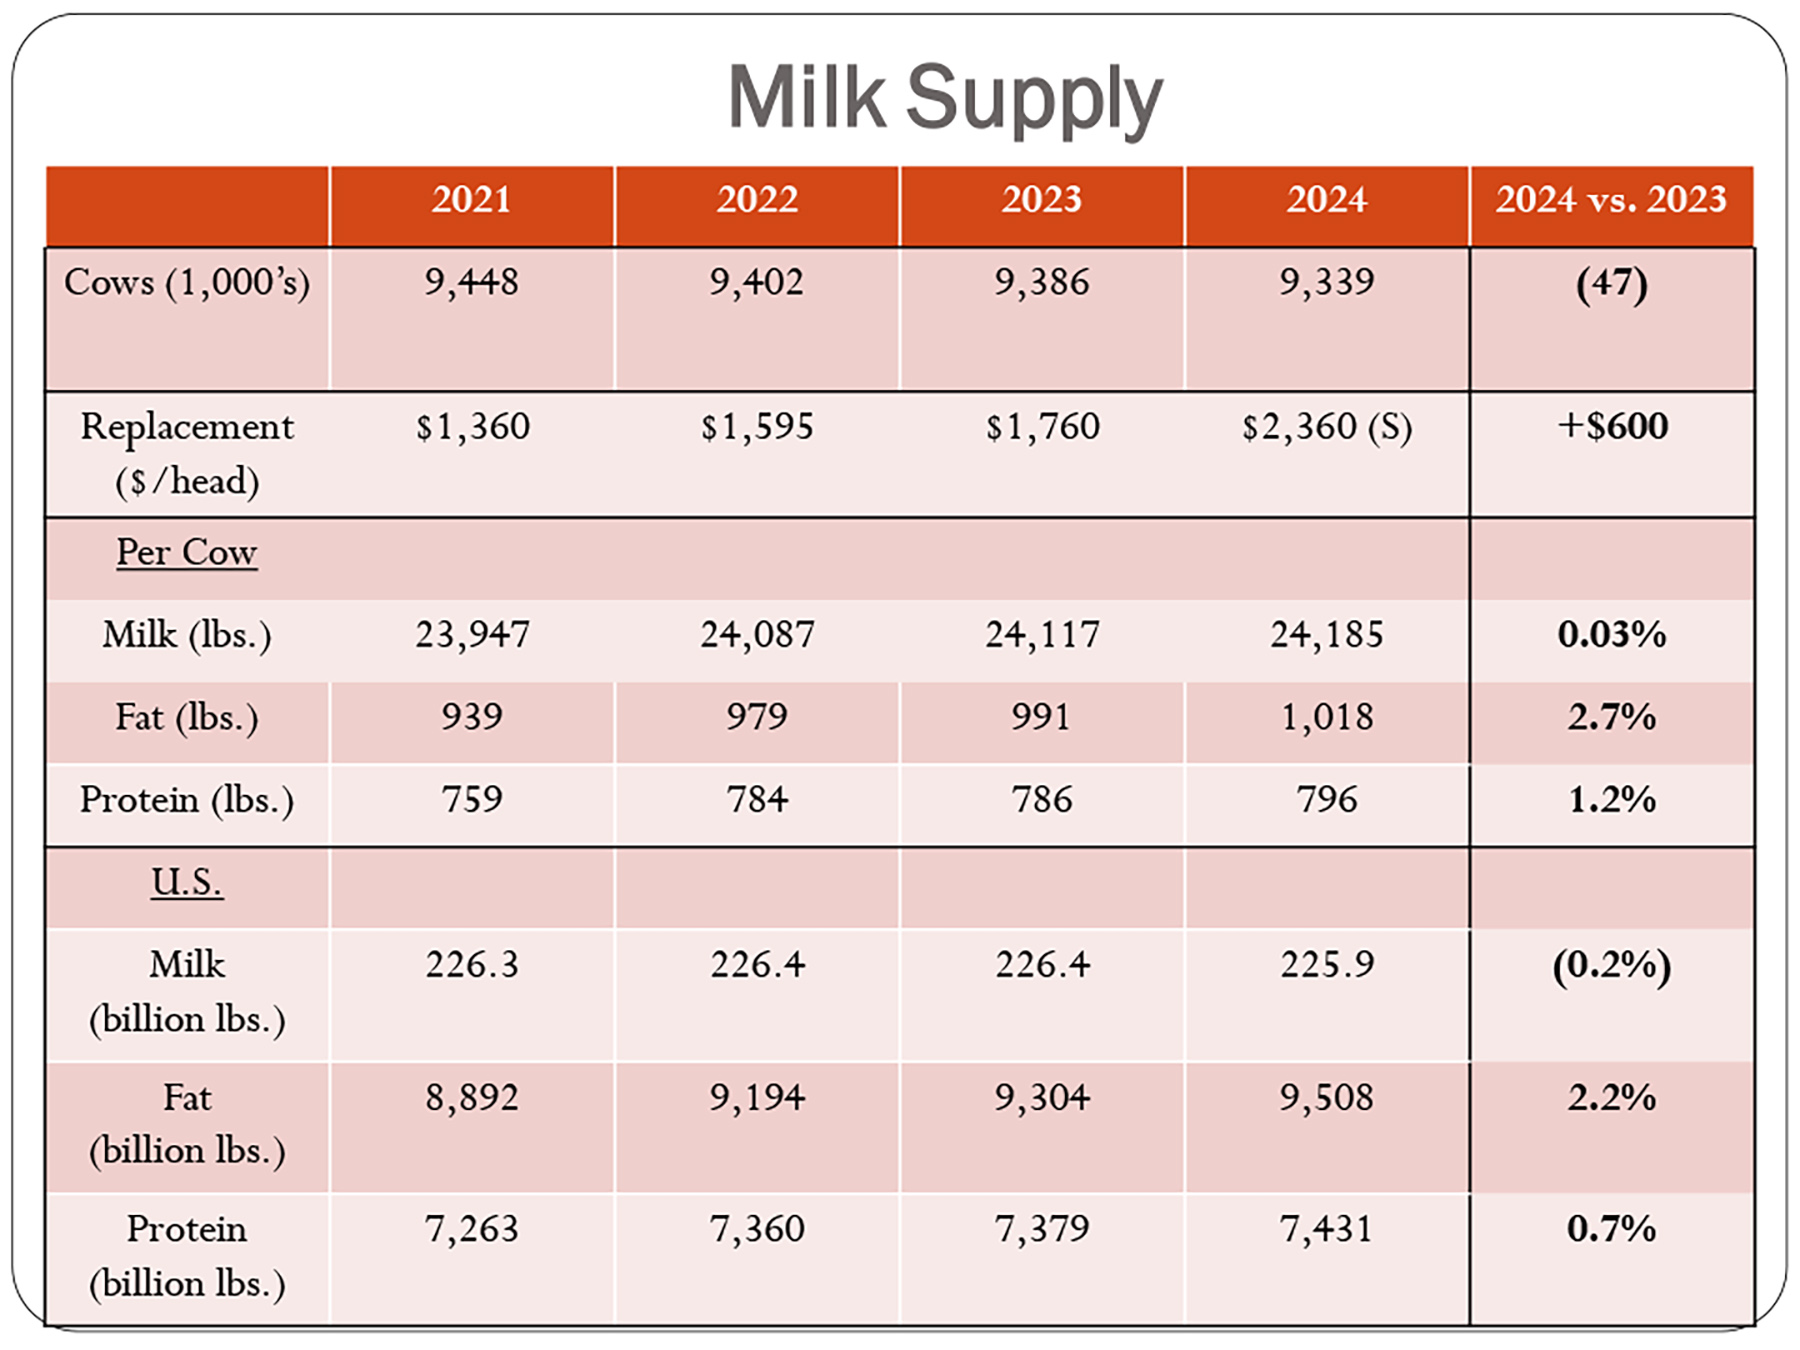
With a chart he showed the stark 2024 vs. 2023 data: Cow numbers are down 47,000 head; replacement heifers sell for $600 more per head; average milk output per cow is flat; but average fat pounds per cow is up 2.7% and average protein pounds per cow up 1.2%. This means that even though total U.S. milk production at an estimated 225.9 billion pounds is down 0.2% from year-earlier, total fat pounds at 9.508 billion pounds are up 2.2%, and protein pounds at 7.431 billion pounds up 0.7%.

“You’re doing it with your components,” he said. “And that’s going to continue.”

Cheese (or maybe whey) is driving the bus

Putting aside the import and export caveats, Covington demonstrated that as the overall dairy market is growing, almost all of this growth has been in the cheese market, which has become a much bigger piece of the much bigger pie.

“Cheese has been driving the dairy industry for several years, and everything points to it driving the industry going forward,” he said, showing a chart of the product mix in the year 2000 when 167.4 billion pounds of milk was produced in the U.S., sold as half cheese, and one-third fluid milk, with 15% other products. This compares with 2024, when 225.9 billion pounds of milk was produced and 58% of the sales were in cheese, 20% fluid milk, and 22% other products.

Per capita trends also show “consumers are eating more of their milk instead of drinking it,” said Covington. “We have seen tremendous change since 1986, when consumers first started consuming more of their milk as cheese than as fluid milk. Look at 2023, people consumed 405 pounds of milk (equivalent) in the form of cheese and 128 pounds in the form of fluid milk.”

While home milk delivery is rare today, Covington said it happens now in the form of pizza.

“If I drive around the city on a Friday night, I’ve got to get out of the way of the pizza delivery people. I figure, on average, it takes a little over a gallon of milk to make one average size pizza. Just think how much home delivery we have today of milk, but in the form of something else, not the milkman dropping off half gallons,” he said.

“The market is changing, and it’s going to keep on changing.”

Why is cheese growing so much? Covington pointed to things he hopes are lessons for other products: 1) Convenience, innovation in packaging and varieties, with pizza accounting for 42% of all cheese; 2) Brand identity, there’s still a lot of this in cheese, not making it a commodity to try to get to the lowest price like in other dairy products (i.e. fluid milk); and 3) taste, people love cheese.

Big bets on the future

Big bets are being made for more cheese growth, and the revenue stream of whey ‘byproduct.’

“We are in a slurry right now of a pile of money being spent on new plant construction,” said  Covington, listing the states of Kansas, Texas, South Dakota, Minnesota, Wisconsin and New York. 

When all of this new construction is complete over the next year or so, Covington expects the need for 30 million pounds of milk a day to fill the new plants or expansions, which he estimates represent investments of at least $5 billion and are owned by private companies or groups of farmers or individual farms that are not cooperatives.

“This kind of money and growth is not being put out there unless there is confidence in getting a return on investment with cheese and whey product growth both domestically and internationally,” he pointed out.

New cheese plant construction, when completed over the next year or so will take in more than 30 billion pounds of milk a day, and they gain a lot of additional revenue from what they do with the whey that smaller traditional cheese plants don’t have the equipment to do.

These new plants making all of this cheese will also have a lot of whey.

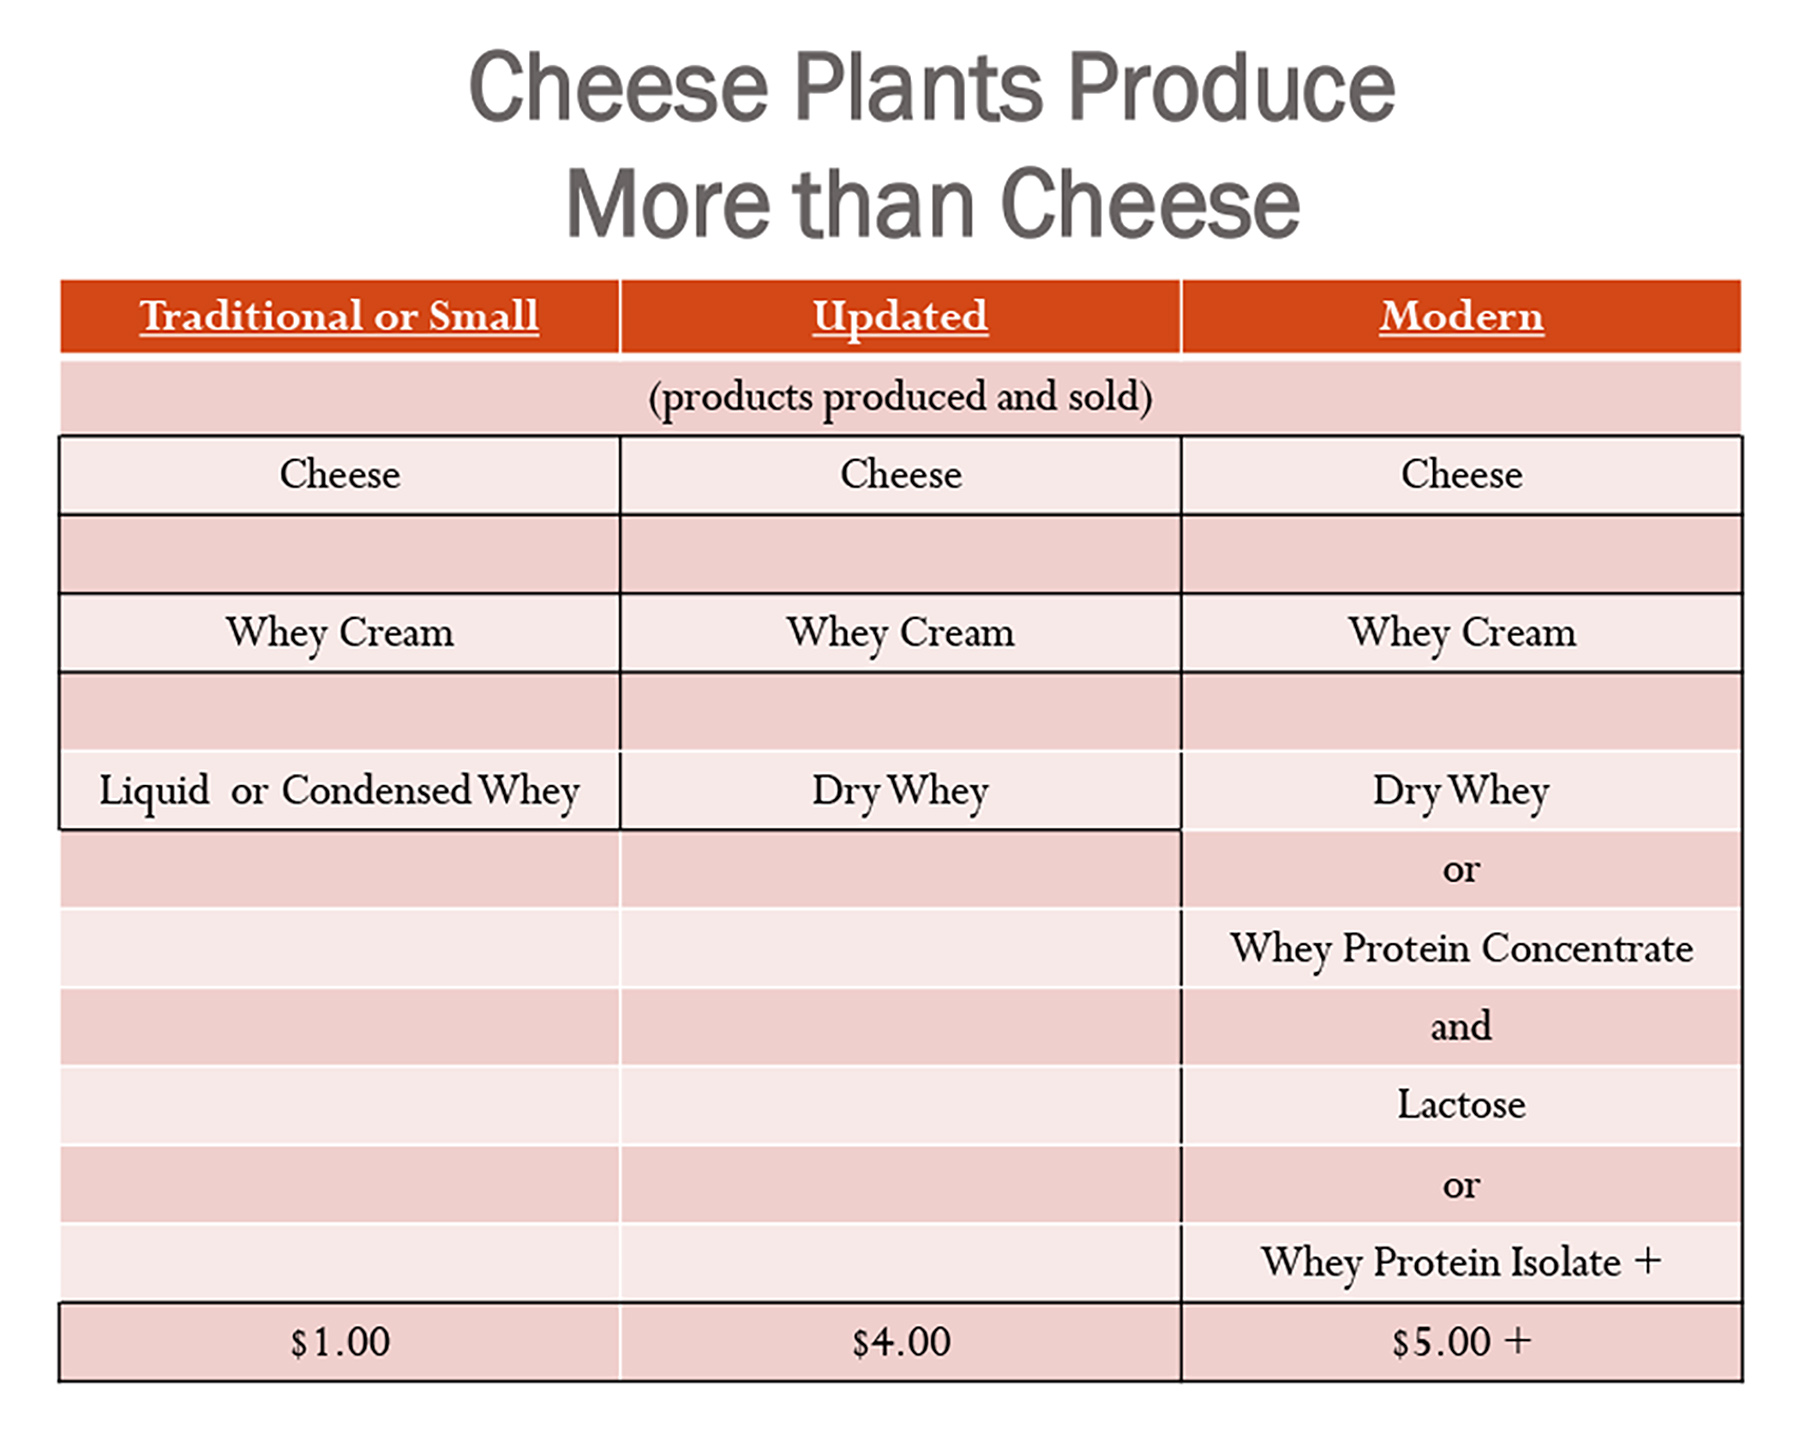
He explained that small plants get about $1.00/cwt for the whey cream and have the liquid whey to do something with. Some plants might dry it and get $3 per cwt for the dry whey plus the $1 for the whey cream, so that’s $4/cwt.

“Small traditional cheese plants can’t afford the equipment to do what some of these new plants are doing. These new companies not only dry the whey, they fractionate it to make whey protein concentrates. They separate out the lactose for whey protein isolates,” Covington said, rattling off a few items on the expanding list for everything from snacks and beverages, to pharmaceuticals and cosmetics, to milk replacers, to counter-top items, ‘pizza cheese,’ artificial seafood, canned hams, and more.

“It’s just amazing, and it brings in more revenue. When we think about cheese, it’s more than just the cheese, it’s also the income from the whey that’s left over,” he said, adding that the CEO of a large cheese company once told him: “Sometimes I think the cheese is the byproduct.”

With this kind of investment, the new plants are going to be making big volumes and getting income from the whey.

“This puts a crimp on the small cheese plants that can’t do this, and they’re going to have to get it out of the cheese end,” Covington observed, suggesting some potential structural change on the cheese side of the dairy industry with significant domestic and international sales growth needed to stay a step ahead.

On the positive side of the fluid milk industry, in addition to growing whole milk sales, Covington highlighted new investments. He sees a future with more dominance by grocery stores, pointing out the two new Walmart plants going into Georgia and Texas, which will be the largest in the country, processing 50 to 55 loads of raw milk a day.

Other big investments in the fluid milk sector in the Northeast are ultrafiltration and ESL packaging, such as the new fairlife plant under construction in western New York, new ESL expansion at the former Hood plant owned by Maola, and aseptic shelf-stable milk packaging at Cayuga Milk Ingredients.

-30-

Fluid milk processors say they can’t recoup higher protein value

NMPF, NAJ say higher solids worth more nutritionally, Seek FMMO updates to avoid misalignments and disorderly marketing

Calvin Covington (left) for Southeast Milk and Peter Vitaliano for National Milk Producers Federation testified on what the outdated skim milk component standards mean in terms of underpaying farmers and eroding producer price differentials (PPD), leading to disorderly marketing. This occurs because the skim portion of the milk that is utilized in manufactured products (Class III and IV) is paid per pound of actual protein, solids nonfat and other solids; whereas the skim portion of the milk bottled for fluid use (Class I) is paid on a per hundredweight basis using the outdated standard skim solids levels. The fat portion is not an issue because it is already paid per pound in milk class uses. Screen captures, hearing livestream

By Sherry Bunting, Farmshine, Sept. 8, 2023

CARMEL, Ind. – The national Federal Milk Marketing Order hearing completed two weeks of proceedings, so far, in Carmel, Indiana. The entire hearing is expected to last six to eight weeks, covering 21 proposals in five categories.

Picking up the livestream online, when possible, gives valuable insight into a changing dairy industry and how federal pricing proposals could update key pricing factors.

The first week dug into several proposals to update standard skim milk components to reflect today’s national averages in the skim portion of the Class I price. 

Here is a bite-sized piece of that multi-day tackle.

National Milk Producers Federation (NMPF) put forward several witnesses to show what the outdated component levels mean in terms of underpaying farmers, and how paying for the skim portion based on outdated component levels has eroded producer price differentials (PPD), leading to disorderly marketing.

IDFA’s attorney Steven Rosenbaum grilled NMPF economist Peter Vitaliano on this. He tried on seven attempts to establish that the fat/skim orders in the Southeast don’t have component levels as high as the national average, suggesting this change would “overpay” producers in some markets.

In his questioning, Rosenbaum stressed that fluid milk processors can’t recoup the updated skim component values if those components do not “fill more jugs.”

Vitaliano responded to say that protein beverages are a big deal to consumers, and some milk marketing is being done on a protein basis. Rosenbaum asked for a study showing how many fluid processors are actually doing this.

Attorneys for opposing parties kept going back to this theme that the skim solids should not be updated because the FMMOs are based on “minimum” pricing. They contend that processors can pay “premiums” for the extra value if they have a way of recouping the extra value by making more product or marketing what they make as more valuable.

Vitaliano disagreed, saying that even though many processors do not choose to market protein on the fluid milk label, “more protein makes fluid milk more valuable to consumers.”

Attorney Chip English went so far as to ask Calvin Covington on the stand: Why should my clients (Milk Innovation Group) have to pay more for the additional solids in the milk when they are removing some of those solids by removing the lactose?

“Consumers don’t want lactose,” English declared.

Covington, representing Southeast Milk and NMPF, responded to say: “I don’t know that to be true. It is unfair to suggest all.”

Bottomline, said Covington, raising standard skim solids to reflect the composition of milk today vs. 25 years ago adds money to the pool to assist with the PPD erosion so that Federal Orders can function as they were intended and so producers are paid for the value.

As English further questioned whether consumers even care about the higher skim solids and protein levels of milk today, Covington replied: “Skim milk solids have a value in Class I, or fluid milk. People don’t buy milk for colored water. The solids give it the nutritional value. That’s the reason they buy milk. That’s why FDA set minimum standards in some states. Why would you drink milk if not for the nutritional value?”

He also pointed out that the increase in solids nonfat over the past 20-plus years has improved the consistency of lower fat milk options. As noted previously, the milkfat is a separate discussion and is not included in this proposal because farmers are already paid per pound for their actual production of butterfat in all classes, including Class I.

Under cross examination, Covington explained that the Class I price in all Federal Orders pays for skim on a standardized per hundredweight basis and pays for fat on actual per pound basis. Meanwhile, the manufacturing classes pay for both skim and fat on a per pound of actual components basis. 

As skim component levels have risen in the milk, the alignment of Class I to the manufacturing classes narrows because of the differences in how the skim is paid for. When this happens, it becomes more difficult to attract milk to Class I markets. That’s one example of disorderly marketing. PPD erosion and depooling of more valuable manufacturing class milk is another example. 

Covington explained the impact of this misalignment on moving milk from surplus markets to deficit Class I markets, that the lower skim value becomes a disincentive.

Vitaliano explained the depooling issue as “creating disorderly marketing conditions also, and great unhappiness when one farm is paid a certain price and another handler pays a different price (in the same marketing area). That’s disorderly unhappiness for the Federal Order program,” he said.

He noted that the fundamental reason for pooling is to take the uses in a given area with different values to achieve marketwide pooling where producers in that Federal Milk Marketing Area are paid similarly, regardless of what class of product their milk goes into.

“This removes the incentive for any one group to undercut the marketwide price to get that higher price (for themselves),” he said. “The Orders create orderly marketing with a uniform price. Depooling undermines that fundamental purpose that is designed to create orderly marketing.”

Either way, whether indirectly paying to bring supplemental milk into Class I markets from markets with higher manufacturing use, or in the case of depooling, the dairy farmers end up paying for the fallout from this erosion of the PPD.

Since the beginning, even before 2000 Order Reform, figuring the Class I base milk price had to begin somewhere, according to Covington. Federal pricing has always used the manufacturing class values in determining that base fluid milk price.

The trouble today is that Class III and IV handlers pay farmers per pound of actual skim components in the milk they receive, while the Class I handlers pay per hundredweight based on an arbitrary outdated national average skim component standard. Thus, the “opportunity cost” of moving this now higher component milk to manufacturing classes that pay by the actual pound of protein, for example, instead of by the old standard average protein levels is not accounted for in the Class I price that still uses the old standard average levels.

Pressed again on how it makes sense to raise Class I prices by raising the component level of the skim to more adequately reflect the national average today, Covington said: “It adds to the nutrition, and I stand by that. In proposal one, the price will go up (estimated 63 cents per cwt or a nickel per gallon). I am comfortable charging that extra price to Class I processors.”

Attorney English, representing MIG, retorted that, “The handlers who buy milk and then by adding a neutralizing agent remove the lactose, they’re going to pay more for the milk that they then have to process to subtract the lactose.”

Covington responded that, “There are consumers who think about lactose. There are consumers who buy lactose-free products, yes, because it is on the shelf, but it’s not all consumers.”

On the higher protein, English asked Covington how Class I processors are supposed to monetize that protein in a label-less commodity, a commodity that is declining in its share of total milk utilization?

“We are still selling 45 billion pounds of packaged fluid milk (annually) in this country,” said Covington. “Consumers wouldn’t buy that 45 billion pounds if it wouldn’t have some nutrition.”

English argued that milk is sold as whole, 2%, 1% and non-fat. It is not sold by its protein, so isn’t it “so highly regulated in ways that alternatives are not that any increase in price hinders sales of fluid milk?”

Covington acknowledged that, “yes, it is regulated, but I’m not convinced that this proposal will hinder fluid milk sales. Again, (higher components) add to the nutrition and I stand by that.”

Opponents kept coming back to these value questions, while proponents focused on the price alignment issue and orderly marketing.

To link up with the hearing livestream 8 to 5 weekdays, to read testimony and exhibits, and to respond to the virtual farmer testimony invitations made every Monday for the following Friday, visit the Hearing Website at https://www.ams.usda.gov/rules-regulations/moa/dairy/hearings/national-fmmo-pricing-hearing

-30-

Milk solids seen as foundation for optimism in 2022

By Sherry Bunting, Farmshine, December 24, 2021

NEW HOLLAND, Pa. — “Milk pricing is backward, but look forward, and focus on components,” said Dr. Normand St-Pierre of Perdue Agribusiness speaking at Homestead Nutrition’s December Dairy Seminar in New Holland, Pennsylvania, where 200 dairy farmers heard from experts about the markets and the all-important goals of modifying milk price by improving components, and improving the milk margin by feeding healthy cows.

St-Pierre urged producers to be smart as they look at their costs — to not cut costs that sacrifice early lactation milk yield. He also pointed out how these higher prices for all components make feeding for components a continued area of focus to help the dairy in the face of milk check deductions related to cuts in base allotments and balancing.

Earlier in the program, Dr. Mike Van Amburgh shared Cornell University research on how to feed cows in a way that optimizes component yield by percentage, not just in total volume pounds. Total component pounds have historically been a function of total milk volume, but today, percentage counts because of per-hundredweight milk check deductions and over-base penalties.

“Milk volume is being discouraged in many regions of the country,” said Van Amburgh. “So the opportunity for producers here is to enhance their milk components, to make components a primary strategy, while still making your milk volume.”

St-Pierre noted that the next six months will be better than the last six months with a better milk price, and the futures markets certainly confirm this — moving even higher over the past four weeks. Global milk production is down 1% year-to-date, global skim milk powder stocks are low, butter production has been down for three months, stocks are low, and the world is getting short on butterfat, he said.

He observed that the Class III price was averaging over $19 and Class IV over $20 looking out six to 12 months in the futures markets. (That was the case on December 8, and now Class III is averaging over $20 and Class IV over $21.)

He sees the milk check butterfat price averaging $2.30 over the next six months; however, he said he believes this average could actually go higher, while protein should average $2.80. 

Another positive he mentioned is the ‘solids nonfat’ are being priced higher, and the ‘other solids’ are priced at almost double the historical average, driven by robust whey sales.

Even the USDA World Supply and Demand Estimates (WASDE) report the day after this meeting (Dec. 9, 2021) revised forecasts higher for butter, cheese and whey with NFDM forecasted at steady prices in 2022. As pointed out by St-Pierre, the current trends suggest this report could revise upward again in January, although much hinges on consumer responses to inflationary pressure in their buying habits.

The 2021 All Milk price average was increased in the WASDE report to $18.60, buoyed by yearend strength, and the 2022 All-Milk price forecast was revised upward to $20.75.

If current futures market levels are realized, these higher trending milk prices should help dairies keep pace with rising input costs, although experts calculate feed costs to be up by around $2.50/cwt for 2022 vs. 2021 and all costs combined could be up by almost $3.50/cwt for 2022 vs. 2021.

St-Pierre dug into this from a milk pricing standpoint, and he shared the good news that negative producer price differentials (PPD) from 2020 and the first half of 2021 have “quieted down.” 

Negative PPDs eat into location adjustments and change the way components are ultimately valued when massive de-pooling of milk occurs in Federal Milk Marketing Orders.

“We have positive PPDs right now because Class III and IV are trading closer together,” he said, noting that the new Class I formula averages the two manufacturing classes and adds 74 cents, so when they trade farther apart, the producer sees the hit in Class I also, dragging down the blend price and leaving smaller or negative producer price differentials (PPD).

The Class I pricing change and negative PPDs are issues St-Pierre has written about.

“Now they are asking the people who made the mess to fix it. That escapes me,” he said, noting the Federal Milk Marketing Orders (FMMO) were created in the 1930s and designed at a time when there were hundreds of cooperatives and milk did not move all over the country and the world.

St-Pierre said FMMOs exist for “orderly marketing,” but the government made a ‘fix’ that is like fixing an old horse. “He’s fixed but not running very fast and may be at the point where the horse has had enough.”

FMMOs were also created at a time when people drank more milk. Today, he said, they eat more cheese.

Showing a graph of per-capita fluid milk sales from 1980 (234 pounds per capita annually) to 2018 (146 pounds per capita annually), St-Pierre asked: “Does that look to you like an area of growth? If that marketer worked for Coca-Cola, he would have long been unemployed.”

While he acknowledged fluid milk has been disadvantaged by “lazy marketing,” he also said promoting milk is very hard because “we are not in the same world as in 1980. We are competing against water — with food in a bottle that we have to keep refrigerated. Cheese is easier to sell.”

The per-capita rise in cheese consumption since 1980 reflects this.

In the past, said St-Pierre, the FMMOs were designed to put the highest price in the bottle because that was the most perishable product. Today, as for the past 20 years, the prices are still based on the surveys of four products at wholesale – cheddar, butter, nonfat dry milk, and whey.

It was designed to have those prices for Classes 1 through 4 go in that order, he explained. “But it doesn’t work that way anymore.”

“As the butter price goes up, just make more butter, right?” he asks. “But it’s hard to make butter in a cheese plant and vice versa.”

“If I’m a processor, and I built a big cheese plant, and it cost me $150 million, I make a lot of cheese,” St-Pierre quipped.

Plus the built-in make allowances encourage single-product, single-class production plants running at full capacity, regardless of what the market is doing.

“It will take a while to change that dynamic,” he said.

“All milk is paid on components, but handlers don’t pay for components in the same way in the (FMMO) pool,” said St-Pierre. He explained that milk handlers pay for components according to how the milk is used, what “class” of products the milk was utilized in.

Class I price is based on butterfat and skim, Class II on butterfat and nonfat solids. Class III, which is 55% of the milk utilization, pays mainly on protein and other solids with an adjustment for butterfat because cheese production also uses a lot of fat. Class IV pays on butterfat and nonfat solids.

“We price things backward. Tell me one thing that you can go out and buy and drive out of the store and a month later tell that store what you will pay for it,” St-Pierre said, noting this is essentially what milk buyers do through the FMMO system, month after month, year after year.

He encouraged producers to be looking ahead three months, which he admitted is hard to do when the pricing for their product is so far behind the transaction. Still, he said following the markets gives a good indication, and there is more reliability in the 3-month window than 6 to 12 months out in the futures markets. 

The Class III price is normally higher than Class IV, but for the next few months, even through the next year, it looks to be flip-flopped.

Using an ‘imaginary’ FMMO, he divided all four classes as 25% utilization, which in reality is not too far off what the Northeast Order can come close to. In that four-class FMMO, the different ways different classes pay for components cause the books to be out of balance after producers are paid their advance check based on protein. Knowing each class pays differently, the class price differences and utilization become the key to how that PPD is either positive, flat or negative.

When Class IV was $6 below Class III, cooperatives and processors de-pooled a lot of milk, St-Pierre observed: “They could just pay 20 cents over that $13.80 price to get the milk and then sell it back at the $20 (Class III) price. That makes the co-op look good but the producer gets shafted,” said St-Pierre.

In FMMO 30, where most of the utilization is already Class III, processors made a lot of cheese in 2020-21, but they didn’t pool a lot of that milk, and they got it cheaper, he explained.

Bottom line, said St-Pierre, the Federal Orders were never designed to operate this way. Then along came the “little change” in the Class I price. In the past, the FMMOs used the ‘higher of’ Class III or IV as the way to set the Class I base.

“If I am a bottler, I don’t like that (higher of) because I don’t know how to hedge it,” said St-Pierre. “I know my price ahead of time anyway (through advance Class I pricing), but I still don’t like the ‘higher of’ so I go and tell Congress to average it and add 74 cents. Then Covid-19 hits, and producers lose over $750 million.”

St-Pierre notes that the industry is trying to fix the system, backwards.

He confirmed that where the negative PPDs kick Northeast producers is in the location adjustments. A smaller than normal positive PPD is a loss, and when it goes negative, it eats into the location adjustment, which is also supposed to be positive.

Working through all of these thoughts about pricing and consumption pattern, St-Pierre left dairy farmers with the good news that for the foreseeable future, the PPDs should be positive, although smaller than normal in some months, and Class III and IV prices are both on the rise. 

Production has slowed, and demand is good, including for milk powders and whey. These positive supply and demand factors are confirmed in the dairy product production and cold storage reports.

With the very reasonable expectation of good prices for milk components, in the face of base penalties, balancing assessments, and other milk check deductions that a dairy producer encounters, the best way to navigate is focusing on component yield because the deductions are a flat amount per hundredweight of total volume, whereas component yield becomes a percentage increase in the value of those milk hundredweights.

Look for more on other interesting nutrition topics and milk quality award winners as this article continues in a future Farmshine.

-30-

Achieving 7 lbs fat/protein has big impact on milk income

In the virtual breakout panel on maximizing components to improve the dairy’s bottom line, during the Pa. Dairy Summit recently, Heather Dann joined Pennsylvania producers Alan Waybright and Jennifer Heltzel. Dann is a research scientist at the William H. Miner Agricultural Research Institute, Chazy, New York.  Photo provided

HARRISBURG, Pa. – Shipping 7 pounds of combined milk fat and protein is the threshold minimum for improved profitability. Heather Dann of Miner Institute in Northeast New York was part of a panel discussion during the Pennsylvania Dairy Summit, which included Alan Waybright of Mount Rock Dairy, Newville, milking over 800 Holsteins and crossbreds, and Jennifer Heltzel of Piney Mar Farm, Martinsburg, milking 120 Holsteins.

“Focusing on maximizing fat and protein is a key driver of profitability on the dairy farm,” said Dann, noting that a few years ago Cornell Pro Dairy did research showing return on assets (ROA) is highly correlated to milk income over feed cost (IOFC), and the biggest thing to affect IOFC is pounds of components produced.

At the Miner Institute, 480 Holsteins produce 98 pounds/cow with 1262 pounds of fat and 945 pounds of protein.

Dann showed a Federal Milk Marketing Order graph of the USDA milk price value of fat and protein over the past 10 years. No matter where milk prices are at — the combined pounds of fat and protein should be 7 pounds, or more, for the best return, she said.

“Protein has typically been worth more than fat,” Dann observed. “But the goal is to maximize both (protein and fat) to achieve profitability.”

She noted that this can be done through higher levels of milk production or through lower levels of milk production containing higher pounds of fat and protein.

To calculate, add the fat percentage and the protein percentage and multiply that total percentage to the pounds of milk. The goal is to be in the 7-pound range or higher, and at a minimum to be over 6 pounds total.

“To maximize components, get the diet and the dining experience right,” said Dann, noting that most farms use a nutritionist, so rations are formulated. Where the biggest area of opportunity lies is in the management of that ration – from the forages that are harvested, stored and utilized to the feedout, mixing and delivery of the TMR.

On larger farms with different people doing the feeding, Dann noted the importance of feed management software like TMR tracker.

Waybright talked about feeding to 3% refusals and then incorporating those refusals back into the TMR. Heltzel noted her husband feeds for accuracy to 1% refusals. Being that they milk 2x instead of 3x, the cows use the overnight time as resting time.

Dann talked about a research project at Miner where video cameras captured cow activity overnight when the bunk was purposely left empty. There was a lot of standing around at the bunk waiting for feed, she said.

“We never want to see an empty bunk,” she said. “We looked at what cows do when they don’t have feed. We removed feed and watched them, putting up trail cameras and videos to document. We tend to think if there’s no feed, they’ll go lay down, but what we found is they stand idly and wait for feed.”

During this study, they used different stocking densities to see the consequences of feed access as well.

“Cows running out of feed is bad for everyone, and even worse when cows are overcrowded. When the feed is delivered, if there is less time to access it, this changes their behavior and leads to slug feeding,” said Dann.

These are just some examples of how management of the feeding situation can contribute to low rumen pH that affect milk fat production to create milk fat challenges.

“We want to focus on ration formulation to optimize forage inclusion to maintain rumen health for milk component yields. And, if we think about the steps in the process, have a goal to make the metabolized ration the same as the formulated ration,” Dann explained.

On the forage side, harvesting and storage for a quality fermentation is critical. Also, when it comes to mixing feed for cows, loading ingredients in the right order and the right amounts with the appropriate mixing time and good maintenance of the mixer are important.

Dann noted that pushing up feed within the first hour of delivery helps with sorting.

Preparing the cow for the next lactation with how she is fed in the dry period is also important.

Both Waybright and Heltzel indicated they keep their dry cow rations simple.

“We look to control energy intake for her to have a good appetite after calving, while providing enough metabolizable protein to build her protein reserves as a dry cow,” said Dann, adding that they are big advocates of amino acid balancing for both lactation and dry cow rations.

Dann said the fat is the most variable component in milk. She talked about the composition of milk fat and testing that is available to know the fatty acid composition – whether preformed fatty acids, De Novo fatty acids and the amount of mixed profile fatty acids.

The De Novo fatty acids are made in the mammary gland and formulated through rumen activity. The mixed profile can include De Novo as well as pass-through ingredients from the ration.

“The fiber in the diet, when fermented in the rumen, creates the building blocks of the milk fat,” said Dann, adding that the microbial protein that is part of this process is also a great source of amino acids for the cow on the protein production side.

In a 40-herd study, Miner looked at the components and found high fat herds also had high levels of the De Novo fatty acids – the ones produced in the mammary gland from rumen function. This finding supports the idea that focusing on rumen health maximizes fat and protein production, whereas the amount of time cows spend in low rumen pH can reduce milk fat production and may reduce milk protein production.

The research showed that high De Novo fatty acid herds tend to have managers that are five times more likely to deliver feed twice a day in a freestall environment and 11 times more likely to deliver feed five times a day in tie stalls.

“Fresh feed delivery motivates cows to eat,” said Dann. “The 2x/day feeders vs. 1x/day feeders saw decreased sorting, increased feed intake and milk yield as well as rumination for a healthier rumen. That higher pH translated to more De Novo fatty acids which led to higher fat content in the milk.”

The research also showed that among the 40 herds, the higher fat herds were 10 times more likely to be provided with at least 18-inches of bunk space per cow and 5 times more likely to see stocking densities at 110% or less.

“Overstocking changes feed behavior,” said Dann. “With overcrowding, the cows slug feed and are more aggressive at the bunk, and this decreases rumination, which modifies rumen pH and increases risk of subacute acidosis or time spent in low pH. When we see up to two hours or more a day of low rumen pH, this affects milk yield and components.”

Miner research also has shown that cows will prioritize lying time over eating time. They will sacrifice eating time to compensate for lost resting time. This is why paying attention to the time budgets of cows in milking and holding time is important, as well as keeping feed at the bunk so they are not standing around at the bunk not eating.

“We want them eating or lying down, not standing and waiting,” said Dann.

In short, said Dann, “We want to manage the herd, the cows, to optimize key behaviors that maximize milk components.”

This means implementing cow comfort strategies that enhance rest and rumination, keep feed available 24/7 and lead to consistent feed quality.

Carefully formulated rations plus great forage and feed management plus top notch management of the environment add up to more components – a key to more milk income.

-30-