
 Author’s Note: Amazing how even more true this piece from 2016 rings today in 2018. This “Growing the Land” column was originally published two years ago in the July 20, 2016 edition of the Register-Star in New York’s Hudson Valley. Indeed, it is still timely today, two years later, as summer memories are still grand and dairy farm milk price margins are still poor — and as a society we continue to incrementally lose the soul of our food, which we may not even fully appreciate or realize is happening.
By Sherry Bunting, originally published July 20, 2016 Register-Star
The fresh flavors of summer are in — sweet corn, tomatoes and, of course, ice cream. In fact, July is National Ice Cream Month, and it is certainly hot enough for some extra frozen goodness.
Summer foods bring back summer childhood memories: Celebrating first pickings with a dinner of simply sweet corn and sliced tomatoes. Or an ear of sweet corn for breakfast — no sugar required.
And then there were those summer evenings when Dad would get in just before dark, singing: “I scream, you scream, we all scream for ice cream!” Off we’d go to the nearby ice cream shop where the number of flavors made our heads spin and the homemade goodness left us smiling.
So much goes into producing these simple pleasures we may take for granted. I recently ran into a cousin of mine attending an event I was covering for the ag papers at a dairy farm in southern York County, Pa., that had been in two branches of our family four generations earlier. He had grown up in Baltimore and now lives on a nearby small farmette that had stayed in our great uncle’s family, renting a little crop ground to a neighbor.
I had brought my then 94-year-old grandmother to the farmer-meeting. My cousin Tom decided to come over also — curious to see the place as a modern dairy farm that had some historic significance to our family.
I was there just doing my job.
Before the farm tour, the event gave farmer-attendees a run-down of the latest business improvement resources for managing below-cost milk prices and updates on various regulations.
Unlike my cousin, I had spent my high school and college years working for nearby dairy farms — milking cows, feeding and caring for livestock, running equipment; beginning later a career as an ag and markets reporter. I was accustomed to the farm life my cousin had not experienced.
Having a deep appreciation for local farmland around his current home, he attended this first-ever farmer meeting and found it to be an eye-opener.
“How do they keep doing it?” he asked. “It sounds like they have to interact with a lot of regulations and governmental departments to get it all done.”
He was also surprised by the number of young people at the meeting, whereas I had many times witnessed the passion of next generation farmers — their love for bringing new life into the world and their dedication to nurturing life, which in turn produces for the rest of us a bountiful harvest.
He just shook his head in wonder. Why do they do it? Why do they carry-on this time-honored tradition of feeding the world? Why do they do the hard work for an often thankless society? And how do they keep pushing forward through daily chores and challenges when the prices they receive for their products are often below what it costs them to produce it?
This is certainly the case for dairy farmers over the past 12 to 18 months. (2018 update: that situation is going on 4 years now). Their farm-gate milk price has dropped 40 percent below 2014 levels and is roughly where it was 40 year years ago, while the input costs continually increase.
There are roughly 2 million farms of all kinds and sizes in the U.S., but less than 40,000 of these farms are dairy farms. The dairy farm sector may be small in number, but they represent the largest economic driver in dairy states like Pennsylvania and New York, where they account for half the cash farm receipts in the state, and one job is created in the greater community for every 9 dairy cows on nearby farms. Nearly half of those jobs are related to dairy farming and the service and supply sector, and the other half related to dairy processing and other downstream aspects of the dairy economy.
Dairy farms are often a linchpin for the infrastructure relied upon by all farms in a region.
In these tough economic times, dairy farmers are exhausting credit lines, spending their savings, borrowing on the equity of their land and looking for other work to add to their already busy days — just to pay the bills for the goods and services that are associated with feeding and caring for the cows, servicing and keeping up the equipment, and other aspects of economic revenue generated throughout the community by the production of milk.
If milk prices don’t turn around soon, more dairy farms will be lost. (That was in 2016… Fast forward to 2018, the rate of dairy farm loss has accelerated even more, in some areas these sell-offs are up 30% this year)
Families who have expanded their dairy operations in the past five to seven years — when industry and government asked them to produce MORE milk to fuel what was a rapidly growing yogurt industry in the Northeast at that time — now find their investments at risk because of the low prices paid for their milk today.
A reported oversupply of milk, globally, has depressed the commodity markets on which the federally-regulated milk prices are based in a globalizing industry. Regionally, dairies are also losing access to markets for their milk in the Northeast U.S. as consolidation at the dairy retail, processing and marketing levels continues at a rapid pace. (This hit an unprecedented level in 2018, though this was written in 2016).
What can consumers do to support the agriculture and dairy farms that support their communities?
1) Thank a farmer, when you have the opportunity, and if you have questions about food and farming, don’t rely on ‘Google.’ Go to the source: Ask a farmer, visit a farm.
2) Buy local, whenever possible. Read labels, look at plant codes (check them out on whereismymilkfrom.com and @findmymilk on social media). Supporting local dairies is a sustainable step every consumer can take. Look for other label clues about milk origin, such as the PA Preferred label in Pennsylvania. To earn that label, the milk is not only bottled at a Pennsylvania plant, it must come from a Pennsylvania farm.
3) Realize that dairy milk is nature’s ultimate protein drink, containing up to eight times more protein per serving compared with plant-based beverages that falsely call themselves ‘milk.’ In addition, the amino acid quality of dairy protein is unsurpassed among the fraudulent beverages that steal milk’s good name. Dairy milk is also a natural source of calcium and other essential vitamins and minerals with no added sugar, thickeners or other additives found in those plant-based not-milk beverages. And the truth is known, that full-fat dairy is good for us!
4) Realize how the local economy depends on local dairy farms and how 97 percent of U.S. dairy farms, regardless of size, are owned and run by families.
5) Understand that farmers are passionate about the dairy life — caring for the land and animals but they also need to operate the farm as a business. For example, they adopt new technologies, just like other businesses, as they strive to navigate the devastating price cycles. If farms are not profitable, their ability to continue to the next generation — investing into the local economy, jobs, environmental stewardship, open-space beauty, and fresh food security benefits — can not continue here for the rest of us to enjoy.
A former newspaper editor, Sherry Bunting has been writing about dairy, livestock and crop production for over 30 years. Before that, she milked cows. She can be reached at agrite@ptd.net.
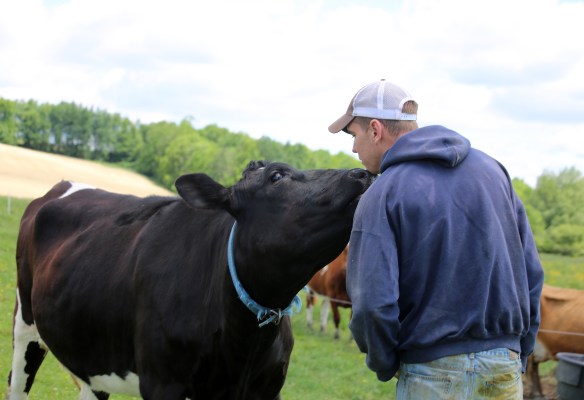
CAPTION for photo
July 12 was Cow Appreciation Day, and while we may think about the cows when we have delicious, nutritious dairy foods, we may not have a full appreciation for the farmers who are truly appreciating their cows — caring for them through all types of weather and markets. No matter the size or management style of farms today, 97 percent are family-owned and operated. New generations of young farmers, like Justin Pavlot of New York, are passionate about what they do, and dedicate themselves to this work, even as they navigate an uncertain economic future with today’s depressed milk prices. Sherry Bunting photo
 Author’s note: Since Milk Map Math was published April 6, I came across another
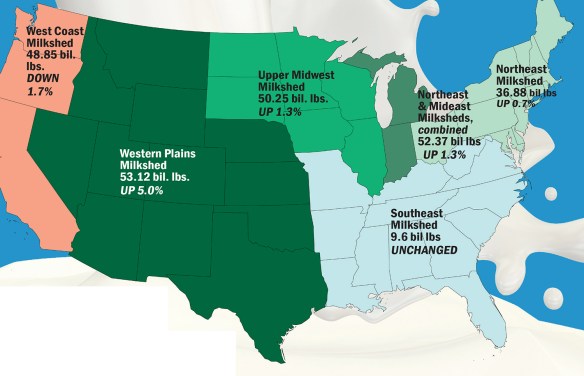
 While U.S. production was 215 bil. lbs., up 1.4% over 2016, the traditional Northeast milkshed, at 36.88 bil. lbs. added just 0.6%. Anchored by New York (up 0.9%), Pennsylvania (up 1.1%), Ohio (up 0.8%) and Vermont (unchanged), this milkshed includes other New England states that lost 3 to 5% and Maryland down 0.4%.