
 Author’s note: Since Milk Map Math was published April 6, I came across another interesting piece in April 11 Tank Transport Trader, where Dr. Mark Stephenson talks of the surpluses in the Midwest and West and states the 8 bil. lbs. Northeast milk deficit and 41 bil. lbs. Southeast deficit, and how the challenge is getting milk from the surplus areas to deficient areas. Read on, for Milk Map Math – 2017 data.
By Sherry Bunting, Farmshine, April 6, 2018
BROWNSTOWN, Pa. – Dairy consolidation away from the eastern U.S. continued in 2017, aided by further losses in basis revealed in the average net mailbox milk prices.
As the state and regional variations in mailbox milk prices move closer to a national price, the losers on the map are the states encompassed by the Federal Orders with highest Class I utilization: Northeast, Mideast, Appalachian, Southeast and Florida.
Not only is fluid milk the shrinking piece of the expanding pie, it is also the segment of the market with a legacy tied to local farms, family farms, farms that are getting dropped by bottlers as the milk bottling industry is also consolidating into wider spheres of milk sourcing.
The only way to slow this trend is to work directly with consumers and retailers because they have already told the dairy industry they want: local milk. Trouble is, the industry, and the checkoff dollars paid by these significant farms in the diminishing eastern region, are not listening to consumers. They’ve got eyes set across the seas on exports hitting 20% by 2025, while leaving the domestic market for nature’s most perfect food — milk — vulnerable and neglected.
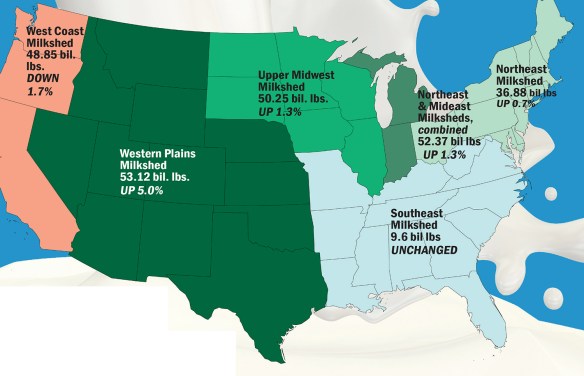
Meanwhile, the milksheds on both the East and West Coasts had production levels in 2017 that were lower or unchanged, while big gains in production in the Western Plains milkshed overtook all milkshed production for the first time.
 While U.S. production was 215 bil. lbs., up 1.4% over 2016, the traditional Northeast milkshed, at 36.88 bil. lbs. added just 0.6%. Anchored by New York (up 0.9%), Pennsylvania (up 1.1%), Ohio (up 0.8%) and Vermont (unchanged), this milkshed includes other New England states that lost 3 to 5% and Maryland down 0.4%.
National-footprint cooperatives, like DFA and Land O’Lakes talk of the flood of milk in the Northeast.
Land O’Lakes is shrinking the Eastern base from 9 mil. lbs. per day to triggering penalties above 8.6 mil. lbs. per day, according to letters received by members. At the same time, different rules are applied in the Upper Midwest where demand will be affected by expansion of the Agropur plant driving expansion in the I-29 corridor.
DFA has placed a base program on members in parts of the Southeast, despite the Southeast deficit and virtually unchanged milk production in the milkshed, while different rules are applied elsewhere on the map, even in states that ship milk to the eastern states throughout the year and have a new powder facility in Kansas to balance that.
When the industry refers to the eastern markets being oversupplied, they are really talking about the ability of expansion areas of the U.S. to serve the markets and consumers of the East.
In particular, they are including in the description of a Northeast supply, the Mideast states of Michigan (up 3.3%) and Indiana (up 2.7%). Even when we figure in these states, the combined Northeast and Mideast milksheds produced 52.37 bil lbs in 2017, up 1.3%.
The Midwest milkshed — from Wisconsin and Illinois to the Dakotas, including the rapidly growing I-29 corridor of Iowa, Minn. and South Dakota — made 50.25 bil. lbs, up 1.3%.
The sea of green in milk production, however, can be found in the Western Plains milkshed from Texas, New Mexico, Arizona in the south to Nevada, Utah, Idaho to the north, including rapidly growing Colorado, Kansas, Nebraska and Oklahoma. This milkshed grew by 5% to 53.12 bil. lbs.
Texas, alone, produced over 12 bil. lbs., up virtually 12% on the strength of output per cow and 7% more cows — leapfrogging both Pennsylvania and Michigan for the No. 5 spot — pushing Pennsylvania to 7th.
New Mexico grew 6.5% to 8.21 bil. lbs. with 4.3% more cows. Every state in this milkshed grew by more than 5% except for Nevada’s growth of 3.6% and number 4 Idaho’s small loss of 0.3%. The West Coast made 48.85 bil lbs, down 1.7% in 2017 with No. 1 California off by 1.7% and Pacific Northwest off by more.
Shifts in state and regional Mailbox Milk Prices tell the story. Losing the most ground relative to the U.S. average were Pennsylvania and the Southeast states. Both were averaged by USDA at $17.55 for 2017. In fact, the eastern Pennsylvania portion of that price was even lower, at $17.39.
Interestingly, the West Coast gained the most ground on net mailbox prices with California’s mailbox at $16.19, up 9.3% over 2016 and the Northwest at $17.59 up 10.2%.
Florida regained the number one position with a mailbox price of $18.96, up 9%, while the Southeast milkshed was tie for 10th with Pennsylvania at $17.55. This value represented a 7.2% gain over 2016 for Pennsylvania but just a 5.8% gain over 2016 for the Southeast.
New England was second at $18.65 and the Appalachian region regained third with a 2017 mailbox price of $18.09, up 8% over year ago. New York was $17.46.
Wisconsin had the fourth highest mailbox price in the nation at $17.95, up 7.6% while Minnesota was 9th at $17.56, up 6.4%. Iowa and Illinois were up 8 and 9% with mailbox prices of $17.69 and $17.96, respectively.
Ohio was up 9% with a mailbox average of $17.61, while Indiana was up 7.4% at $17.02.
Michigan, up 8.3% at $15.59, and New Mexico, up 5.4% at $15.24, were the states with the lowest mailbox prices. West Texas garnered a mailbox average at $16.77, up 8.6%.
Wisconsin and Pennsylvania remained the top two for the number of licensed dairy farms. Pennsylvania lost 80, down 1.3% at 6570. Wisconsin lost 430 at 9090, down 4.6%.
Overall, the U.S. milk production increase of 1.4% came from 67,000 more cow on 1600 fewer licensed dairy farms. Across the 50 states, the number of licensed dairy farms fell 4% to 40,219 and the number of dairy cows grew 0.7% to 9.3 million head.
Keep in mind, USDA milk production statistics are compiled, in part, using Market Admin. pooling reports for marketings relative to cow numbers. With milk moving in ways it never has before, there could be some gray areas in some of these state and regional tallies.
-30-
