U.S. 2020 milk production up 2.2%, but average number of dairies decline 7.5%

click to enlarge map

By Sherry Bunting, Farmshine, Friday, March 5, 2021

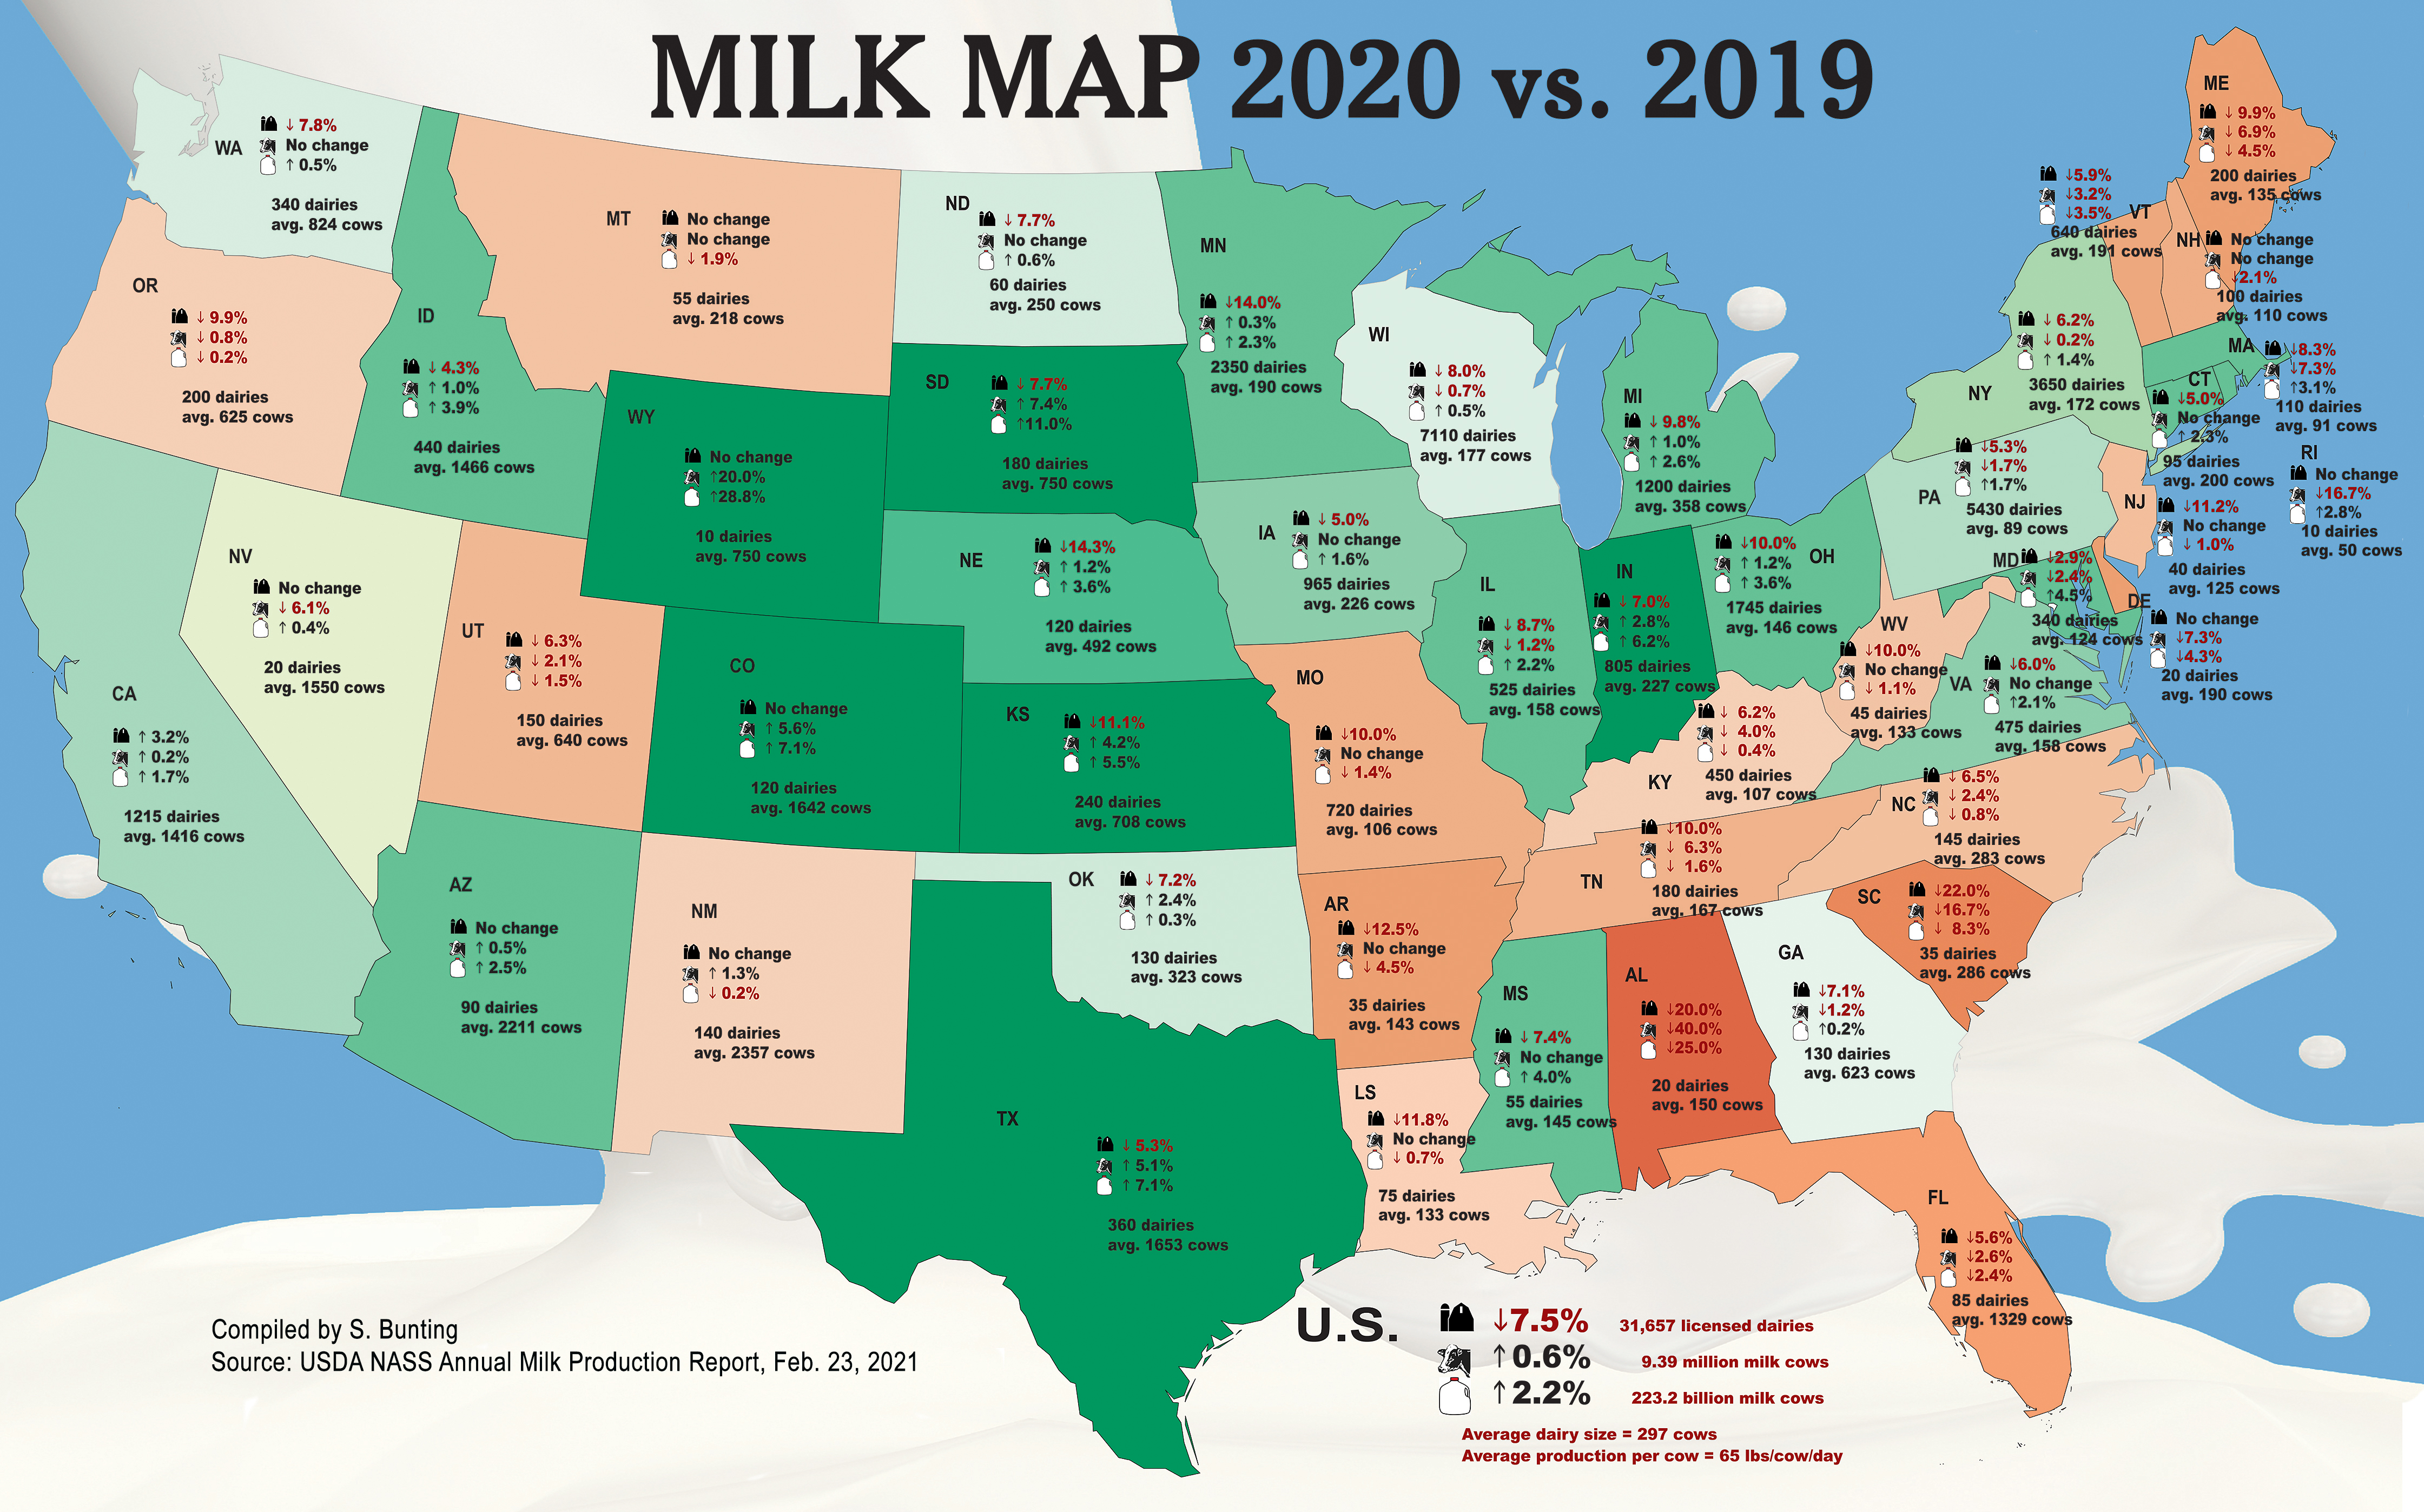
WASHINGTON, D.C. — The U.S. produced 2.2% more milk in 2020 compared with 2019 and did so with 51,000 more cows and 2550 fewer farms nationwide. The average number of milk cows for the year increased 0.6% over year ago and the average number of licensed dairies decreased 7.5% compared with 2019. 

While the number of dairy farms lost in 2018 and 2019 were larger, the percentage of decline in dairy farms for 2020 is the largest single year decline because the total number of farms from which to figure the percentage is smaller. 

The number of licensed dairies in the U.S. averaged barely above 30,000 in 2020 at 31,657. The rate of attrition has averaged 5% annually over the past decade with 2018 being 6.5%.

Some data of the data shown in last week’s USDA report raise questions about how milk production is counted and reliance on Federal Order pool information given all the massive depooling of milk we saw in 2020 (and continuing). When additional 2020 data come in, we’ll do some additional analysis.

To be clear, USDA’s annual milk production report, released last week, computes the average number of cows and the average number of licensed dairies for 2020 vs. 2019, so it is more like a rolling average for the year. These are not end-of-year numbers.

In looking over the data, it is interesting to see states in New England, like Massachusetts, Rhode Island and Connecticut, gain production while losing cows and farms even though the larger dairy producing New England state of Vermont saw production slip by 3.5% in 2020, cow numbers down 3.2% and farm numbers fell by 5.9% to 640. 

It is also intriguing to see production gains in the Mississippi data from USDA, despite cow and farm losses there, and despite being next to USDA-reported production declines throughout the rest of the Southeastern states, except for Georgia, where production was about steady, cow numbers were off by less than 1%, and dairy farm numbers were down 7.1% at 130. Florida’s production, cow numbers and dairy numbers all declined by 2.4, 2.6 and 5.6%, respectively.

Some of the states with the largest gains in milk production also had the highest percentage-loss of dairy farms.

Minnesota, for example, grew production by 2.3% despite the number of cows declining by 1000 head and the number of licensed dairies declining a whopping 14%. But the gain in milk production for Minnesota, at 10.15 billion pounds for 2020 has the state’s producers nipping at Pennsylvania’s heels for the 7th place ranking.

Pennsylvania’s 2020 milk production at 10.27 billion pounds was up 1.7% over year ago, although cow numbers were down 8,000 head (off 1.7%), and there were 300 fewer licensed dairies – a 5.3% decline from 2019. The average number of licensed dairies in the Keystone State during 2020 was 5430.

Just north, New York’s production grew 1.4% with roughly the same number of cows but 6.2% fewer dairy farms as the number of New York dairies fell by 240 (6.2%) to 3450 in 2020. Just south, production reportedly grew by 4.5% in Maryland (despite 2.4% fewer cows?). Production also grew 2.1% in Virginia with no change in cow numbers. The number of licensed dairies in Maryland fell by 2.9% to 340, while the number in Virginia fell by 6% to 475.

The Appalachian / Southeast states of Kentucky and Tennessee saw production ebb by 0.4 to 1.4% despite losing 4% and 6.3% of their cows, respectively. Tennessee had 10% fewer licensed dairies at 180, while Kentucky’s dairy numbers fell 6.2% to 450.

However, just north of those states, the Mideast states of Indiana, Ohio and Michigan added a lot more cows in 2020, especially in the third and fourth quarter ahead of the massive new cheese and ingredient plant getting into production at the end of 2020 in St. Johns, Michigan. Indiana grew production 6.2% with 2.8% more cows and 7% fewer dairy farms. Michigan had already been in growth phase for years, stabilized through 2018-19, and grew production 2.6% in 2020 with 1% more cows. However, Michigan lost almost 10% of its dairies in 2020. Ohio also lost 10% of its licensed dairies last year, but grew production 3.6% with 1.2% more cows.

Across to Iowa and Illinois, production grew 1.6 and 2.2%, respectively, but the number of dairy farms fell 5.0 and 8.7%, respectively.

Throughout the growth area of the Central Plains, South Dakota produced 11% more milk with 7% more cows but nearly 8% fewer dairies. Next door, Wyoming’s 10 dairy farms grew the state’s production by almost 29%. Colorado’s dairy numbers stayed the same, but with 5.6% more cows, they made 7.1% more milk. 

Rounding the bend in Kansas and Nebraska, the number of dairies fell 11.1 and 14.3%, while cow numbers grew 4.2 and 1.2% and production grew 5.5 and 3.6%, respectively.

Sandwiched between the rapid growth in the Plains and the Indiana-Ohio-Michigan triumvirate is Wisconsin – the Dairyland State – where 2020 production was just half of one percent (0.5%) above year ago. Cow numbers in Wisconsin fell by almost 1% and the number of dairy farms declined 8% to 7110, a loss of 610 dairies.

In the Southwest and West, Texas continued its multi-year rapid growth pattern as production increased 7.1% with 5% more cows, although the number of dairies fell 5.3%. In fact, Texas is nipping at New York’s heels for the 4th place ranking in milk output volume. In New Mexico, production was about steady, with 1% more cows, and the number of dairies was unchanged. Idaho grew production 3.9% with 1% more cows and 4.3% fewer dairies while Arizona grew production 2.2% with the same number of dairies and a few more cows.

California grew production 1.7% but lost over 3% of its dairies while the Pacific Northwest was generally steady on production and cow numbers but lost roughly 8% of the dairies.

The annual production report can be found here.

op 23 milk production rankings for 2020 milk production are as follows:

  1. California (41.3 bil lbs),
  2. Wisconsin (30.7 bil lbs),
  3. Idaho (16.2 bil lbs),
  4. New York (15.3 bil lbs),
  5. Texas (14.8 bil lbs),
  6. Michigan (11.7 bil lbs),
  7. Pennsylvania (10.3 bil lbs),
  8. Minnesota (10.1 bil lbs),
  9. New Mexico (8.2 bil lbs),
  10. Washington (6.8 bil lbs),
  11. Ohio (5.6 bil lbs),
  12. Iowa (5.4 bil lbs),
  13. Colorado (5.1 bil lbs),
  14. Arizona (4.9 bil lbs),
  15. Indiana (4.3 bil lbs),
  16. Kansas (4.0 bil lbs),
  17. South Dakota (3.1 bil lbs),
  18. Oregon (2.6 bil lbs),
  19. Vermont (2.6 bil lbs)
  20. Florida (2.3 bil lbs)
  21. Utah (2.2 bil lbs)
  22. Illinois (1.8 bil lbs)
  23. Georgia (1.8 bil lbs)

-30-

Dairy data show shifting sands

Pa. production, cow numbers plunge into 2019

By Sherry Bunting, Farmshine, Friday, March 15, 2019

WASHINGTON, D.C. — The U.S. produced 1% more milk in 2018 compared with 2017 and did so with roughly the same “average” number of cows for the year. But there were 2,731 fewer U.S. dairy farms (-6.8%) selling milk during 2018 as the average number for the year fell to 37,468 according to USDA.

USDA is still catching up on its delayed milk production reporting after the government shut down earlier this year, the January 2019 figures were released Tuesday (March 12) along with the 2018 annual totals for production, cow numbers and licensed dairies. The data show shifting sands in the dairy industry even as producers, states and regions fight for their place in a consolidating pipeline.

The January portion of the report did show milk production up 1.3% over year ago after being only 0.8% higher in December. January cow numbers were down by 52,000 head, nationally, from a year ago, but up 2000 head from December.

Like a shot between the eyes, Pennsylvania came into 2019 with a whopping 25,000 fewer milk cows (-4.8%) producing 5.5% less milk in January compared with a year ago.

Licensed dairies, other 2018 data

In the 2018 portion of Tuesday’s report, it’s important to note that USDA describes its licensed dairy numbers as the “average number of dairy farms licensed to sell milk during the year, based on counts collected from State and other regulatory agencies.” This means the number of 2018 dairy farms nationally and by state is more along the lines of a rolling average for the year, not a tally of farms in operation at the end of the year for a tracking comparison.

Changes in cow numbers and production for fourth quarter 2018 vs. fourth quarter 2017 is more telling in terms of what it suggests about the rate of exits, consolidation and geographic shifts in the dairy industry. The figures continue to reflect big milk production and cow number gains with a stable number of farms in growing western states, stable production in the face of dairy farm exits and cow losses in some midwestern states, and falling milk production that directly mirrors farm and cow losses in most eastern states.

PA numbers concerning

For Pennsylvania, the figures are quite concerning as the state falls into this last category – right along with the Southeast. In fact, New York was the exception in the East, as the Empire State had stable production in the face of significant farm and cow losses.

Just 11 years ago, Pennsylvania was the fourth largest dairy production state. It then hung on to fifth place until 2016-17 when Michigan — and then Texas — pushed Pennsylvania to seventh.

USDA reports the average number of licensed dairy herds in Pennsylvania fell from 6,570 in 2017 to 6,200 in 2018. Again, this is an average number of dairy farms selling reported milk during the year, not an end-of-year number of remaining operations.

In July (2018), we asked the Center for Dairy Excellence for a handle on the number of licensed herds operating in Pennsylvania at that point in time. What we learned was that the state does not have a good tracking system for licensed herd numbers and that the state is working with the Pennsylvania Milk Marketing Board to get a better handle on these numbers.

The number we were given by the Center in July 2018 was 5,787 licensed dairy farms, but we were told that we “cannot compare this number to the USDA numbers because it is not the same data set.”

Still, the USDA notes in its report that it relies on state agencies for the numbers it uses to find the “average” number of licensed dairy farms state by state, for the year.

The difference between the number of dairy farms that exited the business in 2018 and the net number of dairies selling milk throughout the year is unknown in Pennsylvania.

Did Pennsylvania lose 370 dairy farms as the year over year “average” reported by USDA suggests? Or is that number closer to 700 if the state could provide end-of-year numbers for comparison?

End-of-year comparisons would be more helpful for policymakers to track the health of the dairy industry, whereas the average numbers reflect the type of information the industry wants to use in “sustainability” or “carbon footprint” claims because a certain level of milk production for the year would be produced by an average number of farms and cows during the year — not by just the number remaining at the end of the year.

Even using the USDA average for the year, Pennsylvania dairy farm numbers were down by 370 (-5.6%) and the average number of cows for the year was down by 6,000 head (-1%). Total annual milk production was 10.6 bil lbs (-2.1%) for 2018.

However, fourth quarter production in Pennsylvania was 4.6% lower than Q4 2017. This shows a deeper rate of decline, which was confirmed by the steep loss in cow numbers and production recorded for January 2019 in which USDA reported 25,000 fewer cows were milked in Pennsylvania, making 5.5% less total milk production for the state.

To put this into perspective, Wisconsin state officials estimate that over 700 dairy farms were lost in 2018, but the USDA report pegs the average number of dairy farms in the Dairyland State at 8500, down 590 (-6.5%) from 2017.

Production in Wisconsin, on the other hand, moved higher, reaching 30.5 billion pounds (+0.8%) for the year. The average number of milk cows in Wisconsin fell by 4,000 head (-0.3%).

With Wisconsin and Pennsylvania being the number one and two states for the number of dairy farms, the data differences are illustrative. While communities sustained high dairy farm exits in Wisconsin affecting community-wide dairy infrastructure, the state is still maintaining national average milk production growth and smaller losses in the number of cows relative to the losses in the number of farms.

This suggests that as farms exit the dairy business in Wisconsin, others have growth making up for it. In fact, January’s production in Wisconsin was up 2.9%, according to USDA, despite 5,000 fewer cows reported. That one is a bit of a head-scratcher.

In Pennsylvania, the situation is much different. As the Keystone State loses farms, the cows and production are leaving also. Those losses are not being replaced with in-state growth.

This means Pennsylvania’s entire dairy infrastructure is at risk, and we are seeing more dairy herd liquidations slated for this spring – just like last spring – both nationally and in Pennsylvania. The question is, will Pennsylvania’s ranking in the top 23 milk-producing states continue to decline or can it be stabilized?

Case in point, 2018 annual milk production for Texas was 12.8 bil lbs (+6.1%). That’s 21% more milk than the 10.6 bil lbs produced by Pennsylvania in 2018. Not quite two years ago, Pennsylvania was producing more milk than Texas.

Another comparison to be made here is with Minnesota. Ranked eighth and nipping at the heels of Pennsylvania. Minnesota saw the average number of licensed dairy farms fall by 230 to 2,980 (-7.16%) in 2018, and cow numbers fell by 5,000 (-1.1%). However, Minnesota’s annual milk production in 2018 was unchanged from 2017 at 9.87 bil lbs. Minnesota came into January with 1.6% more production, still down by 5,000 cows.

Northeast milkshed mixed

Back to the Northeast Milkshed, the USDA figures for New York show a similar pattern to Wisconsin and Minnesota as the average number of farms selling milk in 2018 was down by 280 (-6.3%) at 4,190 while cow numbers were down just 2000-head (-0.3%) and production for the year was stable at 14.88 bil lbs (-0.3%). Milk production in New York came into 2019 at levels 3.4% higher in January with 2000 added milk cows compared with a year ago.

Vermont followed a pattern more like Pennsylvania, with the average number of dairy farms selling milk in 2018 down by 90 farms (-10%) while the average number of cows was down by 2000 head (-1.6%), and annual milk production was 2.68 bil lbs (-1.8%). Vermont’s production stabilized a bit into the new year, with January’s production just 0.8% below year ago.

In Virginia, USDA reported 565 dairy farms (-3.1%) sold milk during 2018 with annual milk production down by 5.4% from 4,000 fewer cows (-4.5%). Virginia came into 2019 with a whopping 9,000 fewer cows producing 11.5% less milk in January compared with a year ago.

These data illustrate a couple of things. First, some cooperatives, including national footprint cooperatives like Land O’Lakes and DFA, are enforcing some type of base/excess or seasonal base penalties. In the case of Land O’Lakes, farmers in the East, namely Pennsylvania, have had three to four months out of each of the last three years where milk was penalized for being over base, and the base the company gives the entire eastern region as its individual base trigger has been reduced over those three years. Meanwhile, the members in Minnesota report they have not been penalized to-date.

The data also illustrate that as fluid milk sales decline in the East where Class I sales have been historically more relevant to milk handling, pooling and pricing, the “balancing” costs are reportedly increasing, and those costs are passed back to the farm level through more milk check deductions.

In some ways, the fluid milk market is diminishing to the point where it could be seen as a balancer for manufactured dairy products — even though that’s not the way the USDA Federal Order pricing works.

Coinciding with these market shifts is the rise in documented incidence of supermarkets being randomly short or depleted of available whole milk and cream products throughout the East and Mideast at intervals during all of the past 12 months.

Meanwhile, tolling agreements with cream separation facilities in the East, especially through Land O’Lakes, bring milk from as far away as west Texas to states like Pennsylvania, where the cream can go into butter and the skim is often what pushes the Federal Order One skim dumping requests. There are a number of methane digesters dotting the Northeast and Midatlantic landscape, and this dumped skim milk can put another drag on the Class I sales pool for the region.

Mideast dynamics interesting

Interesting dynamics are also occurring in the Mideast states of Michigan, Ohio and Indiana, where farm losses as a percentage of total farms were also steep in 2018, but milk production was comparatively stable.

Michigan had grown rapidly in 2014 through 2017. For 2018, however, USDA reported 230 fewer farms (-13%) selling milk while annual production was off by just a fraction of one percent (-0.6%) at 11.17 bil lbs. Michigan milked an average number of cows that was down by 3000-head (-0.7%) in 2018. And yet, Michigan came into 2019 with 6,000 fewer cows but 1.1% more milk in January compared with a year ago. Another head-scratcher.

Ohio lost 180 dairy farms on average in 2018, according to USDA, declining to 2200 dairy farms (-7.5%) while average cow numbers for the year fell by 6,000 head (-1.9%) and production fell to 5.5 bil lbs. (-1.5%). When comparing fourth quarter cow numbers in Ohio, 2018’s total was 10,000 head less than Q-4 2017. January 2019 production in Ohio was 3.8% below year ago.

Indiana’s production was 4.16 bil lbs in 2018 (-2.2%) with 95 (-10%) fewer dairy farms selling milk during the year and 3,000 (-1.6%) fewer cows. Indiana came into 2019 with 6,000 fewer cows and 3% less milk production in Jan. 2019 compared with a year ago.

Southeast slide continues

In the Southeast, Florida had 15 fewer dairy farms in 2018 and Georgia was down by 20. Annual production was down 4.6% and 4%, respectively, in 2018 with an average of 4,000 fewer cows milked in Florida and 2,000 fewer cows in Georgia during the year.

Kentucky had 60 fewer dairy farms selling milk (-10%), an average of 1,000 fewer cows being milked (-1.8%), and annual production fell by 3.2% in 2018, according to USDA.

In Tennessee, the picture was especially tough, but consistent across all categories of figures. Annual milk production in the Volunteer State was down by a whopping 8.5% in 2018, while the average number of cows was off by 3,000 head (-7.5%) and 20 fewer farms sold milk (-7.5%) during the year, according to USDA.

Western gainers gain big

On the growth side of the ledger, Colorado stayed unchanged in the number of dairy farms at 100, milked 14,000 more cows and produced 8.8% more milk during 2018. By January 2019, production was up by 6.7% over year ago. Kansas lost 10 farms but produced 6% more milk with 10,000 more cows in 2018. Kansas also came into 2019 with 6.2% more milk in January.

Texas came into 2019 with 18,000 more cows than a year ago in January, producing 7.3% more milk and South Dakota had 4,000 more cows producing 6.3% more milk.

Look for more milkshed milk math analysis when pricing and other data become available in April and May.

-30-

Faith, focus, friendships, fighting for each other’s survival: Dairywomen share insights, Part Two

AUTHOR’S NOTE: A dozen women from multiple generations, states and farm sizes respond to the same questions. Part one and Part three also ran… here below is part two

By Sherry Bunting, Farmshine, November 23, 2018

BROWNSTOWN, Pa. — When asked what challenges and opportunities women see for dairy farming today into the future, “sustainability” comes to the forefront, but not in the way we often see this term used.

“The biggest challenge is, of course, sustainability… Can we survive!?” writes Joy Widerman, the youngest partner-owner of the second generation of the Hess family operating JoBo Holsteins, a 1075-cow dairy that grew to include multiple families and generations after her parents John and Bonnie relocated from Lancaster County to Adams County, Pennsylvania in the 1970s.

Joy is herdswoman and takes care of reproduction and genetic decisions, so she is continually looking ahead at the registered Holstein and Brown Swiss herd’s future.

“We are doing everything in our power to be profitable, but with so many unknowns in the dairy industry, it’s hard. From milk prices to feed prices, to weather — farming is one of riskiest jobs to have,” Joy relates.

She wonders how dairy farms will “make room for future generations to join.”

Profitability is the key to achieving that, and experts suggest diversification.

“But with the market as scary as it is,” writes Joy. “How do we do that? These are questions my family faces everyday… What’s next?”

Alicia Haag of Mohrsville, Pennsylvania also talks about the uncertainty. “We don’t know what tomorrow brings,” she says. “So we clamp down hard on our faith and try to feel the blessings of having this opportunity to grow up in America and be blessed with what we have at the moment.”

Alicia finds it difficult to see all the herd dispersals happening, and she tries “not to dwell on the bad” and to remain thankful to have children with a keen interest in the farm that has been in her husband’s family for seven generations.

She and her husband Mike milk 76 registered Holsteins in a tiestall barn. She takes care of the night milking with her daughter and occasional help from a neighbor. She is responsible for calf care and feeding, and helps anywhere else she is needed. She has also been working off the farm as a construction-zone flagger for a local contractor since 1999.

In the last year or two, Alicia has increased her off-farm hours, working two or three days a week, every week, to help bring income back to the farm. She often flags beside other local dairywoman on job sites all over.

“It’s hard for moms to find a job off the farm that provides good enough pay to make income after paying the help that replaces you at home,” Alicia notes. “There aren’t many jobs that also give the flexibility I need to be able to successfully be a mom and farm wife.”

She hopes other employers will consider flexibility the next time they consider employing a farm wife.

“If we want to help the farming industry remain here, having off-farm jobs that offer a little flexibility could be a key,” Alicia suggests. “Employers should know that when they hire a farmer’s wife, they are getting someone who is going to come in and give 100%.”

This year has been particularly stressful on farm families, she observes: “We are tired between the economic stress and the weather. It’s hard to get yourself out of the funk. Trying to get crops off when you know the income isn’t there with milk prices, so you’re trying to do the crops right to get by with the income you have.”

The Haags, like others, had extra expenses with replanting and not being able to get forages off the fields timely this season. In times of stress, she cites the special importance of family, friends and networking with others as a way to rejuvenate optimism — whether it’s getting together with friends, a hug from someone who understands, or the ideas and support gleaned in a network of other farm women.

While there isn’t much time for it, Alicia loves sitting on her front porch and talking with her kids. “Most of the corn is off, and the cover crops are just starting to peek through,” she describes the November scene as a metaphor. “This is life — looking out, everything looks dead, but I know that in this field there are seeds planted, and it will soon be green again.”

For Karen Hawbaker of Chambersburg, Pennsylvania, living in faith surrounded with people who share her values have been keys to getting through the toughest of times.

“We can’t do life alone,” she says, noting the good in getting away, mentally and physically, even if just for a few hours. She believes dairy farmers need this, and sometimes the ‘one more thing to do’ can be replaced with ‘it can be done tomorrow.’

Karen started dairy farming with her late husband Rodney in the 1980s. Eight years ago, she lost him in a farming accident. Today, she operates the 200-cow dairy on her own with a team of employees and trusted advisors.

“If God helps get us through something, that’s another confirmation that we are where we are meant to be. We can’t do any of this without faith. It changes the whole outlook,” Karen explains, reflecting on how she felt the prayers of others in her loss. “I look around and see that I would hate to try to do this by myself. When we set ourselves apart, it causes divisions. We have enough divisions out there.”

Carol Williams of Madison, Georgia also observes how bringing people together — within and beyond the farm gate — provides what is her true definition of opportunity: “A set of circumstances that makes it possible to do something.”

She has been farming 42 of the 43 years she and Everett have been married. She has milked, fed calves, raised replacements, planted, chopped, hauled and spread crops for silage, fed cows, hauled cows, pulled calves, built fences, finished concrete, changed tires, done minor mechanic work all while raising four kids and being a homemaker.

Dairywomen balance a lot of competing priorities!

Today, their two sons take care of day-to-day management of the 1700-cow WDairy, and their two daughters help in the office and with dairy promotion and youth events.

“Being part of networks helps people to understand that they are not alone. Women on farms can be isolated, and with today’s economic atmosphere, they can be discouraged,” Carol observes, explaining how seeing other women go through the same things, getting tips on how to do things, and hearing encouraging words helps.

“When I was young, all the other wives were teachers, and I had no one to relate to. I would have benefitted greatly from a friendly network,” she recalls.

Without exception, dairywomen see the importance of reaching out beyond the farm gate as the percentage of the population in farming continues to diminish.

“All farmers have the same challenges of weather, low prices, high input costs, and labor shortages,” Carol notes, citing one of the biggest challenges as the amount of misinformation that is publicized daily about agriculture.

“Most people have no idea what is really involved in producing the food and fiber that they use daily. They believe that dairy farmers abuse their animals, that farmers purposely pollute streams and rivers, that we have 9-to-5 jobs with weekends off, that we are getting wealthy, that meat and dairy products are unhealthy, and that nuts can give milk,” she relates. “Even worse, they have been so brainwashed that you cannot hold a reasonable conversation to try and educate them about reality.”

These are the shared frustrations of many dairywomen engaging daily on the front lines of communication with consumers, their non-farm peers, at community events, while grocery shopping, by giving tours and on social media.

“Tours at the dairy are a great opportunity to show people just how much our animals mean to us, how their comfort and well-being are our number one priority and how complicated, technologically-advanced and exhausting dairy farming is,” writes Carol.

She tells about the Commercial Dairy Heifer Show Program in Georgia and the opportunity it gives FFA and 4-H youth — 95% of them not from farms. “Dairy farmers loan calves to the kids to raise, train and show. At the end of the show season the heifers are returned to the dairy farmer, and they can get another one for the next season.

“Not only are we teaching these youth about animal care and responsibility, we are educating them about dairy farming. By being exposed to this, many are choosing careers in agriculture,” Carol explains how it leads to more sharing opportunities to the family and friends of these young people.

In Gettysburg, Pennsylvania, Joy Widerman agrees that public understanding is huge in the sustainability — the survival — of family dairy farms. As a mother of three, her quest for balance keeps her focused.

“I know that if I spend too much time worrying about the future of JoBo, then I start to forget what’s truly important — my kids and my family,” she writes, noting that the third generation shows interest in the farm. Some work on the farm after school or after clocking out of their jobs. “Our farm is the backbone of our family. I try not to sugar-coat it. My kids know how hard it is to survive… and that we need to work hard at being profitable.

“I do everything I can to educate the public, so they know what farmers are facing,” she explains. Joy gives tours at the farm, speaks at local meetings of civic organizations and stays in touch through the farm’s Facebook page.

She believes farmers need to stay connected to each other and to consumers.

“Any opportunity we have to talk to others about what we are facing, we should do it,” Joy suggests. “We all need to realize we aren’t in it alone. It’s key that we all lean on each other… to talk and let our voices be heard. We need to fight for each other’s survival.”

Look for more dairywomen wisdom as this Farmshine series continues next week.

-30-

Win, win and win: Turning tough challenges into abundant goodness

Philabundance partners with local dairy farms to bring Abundantly Good dairy foods to those in need.

By Sherry Bunting as published in July 20 Farmshine

PEACH BOTTOM, Pa. — Great ideas often come wrapped in tough challenges.

For Lancaster County dairy farms and Philabundance — the Delaware Valley’s largest hunger relief organization with a 30-year history of rescuing and upcycling food — the urban and rural challenges of hunger, food waste and price-depressing surpluses have converged under the new ‘Abundantly Good’ business model and brand.

wCedar-6141.jpg

The folks at Philabundance are enthusiastic about working with Lancaster County dairy farms, like Cedar Dream(pictured) near Peach Bottom.

It’s mid-morning in July, and the day’s first milking and chores are done at Cedar Dream Farm. The 53 registered Holstein cows on this southern Lancaster County dairy farm lay comfortably chewing cud in the fan-cooled tiestall barn.

They will be turned out to pasture in the cooler overnight temperatures after the evening milking. Tended by Abner Stoltzfus, his wife Rebecca and the older of their eight children, the herd produces an RHA of 24,000M 3.9F 3.3P with somatic cell counts between 100 and 130,000. Their cleanliness and comfort tell the story.

wCedar-6342.jpg

Next to the spotless and kosher-approved processing room, the chiller holds not only finished products but also clean, bright white pails of fruit puree for yogurts. I was attracted to the in-season black raspberry!

Before looking in again on the cows and heading to the fields, Stoltzfus takes time to show me the dairy processing room and the chiller full of consumer-ready milk and yogurt in the small creamery built a little over a year ago on the farm.

He offers a pint of the strawberry drinkable yogurt. Creamy, with just the tiniest hint of color from the strawberry puree. It had all the farm-fresh flavor I was thirsting for. Yum.

We talk about how co-packing for Philabundance and Sunset Farms helped launch the Cedar Dream creamery last spring.

What began for Philabundance in the past few years — utilizing PASS (PA Ag Surplus System) funds from the Pa. Department of Agriculture to reclaim surplus milk and pay the processing, packaging and transportation to turn it into cheese — is now expanding with the funding from the new retail brand, according to Monika Crosby, assistant manager of food acquisition for Philabundance.

To increase their reach, Philabundance launched the Abundantly Good brand a year ago, focusing primarily on specialty cheeses. For each pound of cheese sold through retail partners, $1.00 is returned — totaling over $9,000 so far — to buy even more surplus milk to make even more cheese, and now yogurt, for the food banks, soup kitchens, Fresh For All farm markets for eligible families, and other Philabundance clients and programs.

Crosby shares her concern about the 40% of food that is wasted yearly in the U.S., while 1 in 5 Philadelphians don’t know where their next meal is coming from.

She grew up the daughter of a dairy farmer in the New York Finger Lakes Region. When her father met Amos Zimmerman of Dairy Pricing Association during a meeting in New York, the connection between Philabundance and Lancaster County dairy farms followed.

“There is an overabundance of perfectly good milk, and yet so much of it has to be thrown out. So, we developed a business plan with Sunset Farms to utilize surplus milk to create cheese and yogurt,” Crosby says, explaining that the surplus milk goes to Sunset Farms in Ronks for cheesemaking and butter. Excess skim from butter-making goes to Cedar Dream.

wCedar-6149

Abner Stoltzfus figures he’s made 8,000 pints of drinkable yogurt, with over half of it vanilla flavored, using surplus skim milk for Philabundance, and half from his farm’s own milk as Cedar Dream strawberry flavored drinkable yogurt (left) for the retailers selling Cedar Dream whole milk and whole chocolate milk (right). He also does other sizes, including 6-oz. bottles of milk and drinkable yogurt as well as cup-yogurt.

At Cedar Dream, the skim milk is heated to 108 degrees in the new vat pasteurizer. Yogurt cultures are added, and 12 hours later, flavoring is added. The process turns a pound of surplus skim milk into a pint of nutritious, full-bodied and flavorful drinkable yogurt — with nearly 4000 pints of vanilla made for Philabundance families since April.

This journey really began in the spring of 2017, when Philabundance used PASS funds to help divert 12 loads of surplus milk destined to be dumped. Local cheesemakers turned this into 66,000 pounds of natural, high-quality cheese for hungry Pennsylvanians, according to Crosby.

From that experience, the idea for the Abundantly Good brand was born during collaborations between Philabundance and its partners, including the Central Pennsylvania Food Bank and Chester County Food Bank, as well as the Pennsylvania dairy industry.

“We saw the great need for more high-quality dairy products… and decided to develop the Abundantly Good program to help fund our purchases of more dairy products for our community,” says Crosby.

The Abundantly Good specialty cheeses are sold to retailers like Di Bruno Brothers, Riverwards Produce, The Common Market and Third Wheel Cheese Co.

“We jumped at the chance to partner with Philabundance by selling Abundantly Good cheese, as it gave us the chance to sell something that tastes good and does good at the same time,” said Emilio Mignucci, vice president of Di Bruno Bros. in a press release. The specialty food retailer piloted the concept by carrying five varieties.

As they saw success with cheese, Philabundance went back to their farmers and learned there was excess skim milk from butter production.

“We determined that yogurt would be both delicious and nutritious for our families in need,” Crosby adds.

Stoltzfus says most of what his creamery does right now is co-packing for Philabundance, Chester County Food Bank and Sunset Farms. But he also brings a bit of his own herd’s milk in to package whole milk, whole chocolate milk, cup yogurt and drinkable yogurt under the Cedar Dream brand.

“They say it takes a full year to get started into on-farm processing. That’s about right,” says Stoltzfus, thankful for the opportunity to co-pack while he begins developing and marketing his own products. They are seeing a slow and steady increase by word of mouth in a few small local markets like the Solanco Market and East Drumore Foods.

“I want to provide consumers with a local Pennsylvania dairy product, fresh off the farm, and be happy with the product I produce,” he explains, emphasizing that this is not something that happens overnight. “I knew to be careful and not get too aggressive too fast. I want to take one step at a time, so I don’t fall.”

A former board member of Dairy Pricing Association, Stoltzfus understands the double-challenge of dairy excess pressuring farm milk prices and the plight of food-insecure families, so he was more than happy to do something that is beneficial for others.

“We have the facility to do this and are gladly doing it,” he says. “I figured we’d be focusing more on cup yogurt, but after sitting down with Philabundance, we started making the drinkable yogurt, and they seemed to really like that.”

Set up to bottle 400 to 500 pints per hour, he does about 500 to 600 pints per week with some weeks up to 3000 pints, but it’s the prep and everything else associated with having a creamery that takes time.

“I see the way things are going, the uncertainty, and I knew we better figure something out to keep us going,” he reflects.

While he likes being involved on the processing side, and sees more people exploring this option to help save smaller family farms, he’s quick to point out: “It does take some attention away from the farm and the cows.”

wCedar-6125

Copacking helps Cedar Dream creamery get established

He knows he needs to balance his time and growth, even though he’d love to take milk from every dairy farm that has contacted him as new market uncertainties emerge in his community, not just for independent producers, but also co-op members around how Sunday milk pickups are handled.

“I would love to say yes to everyone, but I am just getting started,” says Stoltzfus. “I can’t grow too fast ahead of myself. Getting established is very important.”

He is grateful to those who are helping along the way, including his lender, Ephrata National Bank, for seeing the vision in the creamery investment.

For Philabundance, it’s dairies like Sunset Farms and Cedar Dream that are a big part of the triple-bottom-line they seek with the Abundantly Good brand, according to Elizabeth Sanon, assistant procurement manager.

“This project has enabled us to provide quality dairy products that far surpass anything we’ve been able to offer to our families previously,” she says. “We are not only combating the need for better access to healthier foods… but are reducing unnecessary waste of agricultural products and creating an innovative new revenue stream for local farmers.”

Under the farmer-mantra of ‘leaving this place better than we found it,’ Sanon says that while the U.S. continues to lose family farms at a rapid rate, the number of food-insecure people continues to rise. “With Abundantly Good, we are able to create solutions within the community to address these problems.”

The hope is for the Abundantly Good brand to continue to grow in retailers and product lines to ultimately fund the free distribution of dairy products to those in need on a year-round basis.

To learn more about Philabundance, including its Fresh for All program and the Uplift and Upcycle partnerships, visit https://www.philabundance.org  or contact Kait Bowdler, deputy director of sustainability at sustainability@philabundance.org.

wCedar-6363

Abner and Rebecca Stoltzfus and their children milk and care for 53 registered Holstein cows and their replacement heifers. Cows spend the hot days in the fan-cooled tiestall barn and are on pasture in the cooler temperatures after the evening milking. They produce a 24,000-pound herd average with 3.9 fat, 3.3 protein.

-30-


Milk Map MATH…

map-1.jpgAuthor’s note: Since Milk Map Math was published April 6, I came across another interesting piece in April 11 Tank Transport Trader, where Dr. Mark Stephenson talks of the surpluses in the Midwest and West and states the 8 bil. lbs. Northeast milk deficit and 41 bil. lbs. Southeast deficit, and how the challenge is getting milk from the surplus areas to deficient areas. Read on, for Milk Map Math – 2017 data.

By Sherry Bunting, Farmshine, April 6, 2018

BROWNSTOWN, Pa. – Dairy consolidation away from the eastern U.S. continued in 2017, aided by further losses in basis revealed in the average net mailbox milk prices.

As the state and regional variations in mailbox milk prices move closer to a national price, the losers on the map are the states encompassed by the Federal Orders with highest Class I utilization: Northeast, Mideast, Appalachian, Southeast and Florida.

Not only is fluid milk the shrinking piece of the expanding pie, it is also the segment of the market with a legacy tied to local farms, family farms, farms that are getting dropped by bottlers as the milk bottling industry is also consolidating into wider spheres of milk sourcing.

The only way to slow this trend is to work directly with consumers and retailers because they have already told the dairy industry they want: local milk. Trouble is, the industry, and the checkoff dollars paid by these significant farms in the diminishing eastern region, are not listening to consumers. They’ve got eyes set across the seas on exports hitting 20% by 2025, while leaving the domestic market for nature’s most perfect food — milk — vulnerable and neglected.

Meanwhile, the milksheds on both the East and West Coasts had production levels in 2017 that were lower or unchanged, while big gains in production in the Western Plains milkshed overtook all milkshed production for the first time.

Chart
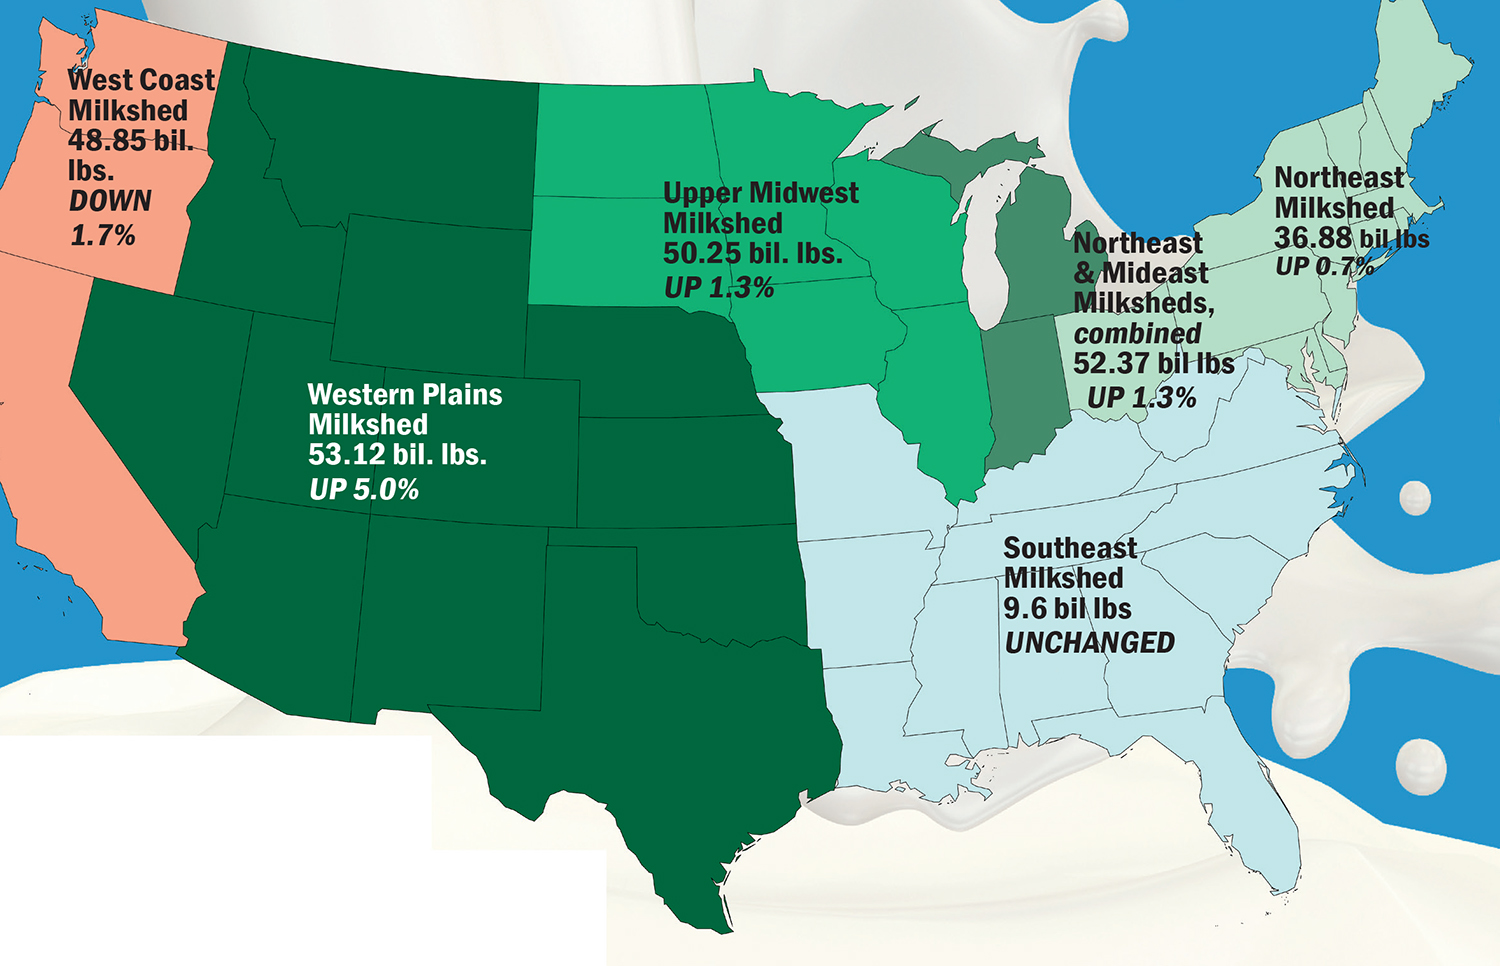
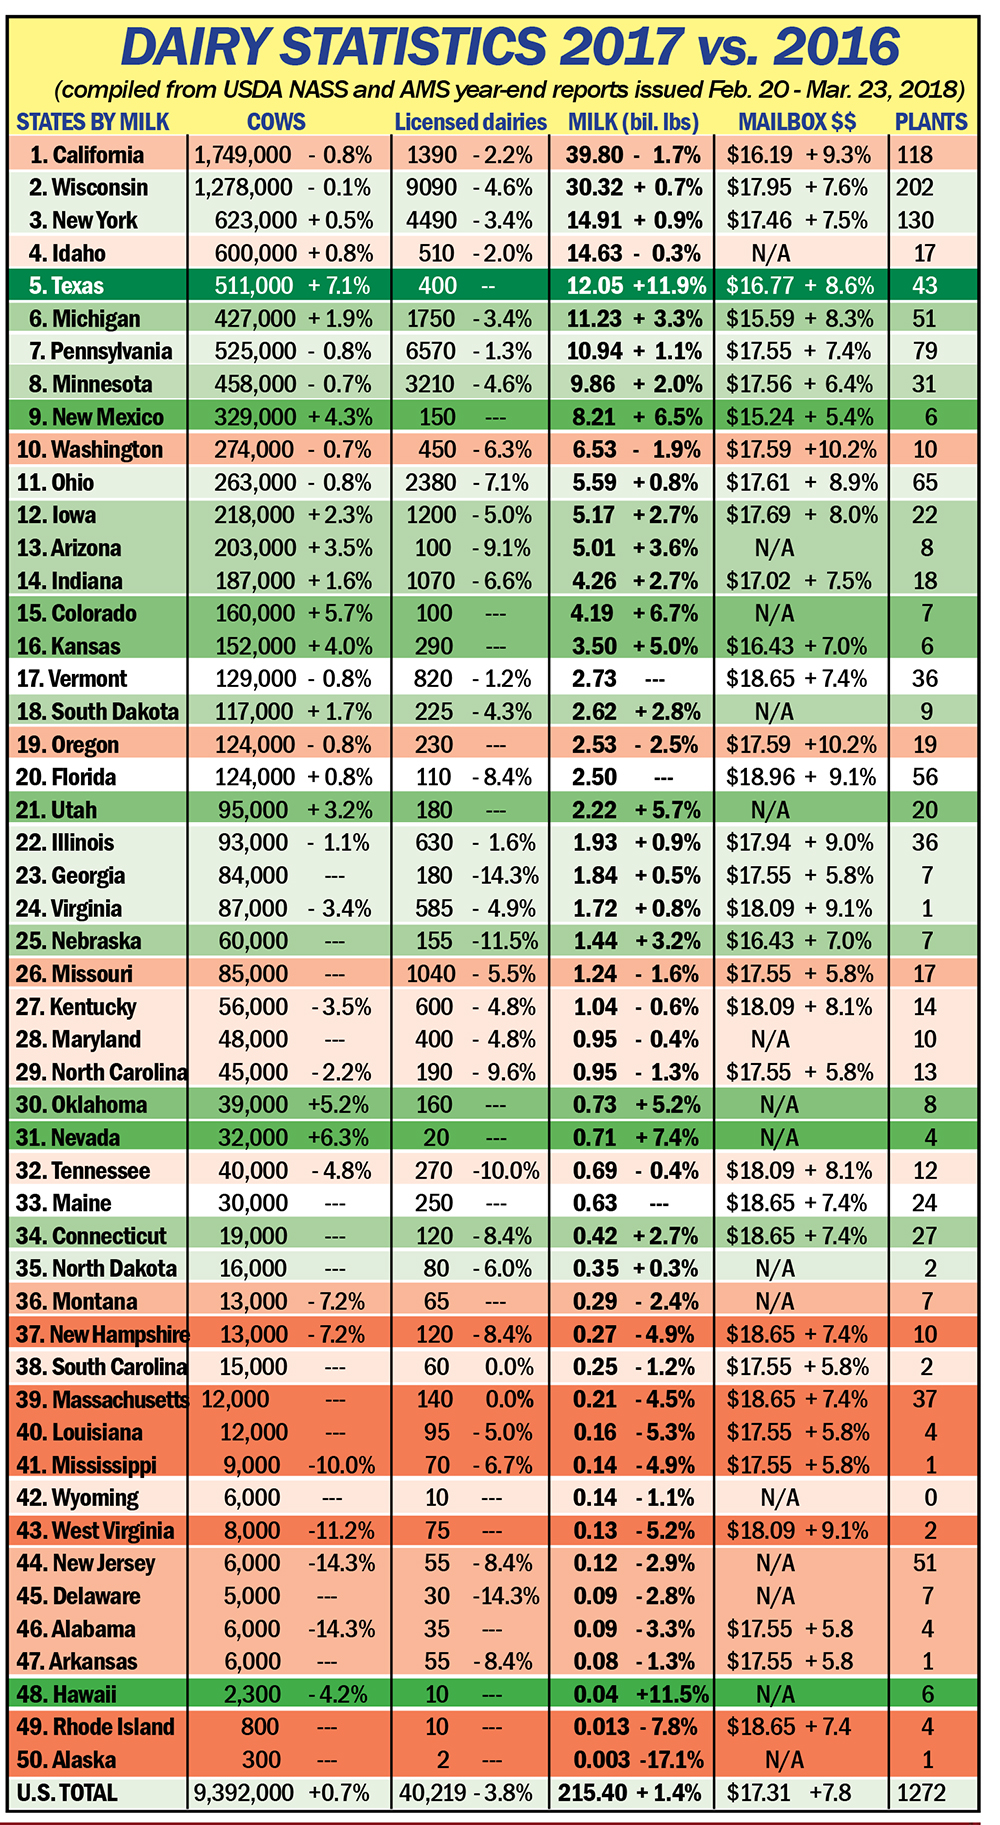
While U.S. production was 215 bil. lbs., up 1.4% over 2016, the traditional Northeast milkshed, at 36.88 bil. lbs. added just 0.6%. Anchored by New York (up 0.9%), Pennsylvania (up 1.1%), Ohio (up 0.8%) and Vermont (unchanged), this milkshed includes other New England states that lost 3 to 5% and Maryland down 0.4%.
National-footprint cooperatives, like DFA and Land O’Lakes talk of the flood of milk in the Northeast.

Land O’Lakes is shrinking the Eastern base from 9 mil. lbs. per day to triggering penalties above 8.6 mil. lbs. per day, according to letters received by members. At the same time, different rules are applied in the Upper Midwest where demand will be affected by expansion of the Agropur plant driving expansion in the I-29 corridor.

DFA has placed a base program on members in parts of the Southeast, despite the Southeast deficit and virtually unchanged milk production in the milkshed, while different rules are applied elsewhere on the map, even in states that ship milk to the eastern states throughout the year and have a new powder facility in Kansas to balance that.

When the industry refers to the eastern markets being oversupplied, they are really talking about the ability of expansion areas of the U.S. to serve the markets and consumers of the East.

In particular, they are including in the description of a Northeast supply, the Mideast states of Michigan (up 3.3%) and Indiana (up 2.7%). Even when we figure in these states, the combined Northeast and Mideast milksheds produced 52.37 bil lbs in 2017, up 1.3%.

The Midwest milkshed — from Wisconsin and Illinois to the Dakotas, including the rapidly growing I-29 corridor of Iowa, Minn. and South Dakota — made 50.25 bil. lbs, up 1.3%.

The sea of green in milk production, however, can be found in the Western Plains milkshed from Texas, New Mexico, Arizona in the south to Nevada, Utah, Idaho to the north, including rapidly growing Colorado, Kansas, Nebraska and Oklahoma. This milkshed grew by 5% to 53.12 bil. lbs.

Texas, alone, produced over 12 bil. lbs., up virtually 12% on the strength of output per cow and 7% more cows — leapfrogging both Pennsylvania and Michigan for the No. 5 spot — pushing Pennsylvania to 7th.

New Mexico grew 6.5% to 8.21 bil. lbs. with 4.3% more cows. Every state in this milkshed grew by more than 5% except for Nevada’s growth of 3.6% and number 4 Idaho’s small loss of 0.3%. The West Coast made 48.85 bil lbs, down 1.7% in 2017 with No. 1 California off by 1.7% and Pacific Northwest off by more.

Shifts in state and regional Mailbox Milk Prices tell the story. Losing the most ground relative to the U.S. average were Pennsylvania and the Southeast states. Both were averaged by USDA at $17.55 for 2017. In fact, the eastern Pennsylvania portion of that price was even lower, at $17.39.

Interestingly, the West Coast gained the most ground on net mailbox prices with California’s mailbox at $16.19, up 9.3% over 2016 and the Northwest at $17.59 up 10.2%.

Florida regained the number one position with a mailbox price of $18.96, up 9%, while the Southeast milkshed was tie for 10th with Pennsylvania at $17.55. This value represented a 7.2% gain over 2016 for Pennsylvania but just a 5.8% gain over 2016 for the Southeast.

New England was second at $18.65 and the Appalachian region regained third with a 2017 mailbox price of $18.09, up 8% over year ago. New York was $17.46.

Wisconsin had the fourth highest mailbox price in the nation at $17.95, up 7.6% while Minnesota was 9th at $17.56, up 6.4%. Iowa and Illinois were up 8 and 9% with mailbox prices of $17.69 and $17.96, respectively.

Ohio was up 9% with a mailbox average of $17.61, while Indiana was up 7.4% at $17.02.

Michigan, up 8.3% at $15.59, and New Mexico, up 5.4% at $15.24, were the states with the lowest mailbox prices. West Texas garnered a mailbox average at $16.77, up 8.6%.

Wisconsin and Pennsylvania remained the top two for the number of licensed dairy farms. Pennsylvania lost 80, down 1.3% at 6570. Wisconsin lost 430 at 9090, down 4.6%.

Overall, the U.S. milk production increase of 1.4% came from 67,000 more cow on 1600 fewer licensed dairy farms. Across the 50 states, the number of licensed dairy farms fell 4% to 40,219 and the number of dairy cows grew 0.7% to 9.3 million head.

Keep in mind, USDA milk production statistics are compiled, in part, using Market Admin. pooling reports for marketings relative to cow numbers. With milk moving in ways it never has before, there could be some gray areas in some of these state and regional tallies.

-30-