By Sherry Bunting, Farmshine, February 10, 2023
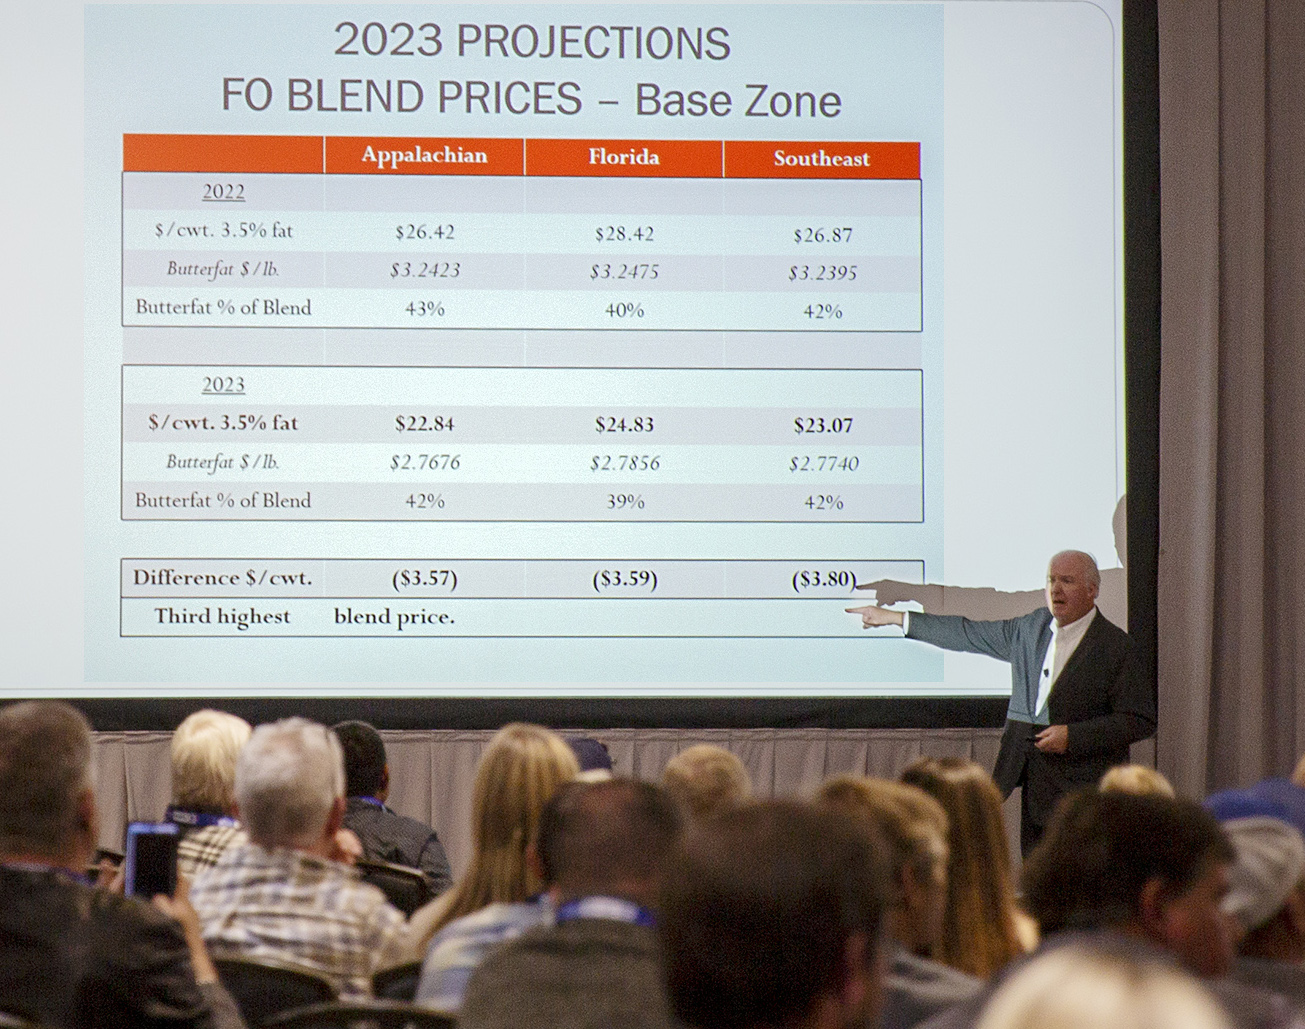
SAVANNAH, Ga. — In a much anticipated market outlook with its full complement of charts and graphs, retired milk co-op executive Calvin Covington told the crowd of 500 attending the mid-January Georgia Dairy Conference in Savannah that 2022’s record-high blend prices outpaced his earlier projections, and he sees the pressure in 2023 coming more from the demand side than the supply side.
At levels more than $7 per hundredweight higher than 2021, Covington calculated the 2022 Federal Order blend price averages at $26.42, $28.42 and $26.87 for Orders 5, 6, and 7, respectively.
The higher national butterfat price — up almost $1.50 per pound from 2021 — accounted for more than 40% of southeastern fat-skim blend prices and was a big factor in record milk prices for farmers in multiple component pricing FMMOs, nationwide, in 2022.
Covington projected the Federal Order blend prices to average $22.84, $24.83 and $23.07 for Orders 5, 6 and 7, respectively, in 2023.
If the more than $3.50/cwt. decline is realized this year, and prices don’t go below these projections, “2023 could still have the third highest blend prices on record,” he said.
He cautioned that his projections are FO blend prices, not farm mailbox milk prices and said relatively small changes can make a big impact on these prices.
Covington stressed the high cost to balance the fluid milk markets affects how the blend prices translate to mailbox milk checks in the Southeast.
“This high cost to balance Class I is something we have to keep educating the rest of the country about,” he said. (In fact this is one reason a public hearing is set to begin Feb. 28 for the Appalachian, Florida and Southeast Federal Orders to consider proposals to amend inter-market transportation credits in Orders 5 and 7 and adopt plant delivery credits, otherwise known as intra-market transportation credits, in Orders 5, 6 and 7.)
Nationwide, Covington expects milk production growth in 2023 to be constrained by several factors including interest rates, operating margins and available replacements.
On the demand side, however, he said domestic and export sales on a total solids basis — while up year-over-year – are showing softer growth.
Looking ahead, he said the dry whey price is something he watches because it is the dairy commodity with the most worldwide impact. He sees it as a bellwether for milk prices going up or down. (Dry whey prices had come under pressure in December and January, but showed strength in spot sales on the CME into the beginning of February.)
Over the longer term, Covington looks at total milk production, number of cows as well as demand in terms of sales and product inventories on a quarterly basis to take the month-to-month variation out of the equation.
“In 2022, we had three quarters of lower milk production that helped bring up prices. Why? Cow numbers. We had a lot of cows in the first half of 2021, and those numbers began to get depleted into 2022.
“Now we are starting to get a little more milk from dairy farmers adding a few more cows,” he said.
On the demand side, Covington looks at domestic and export demand separately by tracking commercial disappearance, trade, and inventories. He reported domestic dairy product demand was up 0.5% in 2022 on a total solids basis vs. prior year, compared to a 5-year average annual growth of 1.5%.
“Domestic demand has slowed down,” he said.
On the export side, it was a record year; however, export sales on a total solids basis were up 3.5% year-to-date through October, compared with a 5-year average annual growth of over 6%, according to Covington.
Combining these figures for the first 10 months of 2022, he said total demand was up 1% from prior year, compared to a 5-year average increase of 1.8% on a total solids basis. Covington said this could change slightly when November and December figures are included.
Bottomline, he sees dairy demand is growing, but this growth is slower than the average annual growth over the past five years.
Higher prices and overall inflation are affecting butter sales as reflected in commercial disappearance comparisons and anecdotal evidence shared by Covington. Using a chart of commercial disappearance comparisons, he said American cheese demand appears to be declining, while other cheese categories are showing demand growth. Dry skim milk powder represents 72% of all exports, and even though exported quantities were up in 2022, total commercial disappearance was down.
Some of these commercial disappearance trends are also a function of what is being produced and manufactured in the first place.
“The good news going into this new year is inventories,” he said. “We have no overly burdensome inventories to be concerned about.”
Covington projects 2023 milk production to increase by no more than 1% over 2022, and he thinks the increase could be less than that. Why? Higher interest rates, lower operating margins and the prevalence of beef-on-dairy limiting the supply of dairy replacement heifers. (A tighter than expected supply of dairy replacements was later confirmed in the January 1 semi-annual All Cattle and Calf Inventory Report released by USDA on January 31.)
In the Class I fluid milk markets during 2022, Covington reported sales January through November were off 2.3% from prior year, and he highlighted the fact that the number of fluid milk plants is dwindling.
A producer asked why this is happening, and Covington’s answer was blunt: “There’s no money in it, no profitability. Class I sales are down, so that business is not able to grow volume, and some of those plants are on land that’s a whole lot more valuable to sell than to run a milk plant,” he said.
Over the past two years, the 10 southeastern states have lost 8 fluid milk processing plants, “and that’s done some damage,” said Covington.
At the end of December 2022, USDA listed 39 pool distributing plants for the three southeastern FMMOs — down from 44 a year earlier and down from 70 in the year 2000. The only balancing plants now located in the region are in Kentucky and Virginia.
Of the 39 pool distributing plants across Orders 5, 6 and 7, Covington said 18 are owned by cooperatives, 9 by grocery stores and 12 are privately-owned, but smaller.
“The bulk of your fluid milk is being processed by plants owned by cooperatives — by you — or by retail stores,” he said.
Meanwhile, most of the loss in fluid milk plants has occurred in Order 7, which has half as many fluid milk plants today as in 2000, according to Covington.
Located in Order 7 is Georgia, which has become the Southeast’s new leading state in total milk production. Georgia’s production growth is offsetting Florida’s production losses, moving Georgia to surpass Florida in total output.
At the same time, Georgia has the fewest number of fluid milk plants — down to just two. This combination left Georgia’s farmers producing a per-capita fluid milk surplus of 53 pounds.
Together, the 10 southeastern states remain milk deficit, but the relationship between milk supply and fluid milk demand is steadier across the region, according to Covington. He said the 10-state production total over the past three years “has started to level a bit at 8.1 billion pounds, and is more concentrated to Georgia and Florida with Georgia as a milk producing state, not a milk processing state.”
With producers making 101 pounds of milk per person across the 10 southeastern states, and fluid milk consumption at 133 pounds per person, the Southeast had a 32-pound per person deficit in 2022, he said.
That is a smaller deficit than in 2010 — just before the accelerated annual declines in fluid milk sales began accumulating over the past decade. But as the milk supply in the southeastern states has steadied relative to declining fluid milk sales, the Class I utilization percentage across the three Orders has increased. Averaged at just over 74% for 2022, this was 4 points higher than in the year 2000, although the breakdown shows Class I utilization has been steadily increasing in Order 5 (Appalachian) while decreasing in Order 6 (Florida) and fluctuating in Order 7 (Southeast).
“The major challenge for milk markets in the Southeast is we need more of them,” said Covington. “A lot of the fluid milk products that are sold in the Southeast are not processed here. If we are going to have a viable dairy industry in the Southeast, we need growing and stable markets for milk produced in the Southeast.”
On the production side, he said the region has seen location shifts about every 40 years. “Since the 1980s, Florida was the highest and now into the 2020s, Georgia is number one,” Covington said. Together, they account for over 50% of the milk produced in the Southeast. Before the 1980s, Kentucky was number one with Tennessee a close second.
Covington predicts this pattern will continue while other states in the Southeast become smaller and are vulnerable to begin losing infrastructure.
When asked why Georgia is growing so fast, Covington said simply: “Good dairy farmers. If you look at production per cow and how this has improved, we see Georgia has had one of the highest per-cow production increases in the U.S.”
At the same time, he said, addressing the Georgians in the audience of around 500 people from multiple states: “Your farms are growing, and the state seems conducive to allowing you to grow. You just need to build some milk plants.”
The challenge for the Southeast region is to expand profitable sales at existing plants and/or seek to attract new dairy processing to the region, said Covington.
-30-
 (Incidentally, a billboard popped up recently on I-65 North outside of Louisville, Kentucky –picturing Holstein dairy cows grazing and proclaiming Kroger as “proud to support Kentucky farmers”. What could this mean? As noted in this report, requests to Kroger’s communications department — to understand what these billboards mean and what percentage of milk in Kentucky Kroger stores actually comes from Kentucky farms — have gone unanswered.)
 Follow up questions about how “excess milk” is determined to be a problem in a milk-deficit area, have not been answered. (Since publication, DFA’s John Wilson replied in an email that the “excess milk situation is really the region, not specifically Kentucky.” One can see why when comparing the
  Meanwhile, of the
 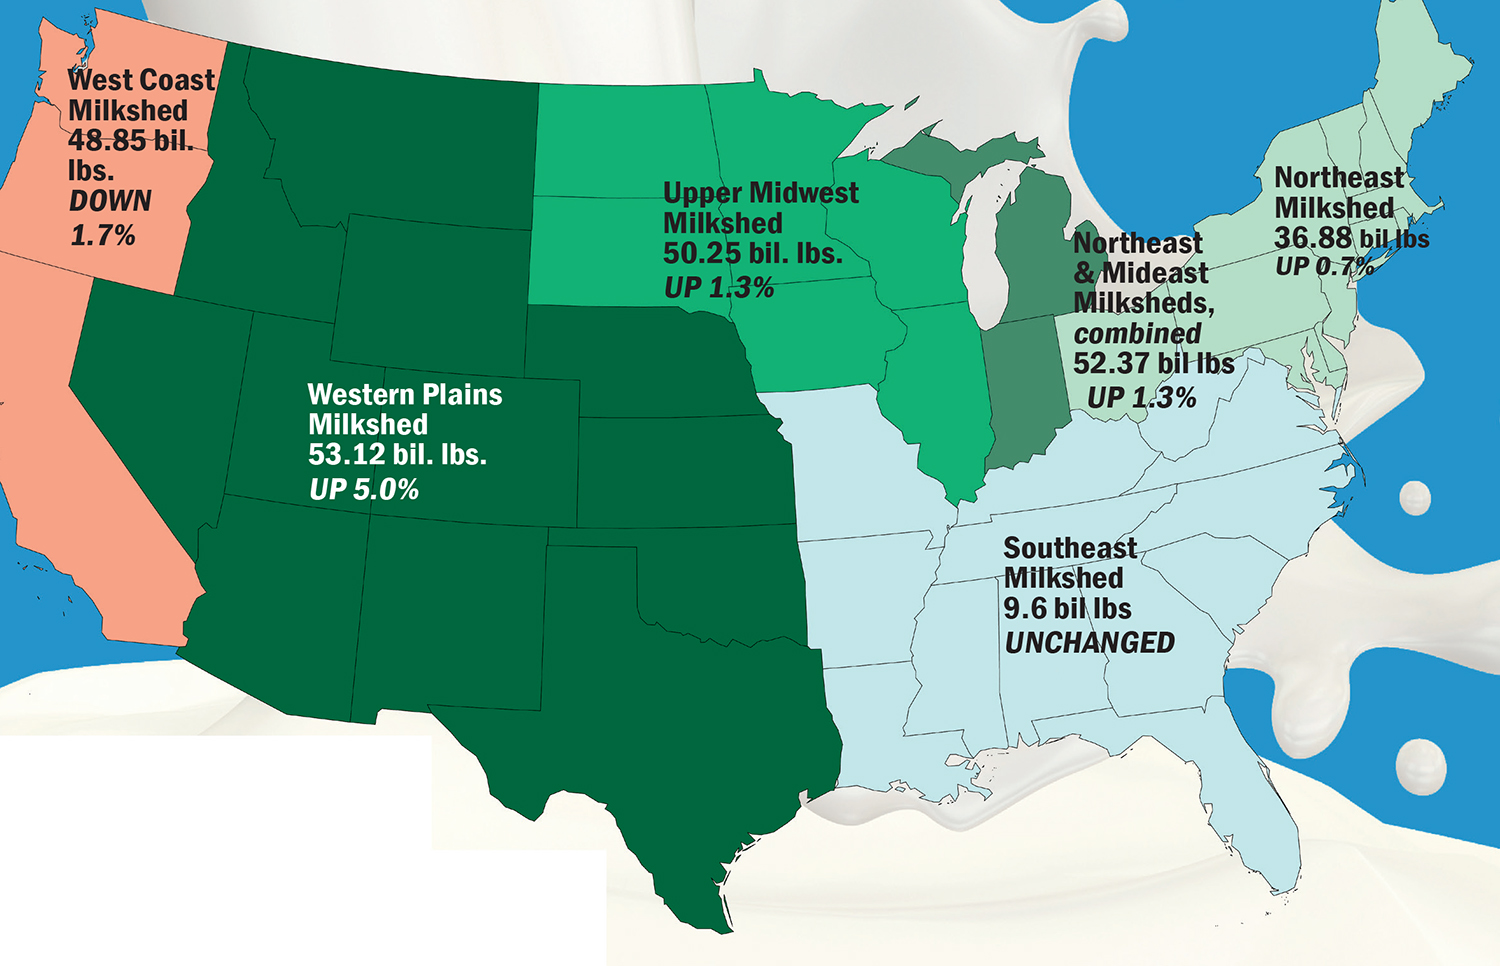 Author’s note: Since Milk Map Math was published April 6, I came across another
 While U.S. production was 215 bil. lbs., up 1.4% over 2016, the traditional Northeast milkshed, at 36.88 bil. lbs. added just 0.6%. Anchored by New York (up 0.9%), Pennsylvania (up 1.1%), Ohio (up 0.8%) and Vermont (unchanged), this milkshed includes other New England states that lost 3 to 5% and Maryland down 0.4%.