Covering Ag since 1981. The faces, places, markets and issues of dairy and livestock production. Hard-hitting topics, market updates and inspirational stories from the notebook of a veteran ag journalist. Contributing reporter for Farmshine since 1987; Editor of former Livestock Reporter 1981-1998; Before that I milked cows. @Agmoos on Twitter, @AgmoosInsight on FB #MilkMarketMoos
“Everyone prices milk differently depending on what they want you to do,” he said, showing a scattergram of milk check data from various coops and buyers.
“It’s impossible to compare it,” Bozic declared, noting that in Australia, all milk pricing data are public so anyone can see how everyone compares in payment by region. In Ireland something similar is also done, where each buyer’s protein and butterfat price is published as well as a price for the liquid portion.
“They see what different processors pay. They don’t have Federal Orders. This transparency keeps everyone honest,” said Bozic.
He knows about pricing around the world because — in addition to being an associate professor of applied economics at the University of Minnesota — Bozic is founder and CEO of Bozic LLC, a global provider of technology for commodity markets analytics and risk management, with around 100 clients on four continents. He is also an advisor to several dairy trade associations.
“While it’s not easy to switch (milk markets) today, milk check transparency would allow producers to hold boards accountable and hold management accountable,” said Bozic. “Having this information, seeing the patterns, a producer can ask the question: Are you doing everything you can to make sure I am successful?”
Bozic announced his new Milk Check Transparency Report, which he said will be a monthly report generated from producers submitting their milk checks to him. The purpose is to make milk checks easier to understand and to benchmark across processors to improve price discovery.
He has been working on this project with 12 processors, mainly in Wisconsin, so far. The first report is due out in the next few weeks, and the goal is to gain more input covering more buyers in more regions.
He said he hopes to have 90 to 95% of the processors included within the next six months to be able to generate a national Milk Check Transparency Report every month.
Specifically, all data is collected from producers’ milk check statements. The collaboration is confidential and a non-disclosure agreement is signed protecting the producer. Bozic and an assistant input the data. No one else sees the individual milk check submissions.
Once enough data are collected to have a high degree of confidence in the estimates, processors are contacted to offer them the opportunity to validate or comment before publishing.
Bozic has a multi-step process for standardizing the information at national average component levels (4.0F and 3.3P). He appreciates having a document describing how premiums are set by the milk buyer. Representative hauling is also incorporated and other formulas so price discovery comparisons can be made.
“Then we can work with any milk check,” said Bozic.
He said a large number of farms from Washington to Florida and from California to New York are or will be participating in this project, and he urged producers to get involved by writing to him at marin@bozic.io
Bozic was quick to point out there are other considerations and benefits a cooperative or private milk market may provide that go outside the scope of the report. He said the Milk Check Transparency Report is not meant for ranking. Instead, it is a way to look comparatively, so producers can have better market price discovery, input and accountability.
Another goal of the report is to eventually have a calculator option, where a producer can slide the pounds of volume or components, even milk quality, and see how it changes the pricing outcome.
“We are then better able to design risk management,” said Bozic, whose proprietary company owns the intellectual property he developed as the infrastructure behind risk management programs like Dairy Revenue Protection (DRP).
He believes with better information, even the Dairy Margin Coverage can be improved, and the calculators and sliders could allow producers to see how they are paid against a national index allowing them to make changes that would improve profitability and better inform how to manage the price risk they have.
Negative PPDs (producer price differentials) made headlines the past two years, Bozic acknowledged.
“There’s an impression that all this milk was de-pooled and a feeling that processors could have their cake and eat it too,” he said. “The Milk Check Transparency Report puts everyone on notice that whether differentials are positive or negative, they are in there.”
In this way, he said, the report can “promote good behavior in an unregulated way.”
On the variation in how producers are paid, Bozic said a big problem is lack of clarity on how farmers can achieve a better price.
“It’s astonishing to me that processors do not have brochures detailing how their incentives are based so farmers know how to meet them,” said Bozic.
The Milk Check Transparency Report is something Bozic is doing, for free, on his own time. He is not relying on the University of Minnesota. He said he knows he’ll get some ‘hate mail’ but believes it is important.
When asked why he is doing this, Bozic brought his reply to a personal level. He mentioned his mother, who is ailing, saying that she inspired him all his life to help people. He said it is hard for anyone to do this, but that he is fortunate to have built a technology company over the years and believes he is in a position to do something good.
On contract fairness, Bozic noted that Australia has required structures in their milk contracts, but they do not have regulated pricing.
“It’s their contracts that put them on an even keel,” he said.
For example, no cooperative or milk buyer should be able to prohibit their producers from doing third-party milk weight and test samples. Contracts should protect farmers from being ‘failed’ in inspections simply because they are ‘prickly’ or ‘vocal’ producers.
He also noted that in countries, like Australia, milk buyers or cooperatives are not allowed to require exclusivity while also doing two-tiered pricing for base and over-base milk at the same time.
“It’s one or the other,” said Bozic. “When those two lanes cross at the same time, we have a traffic accident.”
“Organizations like ADC and Edge are fighting for some of these interests of farmers, but they need more voices,” said Bozic.
He pointed out that the combination of exclusivity and base programs in the East may be insulating against production growth and surplus.
“That ‘insulation’ may be fine right now,” said Bozic. “But what about 10 years from now?”
What happens to dairy in the Northeast, for example, when processing has been built up everywhere else where production is being allowed, even encouraged, to grow?
Industry trends explored at Georgia Dairy Conference
Calvin Covington gives Southeast Dairy Outlook at Georgia Dairy Conference in January. S.Bunting photo
By Sherry Bunting, published in Farmshine, Feb. 11, 2022
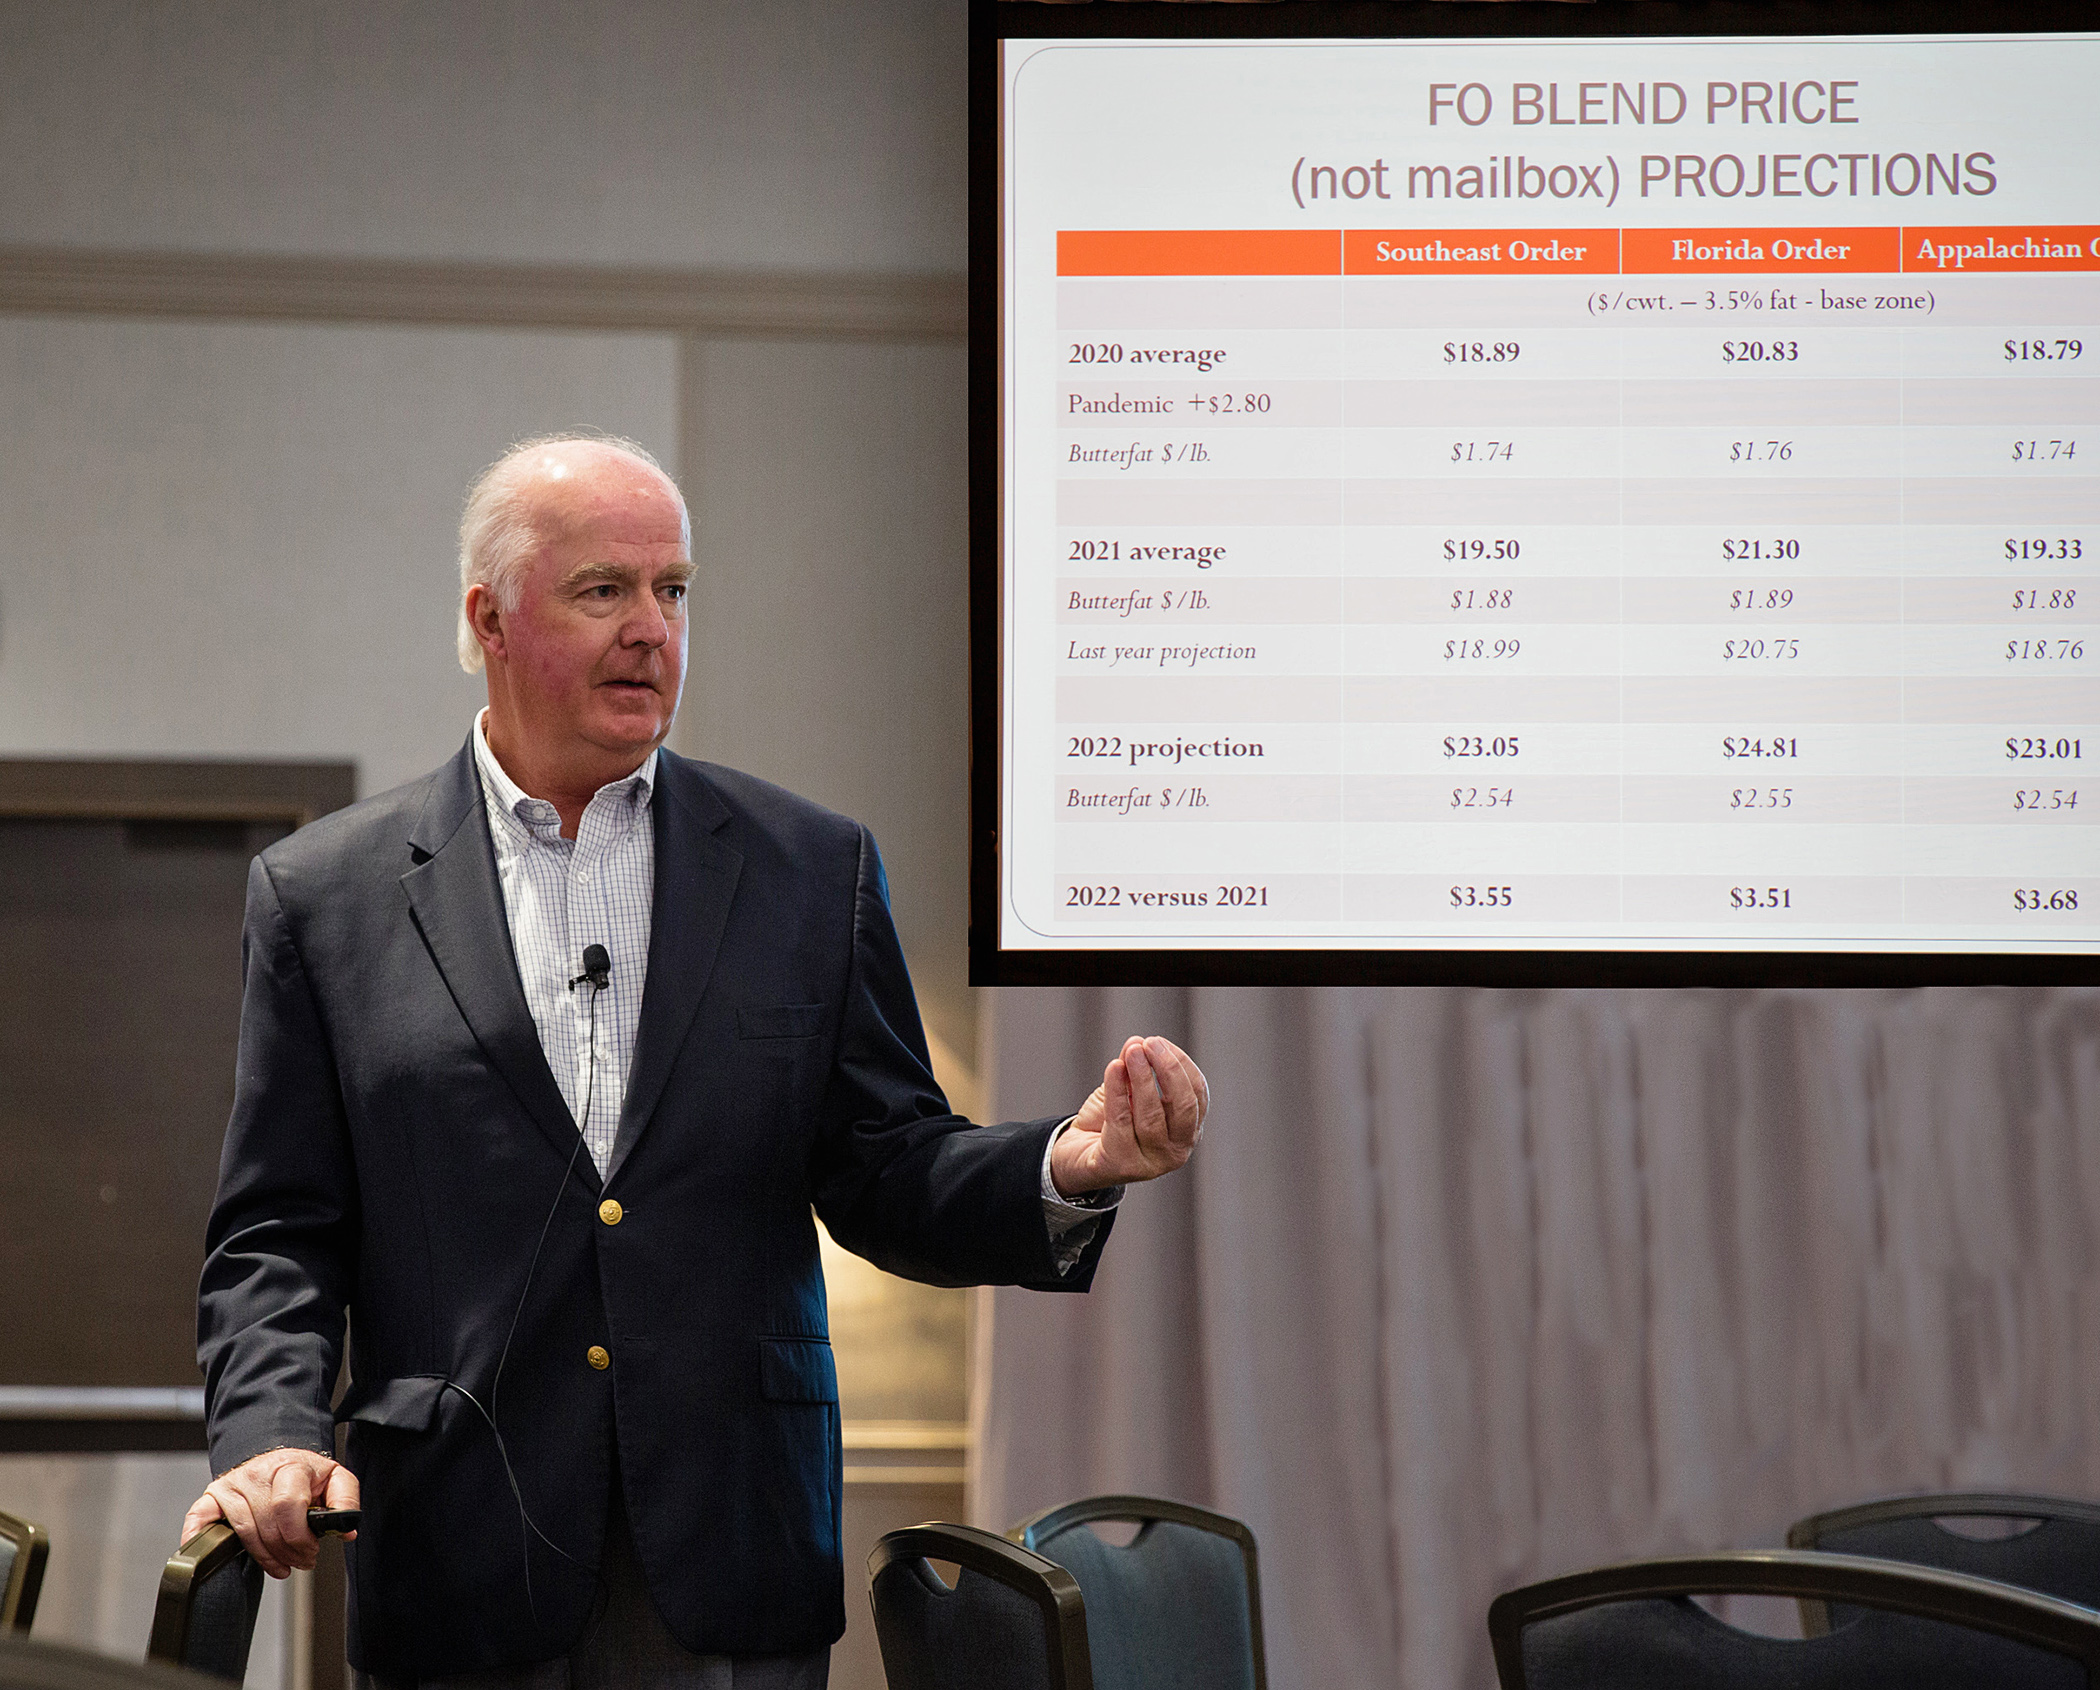
SAVANNAH, Ga. – “Everything is going up, and quickly. Class IV is driving milk prices, with good demand for both butter and powder, especially for exporting,” said Calvin Covington as he presented the Southeast dairy outlook during the 2022 Georgia Dairy Conference, attended by around 300 dairy producers and industry members in Savannah in January.
He forecast the 2022 Federal Order blend price average (not mailbox price) for the Southeast region will be up $3.50, with most of that increase on higher butterfat, predicted to average $2.54/lb.
Covington’s 2022 blend price projections range from $23.01 in the Appalachian Order 5 and $23.05 in the Southeast Order 7 to $24.81 in Florida Order 6.
He noted that the market beat his conservative 2021 projections by 50 cents to the good.
“I’m still on the conservative side this year because prices can decrease as quickly as they increase,” Covinton said. “A small change in supply or demand makes a larger change – up or down – in your milk price.”
Covington went through the numbers for 2021, noting reduced milk production, reduced product inventories, reduced Class I sales, a narrowing of the Southeast milk deficit, expanded exports, and expanded domestic demand as trends that are expected to persist into 2022 – especially on the milk production side as supply programs, production cost increases and limits on available labor keep a lid on milk growth nationwide, even worldwide.
Come 2023-24, Covington sees production “jumping up” because of new cheese capacity coming on line in the next two to three years.
“Texas and the I-29 corridor (Central Plains) are bringing cows to where the plants are growing. We can see this in the production numbers,” he said.
As the milk supply in 2022 is likely to be restrained, Covington looks to the signs that domestic and export demand will continue strong, but questioned how inflation will affect consumer buying power.
The availability and consistency of labor also continues to challenge the dairy supply chain and its customers on the foodservice side.
Be prepared for the unexpected, he cautioned, reminding producers that 2020 was forecast to be a good year, and then the unexpected happened – Coronavirus – so all bets were off.
Exports play bigger role in milk price
“Export demand has become very important to your milk price,” said Covington. “We are seeing the strongest demand yet… and look how dependent the industry is on the export market, sending a record 17.1% of supply overseas — up from 15.8% in 2020.”
Using the available figures for the first 11 months of 2021 to gauge it, Covington said overall export demand is up 11.5% for 2021. Over the past decade, the year over year export demand gains averaged 4.3% by comparison.
Add to this the increase in domestic demand, up 1.4% in 2021, and the net gain in dairy demand for 2021 is more than 3% — almost double the 10-year average year over year demand increase of 1.7%.
Unfortunately, on the fluid milk side, USDA reports sales are down over 4% in 2021 vs. 2020, according to Covington.
“Exports are having a bigger part in your milk price,” he said, noting that global milk production in major dairy exporting countries is flat to lower, pushing global dairy prices higher. “Our prices are well below the world prices, making us very competitive. We’re exporting twice as much butter, and 75% of our nonfat dry milk is being exported.”
That’s positive for the skim price, and the doubling of butterfat exports along with domestic demand push the other side of the fat/skim equation higher.
Milk production trends
Even though 2021 milk production will clock in at around 1% over 2020, Covington honed into the production and cow losses on the back half of the year, using July through November data.
Cow losses at 124,000 head in those five months “are the biggest drop since 2009,” he said.
At the same time, milk per cow had been increasing the first part of the year but flattened in the second half as cost of production caught up to milk prices.
“Production is lower now because of less milk per cow and fewer cows,” said Covington.
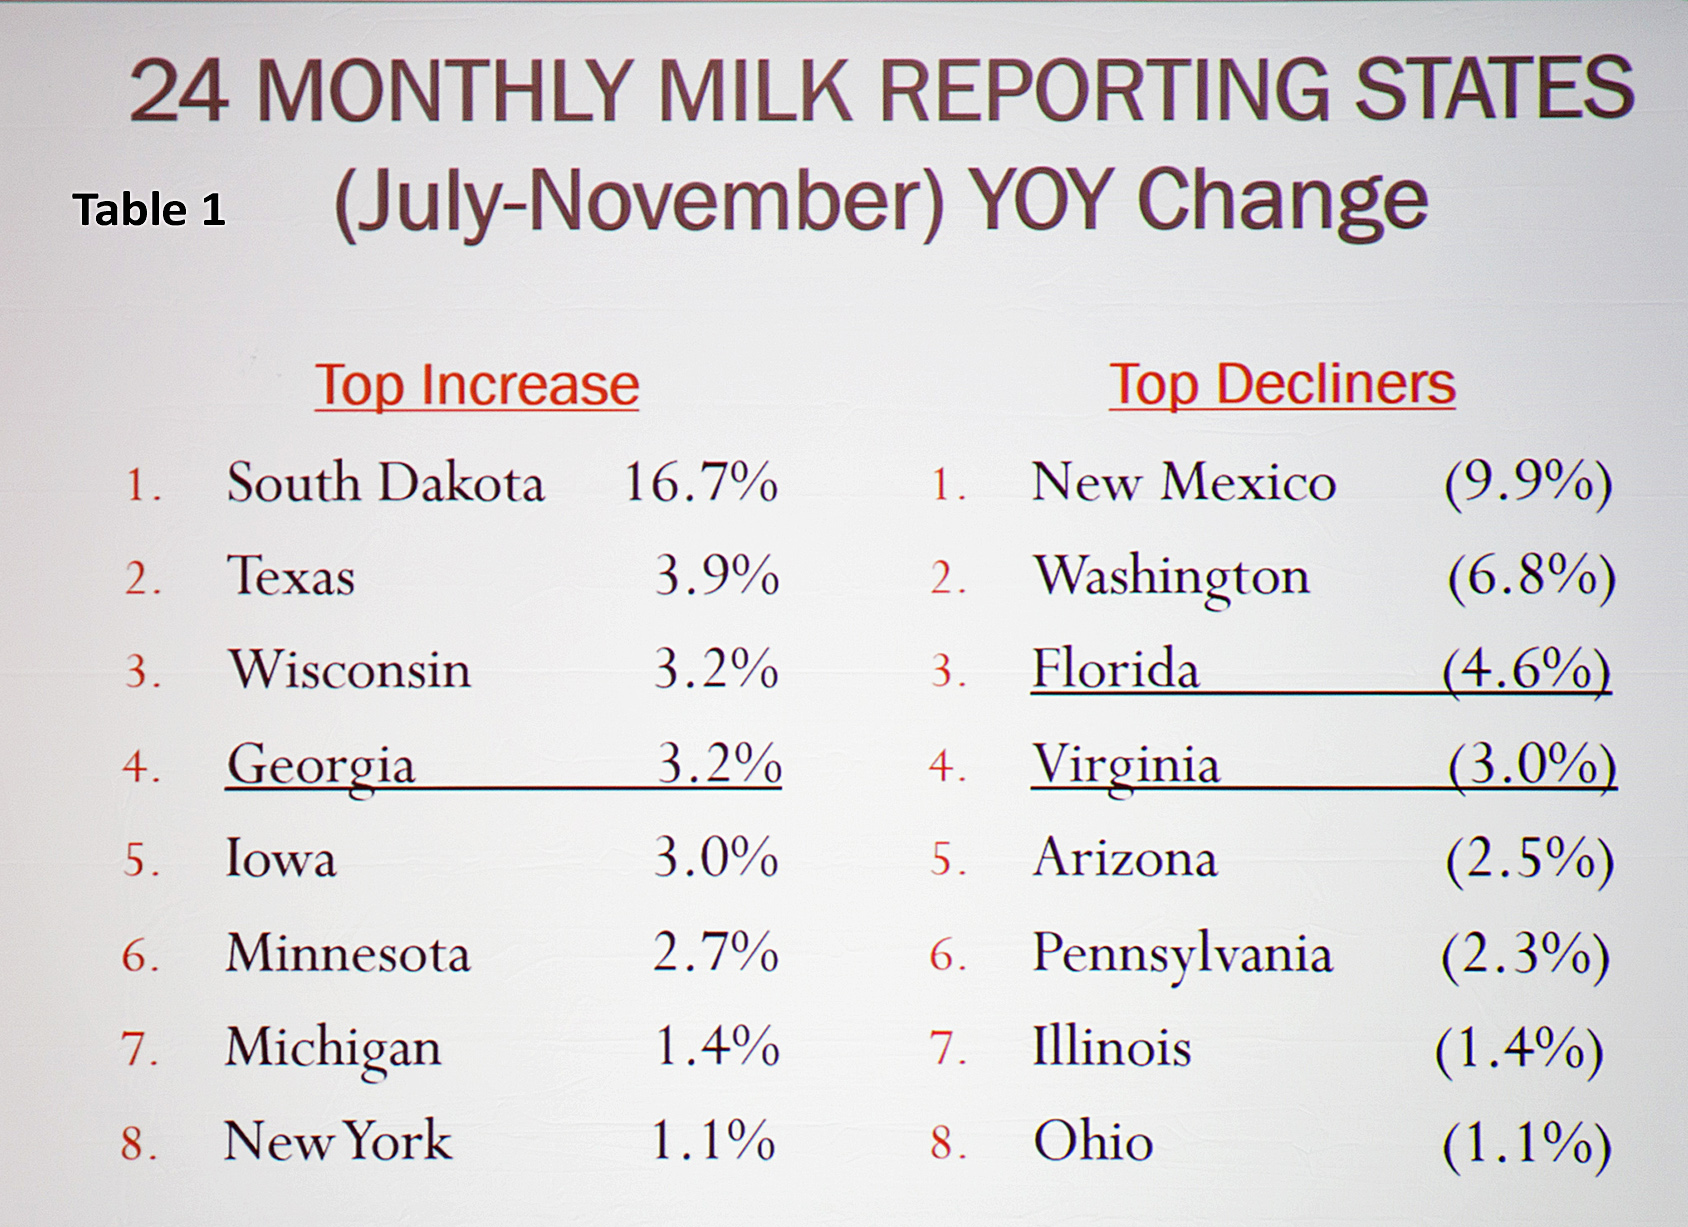
Looking at just the back half of 2021, Covington broke the 24 monthly milk reporting states into thirds and showed the geographic shifts (Table 1, above): 8 states were up more than 1% in production, 8 states had reduced production and 8 states were in between.
Significant in the gaining top-third is Georgia, with July through November 2021 production up 3.2% over the same period in 2020.
“Georgia added more cows and increased milk per cow,” said Covington. He said as Florida is losing production, Georgia is gaining and getting closer to Florida.
On the bottom third, the back half 2021 milk production decreases were 4.6% in Florida and 3% in Virginia.
“Florida lost 6000 head and Virginia 3000,” said Covington. “This tells me people are going out of business.”
Looking at the three major milk states of the Southeast region for the year, Covington noted that Florida is down 4.8%, Virginia down 3.3% and Georgia up 1.1%. The other seven states of the Southeast are collectively down about a billion pounds over the past few years.
In the Northeast, Covington’s chart showed New York’s production for those months was up 1.1%, barely putting it in the gaining third, while Pennsylvania’s production was 2.3% lower and Ohio of 1.1%.
In the West, the chart showed Texas up 3.9%, but New Mexico down 9.9%; Wisconsin and Minnesota up 3.2 and 2.7% and Illinois down 1.4%; South Dakota continues as the largest percentage gainer, up 16.7% on the back half of 2021.
“South Dakota tops the list with expansion in cheese capacity,” said Covington. “Cheese expansion is also underway in Texas, and milk production is growing there too.”
Dairy inventories and commodity production are down
Dairy inventories are down. “One of the best barometers for milk prices is looking at inventories, to see if they are building or declining,” said Covington. They are declining with butter inventory down 16%, powder down 21%, whey down almost 9%.
Cheese inventories are up 9.6%, which isn’t bad, according to Covington.
“We’re going into 2022 with really no challenge of inventory,” he said.
On the commodity production side, Covington observed that, “We do not have excess cream. Butter production is lower and powder production is lower. Fluid milk consumption is lower, but the fat percentage is higher, decreasing the cream supply. Demand for other cream products has also been good.”
With cheese production up 1.3% overall, Covington said the real positive here is Italian cheese production up 5.6% is the bulk of the increase.
“This tells you the product is moving,” he said, “because it’s the fresh cheese production that is higher. They don’t usually make Italian cheese without a sale for it.”
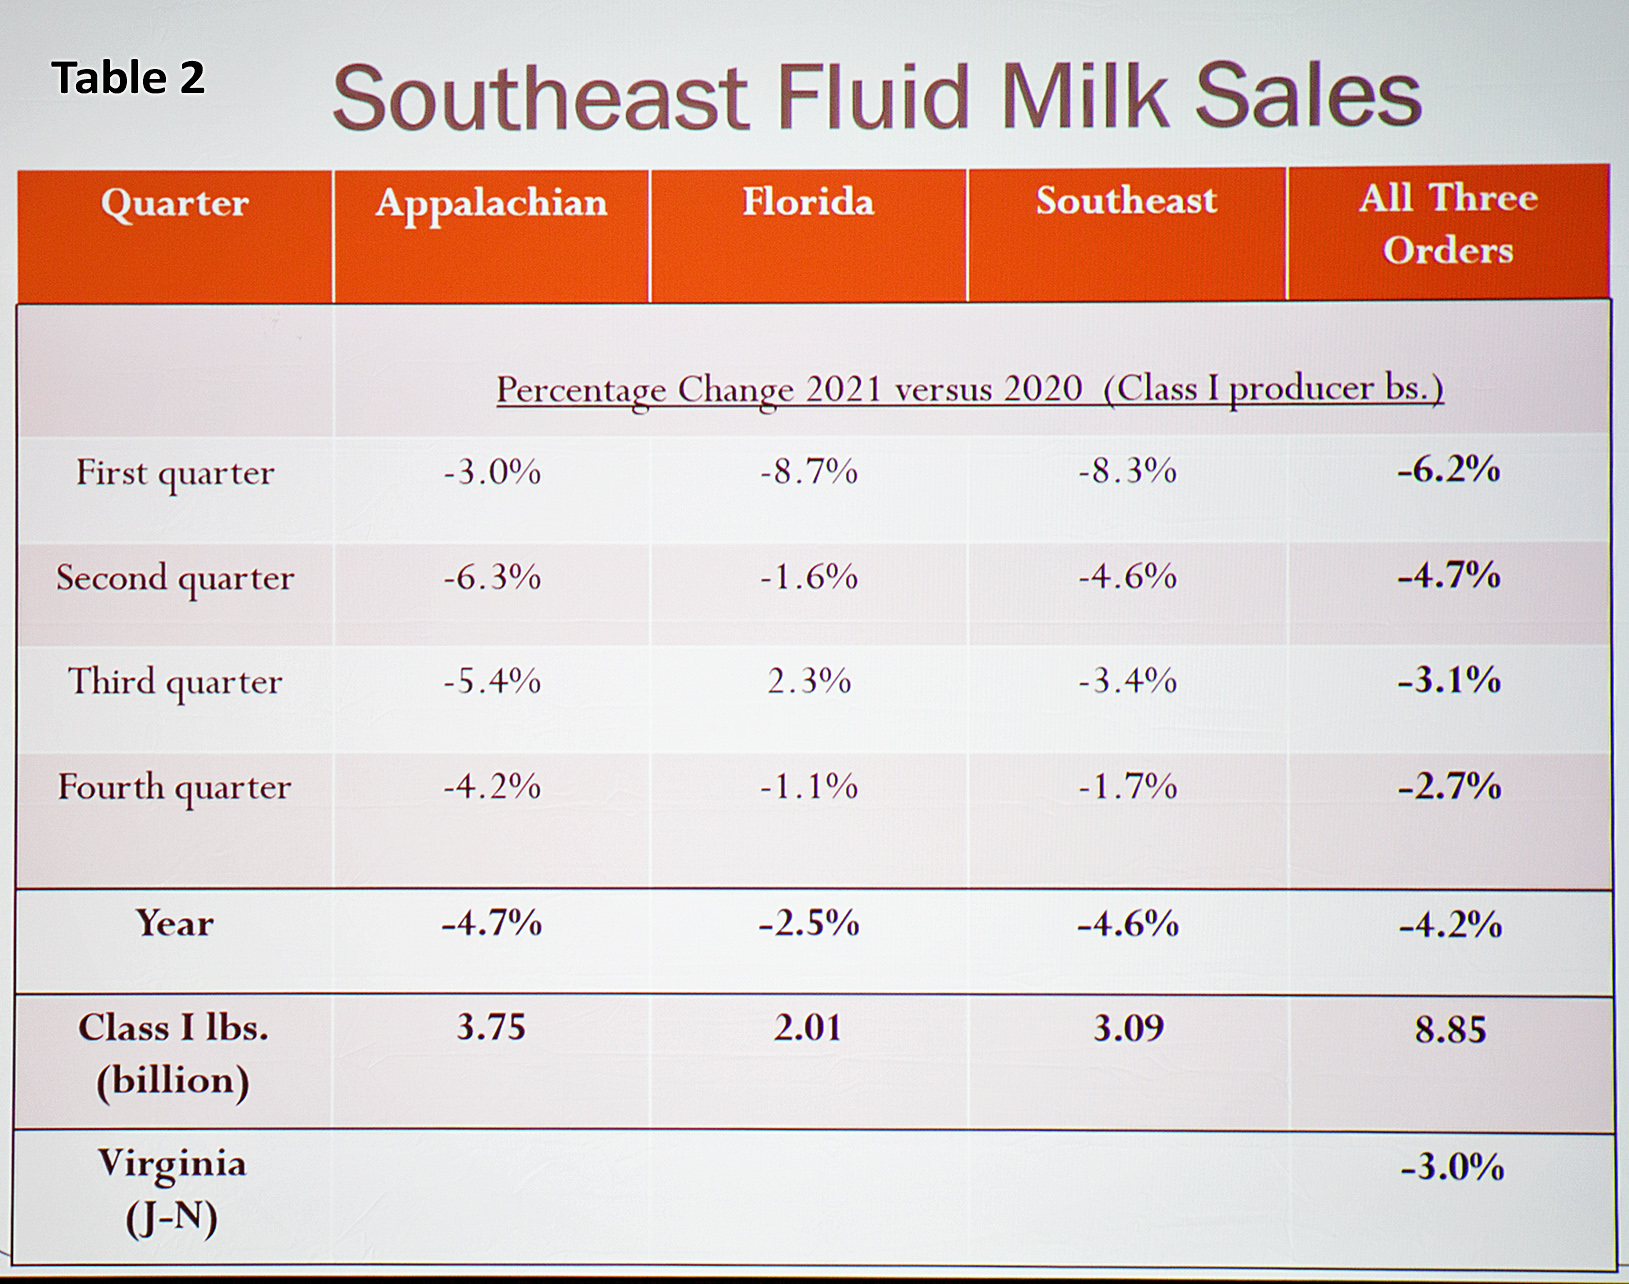
Southeast fluid milk changes
Together, all three southeastern FMMOs had 4.2% less milk going into Class I in 2021. (Table 2, above)
“2021 was a poor year for Class I in the Southeast, but we are comparing to when the food box program was in effect, and that program gave quite a lift to fluid milk in 2020,” said Covington. This loss translates to about one million pounds per day.
Utilization percentage has remained about the same at a little over 72% across the three FMMOs. As Class I sales have declined (4.2%), Southeast production has also declined (3%), so there is little change in utilization percent.
The structure of Class I pool distributing plant ownership has also changed in the Southeast, post-Dean, with 9 of the 44 plants supermarket owned and 19 cooperative owned.
The Southeast region is producing 103 pounds of milk per capita annually, down 20 pounds while fluid milk sales per capita, at 134 pounds, are off by 7 pounds – putting Southeast per capita production 31 pounds below fluid milk per capita consumption.
“The size of the deficit gap is smaller than it was in 2010 due to sales declining more than the production declines over the past decade,” said Covington.
Looking ahead to questions asked about FMMO reform and the Class I mover calculation, Covington said he “would hope we can get back to the ‘higher of’ – realizing what it costs to serve a fluid milk market.”
He shared concern about what happens to orderly marketing when Class I is underpriced vs. the other milk classes.
“Fuel cost estimates are a big concern, and there are other costs,” said Covington. “The cost to serve Class I markets keeps going up. The biggest issue is the FMMO system started when fluid milk was king, and now it is becoming a minority, especially in some areas of the country where processors will wonder, why be in the Federal Order?”
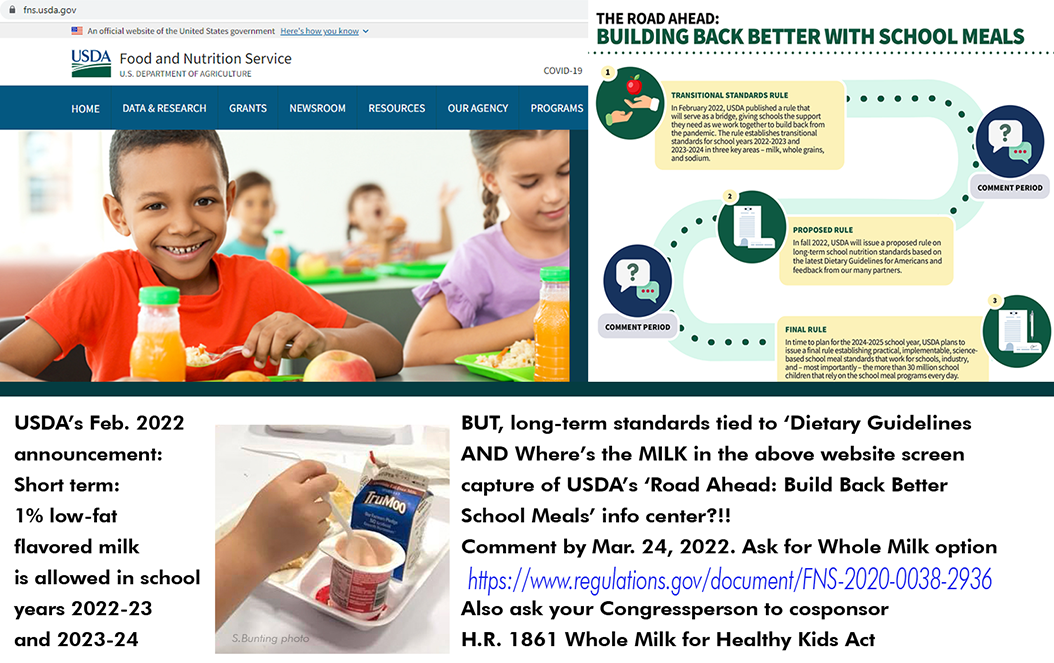
USDA announced a ‘transitional standards’ rule on Feb. 4 for milk, whole grains, and sodium for school years 2022-2023 and 2023-2024. In short, the transitional standards are only in place while USDA works with stakeholders to strengthen meal standards through a new rulemaking for the longer term. The proposed rule for the longer-term is expected in fall 2022 and will be based on the Dietary Guidelines for Americans 2020-2025 — effective school year 2024-2025. A “gradual implementation” plan for the long-term standards will be developed by USDA based on ‘stakeholder input.’Read the transitional standards rule and comment here. Stay tuned for proposed long-term standards rule and comment period this fall. Even the American Association of School Superintendents (AASA) made a statement this week, believing the long-term standards will be ‘more stringent’ due to the Dietary Guidelines, and that “it is important to acknowledge that healthy meals are only healthy if students eat them.” That goes for the milk also. Milk consumption plummeted and waste skyrocketed since USDA’s 2012 fat-free/low-fat milk rules were set for both ‘served’ milk and competing a la carte offerings.
By Sherry Bunting, Updated (above) since published in Farmshine, Feb. 11, 2022
WASHINGTON — USDA announced ‘transitional’ nutrition standards on Friday, Feb. 4 that put low-fat 1% flavored milk back on the menu next school year, without the cumbersome waiver process. The announcement also delays the planned sodium reductions, helping the cheese side of school lunches.
National Milk Producers Federation (NMPF) and International Dairy Foods Association (IDFA) came out with hearty applause for the news, thanking Congressmen G.T. Thompson (R-Pa.), author of the Whole Milk for Healthy Kids Act, and Joe Courtney (D-Conn.), author of the School Milk Nutrition Act, for their leadership on this issue through the years, using words that treat this USDA announcement as though it’s a done-deal, and all is good to go.
But let’s hold our horses and examine the USDA announcement — described clearly as “transitional” based on schools “needing more time to adjust” post-pandemic.
USDA stated that future nutrition standards will be proposed in the fall of 2022 as part of the administration’s “Build Back Better with School Meals, input will be gathered, and those will be the standards that go into place beginning with the 2024-25 school year.
USDA also made it clear that these future long-term standards “will line up with the Dietary Guidelines” and input from schools and industry will be sought in “how to gradually implement them.”
In 2010, the Healthy Hunger Free Kids Act of Congress tied government food and nutrition programs, like school lunch, to the Dietary Guidelines. By 2012, under President Obama’s USDA — with Tom Vilsack at the helm then as now — had banned whole milk as an a la carte offering in the ‘Smart Snacks’ rules. At the same time, the Department required flavored milk to only be offered if it was fat-free and required unflavored milk to be either fat-free or low-fat 1%.
Milk sales plummeted and waste increased.
Then, the Trump-USDA in 2018, under Ag Secretary Sonny Perdue, “rolled back” some of the 2012 USDA standards, delaying the sodium rules and allowing low-fat 1% flavored milk to be offered through a waiver system at the state level. Some states, like Pennsylvania, made blanket waivers available, and many schools began offering low-fat 1% flavored milk over the next few years.
Then, a lawsuit took the Trump-era USDA to court for the rollbacks. The court ruled that the Trump-USDA did not use a proper public comment process before doing the rollbacks. So, beginning with the 2021-22 school year, the low-fat 1% flavored milk was again bumped out of school menus — except where waivers were sometimes granted for pandemic-related supply disruptions as justification for serving a higher fat milk.
Over the past year, USDA Food Nutrition Services has received comments about how to gradually implement nutrition standards to line up with the Dietary Guidelines on sodium, whole grains, and milkfat. Friday’s announcement on ‘transitional standards’ was accompanied by a detailed and lengthy rule that will be implemented July 1, 2022.
“USDA is giving schools time to transition from current, pandemic operations, toward more nutritious meals. In 2022, USDA will continue to prioritize supporting schools as they navigate the challenges of the pandemic and related operational issues,” the announcement said, adding that USDA “is also planning for the future by engaging with school meal stakeholders to establish long-term nutrition standards beginning in school year 2024-2025 that will be achievable.”
Ag Secretary Tom Vilsack was quoted in the announcement blaming the pandemic disruptions of the past two years for making schools “unprepared to fully meet those standards at this time” for milk, whole grains and sodium.
“These transitional standards are step one of a longer-term strategy to lean into the school meal programs as a crucial part of improving child health,” said Vilsack.
“Over the coming months and years, USDA will work closely with its school meal partners to develop the next iteration of nutrition requirements. We’ve got to find the right balance between standards that give our kids the best chance at a healthy future based on the latest nutrition science, and ensuring those standards are practical, built to last, and work for everyone,” Vilsack added.
The purpose of the “transitional” standards, according to the USDA announcement, is to “give schools clarity for the coming school years, allowing them to gradually transition from the extraordinary circumstances caused by the pandemic to normal program operations and meal standards that are consistent with the latest nutrition science, as required by law.”
Specifically, the transitional standards beginning with the 2022-23 school year are as follows:
1) Milk: Schools and childcare providers serving participants ages six and older may offer flavored low-fat (1%) milk in addition to nonfat flavored milk and nonfat or low-fat unflavored milk;
2) Whole Grains: At least 80% of the grains served in school lunch and breakfast each week must be whole grain-rich; and
3) Sodium:The weekly sodium limit for school lunch and breakfast will remain at the current level in SY 2022-2023. For school lunch only, there will be a 10% decrease in the limit in SY 2023-2024. (This affects school cheese).
The expressed linkage of long-term USDA nutrition standards to the anti-fat 2020-25 Dietary Guidelines was mentioned throughout the USDA announcement, giving an indication of where the school milk standards are headed, long-term.
That is, unless Congress acts to remove all doubt and make fuller fat milk — whole milk — a legal option for schools in the future.
For a true solution for the long-term, Congressional leadership is needed on the school milk issue.
By Sherry Bunting, published in Farmshine, Feb. 11, 2022
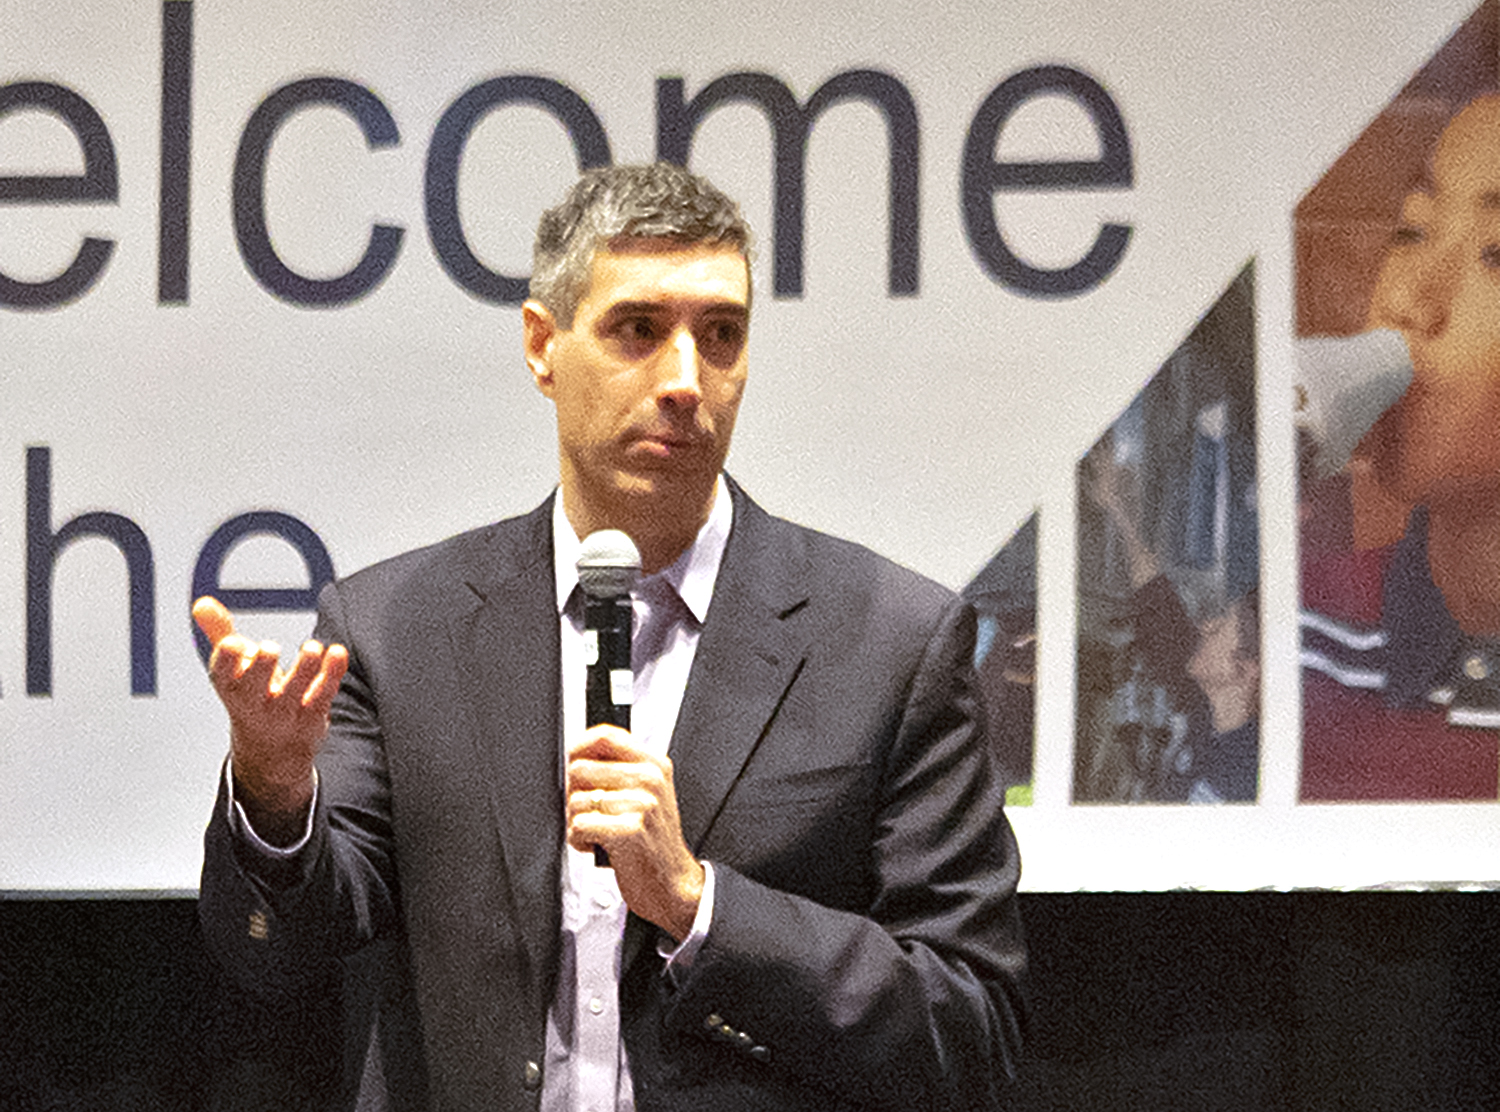
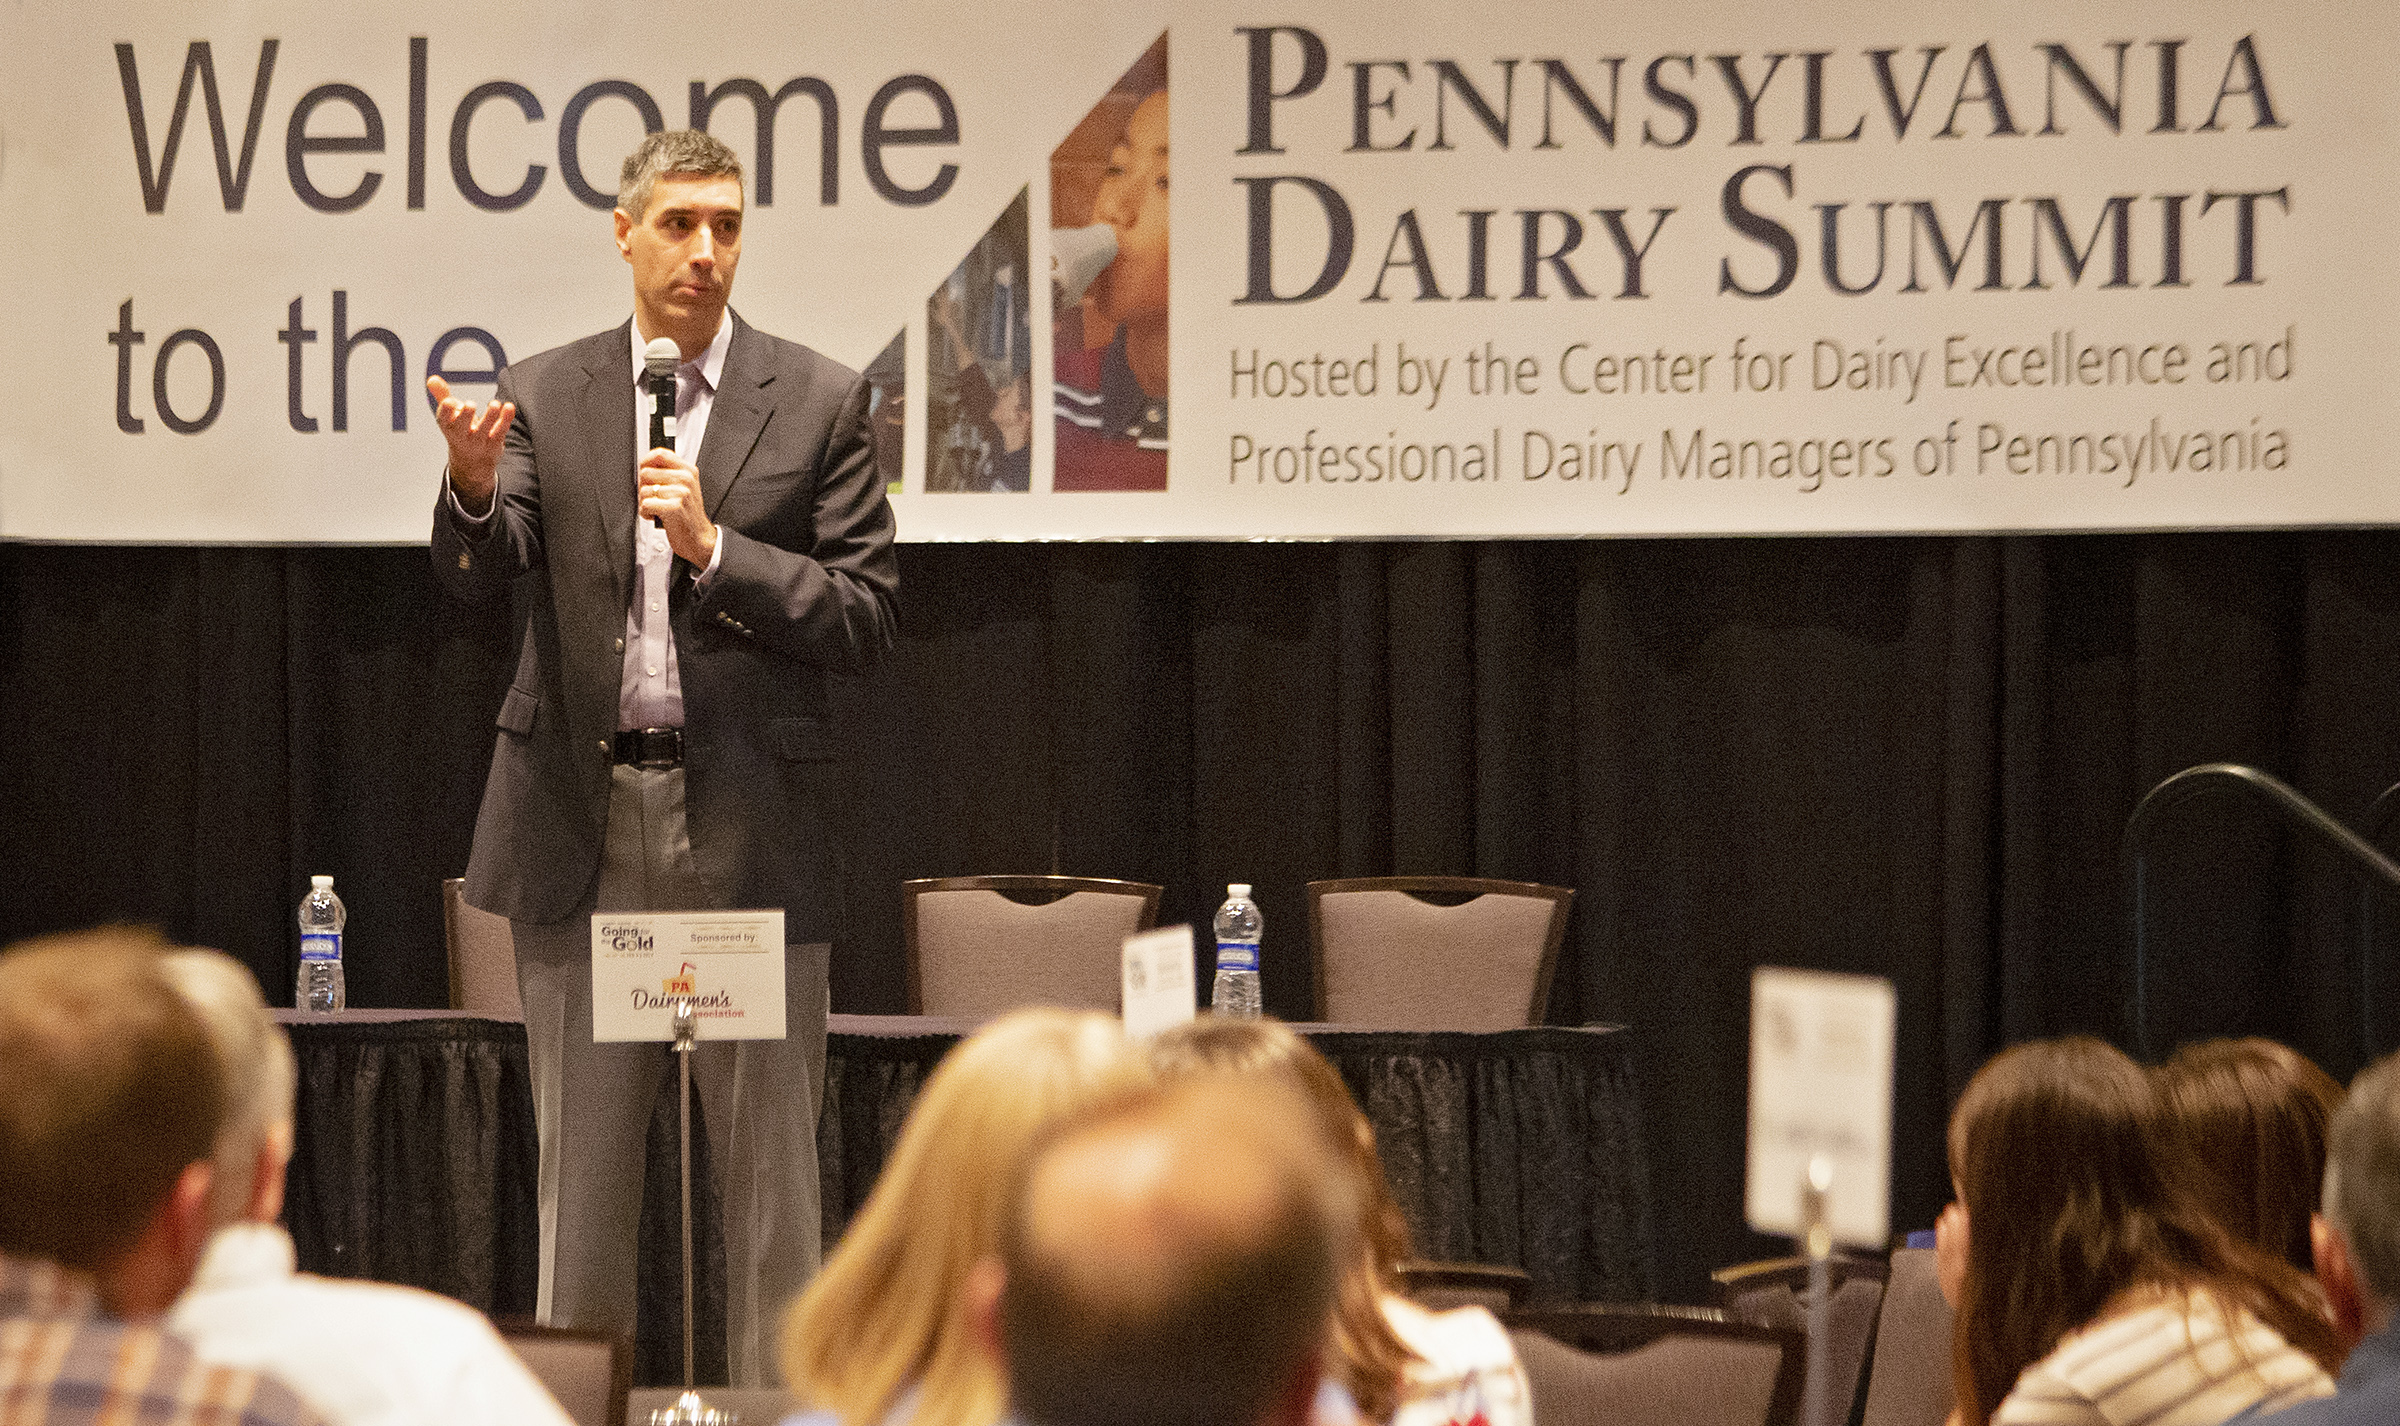
LANCASTER, Pa. — “The Federal Milk Marketing Order (FMMO) system is built around Class I fluid milk… if no changes are made, they can just collapse, west of the Mississippi,” said Dr. Marin Bozic, a University of Minnesota associate professor of applied economics speaking to over 300 farm and industry attendees of the Pennsylvania Dairy Summit in Lancaster on Feb. 2.
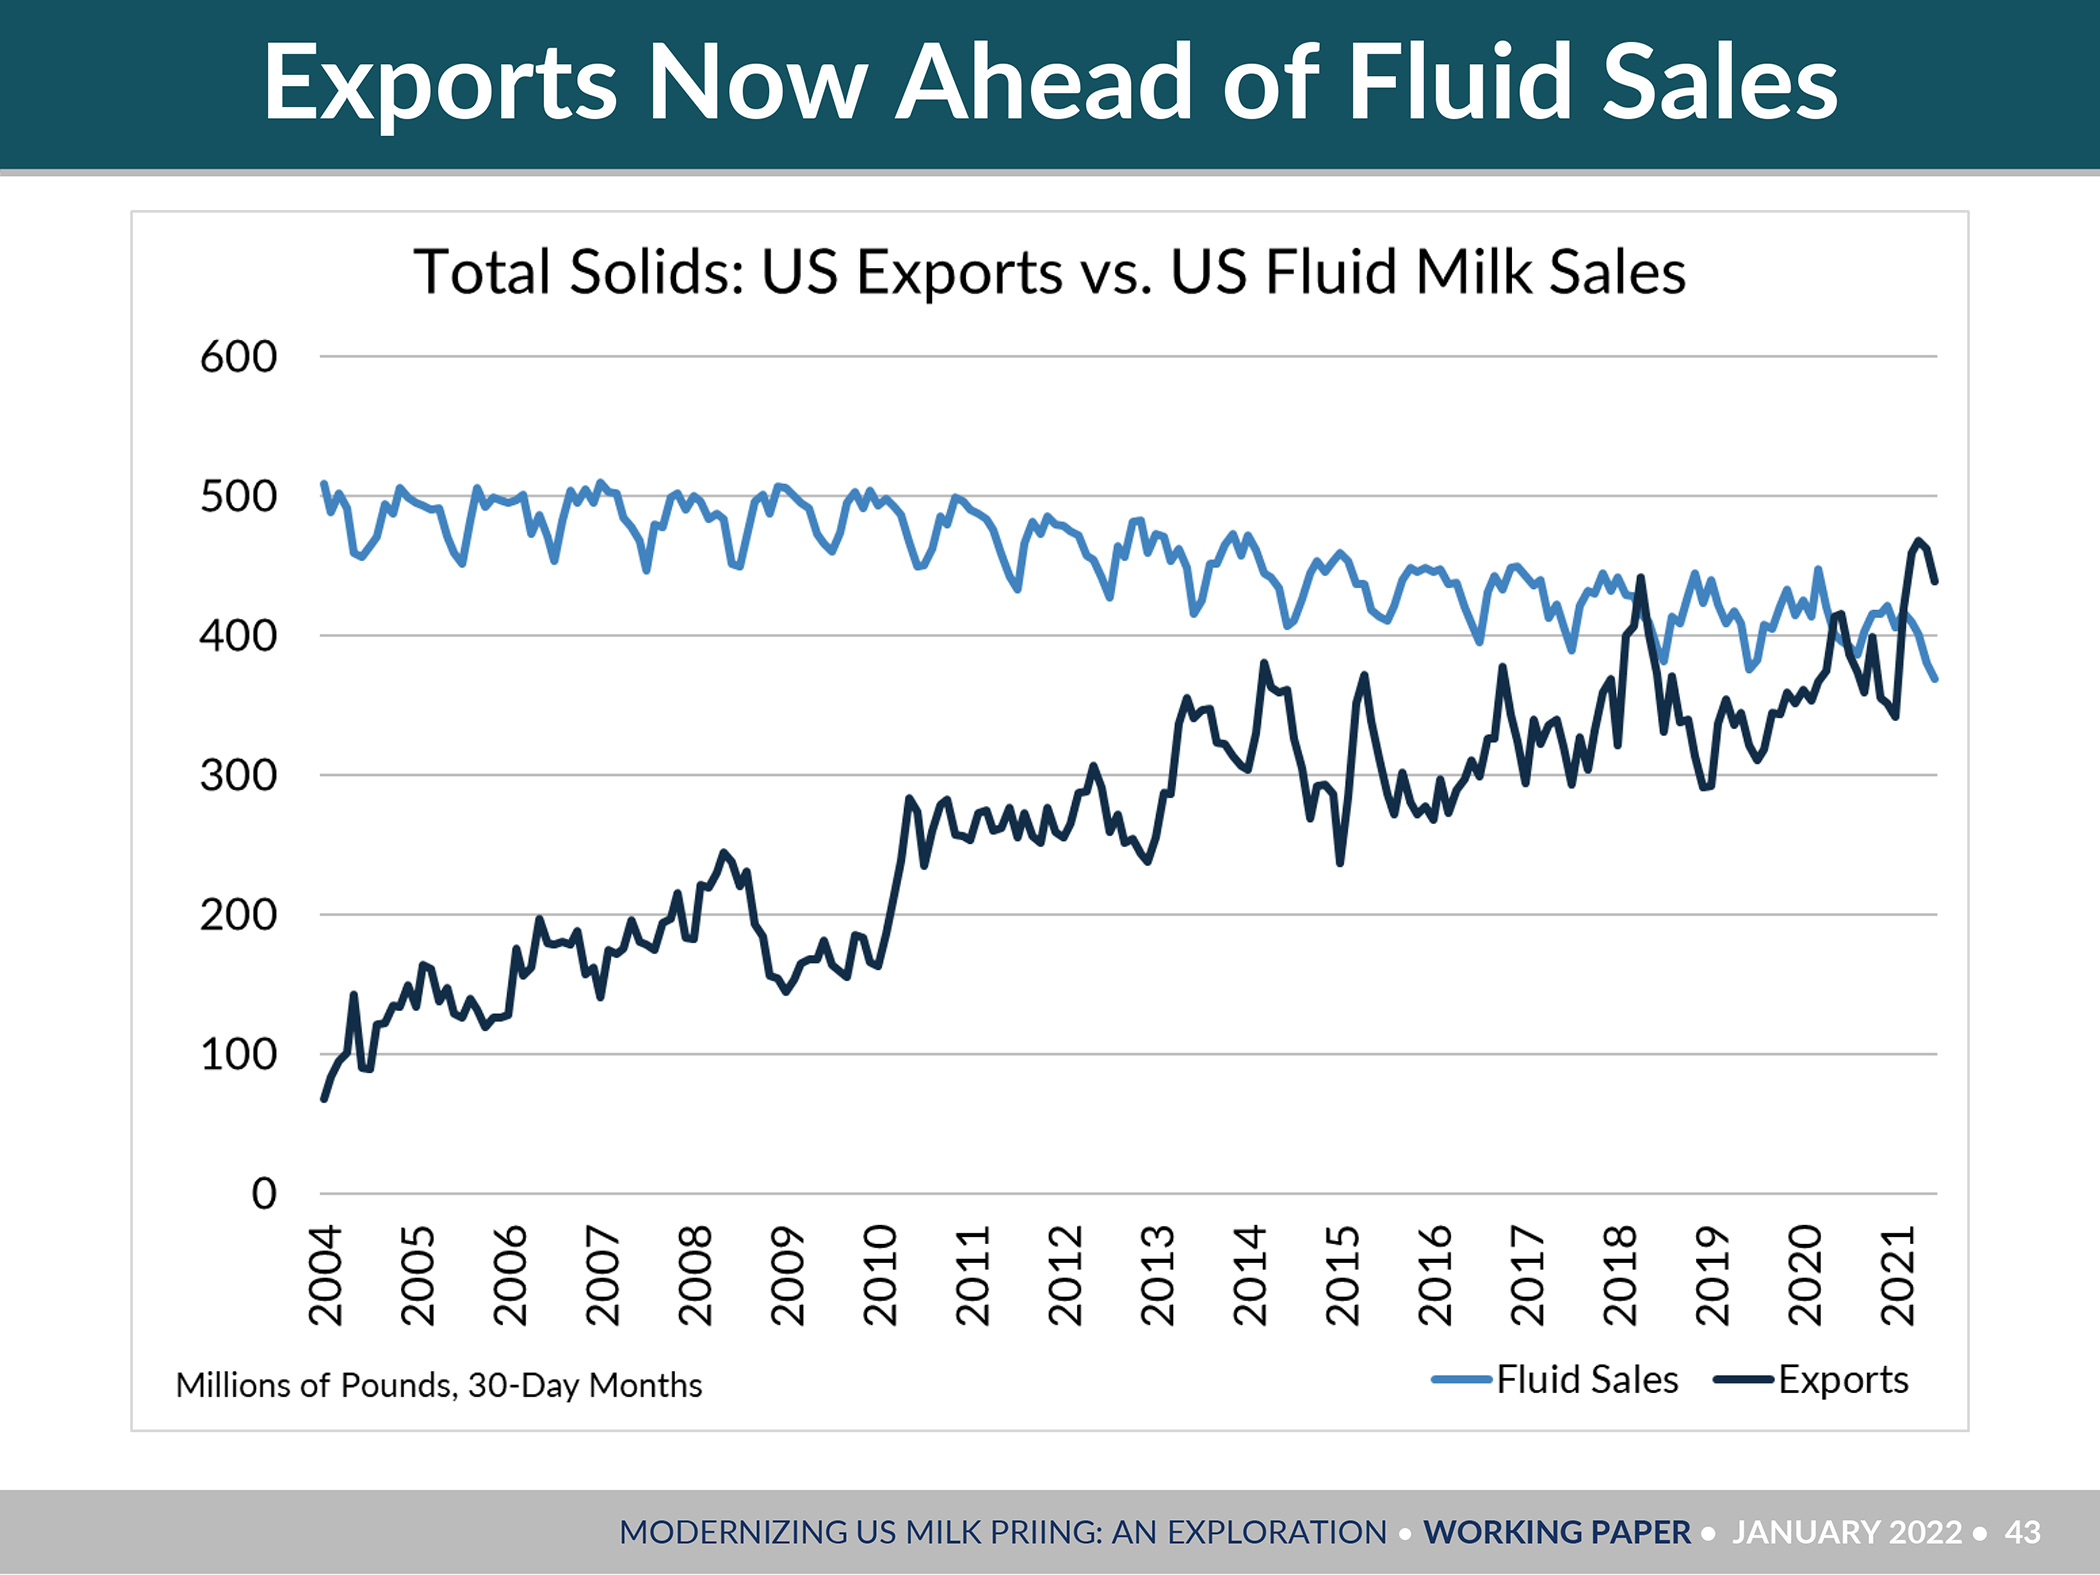
Dr. Bozic showed how the U.S. is now exporting more milk on a solids basis than is being sold in the domestic beverage category. This development is sending shockwaves through a Federal Milk Marketing Order system in which only Class I fluid milk handlers are required to participate.
Fluid milk sales are declining and being overtaken by the increasing export category — leading processors to lose interest in FMMO participation, he said.
Class I fluid milk handlers are the only ones required to participate in FMMOs. It is voluntary for all others.
As markets shift, Bozic predicts continued reductions in producer price differentials, forecasting the average Northeast PPD to decline by more than 20% over the next eight years.
He also cited the impact of inefficient milk movement stimulated by FMMO pool access provisions. This could also apply to state-regulated over-order premiums. Location-based Class I premiums can fuel inefficient movement of packaged fluid milk from more distant lower-cost-of-production areas. (When local milk is displaced, hauling costs go up.)
“What can we do to give FMMOs a new lease on life?” Bozic asked, observing that future reforms should prepare them to survive in a time when the U.S. is increasingly exporting more milk on a solids basis than in the beverage category.
Bozic said national hearings on FMMO changes could happen after the midterm elections but may not happen until after the 2023 Farm Bill, and NMPF and IDFA are working on their positions.
Right now, he said, “Milk is being priced like it’s 1999, but it’s 2022.”
For starters, he said, the standard component test should be raised to reflect current national averages that are higher than in 1999. Butterfat, for example, stands at an average 4.0, but standard test is still 3.5.
Bozic also predicted that over the next two years, the embedded make allowances in the pricing formulas will be increased. He said processors are already re-blending pay prices to accomplish a higher ‘make allowance’ internally. He cited New Zealand’s system that frequently updates manufacturing costs used to determine producer prices.
He was quick to point out that when make allowances are adjusted, it would be tools like the monthly Milk Check Transparency Report that Bozic is working on — along with some ideas for contract fairness — that would put processors on notice that they can’t just re-blend their pay prices on top of a make allowance adjustment. That would be double-dipping.
Answering questions about producer ‘cost of production’ and ‘cost-plus’ pricing, Bozic explained that in the UK, retailers are starting to use a ‘Fairness for Farmers’ label by doing a cost-plus contract model where they use accountants to measure dairy farm costs of production, along with a consumer price index, to price milk three months at a time.
One key difference, however, is the interstate commerce clause in the U.S. Constitution makes it impossible to keep milk from areas with a lower cost of production from moving to undercut price structures in areas with a higher cost of production. Feed cost could be used, which is a bit more universal, but still varies by region.
With dairy farms in the UK similarly sized with similar cost structures to farms in the Class I markets of the eastern U.S., such ideas are worth exploring, he said, noting that fluid milk prices in the UK are more stable.
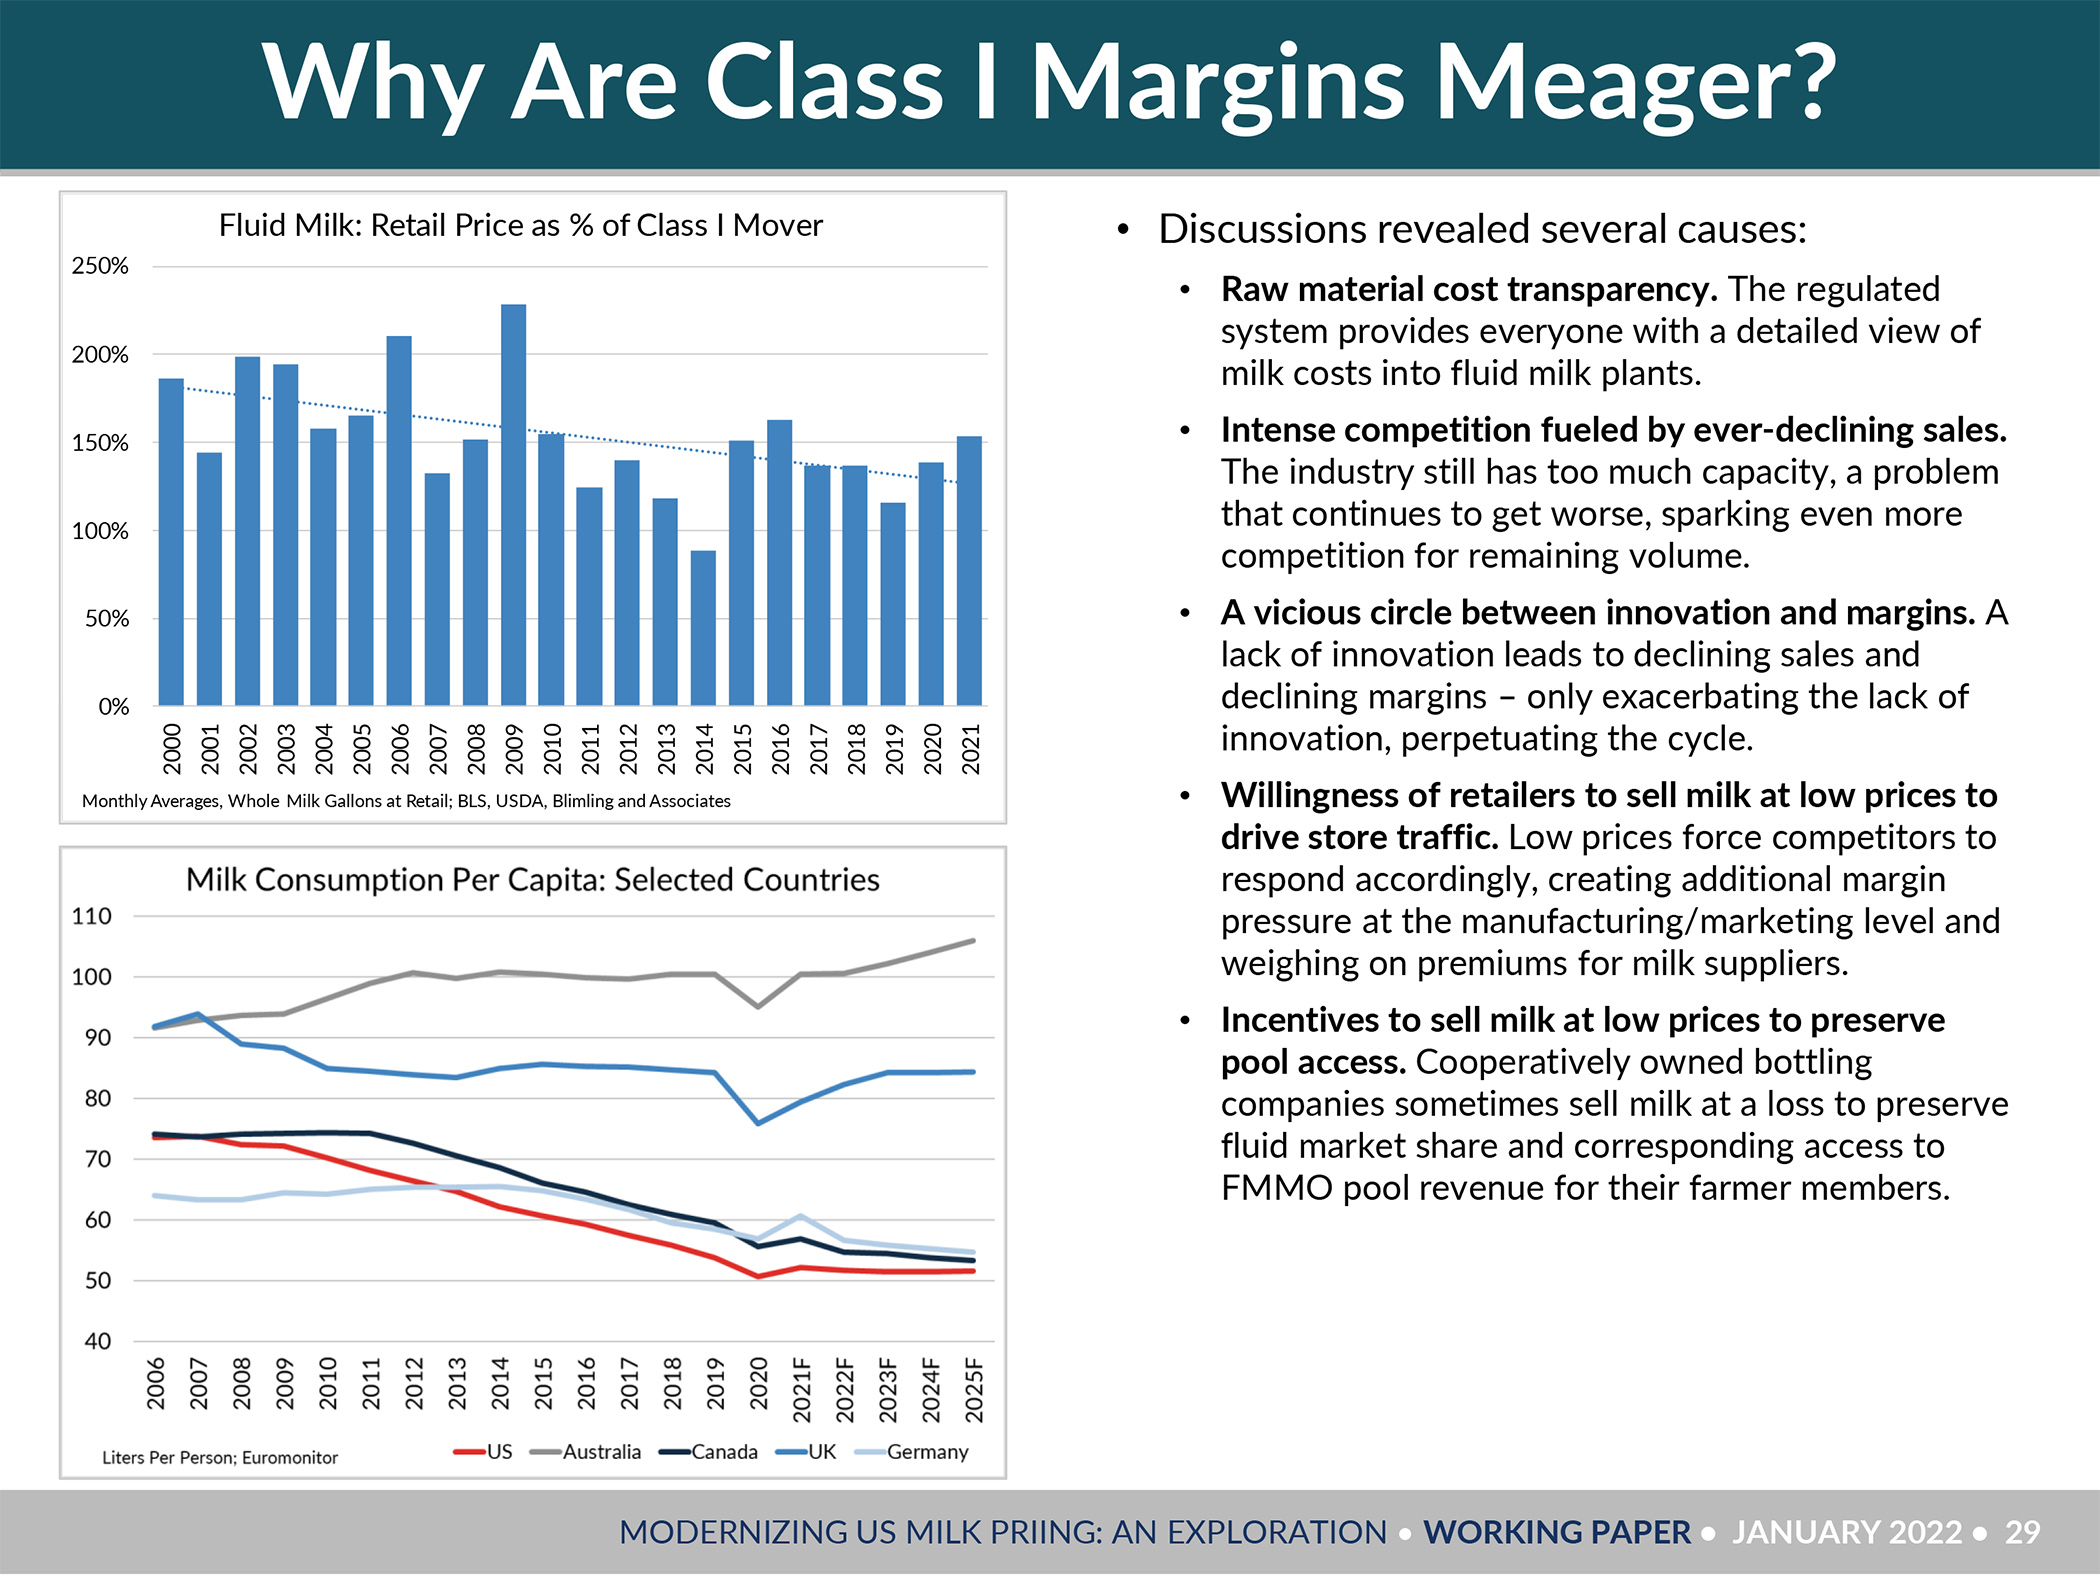
This slide from a working paper co-authored by Dr. Marin Bozic and Blimling and Associates was discussed at the PA Dairy Summit. Dairy farmer Nelson Troutman noticed the fluid milk consumption graph showed the UK (lighter blue line under gray line) doing much better in per-capita fluid milk trends the past 15 years compared with the U.S. (red line), and he asked about it. Australia (gray line) is also doing better.
Referencing Bozic’s graph showing fluid milk consumption trends for various countries, Berks County dairy farmer Nelson Troutman asked about the notably different trend in the UK compared with the U.S.
“Why is their fluid milk not going down like here?” Troutman asked. “Over there, they talk about ‘the blue milk’ (a reference to the package color of whole milk in the UK). Is it because their whole milk is higher fat than ours? They don’t take it down to 3.25%, and I think their schools can still serve it. It’s no wonder fluid milk sales are falling here.”
Bozic responded to say he thinks “it’s atrocious that we make school kids drink milk without fat,” going on to mention new technology that can convert the lactose into a dietary fiber.
“If that is successful,” said Bozic, “Then flavored milk (for schools) can be developed to have no additional calories (even with the full fat).”
In that aspect, Bozic talked about how to stimulate fluid milk brand innovation, promotion, and packaging investment in a regulated Class I pricing environment.
“We cling to the FMMO structure because we think that without it, milk pricing will be like the Wild West,” said Bozic.
“There’s some truth to that,” he acknowledged, noting that farms with fewer than 3000 cows are not sure if processors will want to work with them in the future, and the regulated pricing affords some structure for those small and mid-sized farms “to feel safe.”
In reality, however, Bozic said the Wild West is already happening, and it starts at the retail level, which then pushes losses through the system and milk all over the map.
He explained that the Class I price announcements give retailers a price in advance, and these pricing structures show them the costs of bottling, so they know how hard they can squeeze those bottlers, and they are squeezing them.
It’s within this context that Bozic put forth the idea of a fluid milk innovation premium or credit, where the Class I price could be lifted, maybe $2 per hundredweight, and processors could get this premium back — IF they innovate their brand packaging, marketing and promotion.
A key part of this concept is the cost of innovation would be within the Class I price. It would have to be earned, but would be protected from the retailer price squeeze.
“This could encourage fluid milk bottlers to do brand innovation and promotion, to invest in packaging, while making it not so easy for retailers to squeeze them to where they can’t do it,” said Bozic.
“Consumers would pay a little more for milk, but that’s fine,” he explained, citing research that shows the demand reaction to promotion is much larger than the demand reaction to price.
Outside of Pennsylvania, the 99-cent and $1.25, $1.50 gallons seen in supermarkets reflect Class I value loss that is not being borne solely by those discounting retailers. The losses are pushed back through the system, especially now that there is more cooperative ownership of Class I bottling plants, post-Dean.
Cooperatives are not required to pay Class I minimums to their milk suppliers the way that private milk buyers must.
One attendee asked about the roughly $2.50 in make allowance equivalents that are, by default, subtracted from the Class I price. Could this money be used for innovation and promotion credits since Class I bottlers are not making cheese, butter, nonfat dry milk and whey that the make allowances pertain to?
Bozic replied that the make allowances aren’t extractable because they are “embedded” in the FMMO formulas that currently determine the value of milk components.
For producers in regulated Class I areas — namely the Northeast and Southeast — Bozic said it will be important for them to “lead the way” in an open debate on how fluid milk prices can be stabilized and how the other benefits of FMMOs in payment timeliness, weights and measures, price benchmarking and such can be preserved.
When asked specifically about going back to the ‘higher of’ for calculating the Class I base price, Bozic said: “In the Northeast and Southeast, Class I is still a big deal. If you want it, and if IDFA can’t make a strong argument against it, then go for it.”
More importantly, he said: “We need to build a grand coalition. Transparency is part of that. If building a broader coalition brings us back to discussion about the ‘higher of’, then maybe that’s part of it.”
But the bigger issue he alluded to is this: Doing nothing, and letting it all just happen, could lead to Federal Orders collapsing in other parts of the country, without enough Class I to keep them together, and the system could begin to unravel, anyway, without producer input as to what functions should be saved and how to save them.
Look for part two next week on other aspects of the milk pricing discussion, and more details about what Bozic is doing on Milk Check Transparency, including how producers can participate by writing to him at marin@bozic.io
Last week’s Farmshine (Feb. 4, 2022) had a brief overview of the discussion. Check it out here
By Sherry Bunting, published in Farmshine, Feb. 4, 2022
LANCASTER, Pa. – “The optimum level of tension is not zero,” said Dr. Marin Bozic. While he is an assistant professor of applied economics at the University of Minnesota, it his independent work that he spoke of during a 90-minute reveal of bold ideas for the future of milk pricing.
Bozic was the keynote speaker for the 2022 Pennsylvania Dairy Summit in Lancaster this week. His first public presentation of what he has been working on for months fueled questions and applause from the over 300 attending dairy producers and industry members.
The first is something he has already begun bringing to fruition. Receiving milk checks from producers in some parts of the country, so far, his goal is to start publishing a Milk Check Transparency Report that would allow producers in a region, or nationally, to see how they are paid — to make milk checks more comparable, and work toward a way for producers to plug in their volume and components and be able to see how decisions affect their price.
He urged dairy producers to consider providing milk checks for this purpose with the goal to cover all regions and buyers. Only Bozic and his assistant see the milk checks, and they are destroyed once the data is entered.
“Making milk checks more comparable brings accountability,” said Bozic. “Transparency is empowering. It gives perspective, and we can have those meaningful conversations.”
While acknowledging that the conversations could get “loud,” and this could get “messy” for a while, he said again, “The optimum level of tension is not zero.”
This new Milk Check Transparency Report will be a way to introduce accountability and competitiveness into the system, said Bozic.
On the milk contracting side, he laid out several ways that producers can have a more level playing field. Key among them is that milk buyers should not be allowed to limit a farm’s production and require exclusivity at the same time.
“Those are two separate lanes, and when they cross, we have traffic accidents,” said Bozic. In other words, a milk buyer or co-op should not require a patron farm to sell only to them while at the same time having a two-tiered pricing scheme — putting limits on how much they will buy at a non-penalty price.
Bozic talked about tweaking the FMMO system to “reinvigorate” fluid milk. He had ideas for a processor premium — raising the price of fluid milk with a premium that, for example, processors can earn back through innovation of packaging and promotion that improves fluid milk marketing.
He also discussed having an open debate about how to price Class I differently for more stability. So much important ground was covered. Look for details in a future Farmshine.
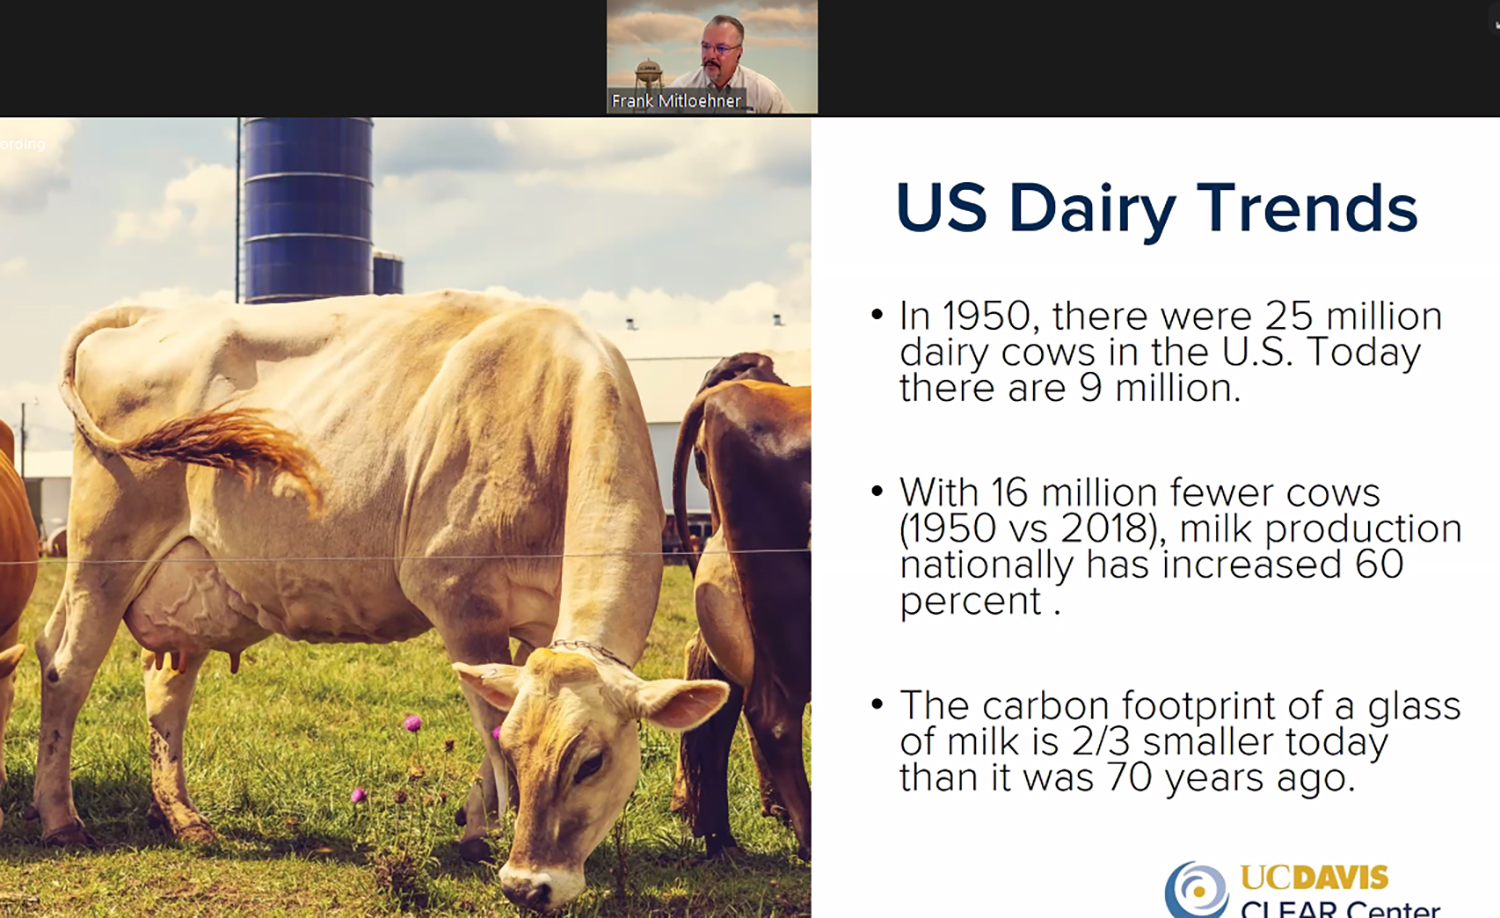
Dr. Frank Mitloehner is a foremost authority on animal science and greenhouse gas emissions. Find him on Twitter @GHGGuru and @UCDavisCLEAR (Screen capture from American Dairy Coalition webinar)
‘Climate neutrality, not net zero carbon, should be dairy’s goal.’
By Sherry Bunting
‘Net zero’ seems like a simple term, but it’s loaded, according to Dr. Frank Mitloehner, professor and air quality specialist with the Department of Animal Science at University of California-Davis.
He firmly believes dairy can be a climate solution, but the first step is to accurately define dairy’s contribution to the climate problem. Setting the record straight is his prime focus, and he also researches ways dairy, like every industry, “can do our bit to improve.”
Presenting on what ‘net zero’ really means for dairies, Mitloehner answered questions during the American Dairy Coalition (ADC) annual business meeting in December, attended by over 150 producers from across the country via webinar.
Based in Wisconsin, ADC is a national producer-driven voice with a regionally diverse board. President Walt Moore, a Chester County, Pennsylvania dairy producer, welcomed virtual meeting attendees, and CEO Laurie Fischer shared a federal dairy policy update.
She said the ADC board is nimble, moves quickly, and wants to hear from fellow dairy farmers. She encouraged membership to make ADC stronger and shared about the organization’s federal policy focus in 2021 — from pandemic disruptions and assistance, Federal Order pricing, depooling and negative PPDs to real dairy label integrity, whole milk choice in schools, and farmers’ questions and concerns about dairy ‘net-zero’ actions.
“Too often, farmers think they may not understand something, so they don’t speak up,” said Fischer. “But we get calls and so much great advice from our farmers. We know you get it, you know it, because it is happening to you.”
From this farmer input, the net-zero topic became the ADC annual meeting focus.
“We are rethinking methane, and this is influencing and shaping the discussion,” Dr. Mitloehner reported. He urged producers to use the information at the CLEAR Center at https://clear.ucdavis.edu/ and to do better networking, to have a better presence on social media.
This is necessary because the activists are well-connected, and methane is the angle they use in their quest to end animal agriculture. He said Twitter is a platform where many of these discussions are happening. His handle there is @GHGGuru and the Center is @UCDavisCLEAR.
“This is something I have told the dairy industry. They say ‘net-zero carbon’, but they shouldn’t say that because it is not possible, and it is not needed. We need to be saying ‘net-zero warming’. That’s the goal. Then, every time you reduce methane, you instantaneously have an impact that is inducing a cooling effect,” said Mitloehner.
‘Climate neutrality’ is the more accurate term he uses to describe the pathways for U.S. dairy and beef. But it requires getting accurate information into policy in a fact-based way.
It requires arming people with the knowledge that the constant and efficient U.S. dairy and livestock herds produce no new methane, that they are climate-neutral because not only is methane continuously destroyed in the atmosphere at a rate roughly equal to what is continuously emitted by cow burps and manure, that process involves a biogenic carbon cycle in which the cow is a key part.
One of the issues is how methane from cattle is measured, he said. Current policy uses a measurement from 30 years ago that fails to acknowledge the carbon cycle and ‘sinks’ alongside the ‘emissions.’
Mitloehner said accurate information is beginning to change the narrative. This is critical because methane is the GHG of concern for dairy, and the narrative about it has been incomplete and inaccurate.
As a more potent heat-trapping gas than carbon dioxide, methane becomes the ‘easy’ target to achieve the warming limits in the Paris Accord. Methane was the focal point of ‘additional warming limits’ during the UN Climate Change Summit (COP26) in Glasgow in November.
Putting together the inaccurate narrative alongside international agreements to specifically reduce methane, it becomes obvious why cattle are in the crosshairs. Producers are already in the middle of this in California as methane regulation and carbon credit systems began there several years ago.
As the narrative is beginning to change, Mitloehner sees opportunities. He described the current California ‘goldrush’ of renewable natural gas (RNG) projects where large herds both in and out of state cover lagoons to capture and convert biogas into RNG. The state’s investments and renewable fuel standard provide a 10-year guarantee with the RNG companies typically owning the offset credits that can be traded on the California exchange from anywhere.
Getting the numbers right is mission-critical
“We are far and away an outlier because of our efficiency in the U.S with all livestock and feed representing 4% of the GHG total for the U.S,” Mitloehner confirmed. “Dairy, alone, is less than 2% of the U.S. total.”
This is much smaller than the 14.5% figure that is thrown about recklessly. That is a global number that includes non-productive cattle in India as well as the increasing herds in less efficient developing countries. This number also lumps in other things, such as deforestation.
He said the true global percentage of emissions for livestock and manure is 5.8%. Unfortunately, activists and media tend to use the inflated global figure and conflate it with these other things to inaccurately describe the climate impact of U.S. dairy and livestock herds as 14.5%.
The efficiency of U.S. production and the nutrient density of animal foods must be part of the food and climate policy equation.
Methane is not GHG on steroids
“Without greenhouse gases, life on earth would not be possible because it would be too cold here,” said Mitloehner. “We need GHG, but human activity puts too much into the atmosphere, and the toll is large concentrations.”
The way all GHGs are measured has to do with their intensity as determined 30 years ago when scientists wanted one global warming potential (GWP) unit to compare cows to cars to cement production and so forth. They came up with GWP100, which converts methane to CO2 equivalents based on its warming potential.
Methane traps 28 times more heat than CO2, but it is short-lived, Mitloehner explained.
“Looking just at the warming potential, you get this idea that methane is GHG on steroids and that we need to get rid of all of it and all of its sources,” he said.
But is this the end of the methane story? No.
Sinks and cycles must count
Mitloehner described how ‘methane budgets’ look at sources and their emissions but ignore the carbon sinks that go alongside and ignore the chemical reactions that result in atmospheric removal of methane as well.
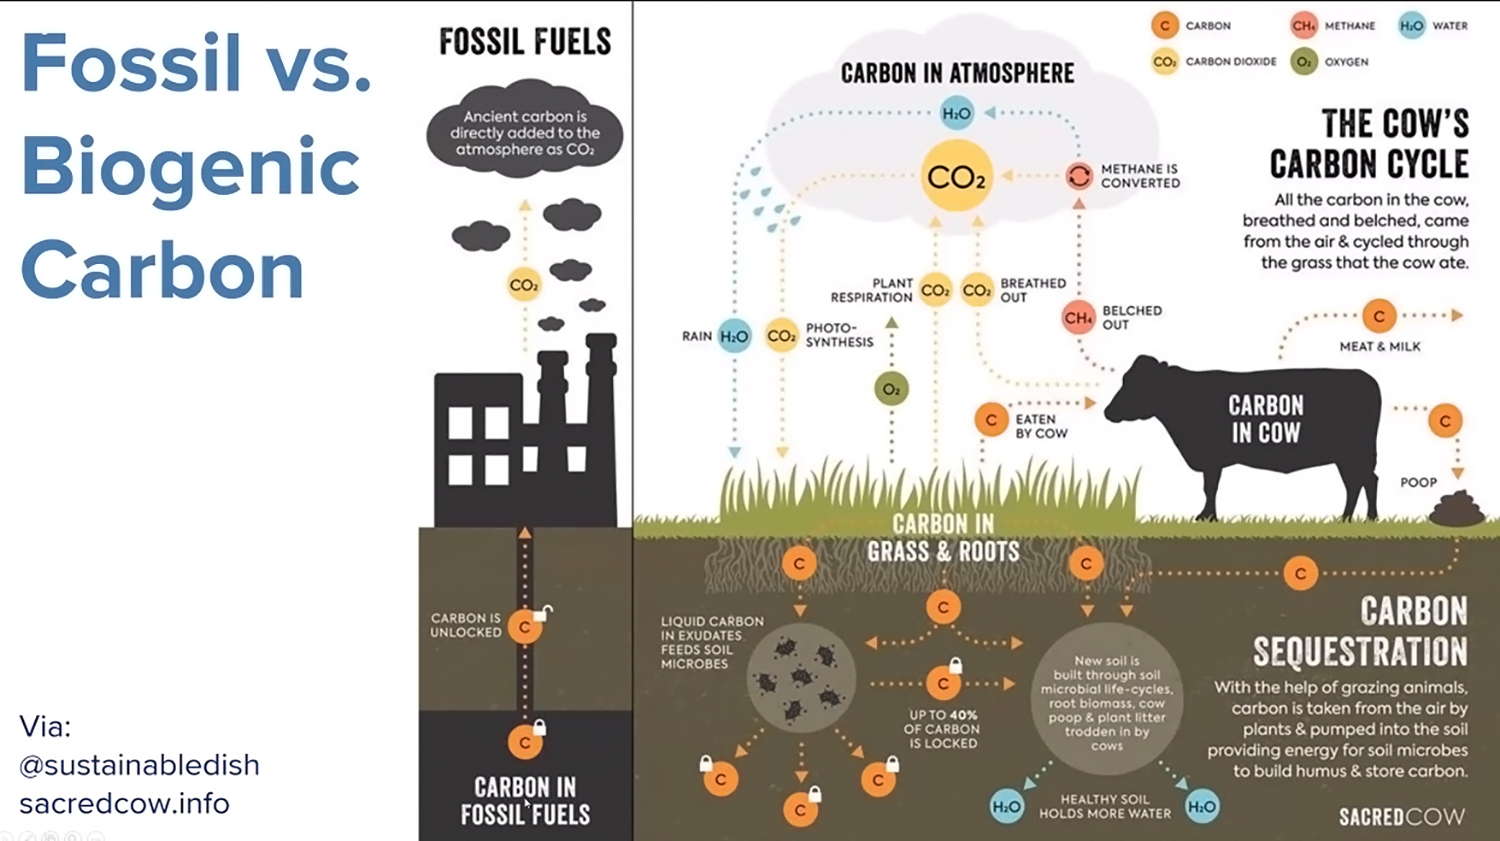
“Plants need sunlight, water, and a source of carbon. That carbon they need comes from the atmosphere to produce oxygen and carbohydrates,” he said, explaining how cows eat the carbohydrates and convert them to nutrient dense milk and beef. In that process, the rumen produces methane.
“Is this new and additional carbon added to the atmosphere? No it is not. It is recycled carbon,” he said.
“Say you work off the farm. You drive and burn fuel, adding new CO2 in addition to the stock in the atmosphere the day before. Stock gases accumulate because they stay in the environment. Currently, agencies treat methane as if it behaves the same way. But methane is a flow gas, not a stock gas. It is not cumulative,” said Mitloehner.
If the same farm has 1000 cows belching today and 1000 belching 10 years ago, those 1000 cows are not belching new methane because in 10 years it is gone from the atmosphere. It is cyclical.
“The take-home message is the carbon that our constant livestock herds produce is not new carbon in the atmosphere. It is a constant source because similarly to it being produced, it is also destroyed. The destruction part is not finding its way into the public policy system… but it will in the future,” he predicts.
Methane drives Paris Accord and COP26
Methane targets are driving intergovernmental agreements wanting to limit the “additional warming impact” of nations and industries.
Currently, cattle are viewed as global-warmers because they constantly emit methane. However, as Mitloehner drilled numerous times, this is not new methane, it is not additive, it is not cumulative. It is recycled carbon.
“If you have constant livestock herds, like in the U.S., then you are not causing new additional warming,” said Mitloehner.
Burning fossil fuels is much different.
“Fossilized carbon accumulated underground. Over 70 years, we have extracted half of it and burned it, so where is it now? In the atmosphere. We added new and additional CO2 that is not a short-lived gas. It is a one-way street from the ground into the air,” he explained.
The problem for dairy and beef producers is their cattle are being depicted as though their emissions are additive, cumulative, like fossil fuels, which is not true, he said.
Signs the narrative is changing
One promising sign that the message is getting through has come from Oxford researchers acknowledging the constant cattle herds in the U.S. and UK are not adding new warming.
They acknowledge the GWP100 “grossly overestimates” the warming impact of cattle and are working on a new measurement that recognizes constant cattle herds are not adding new warming, said Mitloehner.
Another promising sign is that the International Panel on Climate Change (IPCC) issued a statement recently acknowledging that the current GWP100 overblows the warming impact of cattle by a factor of four. This new information is not in current policy, but it is making its way there.
Tale of two bathtubs
Mitloehner believes it is important to visualize climate neutrality. He described two bathtubs. One has a CO2 faucet with no drain, the other a methane faucet with a drain. Open the faucets, and even at a slow and steady rate, the CO2 bathtub continues to rise, while the methane bathtub drains as it fills to remain at a constant level.
He also explained that over the past 200 years the U.S. hasn’t seen any real change in that methane bathtub because prior to settlement in America, 100 million ruminants — buffalo and other wild herds — roamed. Today, there are around 100 million large ruminants in the U.S. dairy and beef industries.
What has changed is the U.S. does have more liquid manure lagoon storage that is producing more methane than solid manure storage. “But we know of ways to further reduce that,” he said.
Mitloehner pointed out how the current GWP100 poorly estimates the warming impact three example scenarios. If, over 30 years, methane is increased 35% from a source, or reduced 10%, or reduced 35%, the GWP100 would show significant continuous addition of cow-sourced methane in CO2 equivalents for all three scenarios because the destruction of the methane – the drain that operates with the faucet – is ignored.
The proper way to look at this, if the methane increased a lot, is that it would add a lot. But if it is balanced, then there is no new or additional warming. And, in that third scenario, he said, “where we pull a lot from the atmosphere when we reduce methane, it has the same impact as growing a forest.”
Bottom line, said Mitloehner, “We can be a solution and take it to the market and get paid for that,” but current policy does not yet reflect the neutral position of the constant and efficient U.S. herd.
Bullish about the future
‘Net zero’ is a term that is not yet clearly defined, said Dr. Frank Mitloehner several times during the American Dairy Coalition annual meeting by webinar in December. He sees the real goal as “climate neutrality,” to communicate the way constant U.S. dairy herds contribute “no additional warming,” in other words “net zero warming.”
The climate neutrality of U.S. cattle must be part of public policy, he said. Only then will dairies truly be on a path to marketing their reductions as ‘cooling offsets.’
Mitloehner, a University of California animal scientist and GHG expert is bullish about the future of “turning this methane liability into an asset, so if we manage toward reducing this gas, we can take that reduction to the carbon market,” he said.
“When we hear ‘net zero’, we think about carbon, but that would mean no more GHG is being produced, and that is not possible. I have told the dairy industry this for years. Why is (zero GHG) not possible? Because cows always belch, and we can’t offset that, and furthermore, we do not need to offset that because it is not new methane,” said Mitloehner.
On the other hand, “If we replace beef and dairy made in the U.S., this does not create a GHG reduction at all. This is because we are the most productive and efficient in the world,” he said.
Just stopping beef and dairy production here in the U.S. — and picking up the slack by producing it somewhere else or producing something else in its place — creates ‘leakage.’ This leakage, he said, is where the biogenic carbon cycle becomes disrupted. In other words, the bathtub has a faucet that is out of sync with the drain.
California’s RNG ‘goldrush’
Mitloehner touched on the strict California standards that mandate a 40% reduction of methane be achieved by the state by 2030. Again, methane is targeted because of its warming potential per the Paris Accord.
The good news, he said, is California is using incentives to encourage covering manure lagoons to capture a percentage of the biogas bubble so that it doesn’t go into the atmosphere but is trapped beneath the tarp and converted into renewable natural gas (RNG) that can be sold as vehicle fleet fuel to replace diesel.
Because this RNG comes from a captured and converted methane source, it is considered a most carbon-negative fuel in the state’s low-carbon fuel standard.
Those credits equate to $200 per ton of CO2 replaced with a carbon-negative renewable, said Mitloehner.
“This is a huge credit. This is why dairies are flocking to get lagoons covered to trap and convert. These credits are guaranteed for 10 years in California, but the anti-agriculture activists are fuming over them,” said Mitloehner.
Of all California investments made toward achieving the 40% methane reduction goal, dairy has received just 3% of funds, but has achieved 13% of reductions so far.
This “carrot” approach has incentivized the biogas RNG projects assuming $4000 income per cow, making an estimated $1500 to $2000 per cow per year on a 10-year California fuel standard guarantee.
Mitloehner noted that the carbon intensity of the reduction is presently viewed as greater when RNG is used in vehicles vs. generating electricity, but right now there is not enough RNG suitable for vehicle use. He sees the fuel use increasing in the future and explained that dairies anywhere can sell into the California market if they capture biogas and convert it to RNG.
The state’s 10-year guarantee has stimulated companies seeking to invest in RNG projects on large dairy farms, where they then own or share the credits.
Mitloehner answered a few questions from producers about the caveats. If the bottom and top of the lagoon are covered, what happens to the sludge that accumulates? He acknowledged there is no satisfactory answer to that question presently.
Another drawback is the technology only works for larger dairies because smaller lagoons won’t have the same breakeven. Community digester models are emerging as well, he said, but they also use clusters of large farms working together.
Soil carbon sequestration
Mitloehner cited soil carbon sequestration as a way dairy farms of any size can be a solution.
It’s the process by which agriculture and forestry take carbon out of the air via the plant root systems that allow the soil microbes to take it into the soil — unless the soil is disturbed by tilling or it is released through fires. With good forest and grassland management, as well as low- and no-till farming practices, carbon can be sequestered to stay in the ground forever, according to Mitloehner.
“Agriculture and forests are the only two ways to do this,” he said, adding that USDA seeks to incentivize practices that take and keep more of the atmospheric carbon in the soil.
Answering questions from producers, he noted that he has not yet seen a scheme that would incentivize soil carbon sequestration through marketing offsets, but the discussions are heading in that direction.
“Many of the environmental justice communities are running wild on this. They do not want farmers to get any money for it. They are putting on significant pressure and threatening lawsuits, so it’s not settled yet,” he reported.
There is also a lot of confusion around soil carbon sequestration and “regenerative” agriculture. One big problem is that producers who are doing some of these things, already, won’t get the opportunity to capitalize on those practices when offset protocols are eventually developed — if those practices are not deemed “additive.”
“If you are doing something now and are not covered by a policy of financial incentive, then four years from now, if it is developed, they’ll say you don’t qualify because you are already doing it,” said Mitloehner.
“They are calling it ‘additionality.’ It’s about the change to doing it to qualify. That seems crazy, but it’s like if you bought an electric vehicle 10 years ago when there was no tax credit, you don’t get a tax credit now for already owning an EV because the improvement is not ‘additional,’” he explained.
What about the burps?
For farms with under 1000 cows, other technologies like feed additives can be used on any size dairy with effects realized within a week, said Mitloehner, noting one product that is commercially available and several others on the docket.
If a 10 to 15% reduction can be achieved in enteric (belching) methane reduction, then it will be marketable. Right now, these reductions are not marketable. If an offset protocol is developed for this in the future, it will be taken to the carbon market, he said.
In the meantime, incentives are being offered within supply chains, according to Mitloehner. Companies like Nestle, Starbucks and others are doing pilot projects and buying feed additives for the farmers within their supply chains to reduce their products’ GHG. He said there is some evidence these products can enhance components and feed efficiency. This is a big area of research right now.
A question was also asked during the webinar, wondering about Amish farms using horses instead of tractors. Are they contributing to cooling?
Mitloehner replied that he has not yet seen a calculation for this, and while the impact of horses would be less than the impact of burning fossil fuels, there is still an environmental impact to calculate.
Since the international focus is on ‘additional warming impact’, methane is – like it or not — the target. Whether a dairy farm is managed conventionally or in the Amish tradition, the cows, the methane, and how governments and industry measure the ‘additional warming impact’ of cow-sourced methane, is still the crux of the issue for all dairy farms. If efficiency is reduced, then the ability to position the dairy farm as ‘cooling’ may be more complicated, or less significant, he said.
In addition to accurate definitions that acknowledge climate neutrality of constant cattle herds producing no new methane, Mitloehner’s wish is for federal policy to also take productivity (and nutrient density) into stronger consideration when evaluating emission intensity “instead of just counting heads of cattle.
“This can be good for large or small dairies with a high or low footprint. When the relative emissions are determined by how you manage the dairy, the hope is that this is more about the how than the cow.”
Class I price under the new ‘average-plus’ formula vs. the previous ‘higher of’ formula and the net loss dairy farmers have missed out on over 34 months — May 2019 – Feb 2022
By Sherry Bunting
USDA announced the February Class I ‘mover’ on Jan. 20 at $21.64. The good news is this is $1.93 higher than the January mover and $6.10 higher than a year ago. The Class I mover is the base price paid for milk going to fluid beverage use before location differentials are added.
The bad news is the February Class I mover is 51 cents less under the current ‘average-plus’ formula ($21.64) than it would have been under the previous ‘higher of’ formula ($22.15).
During the Georgia Dairy Conference this week, retired co-op CEO Calvin Covington, author of the Dixie Dairy Report, gave a positive outlook for 2022. He noted the year begins globally with modest product inventories, reduced production of milk and strong demand for dairy.
When asked about risk, Covington noted that it doesn’t take much change in these factors to swing markets the other way. The higher milk prices go, the more downside risk there is for producers to protect.
When asked about federal order reform ‘consensus’ building and the Class I mover formula, Covington said the reform process was navigated in the past through a hearing process involving the USDA Dairy Division. He also said the Class I mover formula should return to the previous ‘higher of’ method because the costs of serving the Class I market continue to climb while the Class I price takes a back seat to other classes in some months under the ‘averaging’ method.
That may be the case in January and February when final prices are announced, and the possibility exists that this inversion could continue.
For February 2022, the advanced Class III skim milk pricing factor, based on cheese and whey prices in the first two weeks of January, is pegged at $10.43 while the Class IV skim pricing factor, based on butter and powder, is pegged at $12.97. That’s a spread of $2.54 per hundredweight.
This spread has been widening since November — now more than erasing the 74-cent adjuster applied under the current skim ‘averaging’ method. In the February calculation, it was the uptrending butterfat value at $2.7537/lb that softened the blow.
The entire formula figures the average of the two skim pricing factors (Classes III and IV) + 74 cents x 0.965. It also multiplies the butterfat price by 3.5. Then the resulting numbers for skim and fat are added together to form the Class I advance base price – or as it is called, ‘the mover.’ When Class I is highest, milk is sure to ‘move’ to those fresh fluid milk needs, which is one of the main stated purposes of the Federal Milk Marketing Orders.
The February Class I price announcement is the first since June 2021 to fall below the old method using the new method. This happened every month in the second half of 2020 and first half of 2021 as well as three months in 2019. The new method was implemented by USDA in May 2019 due to a legislative change in the 2018 Farm Bill that did not go through a Federal Order hearing process.
From July through December 2021, producers gained 27 to 70 cents from the averaging method as Classes III and IV traded close together. Those brief gains netted around $100 million, which paled in comparison to the approximately $780 million in net Class I value losses to producers from May 2019 through June 2021. With January and February 2022 figured in (no benefit in January and a 51-cent loss in February), the net Class I value loss is now estimated at $687 million for the 34 months since the Class I pricing change began in May 2019.
Supply and demand shocks, supply chain disruptions and other fundamentals are creating the double-impact of rapidly rising dairy product prices and the widening spread between Classes III and IV. The combination is creating a situation where Class I is well on its way to becoming the lowest-priced class, even in some FMMOs after the location differentials are applied.
In fact, if these differences lead to a lot of de-pooling and negative producer price differentials (PPDs), those location differentials will also be shaved in the blend price to producers.
It will be interesting to see how this plays out perhaps differently now that Class IV is leading Class III by a wide margin instead of the other way around as previously.
Here’s what’s been happening since November.
When the Class I mover was calculated for December at $19.17 based on early November pricing factors, dairy farmers benefitted from most of the 74-cent adjuster because the Class III and IV ‘advance’ pricing factors were close together with just a 12-cent spread. By the time the December class and component prices were announced on January 5, Class I mover was surpassed by Class IV at $19.88 and Class II $19.84, but Class III was still behind Class I at $18.36.
Then, when the January Class I price of $19.71 was announced four weeks ago based on the pricing factors back in the beginning of December, the factors began shaping up for the Class I mover to be dead-last by the time the January class and component prices are announced on Feb. 2. It would have been far behind II, III and IV had the block cheese price not lost 21 cents on the CME Spot market this week, pulling futures markets back $1.00 during the Jan. 19 and 20 trading sessions.
With one week of trading to go before January closes, odds are the Class I mover will be surpassed by all other class prices when the final announcement comes out on Feb. 2. Class IV will likely be highest in the mid-$22s, Class II will be close to Class IV, Class III will most likely be over $20 unless block cheddar takes another hit, and Class I will clock in at the previously announced $19.71.
In the January Class I ‘mover’ calculation of $19.71, the Class III and IV pricing factors diverged by precisely $1.48. This is the magic number because the adjuster to the average is 74 cents and 74 x 2 = $1.48. With the January Class I price spot-on equal to what it would have been under the previous ‘higher of’ method, no benefit was received by producers for that ‘adjuster’, and therefore, the issue of Class I being potentially the lowest priced class in the blend price for January is due entirely to the advanced pricing 4 to 6 weeks before the other classes.
February’s pressure on Class I relative to II, III and IV looks to be steeper and will be based on two factors – the 6-week difference in determining the values in a rising market and the widening of the spread between the Class III and IV skim pricing factors.
Looking out across the milk futures months of 2022, the spreads are much wider now than they looked a few months ago, even as the brakes were applied unevenly putting Class III and IV futures trading in reverse adjustment mode today and yesterday.
(NOTE: The USDA Pandemic Market Volatility Assistance Program, PMVAP, authorized $350 million to be paid to farmers at a rate of 80% of their July-Dec 2020 Class I value loss — on up to 5 million pounds of milk per farm via their milk co-ops and handlers and calculated only on FMMO-pooled milk value. But these payments are delayed in most cases, and will fall well short of the real value missed in the milk checks of many dairy farmers across the country as the Class I losses influenced other aspects of FMMO pooling and payment as reflected in negative PPDs.)
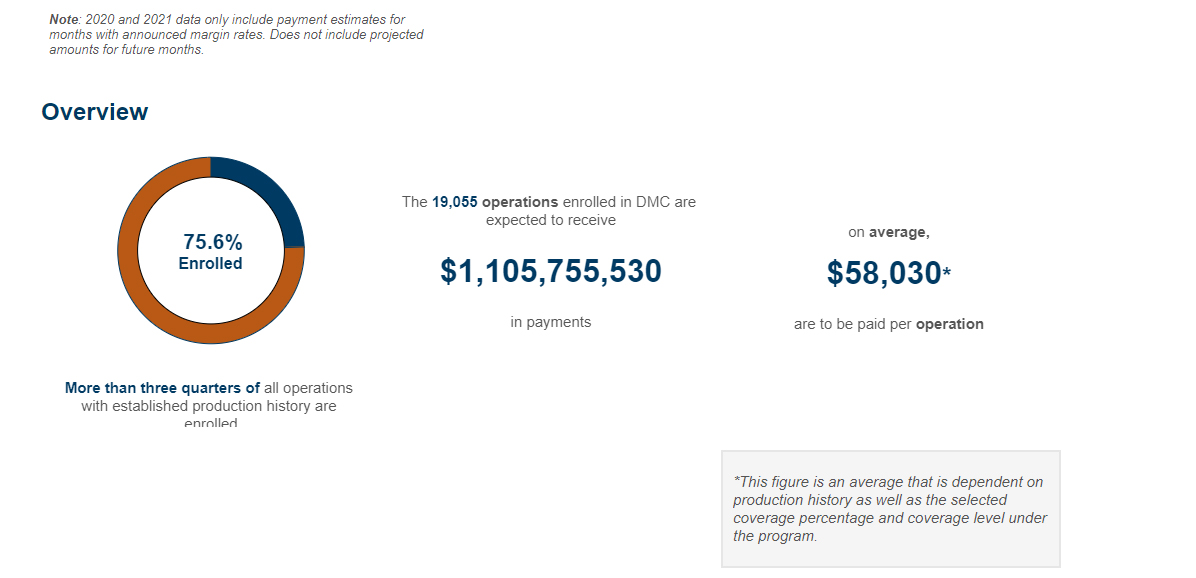
This USDA chart shows the 2021 DMC program enrollment and performance at a glance, but has not yet been updated to reflect the additional payments from the feed cost change and the supplemental production. The feed cost change to using all premium alfalfa hay prices adds a net average of 22 cents per cwt. to each month of triggered DMC payments retroactively back to January 2020. For producers covered at the $9.50 margin level, that’s a one-time payment of almost $3 per cwt, net, per production history. This feed cost change is expected to add 15 to 25 cents to monthly feed costs in the margin calculation for 2022 and 2023 DMC.
By Sherry Bunting, Farmshine, December 17, 2021
WASHINGTON, D.C. — With the announcement of the Dairy Margin Coverage (DMC) signups starting December 13, 2021 through February 18, 2022, dairy farmers saw the first glimpse of the retroactive payments passed by Congress and signed by the prior administration in December 2020. This had been followed by announcements by the current administration via Ag Secretary Tom Vilsack in August 2021.
Since that time, dairy farmers have been patiently waiting for the feed cost adjustments that are retroactive all the way back to January 2020 and waiting to update their production history for the supplemental coverage promised in 2021.
Several industry sources estimate the new alfalfa-hay price adjustment to the DMC feed cost calculation netted an average 22 cents per cwt to each payment month in 2020 and 2021 for producers enrolled at the highest margin coverage levels. Future payments will also benefit during the life of the DMC program, which is authorized by the 2018 Farm Bill through 2023.
For example, the $8.77 margin for October 2021 was recently changed to $8.54 due to the feed cost calculation upgrade — adding 23 cents per cwt. to the October DMC payment triggered for farms enrolled at the $9 and $9.50 coverage levels.
According to USDA FSA sources, the funds were released in early December, and the automatic retroactive payments to DMC-enrolled producers for the alfalfa-hay adjustment to the feed cost side of the dairy margin calculation have been sent. Producers enrolled at the higher margin levels should have received these retroactive payments by the end of 2021, and even those enrolled at lower margin levels will receive a retroactive benefit, though smaller.
Industry sources estimate the total one-time retroactive adjustment for 2020 and the first 10 months of 2021 amounts to a one-time payment of almost $3 per cwt. at 95% of a dairy farm’s tier one production history (up to 5 mil. lbs) enrolled at the $9.50 margin coverage level.
This feed cost change, alone, yields a margin benefit that exceeds the cost of the tier one premium for DMC coverage at the highest margin level of $9.50. That level of DMC coverage costs 15 cents per cwt – up to 5 million pounds of annual production history, and farms can cover up to 95% of that. To cover pounds beyond the 5-million-pound tier-one cap, the DMC premiums are more expensive and the $8 margin is the highest margin one can cover beyond the tier one, 5 million pound production history base.
In addition to the feed cost change, the Dec. 8 USDA announcement designated Dec. 13, 2021 through Feb. 18, 2022 as the signup period for both the 2021 Supplemental DMC payments on expanded production as well as the coverage level selections for 2022. The Supplemental DMC was passed by Congress in 2020 and was supposed to go into effect for 2021 forward.
Farms that have expanded production since their 2011-13 production history average was calculated will want to verify this with their USDA FSA office using a 2019 milk statement. The application for the 2021 Supplemental DMC must be submitted before doing the 2022 DMC enrollment and coverage level selections. Any farm that has a production history on record with USDA FSA under the previous MPP program — but never enrolled in DMC — will also want to go back and update their production history before enrolling in DMC for 2022.
According to the Federal Register rule, there is a formula applied to the expanded production so it’s not a pound-for-pound update.
Once the farm’s application for the new production history is approved by USDA FSA, the producer will receive the retroactive DMC payments on a percentage of that supplemental production back to January 2021.
Because of the tier-one cap, the Supplemental DMC pertains to herds around 300 cows or less with updated total production history of 5 million pounds or less annually. This cap has not been expanded.
Also, dairy farms that went through a transfer of ownership interest after Jan. 2, 2021 must have the predecessor file and verify the supplemental production history – even if the successor is the one now enrolling in the DMC program.
The DMC program has triggered payments in every month, so far, of 2021 for producers enrolled at the highest coverage level ($9.50), and there were several months of payments for producers enrolled at the $6 level. Tier one coverage at the highest margin level ($9.50) on the first 5 million pounds of annual production costs 15 cents per cwt., and the average payout so far for 2021 at that level has ranged from 96 cents in October to over $4 per cwt in July. The November and December 2021 DMC margins have not yet been announced. In addition, during 2020, payments triggered in five months and in 2019, seven months.
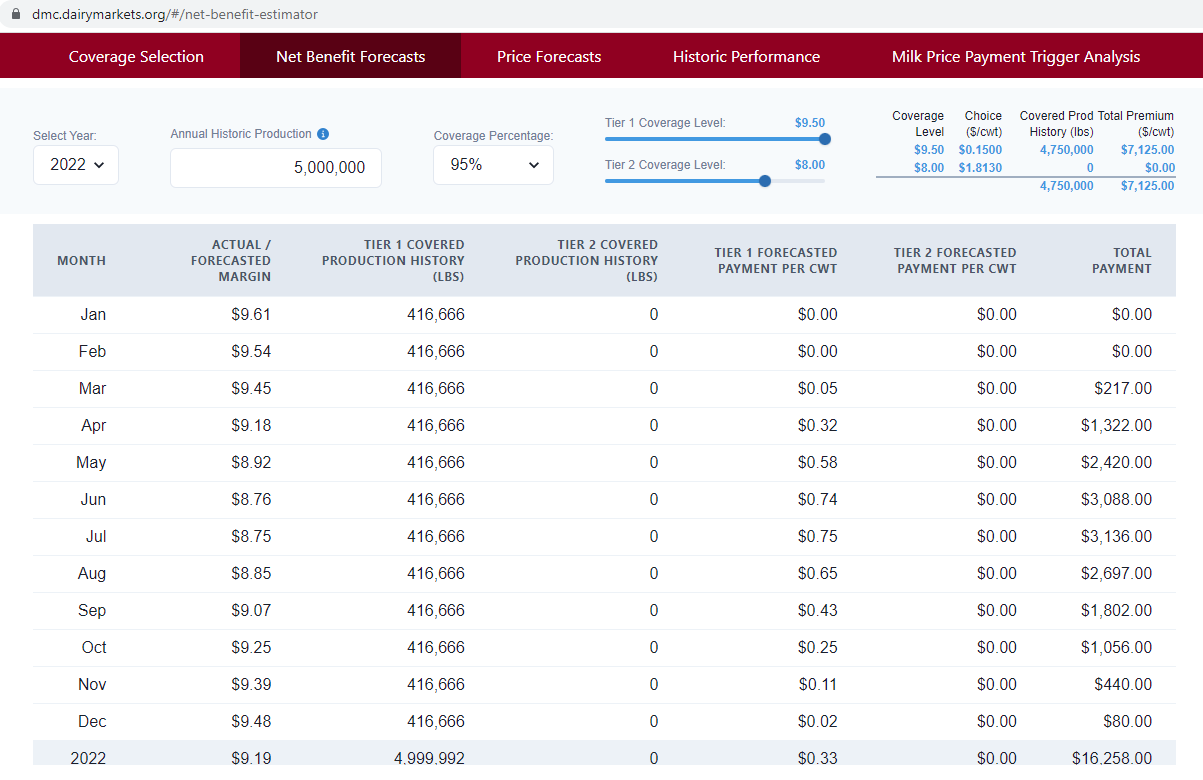
Herds of all sizes can cover their first 5 million pounds at the tier-one rate of 15 cents per cwt., which comes out to $7,125 premium cost for the year. As of December 30, 2021, with both milk prices and feed costs trending higher, the net benefit is forecast at over $16,000 on the first 5 million pounds of production history. In 2021, the 10-month average payout, so far, across herd sizes is almost $60,000. Find the net benefit forecaster in the online DMC decision tool here and be sure to select the year you are looking at in the upper left hand corner.
A screenshot of the USDA FSA Dairy Margin Coverage (DMC) online decision tool at https://dmc.dairymarkets.org/#/ Other information about DMC can be found at https://www.fsa.usda.gov/programs-and-services/dairy-margin-coverage-program/index Feb. 18, 2022 is the deadline to update retroactive production history and to enroll coverages for 2022. Be sure to update production history with FSA using your 2019 final milk check statement before enrolling for 2022 DMC coverage
NEW HOLLAND, Pa. — “Milk pricing is backward, but look forward, and focus on components,” said Dr. Normand St-Pierre of Perdue Agribusiness speaking at Homestead Nutrition’s December Dairy Seminar in New Holland, Pennsylvania, where 200 dairy farmers heard from experts about the markets and the all-important goals of modifying milk price by improving components, and improving the milk margin by feeding healthy cows.
St-Pierre urged producers to be smart as they look at their costs — to not cut costs that sacrifice early lactation milk yield. He also pointed out how these higher prices for all components make feeding for components a continued area of focus to help the dairy in the face of milk check deductions related to cuts in base allotments and balancing.
Earlier in the program, Dr. Mike Van Amburgh shared Cornell University research on how to feed cows in a way that optimizes component yield by percentage, not just in total volume pounds. Total component pounds have historically been a function of total milk volume, but today, percentage counts because of per-hundredweight milk check deductions and over-base penalties.
“Milk volume is being discouraged in many regions of the country,” said Van Amburgh. “So the opportunity for producers here is to enhance their milk components, to make components a primary strategy, while still making your milk volume.”
St-Pierre noted that the next six months will be better than the last six months with a better milk price, and the futures markets certainly confirm this — moving even higher over the past four weeks. Global milk production is down 1% year-to-date, global skim milk powder stocks are low, butter production has been down for three months, stocks are low, and the world is getting short on butterfat, he said.
He observed that the Class III price was averaging over $19 and Class IV over $20 looking out six to 12 months in the futures markets. (That was the case on December 8, and now Class III is averaging over $20 and Class IV over $21.)
He sees the milk check butterfat price averaging $2.30 over the next six months; however, he said he believes this average could actually go higher, while protein should average $2.80.
Another positive he mentioned is the ‘solids nonfat’ are being priced higher, and the ‘other solids’ are priced at almost double the historical average, driven by robust whey sales.
Even the USDA World Supply and Demand Estimates (WASDE) report the day after this meeting (Dec. 9, 2021) revised forecasts higher for butter, cheese and whey with NFDM forecasted at steady prices in 2022. As pointed out by St-Pierre, the current trends suggest this report could revise upward again in January, although much hinges on consumer responses to inflationary pressure in their buying habits.
The 2021 All Milk price average was increased in the WASDE report to $18.60, buoyed by yearend strength, and the 2022 All-Milk price forecast was revised upward to $20.75.
If current futures market levels are realized, these higher trending milk prices should help dairies keep pace with rising input costs, although experts calculate feed costs to be up by around $2.50/cwt for 2022 vs. 2021 and all costs combined could be up by almost $3.50/cwt for 2022 vs. 2021.
St-Pierre dug into this from a milk pricing standpoint, and he shared the good news that negative producer price differentials (PPD) from 2020 and the first half of 2021 have “quieted down.”
Negative PPDs eat into location adjustments and change the way components are ultimately valued when massive de-pooling of milk occurs in Federal Milk Marketing Orders.
“We have positive PPDs right now because Class III and IV are trading closer together,” he said, noting that the new Class I formula averages the two manufacturing classes and adds 74 cents, so when they trade farther apart, the producer sees the hit in Class I also, dragging down the blend price and leaving smaller or negative producer price differentials (PPD).
The Class I pricing change and negative PPDs are issues St-Pierre has written about.
“Now they are asking the people who made the mess to fix it. That escapes me,” he said, noting the Federal Milk Marketing Orders (FMMO) were created in the 1930s and designed at a time when there were hundreds of cooperatives and milk did not move all over the country and the world.
St-Pierre said FMMOs exist for “orderly marketing,” but the government made a ‘fix’ that is like fixing an old horse. “He’s fixed but not running very fast and may be at the point where the horse has had enough.”
FMMOs were also created at a time when people drank more milk. Today, he said, they eat more cheese.
Showing a graph of per-capita fluid milk sales from 1980 (234 pounds per capita annually) to 2018 (146 pounds per capita annually), St-Pierre asked: “Does that look to you like an area of growth? If that marketer worked for Coca-Cola, he would have long been unemployed.”
While he acknowledged fluid milk has been disadvantaged by “lazy marketing,” he also said promoting milk is very hard because “we are not in the same world as in 1980. We are competing against water — with food in a bottle that we have to keep refrigerated. Cheese is easier to sell.”
The per-capita rise in cheese consumption since 1980 reflects this.
In the past, said St-Pierre, the FMMOs were designed to put the highest price in the bottle because that was the most perishable product. Today, as for the past 20 years, the prices are still based on the surveys of four products at wholesale – cheddar, butter, nonfat dry milk, and whey.
It was designed to have those prices for Classes 1 through 4 go in that order, he explained. “But it doesn’t work that way anymore.”
“As the butter price goes up, just make more butter, right?” he asks. “But it’s hard to make butter in a cheese plant and vice versa.”
“If I’m a processor, and I built a big cheese plant, and it cost me $150 million, I make a lot of cheese,” St-Pierre quipped.
Plus the built-in make allowances encourage single-product, single-class production plants running at full capacity, regardless of what the market is doing.
“It will take a while to change that dynamic,” he said.
“All milk is paid on components, but handlers don’t pay for components in the same way in the (FMMO) pool,” said St-Pierre. He explained that milk handlers pay for components according to how the milk is used, what “class” of products the milk was utilized in.
Class I price is based on butterfat and skim, Class II on butterfat and nonfat solids. Class III, which is 55% of the milk utilization, pays mainly on protein and other solids with an adjustment for butterfat because cheese production also uses a lot of fat. Class IV pays on butterfat and nonfat solids.
“We price things backward. Tell me one thing that you can go out and buy and drive out of the store and a month later tell that store what you will pay for it,” St-Pierre said, noting this is essentially what milk buyers do through the FMMO system, month after month, year after year.
He encouraged producers to be looking ahead three months, which he admitted is hard to do when the pricing for their product is so far behind the transaction. Still, he said following the markets gives a good indication, and there is more reliability in the 3-month window than 6 to 12 months out in the futures markets.
The Class III price is normally higher than Class IV, but for the next few months, even through the next year, it looks to be flip-flopped.
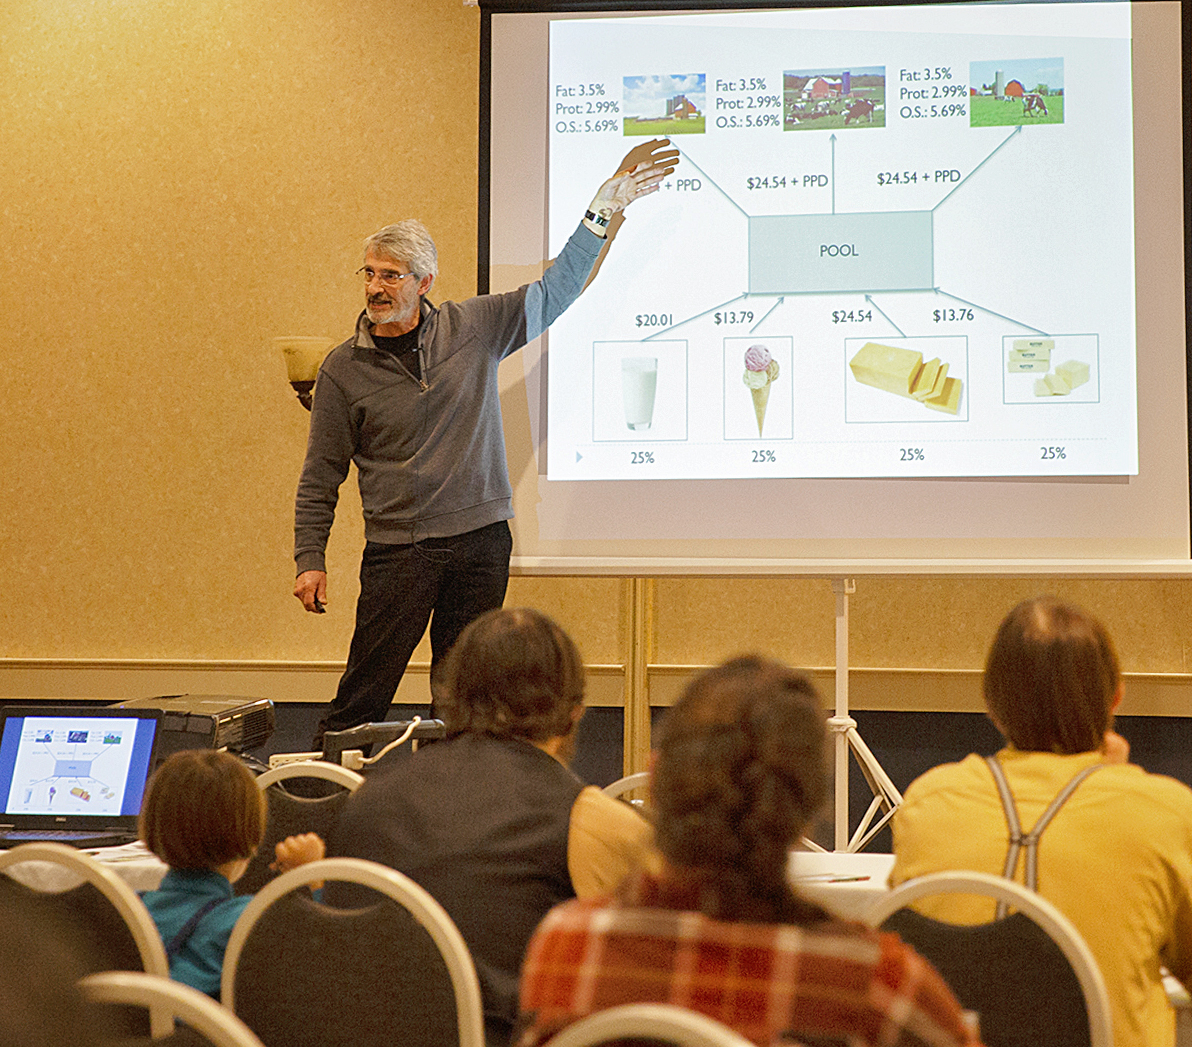
Using an ‘imaginary’ FMMO, he divided all four classes as 25% utilization, which in reality is not too far off what the Northeast Order can come close to. In that four-class FMMO, the different ways different classes pay for components cause the books to be out of balance after producers are paid their advance check based on protein. Knowing each class pays differently, the class price differences and utilization become the key to how that PPD is either positive, flat or negative.
When Class IV was $6 below Class III, cooperatives and processors de-pooled a lot of milk, St-Pierre observed: “They could just pay 20 cents over that $13.80 price to get the milk and then sell it back at the $20 (Class III) price. That makes the co-op look good but the producer gets shafted,” said St-Pierre.
In FMMO 30, where most of the utilization is already Class III, processors made a lot of cheese in 2020-21, but they didn’t pool a lot of that milk, and they got it cheaper, he explained.
Bottom line, said St-Pierre, the Federal Orders were never designed to operate this way. Then along came the “little change” in the Class I price. In the past, the FMMOs used the ‘higher of’ Class III or IV as the way to set the Class I base.
“If I am a bottler, I don’t like that (higher of) because I don’t know how to hedge it,” said St-Pierre. “I know my price ahead of time anyway (through advance Class I pricing), but I still don’t like the ‘higher of’ so I go and tell Congress to average it and add 74 cents. Then Covid-19 hits, and producers lose over $750 million.”
St-Pierre notes that the industry is trying to fix the system, backwards.
He confirmed that where the negative PPDs kick Northeast producers is in the location adjustments. A smaller than normal positive PPD is a loss, and when it goes negative, it eats into the location adjustment, which is also supposed to be positive.
Working through all of these thoughts about pricing and consumption pattern, St-Pierre left dairy farmers with the good news that for the foreseeable future, the PPDs should be positive, although smaller than normal in some months, and Class III and IV prices are both on the rise.
Production has slowed, and demand is good, including for milk powders and whey. These positive supply and demand factors are confirmed in the dairy product production and cold storage reports.
With the very reasonable expectation of good prices for milk components, in the face of base penalties, balancing assessments, and other milk check deductions that a dairy producer encounters, the best way to navigate is focusing on component yield because the deductions are a flat amount per hundredweight of total volume, whereas component yield becomes a percentage increase in the value of those milk hundredweights.
Look for more on other interesting nutrition topics and milk quality award winners as this article continues in a future Farmshine.
Updated Market Moos, by Sherry Bunting, a weekly feature in Farmshine
2022 Class III futures avg. $20.10, Class IV $21.10
Milk futures surged to levels not seen since 2014 this week on the heels of previous weeks’ gains, and the Class III milk futures contracts for 2022 now average over $20 with Class IV over $21 as of Dec. 29, 2021.
Class III milk futures first broke into the $20s last week, hitting new contract highs daily since Wed., Dec. 22 on all 2022 contracts. The closeup contracts for Dec. 2021 and Jan. 2022 were flat in pre-Christmas trading, but see-sawed toward gains in post-Christmas trading.
On the milk futures close Wed., Dec. 29, Class III contracts for the next 12 months (Dec. 2021 – Nov. 2022) averaged $20.01, up $1.35 from a month ago, with January through October 2022 contracts all at or above $20.00.
Class IV futures broke the $21 mark for the Feb. 2022 contract last week, and then continued marching higher after Christmas with January through October 2022 contracts all at or above $21. At the close of trade Wed., Dec. 29, the next 12 months (Dec. 2021 through Nov. 2022) averaged $21.05, which is $1.89 higher than a month ago.
Excluding the lower and expiring current month contract, the 12-month average of 2022 futures contracts averaged at $20.10 for Class III and $21.10 for Class IV.
Class IV continues to dominate the board, and the average spread between the two widened to $1.00 this week with December’s contract pegged at a Class IV over III differential of $1.45; January’s $1.29.
Butter’s impressive gains lead the spot-market
Butter is leading the charge as CME spot dairy products moved mostly higher in pre- and post-Christmas trade. Cheese prices had weakened in pre-holiday trade while butter, nonfat dry milk and whey all made solid or impressive gains. In the post-Christmas spot calls, impressive gains were made on both cheese and butter while whey held firm and milk powder weakened.
On Class III dairy product spot markets at the CME Wed., Dec. 29, the 40 lb block Cheddar price was pegged at $1.95/lb — recovering all of the pre-holiday loss and then some. A single load traded at $1.94 and a spot bid to purchase at $1.95 was left on the table by sellers. Barrels have seesawed almost daily but moved decidedly higher on a nickel upswing Wed., Dec. 29, when 500-lb barrel Cheddar was pegged at $1.69/lb and 5 loads changed hands.
Dry whey gained 6 cents last week and held firm at that 75-cent level Dec. 27, 28 and 29, although zero product changed hands.
In the Class IV products, the spot butter market was very active, and the spot price was pegged at $2.43/lb on Wed., Dec. 29, up a whopping 24 cents from the previous Wednesday and 33 cents higher than two weeks ago. On Mon., Dec. 27, a whopping 10 loads of butter traded with the price pegged at $2.30. On Tues., Dec. 28, another big round of 12 loads traded with the price pegged at $2.40/lb. Then on Wed., Dec. 29, another rally resulted in 3 loads trading with the spot price reaching $2.43/lb with sellers on the sidelines holding their offers at $2.45.
Grade A nonfat dry milk had added a penny last week but lost two pennies this week. On Wed., Dec. 29, the NFDM spot price was pegged at $1.6475/lb with 5 loads changing hands.
November milk production fell 0.4% vs. year ago amid increasingly obvious geographic patterns
U.S. milk production was 0.4% lower than a year ago in November, but for the major milk states, the decline was 0.1%.
Cow numbers dropped 10,000 head nationally in the month of November, alone. Almost one-third of them (3000 head) left the count in Pennsylvania between October and November. Compared with a year ago, cow numbers across the U.S. were down 47,000 head.
In Pennsylvania, cow numbers at 472,000 head were down 10,000 vs. year ago with production off 3.5%. Elsewhere in the Northeast milkshed, New York’s production was down 0.2%, but cow numbers were up 2000 head. In Vermont, milk production fell 1.4% while cow numbers were stable compared with a year ago.
(Producers in Pennsylvania and through most of the Northeast and Midatlantic region report continued penalties on overbase milk, continuance of the 12% cuts in Northeast/Midatlantic producer base allotments instituted by the largest national footprint cooperative during the height of the pandemic. This, despite USDA Dairy Market News reports confirming very tight milk and cream supplies in the eastern markets, and increasing evidence of store shortages based on consumers facebooking their photos of empty dairy and milk shelves at prominent regional supermarket chains throughout the Northeast and Midatlantic states. The recent revelation that the iconic Readington Farms in New Jersey — that supplies ShopRites and other stores in the Wakefern Foods retail group throughout New England, New York, Pennsylvania and the Delmarva — will begin procuring milk for these stores from former Dean plants now owned by Dairy Farmers of America (DFA) also sent shockwaves throughout the Northeast last week)
In the Southeast, Florida dropped 6000 cows with production down 3.4% from a year ago. Georgia gained 1000 cows and 1.4% in production.
In the Mideast region, Ohio, Indiana and Michigan collectively lost 14.000 cows and were down 1.6% in milk vs. year ago.
Growth in the Central Plains continued. States that gained both cows and production vs. year ago include South Dakota, up 22,000 head and 16.7% in milk; Minnesota up 6000 cows and 1.9% in milk; Iowa up 6000 cows and 2.7% in milk; Wisconsin up 18,000 cows and 2.2% in milk; and Texas up 17,000 cows and 2.8% in milk.
California produced 1% more milk than a year ago but lost 1000 cows.
January Class I mover $19.71, Class IV pricing factor tops Class III by $1.48 per cwt.
The Class I mover for January 2022 was announced Dec. 22 at $19.71. That’s 54 cents higher than December’s mover and $4.57 higher than January a year ago.
By the hair of its chinny-chin-chin, the January Class I base price is identical under the new formula as it would have been under the old. Based on USDA AMS prices for cheddar, butter, nonfat dry milk and whey in the first two weeks of December, the January 2022 Class IV advance pricing factor was calculated by USDA to be 12.21 while Class III figured at $10.73.
Averaging the two advance pricing factors together and adding 74 cents is how we get to that $19.71 Class advance base price for January 2022 — under the new Class I formula. This is also the price it would be using the previous ‘higher of’ Class I formula because the $1.48 spread between the Class III and Class IV advance pricing factors (74 cents x 2) is the magic number that keeps the new method from calculating a Class I base price that is lower under the new method than it would have been under the old method. Any wider than $1.48, and the difference becomes negative.
Class IV is projected to be higher than Class III throughout 2022, if the current futures markets and market fundamentals hold out. This means the ideas circulating to change the Class I formula to a Class III-plus would be negative over the duration of time that Class IV beats Class III.
In volatile markets, where the dairy industry is vulnerable to market shocks, the use of the ‘higher of’ formula for Class I did help prevent further disparities that lead to de-pooling and negative PPDs, which affect not only producer milk checks but also their risk management.
Secretary Vilsack says bring me consensus, first
Last week during a farm visit in Wisconsin, Secretary of Agriculture Tom Vilsack told dairy producers he wants to see the dairy industry come together with a consensus on Federal Milk Marketing Order changes before holding USDA hearings.
Three weeks ago, Senators Kirsten Gillibrand (D-NY), Patrick Leahy (D-Vt.) and Susan Collins (R-Me) introduced the Dairy Pricing Opportunity Act of 2021, a bipartisan bill in the U.S. Senate that would direct the Secretary of Agriculture to provide notice of, and initiate, national hearings to review Federal milk marketing orders … “which shall include review and consideration of views and proposals of producers and the dairy industry on the Class I skim milk price, including the ‘‘higher of’’ Class I skim milk formula…”
In the past, whenever USDA has initiated administrative hearings to make specific FMMO changes, a consensus was typically sought before such hearings.
On the other hand, if the Senate bill becomes law, a more open process appears to be described that could make national hearings a review of the system, consideration of proposals, and specifically a look at the Class I formula change, which had been made legislatively without hearings, comment or a producer referendum in the 2018 Farm Bill.
Perhaps national FMMO hearings could open a consensus-building process.
PMVAP payments delayed
The Pandemic Market Volatility Assistance Program (PMVAP) payments related to the Class I formula losses from July through December 2020 will be delayed until late January or into February or March, according to Erin Taylor, USDA AMS. She told dairy farmers in a Dairy Industry Call hosted by the Center for Dairy Excellence this week that eligible producers should have been contacted by their milk cooperative or handler by now requesting proof they meet the Adjusted Gross Income limits of USDA payment programs.
USDA is in the process of finalizing agreements with each eligible handler that had any milk pooled on any FMMO during that time period and is providing workbooks with methodology on how the payments should be made to their producers based on how they were paid during the July-Dec 2020 period. Look for more information in the Jan. 7 edition of Farmshine and click here.
Whole Milk for Healthy Kids Update
There are 84 Congressional cosponsors from 30 states (including the prime sponsor, G.T. Thompson of Pennsylvania) who are now supporting the Whole Milk for Healthy Kids Act, H.R. 1861. However, for those readers who live in the New England states as well as Maryland, Delaware, South Carolina, West Virginia and several western states, representation is absent.
To-date, there are no cosponsors yet from the following states: Colorado, Connecticut, Delaware, Hawaii, Maine, Maryland, Massachusetts, Montana, Nevada, New Hampshire, New Mexico, North Dakota, Oklahoma, Oregon, Rhode Island, South Carolina, Utah, Vermont, West Virginia, and Wyoming.
This bipartisan bill was introduced in March by Congressmen G.T. Thompson (R-PA) and Antonio Delgado (D-NY), to end the federal prohibition of whole milk in schools. It gained 18 new cosponsors over the past two weeks to reach 84 from 30 states, but needs at least 100 cosponsors representing all 50 states to get moving in committee toward the goal line.
Consider contacting your Representative with thanks or a request to cosponsor this bill that simply allows school children the healthy milk choice they love and will drink. To find your Representative, enter your address at https://www.govtrack.us/congress/members