Covering Ag since 1981. The faces, places, markets and issues of dairy and livestock production. Hard-hitting topics, market updates and inspirational stories from the notebook of a veteran ag journalist. Contributing reporter for Farmshine since 1987; Editor of former Livestock Reporter 1981-1998; Before that I milked cows. @Agmoos on Twitter, @AgmoosInsight on FB #MilkMarketMoos
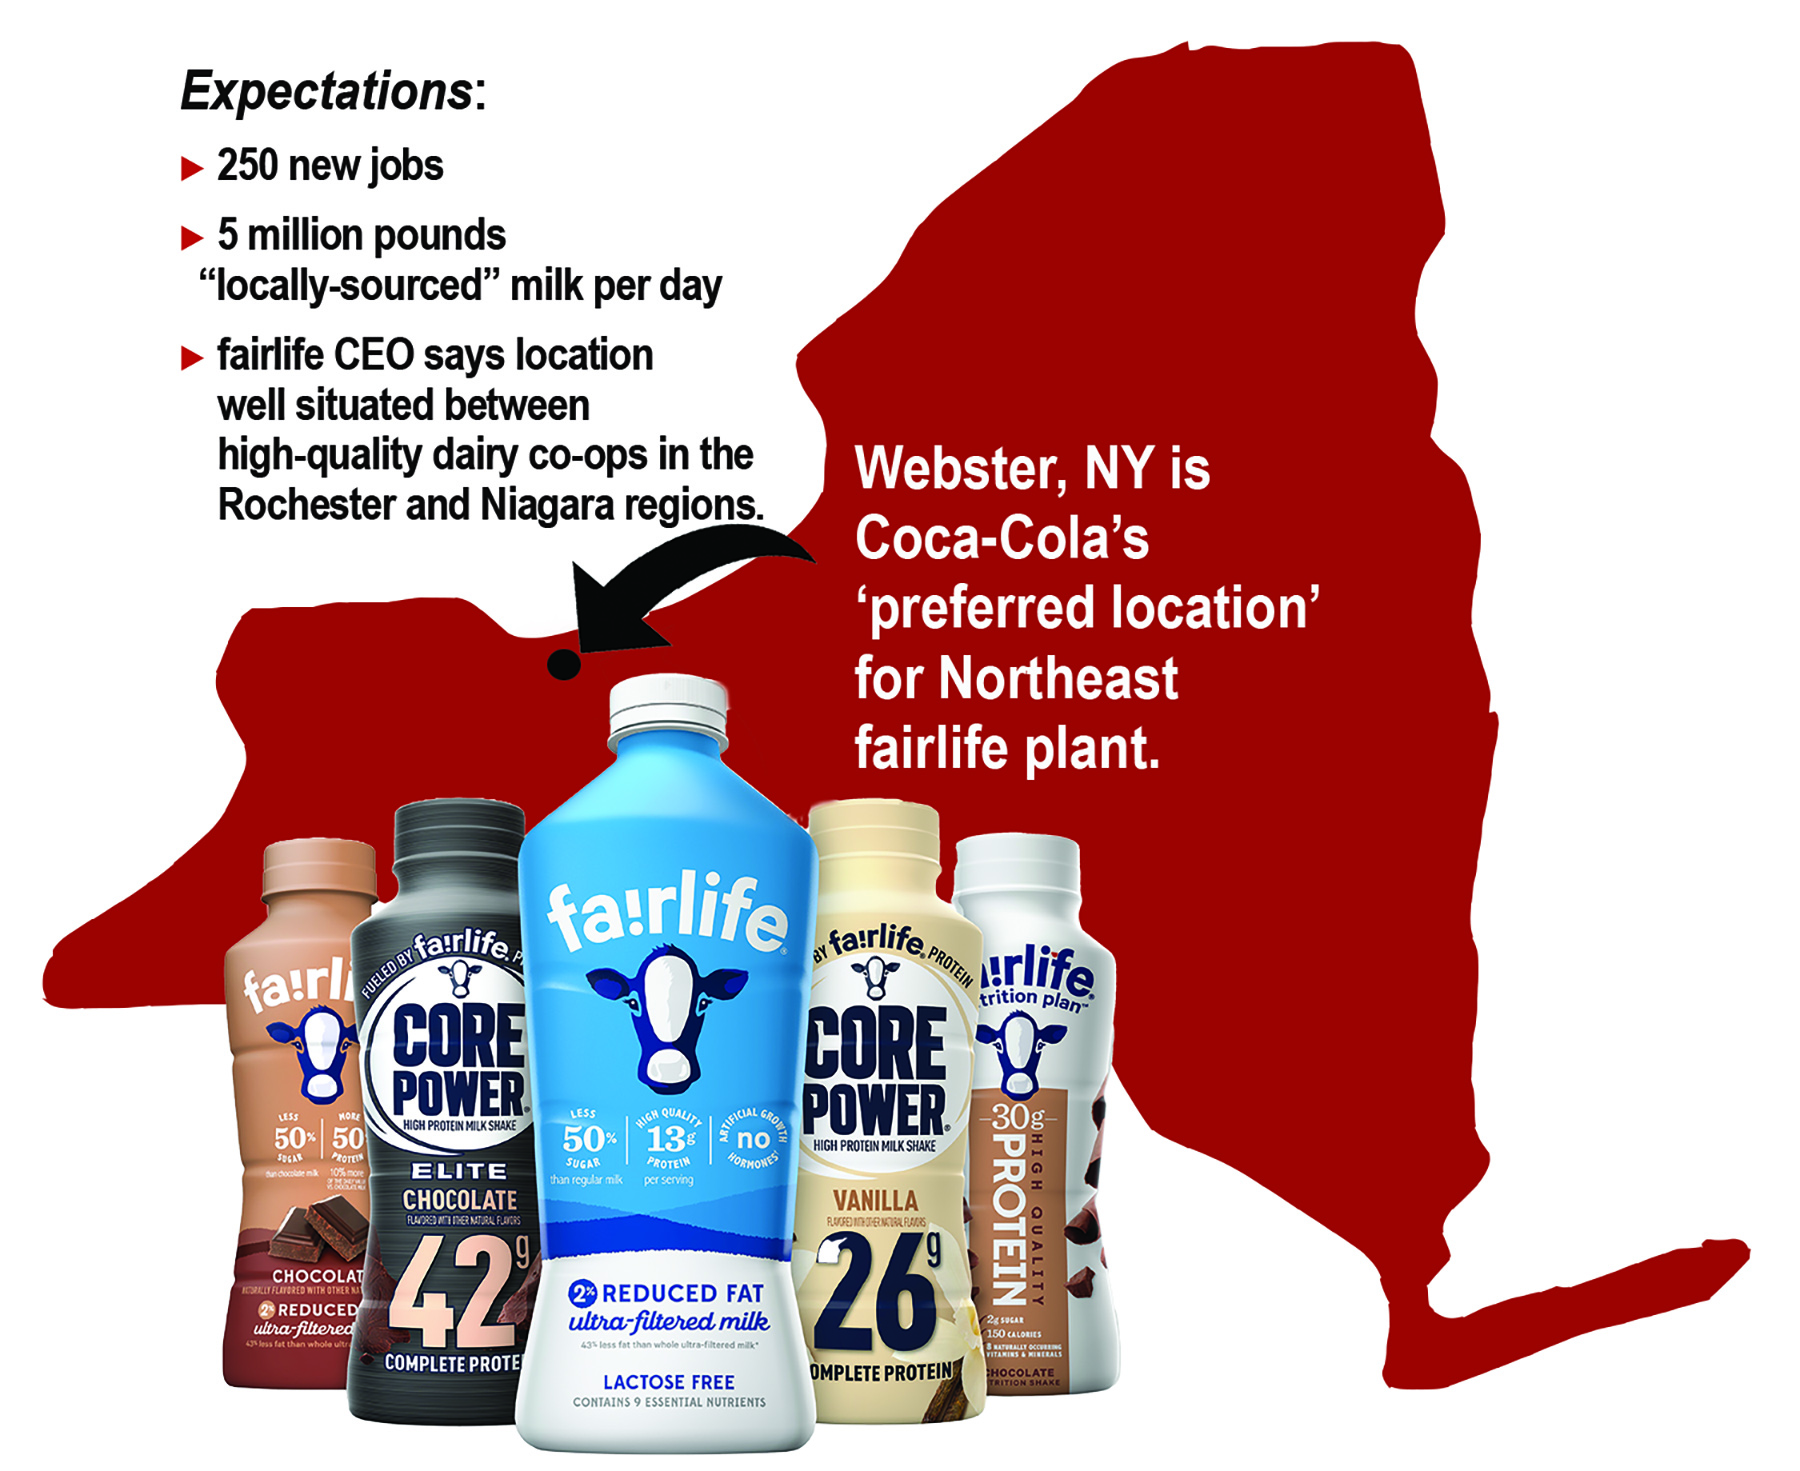
Officials say it will be Northeast’s largest milk plant, using 5 million pounds of ‘locally sourced’ milk per day
By Sherry Bunting, published in Farmshine, May 12, 2023
WEBSTER, N.Y. – New York got the nod this week as the “preferred location” where The Coca-Cola Company will build its new fairlife ultrafiltered milk processing plant in the Northeast.
New York State Governor Kathy Hochul made the announcement Tuesday (May 9) that the company selected a site in Webster, Monroe County, New York for the $650 million project, expected to break ground this fall and be operational by the fourth quarter of 2025, pending final due diligence and appropriate approvals.
The 745,000 square-foot facility is expected to create up to 250 new jobs and “utilize an estimated 5 million pounds of locally sourced milk per day, making it the largest dairy plant in the Northeast,” the NYS Governor’s announcement stated.
Founded in 2012 through a “strategic partnership” between Select Milk Producers cooperative and Coca-Cola, with early grants from Dairy Management Inc (checkoff), fairlife is now wholly-owned by Coca-Cola since 2020.
Calling the fairlife project a “major opportunity for New York,” Gov. Hochul said it will “drive economic impact, particularly in the Finger Lakes,” and it will “position New York to regain its spot as the 3rd largest producer of milk in the U.S.”
“The Town of Webster is well situated between high-quality dairy cooperatives in the Rochester and Niagara regions, with a surrounding workforce that has the relevant manufacturing and food and beverage experience, making it the ideal location for fairlife’s expansion,” said fairlife CEO Tim Doelman in a statement at the company’s website.
He noted the new facility will allow the company to “significantly increase capacity and deliver fairlife to more households.”
Empire State Development (ESD) is providing up to $21 million in assistance for the fairlife project through the performance-based Excelsior Jobs Tax Credit Program in exchange for the job creation commitments.
Monroe County Industrial Development Authority (IDA) is expected to apply to the ESD for a separate $20 million Capital Grant, to provide adequate power and infrastructure services to the site. Also collaborating on the project are the Town of Webster, Rochester Gas and Electric and Greater Rochester Enterprise, and NYS Ag and Markets.
ESD Commissioner Hope Knight highlighted Upstate New York’s farm and dairy infrastructure, and Assemblyman Brian Manktelow observed the increased demand for local dairy production and transportation would be additional economic benefits on top of the creation of in-facility jobs.
NYS Ag Commissioner Richard Ball said the decision “highlights the excellence of our dairy community whose farmers will be supplying the milk.”
New York Farm Bureau president David Fisher, a dairy farmer, said the news “is needed for the long-term success of our dairy farms.” He noted the state has 3500 dairy farms, milking 620,000 cows and producing over 15 billion pounds of milk annually with “abundant resources, good land, access to water, and innovative farmers.”
“We were in tough competition with other states,” said New York Gov. Hochul, noting her own heritage coming from a family of dairy farmers in Ireland.
One of the states competing for selection was Pennsylvania.
“While the outcome of this selection is not what we hoped, the Shapiro Administration remains strongly committed to supporting Pennsylvania’s dairy industry and attracting processors to grow here,” said Pennsylvania Ag Secretary Russell Redding in an email response to Farmshine questions Wednesday (May 10).
Redding noted that Gov. Shapiro and teams across agencies were engaged in this project “allowing us to meet fairlife’s criteria for tax climate, resources, utilities, permitting, and incentives.” He reported that Pennsylvania currently makes $15 million in tax credits available annually for dairy manufacturing companies to expand processing in the Commonwealth.
“Just as we were nationally competitive for this project, we plan to be in the running for other selections of this type,” Redding added, thanking all industry and government entities who work on these coordinated efforts to welcome businesses and support agriculture.
When asked specifically about the whether or not Pennsylvania’s state-mandated Class I fluid milk over-order premium (OOP) played any role in the outcome, Redding stated: “The OOP was not a factor.”
The fairlife line includes Class I fluid milk products as well as dairy beverages that fall outside of the Class I criteria into manufacturing milk classes. The company offers a range of products including fairlife ultrafiltered milk, Core Power protein shakes, and fairlife Nutrition Planmeal replacement shakes.
The fairlife products are made through an ultrafiltration process that removes lactose and condenses other solids to raise the protein content while lowering the natural sugar (lactose) content. For flavored beverages, this means more sugar and other sweeteners can be added because the natural sugar content is lower.
According to the New York Governor’s press announcement, this ultrafiltration process “gives milk a longer shelf life.”
All fairlife products carry the UHT mark for ultra high temperature pasteurization, which also increases shelf-life. Some of the flavored fairlife products, such as YUP and CorePower are already offered as shelf-stable beverages in supermarkets and online, so it is unclear whether aseptic packaging will extend to all fairlife milk and beverage products in the future.
Other leaders from the collaborating New York State agencies and organizations highlighted the project expands their goal of positioning New York as a hub for attracting technology and innovation in food and beverage manufacturing.
In fact, the Governor’s press announcement stated that, “The research for fairlife’s branded milk process (ultrafiltration) originated at Cornell University over a decade ago.”
However, the story told by fairlife co-founders Mike and Sue McCloskey, as recently as the 2020 Pennsylvania Dairy Summit, and in earlier meetings, presentations, and published interviews, is that they discovered the reverse osmosis and membrane filtration process when dealing with a well issue on their former dairy in New Mexico.
After seeing what this filtration did for separating minerals in the water to make it more palatable to the cows, they started tinkering with filtration for milk, the story goes.
Select Milk Producers (SMP), also founded by the McCloskeys, then began using reverse osmosis and ultrafiltration as early as 1995 to reduce the water when moving loads of milk to cheese plants. At the same time, they began their high protein, low sugar milk proposition by partnering first with H-E-B supermarkets across the Southwest under the Mootopia brand in 1996 – a precursor to what is fairlife today.
She said this means that the raw milk going into the ultrafiltration process must be very low in somatic cell counts because the process separates some solids, like lactose, while concentrating other solids.
Products in the fairlife line are currently made at the original SMP ultrafiltration plants in Dexter, New Mexico and Coopersville, Michigan. Newer plants opened in Goodyear, Arizona in 2021 and Petersborough, Ontatio, Canada in late 2020. The latter sources all of its milk from Canadian farms for the Canadian consumer market.
Ultrafiltration is employed by other dairy companies, such as Cayuga Milk Ingredients (CMI) using proprietary European technology to produce unique liquid and dry milk and dairy ingredients for sale in the U.S. and internationally.
Also located in the Finger Lakes Region of New York in the town of Auburn, CMI announced its own expansion last year to break ground this spring on a second facility that will have aseptic packaging capabilities for manufacturing a range of shelf-stable fluid milk, filtered milk, and dairy-based beverage products.
By Sherry Bunting, published in Farmshine, May 5, 2023
The purpose of Pennsylvania’s 1930s Milk Marketing Law was to regulate and support the Commonwealth’s dairy industry. Today, it continues to set a retail minimum price for milk through the Pennsylvania Milk Marketing Board (PMMB) while most other states have zero protection against supermarkets using milk as a loss-leader to attract shoppers.
To me, that’s the real problem. Nationwide, consumers don’t know or appreciate the true value of milk after years of rampant and extreme loss-leading. I’m not talking about random sales to clear inventory, I’m talking about day-in-day-out well-below-cost prices as a retail business model.
Supermarkets chains have gotten into doing their own milk bottling or refuse to pay for services or quality as a way to avoid eating all of the cost of their own decisions to knock the price of milk back several dollars per gallon. They know milk is in 95% of shopping baskets. It’s a staple. If their store brand is the cheapest around, they’ll get your business and sell other high margin items at the same time.
Dairy farmers and milk bottlers, quite frankly, should not be on the hook for that. Period. But indirectly they are.
At the federal level, no one wants to address this because USDA also benefits when it comes to buying cheap (skimmed) milk for food programs like school lunch, where they also reimburse Impossible not-burger, nacho chips and pop-tarts — but not whole milk, only skimmed.
Is it any wonder consumers balk at spending $5 for a gallon of milk in Pennsylvania but will pay $1.50 for a cup of water, even more for a cup of water with artificial additives?
Is it any wonder consumers don’t think of milk’s nutritional value next to other protein and vitamin drinks? Intrinsically, the higher margin drinks are perceived as more valuable because the price is higher. Milk is perceived as worth less than water!
This makes Pennsylvania a sitting duck in a national, no, a global market. Why? Because Pennsylvania sets a minimum retail and wholesale milk price each month.
Pennsylvania’s Milk Marketing Law prevents supermarkets from selling milk under the monthly announced state-minimum price. The over-order premium (OOP) portion of this price was intended to help Pennsylvania farmers. The Milk Marketing Law already gives the retailers and bottlers a 2.5 to 3.5% profit margin over average industry costs within that set minimum-price buildup.
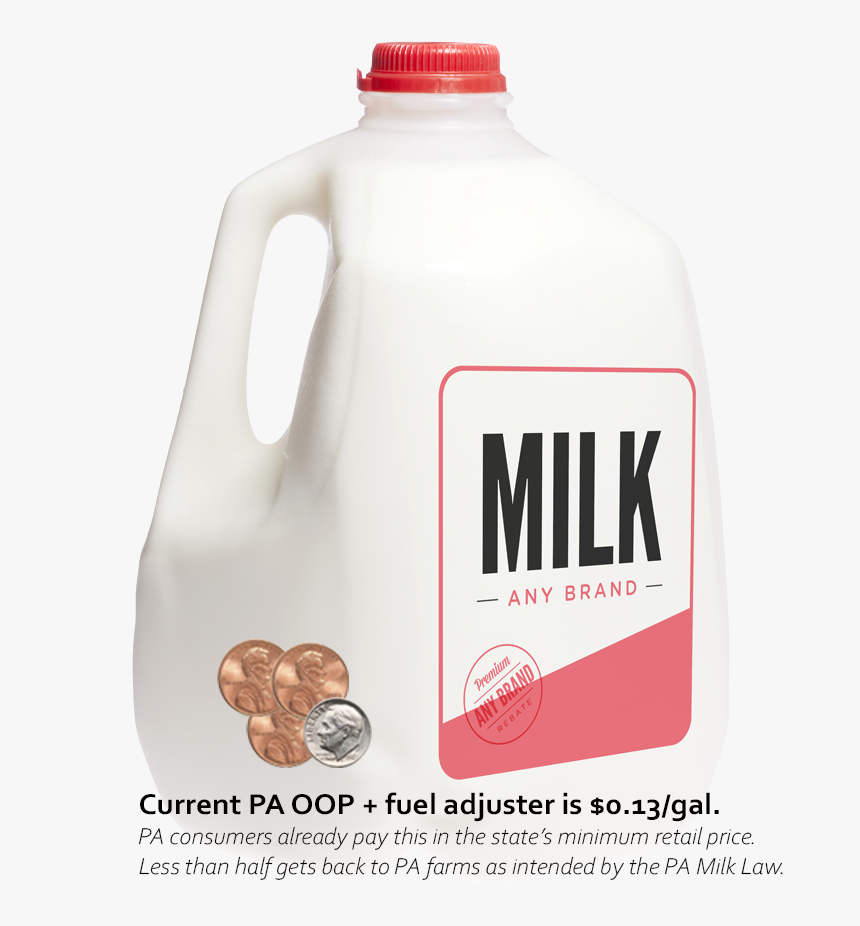
The OOP is currently set by the PMMB at $1.00 per hundred pounds of milk plus a 44-cent per hundredweight fuel adjuster. This come out to 13 cents per gallon paid within the state minimum retail price that is meant to be the farmer’s over-order premium (OOP).
A variety of loopholes have diminished how much of the state-mandated OOP gets back to Pennsylvania dairy farmers as intended by the law. It has encouraged interesting business models that involve more out-of-state milk coming in to displace Pennsylvania milk in some Pennsylvania stores (and some creative accounting for sure).
Whether in tankers or packages, more out-of-state milk is competing with an unfair advantage when the built-in OOP is either collected and not paid to farmers or remains completely undocumented — floating around and up for grabs by the supply chain.
Senate Ag Minority Chair Judy Schwank had an interesting exchange with Chuck Turner of Turner Dairy near Pittsburgh during the recent Senate Ag hearing on the matter. She asked whether or not the aseptically processed, shelf-stable milk, which she buys, has the OOP built into its price.
Good question.
Turner explained that for the members of the Pennsylvania Association of Milk Dealers, the OOP is factored in as a cost that they incur when they procure milk within the state and then return this OOP to their Pennsylvania farmers based on their sales of Class I fluid milk products within the state.
On the other hand, when a Nestle or some other company, like fairlife, makes a shelf-stable flavored milk that ends up in a retail dairy case in Pennsylvania, the OOP doesn’t enter into their thought process on these products coming most likely from Indiana (and New York), he said. To his mind, that means it does not “collect” OOP.
In reality, such out-of-state packaged fluid milk products that fall into the Class I fluid milk category are ‘collecting’ the OOP — even ultrafiltered and aseptically packaged milk. These products compete for Pennsylvania consumer dollars. Whether out-of-state fluid milk products are unflavored or flavored, fresh or shelf-stable, they are part of the unknown number Schwank said the Senate Ag Committee needs to know.
It doesn’t matter if the milk is sold above state-minimum price, the OOP is in there.
Take for example the fresh fluid milk brands that are bottled in Pennsylvania — that are not shelf-stable – but are priced on supermarket shelves above the state minimum retail price.
This happens when stores like Walmart and Costco want to differentiate their private label store brands as the lowest-price. What do they do? They put other brands higher.
Since supermarkets in Pennsylvania cannot go below the state’s minimum price to “loss-lead” with their in-house private label, they bump-up the price on competing name brands instead.
In some cases, this pressures sales volume even lower for name brands that are produced, processed and sold in Pennsylvania, reducing the OOP that goes back to the Pennsylvania farms. At the same time, some of the private-label store brands sold at state-minimum fall into the category of breaking the chain of produced, processed and sold in Pennsylvania, which affords them the ability to keep the farmer’s OOP.
For 15 years grassroots dairy producer groups have been grappling with the concerns shared at the hearing, and how the OOP may be affecting the use of Pennsylvania-produced milk in Pennsylvania consumer markets. The embarrassment of not knowing definitively how much fluid milk is sold in the state and how much premium is stranded off-record or on-record has been the subject of meetings, hearings, estimates, emotion, stonewalling and bickering for over 15 years!
Attempts have been made by lawmakers like former State Senator Mike Brubaker and current State Representative John Lawrence repeatedly putting forward bills that would have penetrated the armor surrounding this issue.
Now, in the past 12 to 18 months, we have the Pennsylvania Farm Bureau on high-alert, the Department of Agriculture now is involved and has come up with a plan.
The CDE and PDMP are studying the issues around the premium and the obstacles to processing investment with the help of a Cornell economist.
And the Senate Ag Chairman and Minority Chair offered their data-driven bills last session and will offer them again, because, of course, they are paralyzed by still needing that data they’ve been needing for 15 years!
Now, as the fluid milk market is in steep decline over the past 15 years (ironically the same 15 years in which whole milk and 2% milk have been federally prohibited as choices in schools and daycares)…
Now as most of the milk bottling assets, nationally, are owned by cooperatives and most of the rest by retailers…
Now as fluid milk plants are closing to the south and the west, while Pennsylvania has managed to hold on to a core of independent bottlers…
Now as the state courts the favor of Coca-Cola / fairlife or other new processors to invest in Pennsylvania … (Coca-Cola announced May 9 that New York will get the new plant).
Now as everyone is sitting up noticing that the tens of millions of Pennsylvania-paid ‘stranded’ OOP annually over the past 15-plus years may have been fueling growth beyond Pennsylvania’s borders while Pennsylvania’s own farms have been stagnated by more stringent supply management programs due to lack of processing capacity…
Here we are, back to the question of needing the data. Senators were interested in doing something, but Chairman Elder Vogel, said threading the needle will be difficult, and Minority Chair Schwank said “we have to have the data.”
Pennsylvania is enduring erosion on one hand in part because of the OOP and/or the minimum pricing, while on the other hand, these structures are believed by some to provide a stabilizing effect for the Class I bottlers that remain.
And so, the cats keep chasing their tails around the milk bowl!
Meanwhile, more producers have strived to get some of their milk outside of this game by selling it raw – an entirely separate market. The PMMB reached out to a number of them last year telling them they had to be licensed and do monthly reports, then backed off a bit for the time being. They are not the problem. Their milk is not pasteurized, and it is not part of the system in Federal Milk Marketing Orders either.
My biggest questions after the recent hearing, after 15 years of following this and for a time helping farmers who were involved in seeking changes more than a decade ago: Where would we be today if in any of the prior legislative bills, meetings, hearings, plans, would have moved forward in some fashion?
And yes, this too is related: Where would we be today if whole milk had not been removed from schools?
One thing is clear on the first question, we would by now have solved the math equation of A + B = C instead of estimating, stonewalling, bickering…
On the second question? We might be selling more milk.
Read Part One and Part Two of the PA Senate Ag Hearing about the ABC’s of the OOP here and here
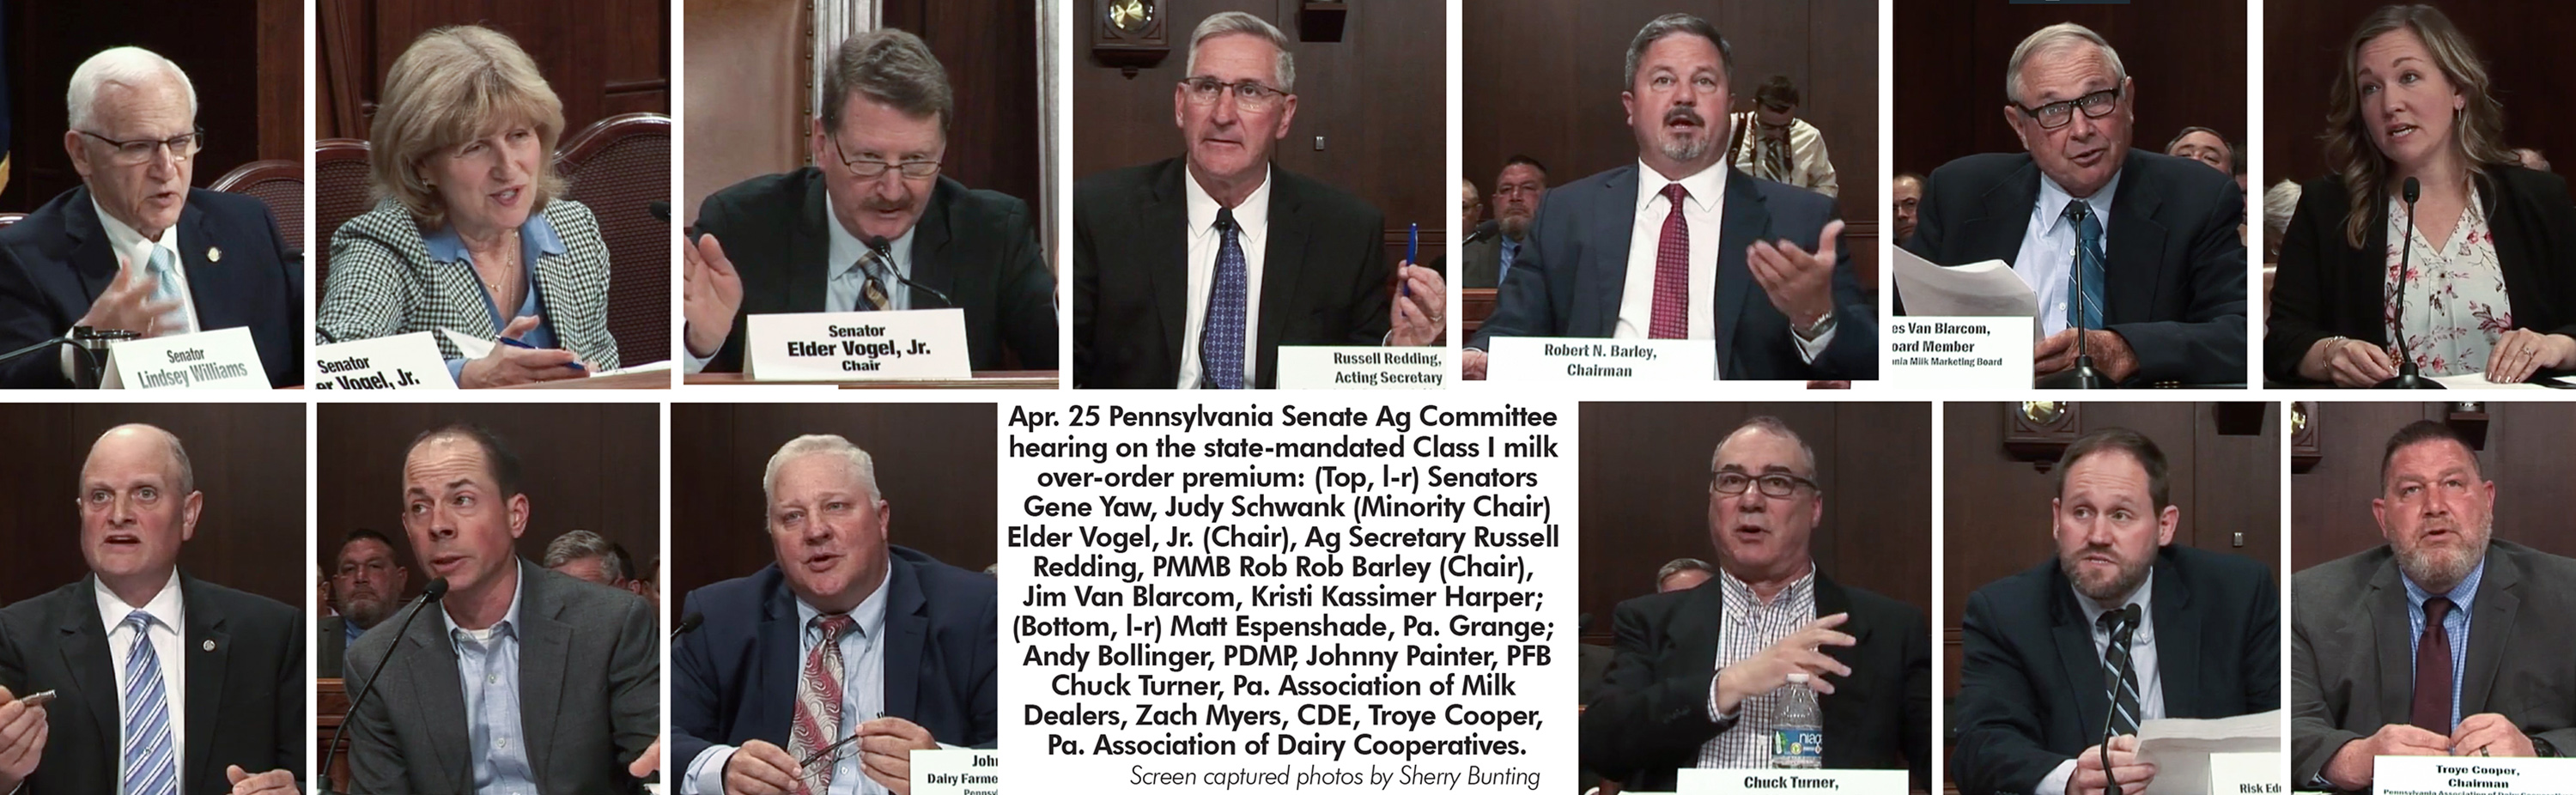
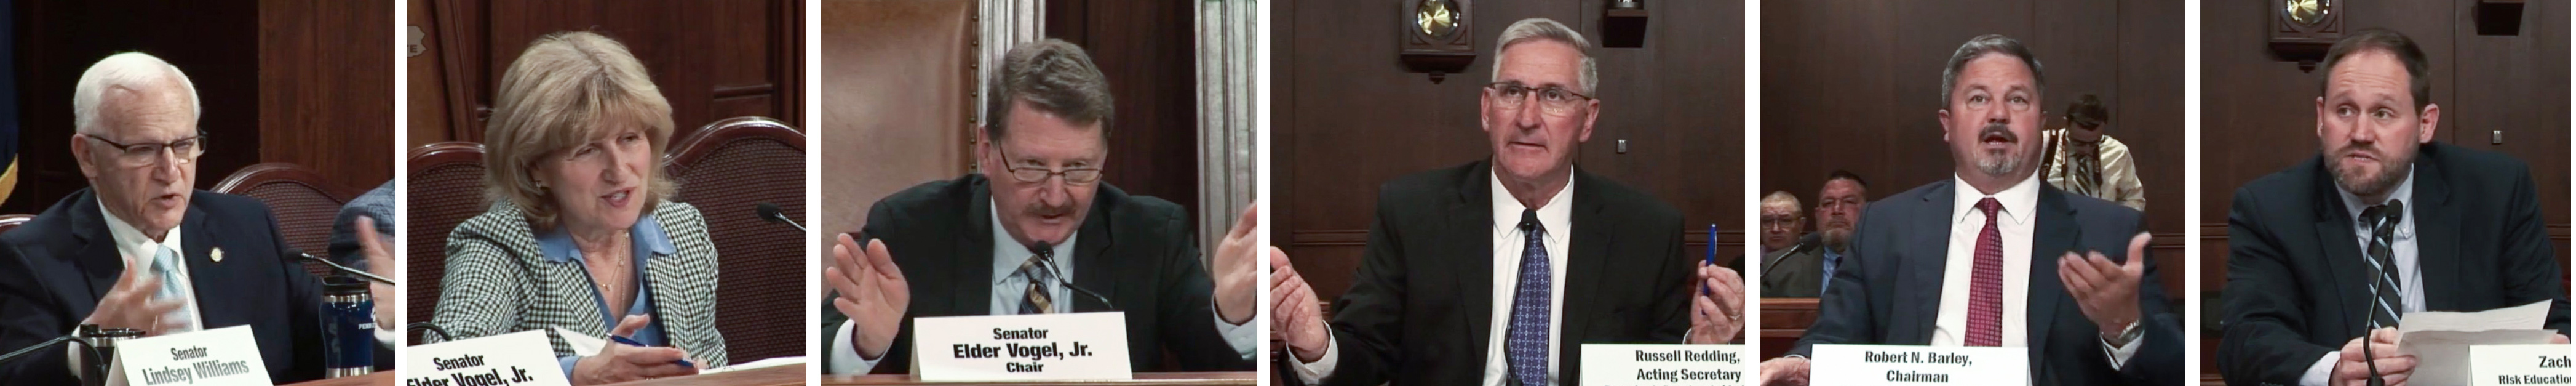
HARRISBURG, Pa. — As reported in Part One, published in Farmshine’s April 28th edition, the Pennsylvania Senate Agriculture Committee held a three-hour hearing on April 25 about the state’s mandated Class I milk over-order premium (OOP), which is part of the state’s minimum milk price per gallon set by the Pennsylvania Milk Marketing Board (PMMB).
Agriculture Secretary Russell Redding offered this equation to describe what is known and unknown about the estimated $30 million or more in annual OOP paid by Pennsylvania consumers: A+B=C.
‘A’ was confirmed by PMMB auditor supervisor Gary Golsovich to be $23.6 million collected by processors in 2022. But, he said, only $14.5 million of this collected OOP was documented as paid to Pennsylvania farms for milk that could demonstrate all three criteria: produced, processed and sold in Pennsylvania.
Golsovich gave an example: A processor sourcing 50% of its milk from Pennsylvania farms with 50% of its sales being consummated in Pennsylvania only has the obligation to pay 25% of the OOP to the Pennsylvania farms. This was something the PMMB tried to change 10 years ago, seeking to require processors to pay up to the percentage of in-state sales that matched in-state sources, but a constitutional interstate commerce challenge in the courts caused the state to back down.
‘B’, said Redding, is the additional $5 to $10 million in OOP that is paid by Pennsylvania consumers but is presently unaccounted for. Examples are packaged milk from out-of-state and other cross-border transactions. Legislation such as Senate Bills 840 and 841 from last session would capture this information, and Senate Ag Chairman Elder Vogel Jr. and Minority Chair Judy Schwank said they intend to re-introduce these bills in the current legislative session.
He estimates the total ‘C’ would be around $30 million, or more, but last year less than half that amount was paid to the intended beneficiaries: Pennsylvania farms.
The only way to fix the leakage, said the Secretary, is to “break the chain,” to remove the OOP from the minimum price and make it a fee collected at retail and remitted to the Department of Revenue into a designated fund. This would also require legislation.
“Pennsylvania has a system that is like no other,” said PMMB Chairman Rob Barley, a farmer in Lancaster and York counties. “The system worked well when people were drinking a lot of milk produced by Pennsylvania dairy producers. That’s changing. The system needs an adjustment.”
When the Senate Ag Chairman pressed the PMMB Chairman for specific ideas, Barley said the Secretary’s proposal, “while not ideal, is probably the only way to do it.”
He mentioned the potential for a tiered or scaled system where smaller farms could receive more and larger farms less, much like the federal Dairy Margin Coverage has a tiered program based on annual milk production history.
“We want to work with the legislature on this — to benefit everyone,” said Barley.
The consumer member of the PMMB board, Kristi Kassimer Harper from Fayette County, noted examples in her area of western Pennsylvania, where the OOP works among a variety of independent bottlers that buy Pennsylvania milk, process it in Pennsylvania and sell most of it in Pennsylvania.
She cited studies by St. Joseph’s University indicating consumers don’t give much thought to where their milk comes from, but a survey of Pennsylvania consumers showed that two-thirds would pay a 10-cent premium if the premium gets back to the farmers. (They are already paying a 13-cent OOP plus fuel adjuster embedded in the milk price, but less than half of it is getting back Pennsylvania farms.)
In his back-and-forth discussion with Vogel, Barley said a formula could be developed that would prioritize producers that are currently serving the Class I fluid milk market, using a graduated scale. This idea turned Chairman Vogel’s head. He said it’s the first time he’s heard this approach mentioned.
Something like this would address the concerns of milk dealers who are currently upholding the spirit of the law and the testimony from the State Grange, urging caution about diluting the meaningful amount of OOP 15 to 20% of Pennsylvania farms currently receive.
“Consumers are already paying this, it’s not a tax, but if we collected it from Pennsylvania retailers as a fee and put it in a restricted fund, we can avoid the constitutional issues with interstate commerce,” said Senator Gene Yaw. “We do this all the time, collect funds and put it toward programs we want to support. In this case, the people are already paying it, and if the money is in one place, we can audit it.”
The “mechanics” of how to distribute it, he said, can be worked out with the Board and the industry. But at the same time, Yaw and other Senators said they want to help more of the state’s farmers access what was intended for them, without harming those already receiving some.
Meanwhile, the Department of Agriculture’s plan mentions ‘uniform distribution,’ as do the policy points endorsed by Pennsylvania Farm Bureau.
PMMB board member Jim Van Blarcom, a farmer from Bradford County, stated that in his nine years on the Board, he has heard the concerns of producers across the state. He noted the geographic and generational diversity of the PMMB Board, and their ability to understand how different parts of the state have different experiences with the OOP.
“The OOP was put in place to help dairymen recoup some costs,” said Van Blarcom, explaining to lawmakers that the Milk Marketing Law already has built into it a 2.5 to 3.5% profit margin for bottlers and retailers. “Since then, the industry has changed, making it outdated and less effective. As a board member, it is getting more difficult to weigh the benefits for the farmers who receive a useful OOP vs. farmers who receive very little to none. When consumers pay a mandated 8 to 12 cents on every gallon of milk sold, this becomes a large sum of money, of which some is unaccounted for.
“During my time on the Board, I have heard over and over about the tanker loads of New York milk coming in and displacing Pennsylvania farmers’ milk. The primary reason these companies do this is they can take advantage of the OOP… We are essentially encouraging this to happen,” he explained.
Recounting testimony at a Board hearing from a dairy farmer milking 90 cows, he said the amount of OOP that farm received wass equivalent to one bag of milk replacer a month.
“I don’t believe one bag of calf feed keeps that farmer in business, but rather his tenacity and commitment to the family farm,” said Van Blarcom.
He also recounted testimony at a Board hearing from Pennsylvania Representative John Lawrence, who cited the accurate accounting on mandated fees for alcohol and fuel.
“This is not happening with the mandated milk OOP. It will continue to become more difficult to defend as a program with funds that are not accurately accounted for and not fairly distributed,” Van Blarcom asserted, adding that consumers will also “become more aware of the unfairness to themselves.”
Meanwhile, when laying out the Department of Agriculture’s plan, the Secretary talked about “a collective investment in PA Dairy,” such as using some of these funds to invest in processing.
Andy Bollinger, a Lancaster County dairy farmer testifying for PDMP said the organization has not taken a position on reforming the OOP because they want to see the facts and the results of a study they are working on with a third-party economist.
Zach Myers from the Center for Dairy Excellence also mentioned a study CDE is involved in to understand the obstacles to processing investment within the state. He cited the impact on farms from supply management programs placed on them based on processing capacity.
“We come to you and ask for investments,” Secretary Redding told lawmakers. “Here’s one that’s already done in the marketplace, and we’re failing to bring those dollars back specifically to reinvest in PA Dairy.”
Data and reform needed, but is Secretary eyeing portion of estimated $30 million-plus for ‘dairy reinvestment’?
By Sherry Bunting, Farmshine, April 27, 2023
HARRISBURG, Pa. – Little bit new, little bit Dé·jà vu. (That’s French for ‘the feeling of having experienced this situation before.’)
Those first thoughts came to mind listening to the Pennsylvania Senate Ag Committee’s hearing Tuesday (April 25) on reforming the state’s mandated over-order premium (OOP) that is part of the state’s minimum wholesale and retail milk prices, set by the Pennsylvania Milk Marketing Board (PMMB).
Ag Secretary Russell Redding laid out for state lawmakers the Department of Agriculture’s plan to seek reforms that: 1) uniformly and fairly distribute the OOP, 2) ensure the amounts charged to Pennsylvania consumers substantially equal amounts distributed back to farmers, and 3) uses a distribution system that does not have incentives to avoid paying Pennsylvania producers by selling milk from across state lines.
He said the Department is a “reluctant participant” but sees the need to make the “collective case” for the “composite of Pennsylvania Dairy.”
“We believe there are inequities, and we see division and growing farmer mistrust,” said Redding. “We knew there were data gaps in our petition last year… Think about the OOP as an equation: A + B = C.
“What we know today is that of the $23.6 million in OOP collected by processors in 2022, $14 million was required to go back to farmers. That’s A.
“B is generated in the marketplace but not collected,” he explained. “Our belief is that this is another $5 to $10 million (annually).
“C is the total that we believe is in the neighborhood of $28.6 to $33 million. The question is, what do we do about it?” he asked.
He answered to say the only way to fix this is to change the system and begin removing the OOP from the minimum price buildup and instead have the PMMB establish a retail-based premium, collected at that point of sale and remitted to the Department of Revenue into a designated fund.
This would require the legislation.
“The General Assembly could then appropriate direct payments to producers and to reinvestment in dairy processing,” said Redding.
The Secretary called it an “embarrassment that we don’t have this number (B)” to complete the A + B = C equation, but as he talked about the PDA’s plan, we heard articulated for the first time this idea that once numbers can be put to the equation and legislative authority for the Board to devise a formula, the OOP could become a “milk tax.”
The difference being that many consumers don’t know they are already paying the OOP, but when pulled out of the minimum price buildup, it becomes a known quantity.
“We trust the state to do this with liquor, cigarettes and liquid fuel. The legislature could decide how these funds would be used, and a portion could be used to help processors invest or reinvest,” said Redding.
In fact, Zach Myers for the Center for Dairy Excellence said a study is underway to assess the obstacles that are preventing processing investment and reinvestment in Pennsylvania.
PMMB Chairman Rob Barley noted that, “It’s certainly time to evaluate how the OOP dollars get back to farmers and not pick winners and losers. The over $800 million that has gone back to dairy farmers since 1988, especially when the majority of it did, no doubt made a positive difference, but that is changing,” he said. “Fluid milk sales have dropped in half (since then), and it is difficult to account for the dollars with the current tools that we as a Board have.”
Barley noted that if the process moves forward to reform the structure, perhaps other products could be eventually added.
“Right now we don’t have the authority to do any of this. Going back to the 1988 testimony, the primary reason the over-order premium was added (to Class I) is that was the practical point, that was the mechanism already in place for fluid milk. There is no such system for other classes, and Class I is also more of a localized product, which I think is still true today,” Barley explained.
Going forward, he said, the choices for the Board are “to get rid of what we have, which is a choice many are not in favor of, or to have legislation to change the OOP without violating interstate commerce, or to develop a new system that strengthens the Pennsylvania dairy industry to benefit all sectors.”
Redding stressed the point that, “This is all about the dairy farmer, how do we incentivize what we need? Keeping our eye on the farmer and understanding we can do something extraordinary here, we have this opportunity to extract this premium from the marketplace and get (the OOP) back to farmers and for the purposes of reinvestment…”
That’s the New. Now for the Dé·jà vu…
The next thought to emerge in this reporter’s mind after hearing the new twist on OOP as ‘milk tax’ and a portion for ‘reinvestment’ was this: Everyone is at the table now, sitting up, alert, paying attention, and offering solutions after 15-plus years of meetings, hearings and discussions. But the same bottomline emerges: everyone still wants a dip of the farmer’s elusive cream.
Not 15 minutes later, after PMMB board member Jim Van Blarcom testified, his Senator Gene Yaw of the northern tier counties shared a similar thought about how this may be already happening within the minimum price buildup in a rapidly changing industry.
“We made this so complicated and there are too many fingers in this pie, frankly,” said Yaw, asking whether processors get any of this money, now.
PMMB auditor supervisor Gary Gojsovich answered that the OOP is currently collected by processors through their sales, and they pay it back to Pennsylvania producers only when the milk is produced, processed and sold in Pennsylvania, all three must apply.
“In the simplest terms, it sounds like we need to change how the premium is collected and the point of where it is collected,” Senator Yaw responded.
Senator Judy Schwank representing parts of Berks County said: “We need the data. We have to have the data.”
So, we are back to the data.
The Secretary called it an “embarrassment that we don’t have this number.”
Chairman Elder Vogel and ranking member Schwank said they plan to reintroduce their bills that did not move forward in the last legislative session that would give PMMB authority to license distributors, a move that would account for all packaged milk sales coming into Pennsylvania from out-of-state and other cross-border transactions, which ‘strand premiums.’
A quick history
For decades, there have been meetings and hearings and discussions about the future of the Pennsylvania Milk Marketing Law and the PMMB that sets minimum wholesale and retail milk prices. The law dates back to the 1930s, but the mandated OOP was introduced to the existing structure during a year of drought and high feed prices in 1988.
At that time, the state’s OOP was set by the Board at $1.05 per hundredweight (9 cents per gallon). Today it is $1.00 plus a 50-cents per hundredweight fuel adjuster (combined is 13 cents per gallon).
At intervals before 2018, the OOP was as high as $3.00 plus a fuel adjuster (over 26 cents per gallon). In 2017, it was nearly $2.00 (17 cents per gallon), but was abruptly cut in half in December of 2017 due to the pressure of out-of-state milk — a harbinger of things to come just four months before Dean Foods announced it was ending contracts with 130 dairy farms in 8 states, 42 of them in Pennsylvania and five months before the startup of the Walmart bottling plant in Indiana.
Also included in the minimum resale and retail milk price buildups are the Federal Order price benchmarks, which vary geographically because Pennsylvania is split between two different Federal Orders. To this minimum federal benchmark price, the OOP is added, translating now to about 13 cents per gallon.
Also added are the average cost recovery amounts for bottlers and retailers as determined by annual hearings for each area of the state, along with adding the 2.5 to 3.5% profit margin the Milk Marketing Law guarantees milk bottlers and retailers on top of the average cost recovery.
What has come under fire, especially since 2009, is the producer OOP, how it is collected and passed back to farmers, how some of it is stranded and how the changing dairy industry has impacted the real and perceived equity of the distribution of these funds.
Lawmakers made it clear that they look at this as two distinctly separate things, the collection is one issue, and the distribution quite another.
Among those testifying, the amount of the current OOP at $1.50 including fuel adjuster that is received on their farms ranged from 6 cents to 50 cents.
The bottomline is for all of the PMMB’s efforts to expand communication and transparency with the tools available, even board member Van Blarcom conceded that it is becoming more difficult to justify the OOP to his peers.
For his part, Matt Espenshade, a Lancaster County dairy farmer representing the State Grange, told lawmakers that producers and cooperatives that are ‘in’ the Class I market take risks and have requirements other class markets do not experience.
He cautioned against reforms that would dilute the premium for the 15 to 20% of state farmers currently receiving a meaningful amount because they have costs and risks associated with that reward.
Johnny Painter, a Tioga County dairy farmer testifying for the Pennsylvania Farm Bureau advocated for a uniform distribution of the OOP in reforms that would have the state collect it all. He said farmers in all classes of milk have the same quality standards to meet.
When pressed by Senator Schwank on why PFB made policy to end the OOP, Painter said it was a tactic to get the dialog started.
Troye Cooper for the Pennsylvania Association of Dairy Cooperatives and a member services director for Maryland and Virginia Cooperative said those receiving very little OOP are part of the 3500 Pennsylvania dairy farms shipping milk through cooperatives that perform essential “balancing” services for the fluid milk market. As coop members, they share in the cost of that.
However, what remained unspoken in his testimony is that the current minimum wholesale and retail milk price buildups now include a roughly 25-cent ‘co-op procurement cost’ for these balancing services along with the requirement that cooperatives list on member milk checks how much of the producer OOP was included.
Representing the Pennsylvania Association of Milk Dealers, Chuck Turner of Turner Dairy near Pittsburgh, pointed out that fluid milk sales are declining, and other class products are increasing. He asked how bottlers can continue cutting checks to the Federal Orders to bring up the payments for other class milk while reducing the payments to their own shippers when their own fluid milk market volumes are shrinking.
“The fluid milk business is in tough shape. Sales volume has trended downward for 13 years by more than 20%. That’s 1 gallon in 5 lost, 1 plant in 5 closed. It can’t bear the burden for the other classes. It seems particularly unfair with sales growing in the other categories,” said Turner, noting that plants outside of Pennsylvania have been closing “at an astonishing rate.”
He said the number of independent milk processors in the U.S. fell from 69% to 44% in 2020, whereas in Pennsylvania, independent bottlers still represent 62% of the fluid milk, and he credited the PMMB system for that difference.
Myers noted that Pennsylvania is the state with the second most dairy farms and the fourth smallest average herd size, with production costs that are higher than in some neighboring states.
He cited loss of market premiums, including quality premiums, the impacts of other price erosion such as Federal Order make allowances that a potential hearing could further degrade.
Compared to the U.S. All-Milk price published monthly by USDA, Myers noted the Pennsylvania All-Milk price used to be higher than the U.S. average, but this gap has narrowed significantly in the past 15 years.
“It was $1.73 per hundredweight from 2008 to 2012, averaged $1.29 from 2013 to 2017, and in the last five years, it has narrowed to just 49 cents, on average,” said Myers.
In fact, during the pandemic in 2020-21, the Pennsylvania All-Milk price averaged 18 cents less than the U.S. All-Milk price, according to Myers.
“There are several factors for this narrowing, but it’s safe to say it can’t be fixed by increasing the premiums,” said Myers, noting that 80% of the milk produced in Pennsylvania is marketed through cooperatives, and there are cooperative base programs limiting expansion on Pennsylvania farms.
These coop base programs and penalties affect the dairy farms and are in part tied to the limits in processing capacity.
Meanwhile, there were several references by testifiers citing milk coming from New York into Central Pennsylvania for processing and sale and displacing milk produced in that area. The OOP, of course, stays with that retailer, processor and/or cooperative as part of their business model to expand their state’s markets into Pennsylvania so their producers can grow.
“When that premium goes back to New York, that’s exactly what is playing out, and it feels like an injustice to be asking our consumers to pay it without regard to that investment,” said Redding. “We want to capture that premium and put it back into our Pennsylvania dairy farmers.”
The problem, said Barley, is the PMMB can’t just “grab that money and give it to Pennsylvania farmers if the milk is not produced, processed and sold in-state without being challenged in court as in the past on the grounds of violating the interstate commerce clause.”
Senator Yaw interjected that, “If the milk is sold here, we should give the premium back to our farmers. If the milk came from New York, those farmers should not benefit from what we are doing to support Pennsylvania farmers.”
Redding said lawmakers “do not have to wait for the data. The bill on licensing distributors could go forward along with a bill to set up a structured system, assuming the amount to be around $30 million, and we believe it to be higher, to decide how to distribute that revenue.”
Redding said his fear is that as the frustration undertow grows, Pennsylvania will lose this premium without action.
He pointed out that his committee “kept its promise” to get everyone around the table to hear ideas, but that it will be “difficult to thread this needle and it will require collaboration.”
Ranking member Schwank said everything hinges on getting the data that is needed to know how to proceed.
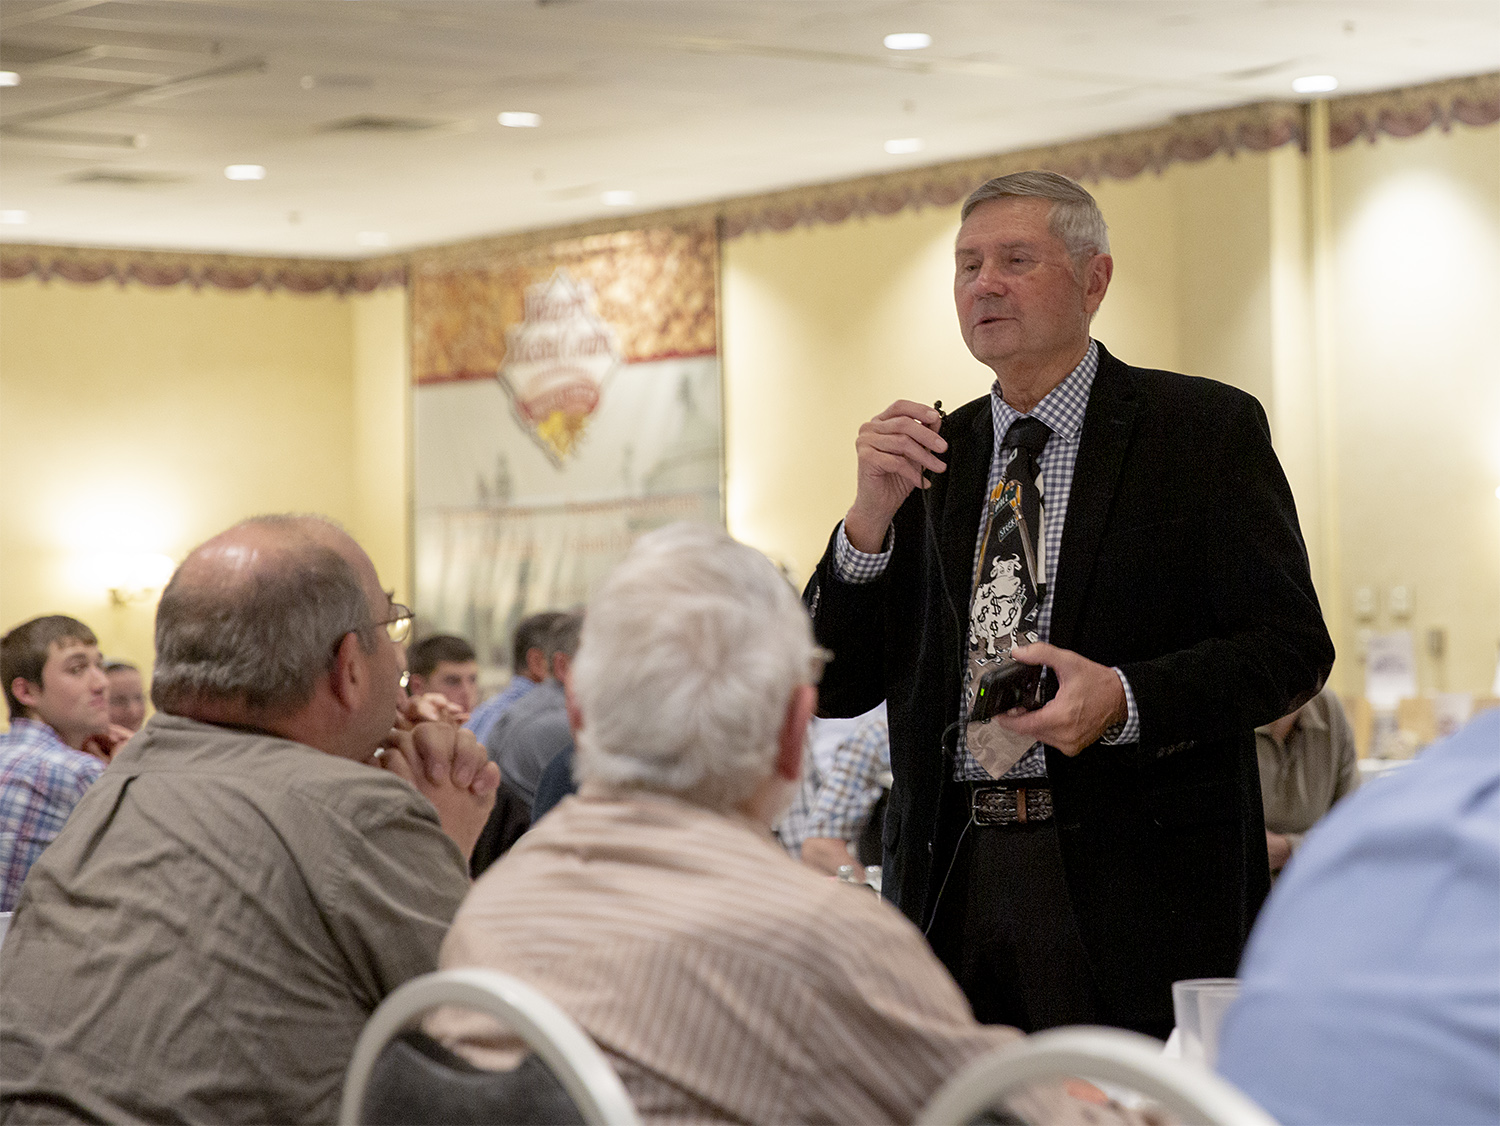
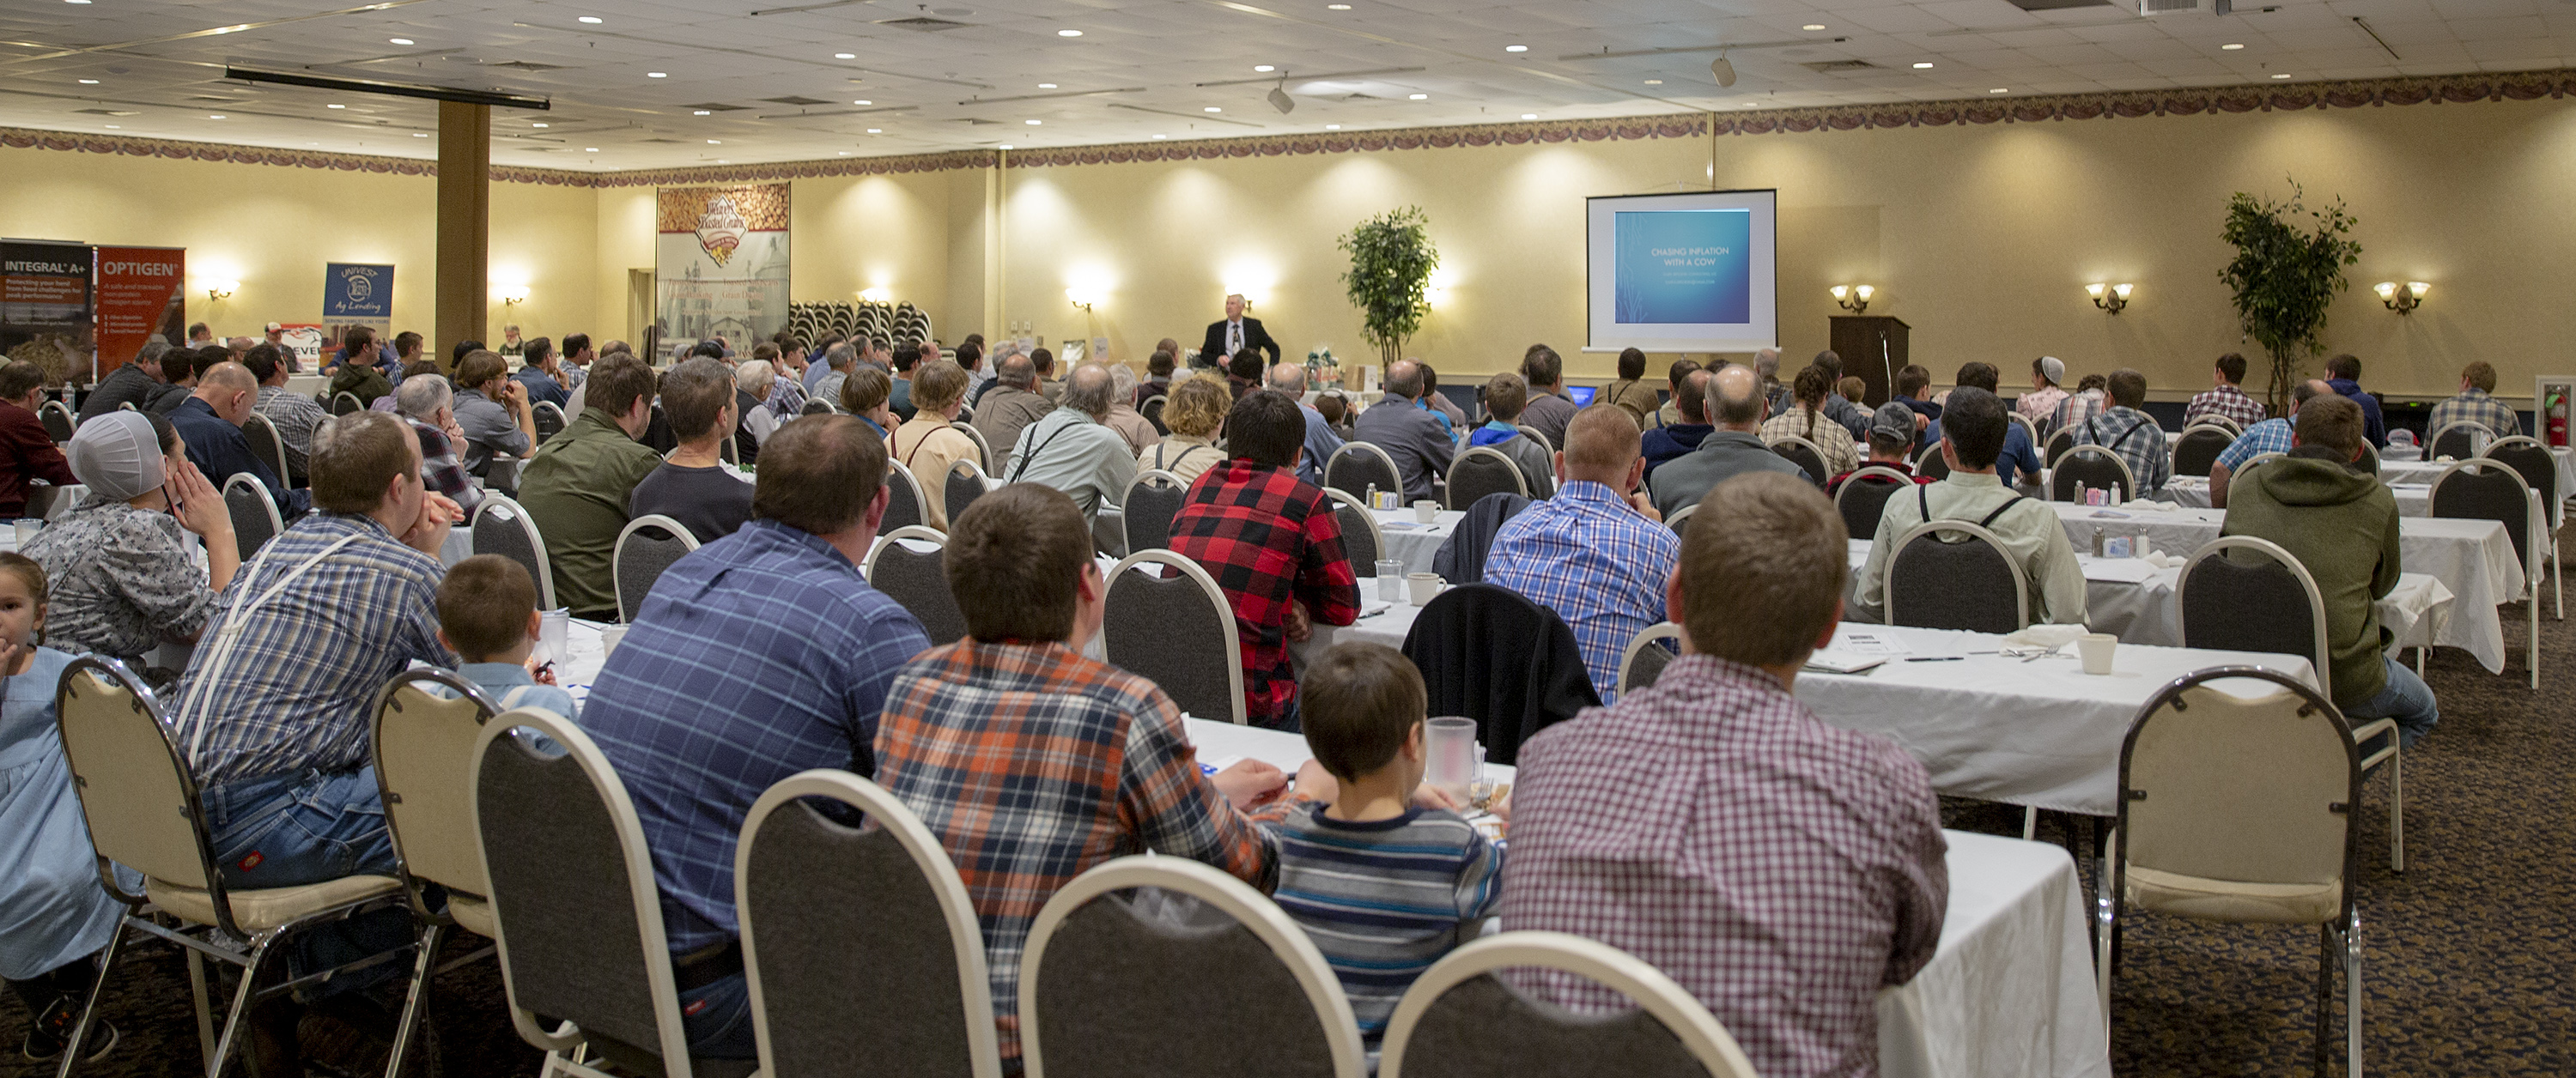
NEW HOLLAND, Pa. – “Too much money chasing too few assets,” that’s the definition of inflation, said Gary Sipiorski, ag lender and financial consultant from Wisconsin.
He didn’t have to tell the over 250 dairy farmers attending Homestead Nutrition’s dairy seminar at Yoder’s Restaurant in New Holland on December 7 that inflation is real, because they are feeling it.
His bottom line is to measure every decision by its impact on cow comfort and manage the net income the cows generate.
As president and CEO of Citizens State Bank of Loyal, Wisconsin, Sipiorski is also an advisor to the Federal Reserve Board of Chicago. He expected the Fed would raise interest rates another half a percent, and several days later, that’s what they did.
Raising interest rates is meant to slow things down enough to curb that inflation, and as farmers, “you’re feeling the effects of both,” he said.
Sipiorski described the effects of both the disease and the cure as something that creeps up gradually to squeeze the margin.
“You can be taking good care of things and don’t see this happening, as the temperature gradually increases. It sneaks in slowly,” he said. “The war on inflation will continue for at least the next 12 months, and we are likely to see interest rates continue higher before stabilizing around the middle of next year.”
The good news for dairy, he said, is that even though consumers are drinking a little over half as much milk per capita as they did 50 years ago (18 gallons vs. 30 per person per year), they are eating more than double the gallons of milk in the form of all dairy products, combined.
In 2021, Americans consumed 667 pounds (77 gallons) of dairy products per capita. That’s 12 more pounds per capita than in 2020.
“We didn’t drink the 77 gallons, we ate it,” said Sipiorski, adding that dairy exports have also become crucial.
“By the end of this year, 20% of your milk production will be going elsewhere,” he said. “That shows the faith the rest of the world has in the superior product you make.”
Inflation, rising interest rates and supply disruptions are slowing the rate of dairy expansion, as the industry focus turns inward to manage margins even more tightly as feed costs have doubled, cropping costs have quadrupled, lines of credit cost more and are harder to get, machinery and parts cost more and are harder to find, and some farms must deal with a milk base program from their milk co-op or buyer — putting penalties on overbase milk in the output side of that margin equation.
Sipiorski shared his insights on the most important things the top 30% of dairy producers do in a talk he titled ‘Chasing inflation with a cow.’
The top third of dairy producers double-down on managing these primary areas: feed, debt, labor, cow comfort, and knowing their numbers.
Minimize feed shrink
With feed and cropping costs so much higher, Sipiorski told dairy farmers the 10 to 20% they can be losing in feed shrinkage is a significant area to manage.
“Losing 10 to 20% of the feed from field to rumen is a big cost to the dairy,” he said. “We are seeing more investment in feed storage sheds, bringing the mixing indoors and thinking about how you mix the feed, in what order.”
Pay down lines of credit, not term debt
Choosing carefully what debt to pay down at this time of rising rates is also critical. Paying down lines of credit that have adjustable interest rates and keeping some of that cash liquidity may make more sense than paying additional principal on longer-term fixed rate loans.
“Your thought process may be to pay down that term debt, but if the rate is locked-in, and you pay it down, that money is gone, and you may need that money later, and then pay a higher interest rate for it,” Sipiorski explained, advising farmers to talk with their lenders about their debt structure.
Push pencil on machinery
“Do the math on whether to lease or buy machinery,” Sipiorski urged. “If it is something you use three months of the year, can you afford it? Can you afford the cost to have and maintain that piece of equipment?”
He noted that the top dairy farms push the pencil to compare costs of owning new equipment, leasing it, or hiring custom operators for segments of their field work.
Time is money, spend it wisely
In addition to dealing with hired labor cost and availability, Sipiorski advised farmers to “count your steps and measure your time.”
In other words, know what your time is worth and find ways to streamline chores for yourself and your employees. One example he gave was to put tools around where they will be used to minimize time spent going back and forth for tools needed.
Keep improving cow comfort
“Cow comfort is a place to keep improving to fight that inflation with that dairy cow,” Sipiorski declared.
It’s the accumulation of a lot of simple little things the top third of producers do, such as providing enough space at the feedbunk, waterer and in the dry cow area.
“The dry cows are working just as hard for you, so don’t cheat them” he said, adding that top producers are absolutely passionate about cow comfort.
The cows require a lot of investment, and the top producers benchmark the investment per cow at $8,000 to $20,000, while benchmarking gross income per cow at $5,000.
“Cow comfort is an area of investment that brings you the most return. Every decision you make, ask yourself, are you making money with that decision?” he said. In other words, “are you making cows more comfortable with that decision?”
Keep improving milk components, quality
Producing milk with higher component levels and lower somatic cell counts (SCC) is what the top third of producers are doing, said Sipiorski.
“This is even more important if your co-op has a base program. If you can’t produce more milk, make the milk you are producing better,” he said, noting that components drive value.
Quality as measured in SCC will also increasingly drive value and market access. Sipiorski sees the industry getting to the place where milk will eventually have to be under 150,000 SCC.
While he didn’t specifically mention transformation in the processing sector, it’s becoming clear that ultrafiltration and microfiltration in some of the newer dairy plants is aimed at removing the lactose from the milk to be used in making cheese, other dairy products and lactose-free high protein milk beverages.
Those working with this technology have repeatedly said it requires farm-level SCC thresholds to be even lower because, as the water and lactose are removed through membranes and reverse osmosis, the remaining solids are condensed. This includes the SCC being concentrated with those valuable solids, so those processors expect a lower-SCC limit at the starting point.
Get educated on marketing
Sipiorski advised farmers to be “educating yourself on marketing and risk management.”
He noted that milk markets are volatile, and marketing through a broker or a cooperative program or other risk management can be good or bad.
“You won’t know if it’s a good deal or not, if you don’t know your cost of production, your margin,” he said.
Know the numbers, focus on high quality forage production, and look at areas where changes and investments can help fight inflation, he advised.
One thing he has seen more farms moving toward – to reduce marketing costs – is to increase milk storage to go from once a day to every-other-day pickup to reduce fuel costs, transportation and ‘stop’ charges.
This is something that has been occurring at the retail end for years, with less frequent deliveries from processors to retailers becoming the norm today.
Benchmark against industry or self
Benchmarking the dairy to itself year over year or to industry averages is important financial management, according to Sipiorski.
The numbers that are needed to do this are found on the balance sheet, income statement, and accrual accounting of yearend income – not the IRS tax return.
He said that doing a business plan with projected cash flows helps make better financial decisions.
Sipiorski gave farmers some financial benchmarks to keep in mind, noting again that the numbers need to be based on accrual accounting, not the year end IRS tax return.
“In that tax return, you have prepayments and depreciation,” he said. This skews the cost of production calculation, for example, because the cost of inputs are not directly aligned with the output revenue.
Sipiorski ticked through some industry benchmarks to be aware of: Equity position (50%), liquidity (2:1), net profit margin (10%), cost of production ($17-22.00/cwt), operating expense as a percentage of gross income (65-80%), and debt to revenue ratio (1:1).
The bottom line, he said, is “you need to produce 100 pounds of milk for less than you sell it for.”
On that point, he noted the most recent USDA forecasts at the end of November are for Class III milk to average $19.80 in 2023 with the All-Milk price next year forecast to average $22.70, while the cost of production in 2022 is averaging $20 to $22.00 across the industry, but the range is wide.
“Pennies (per hundredweight) are a big deal,” he said, showing that the 47-pennies per hundredweight difference in a Q2 2022 comparison of the net margin per hundredweight of $6.64 for all herds vs. $7.11 for the ‘top 30% of herds’ amounts to just shy of $113 per cow annually.
“That’s $2800 on 25 cows, $11,280 for a 100-cow dairy. That’s how we fight inflation with a cow,” he said. “Who in this room wouldn’t want another $11,000 in the pocket to fight inflation?”
Sipiorski described dairy as a dynamic business full of chaos and volatility, but with that comes lots of opportunities.
He sees a ‘barbell-shaped’ future for dairy, where there will be opportunities for small and mid-sized family dairies even if a large portion of the milk supply comes from much larger dairies.
-30-
Gary Sipiorski, a lender from Wisconsin, talked about dairy financial management in these inflationary and volatile times. Despite the chaos and consolidation, he sees opportunities for small and mid-sized family dairies in the future, even if a large portion of the milk supply comes from much larger dairies. Photo by Sherry Bunting
By Sherry Bunting, Farmshine, October 28, 2022 (updated with additional information after publication)
The National Milk Producers Federation (NMPF) Board gets high marks for passing a Federal Milk Marketing Order Modernization Plan this week at its annual meeting in Denver, Colorado that includes returning the Class I mover to the previous ‘higher of’ formula — a virtually unanimous consensus item that came out of the Farm Bureau Forum in Kansas City earlier in the month.
However, the NMPF modernization plan also includes a few items that were not fully discussed, items that seem to run counter to what dairy farmers were prioritizing, and it leaves out a few items the consensus-builders were vocal about in Kansas City.
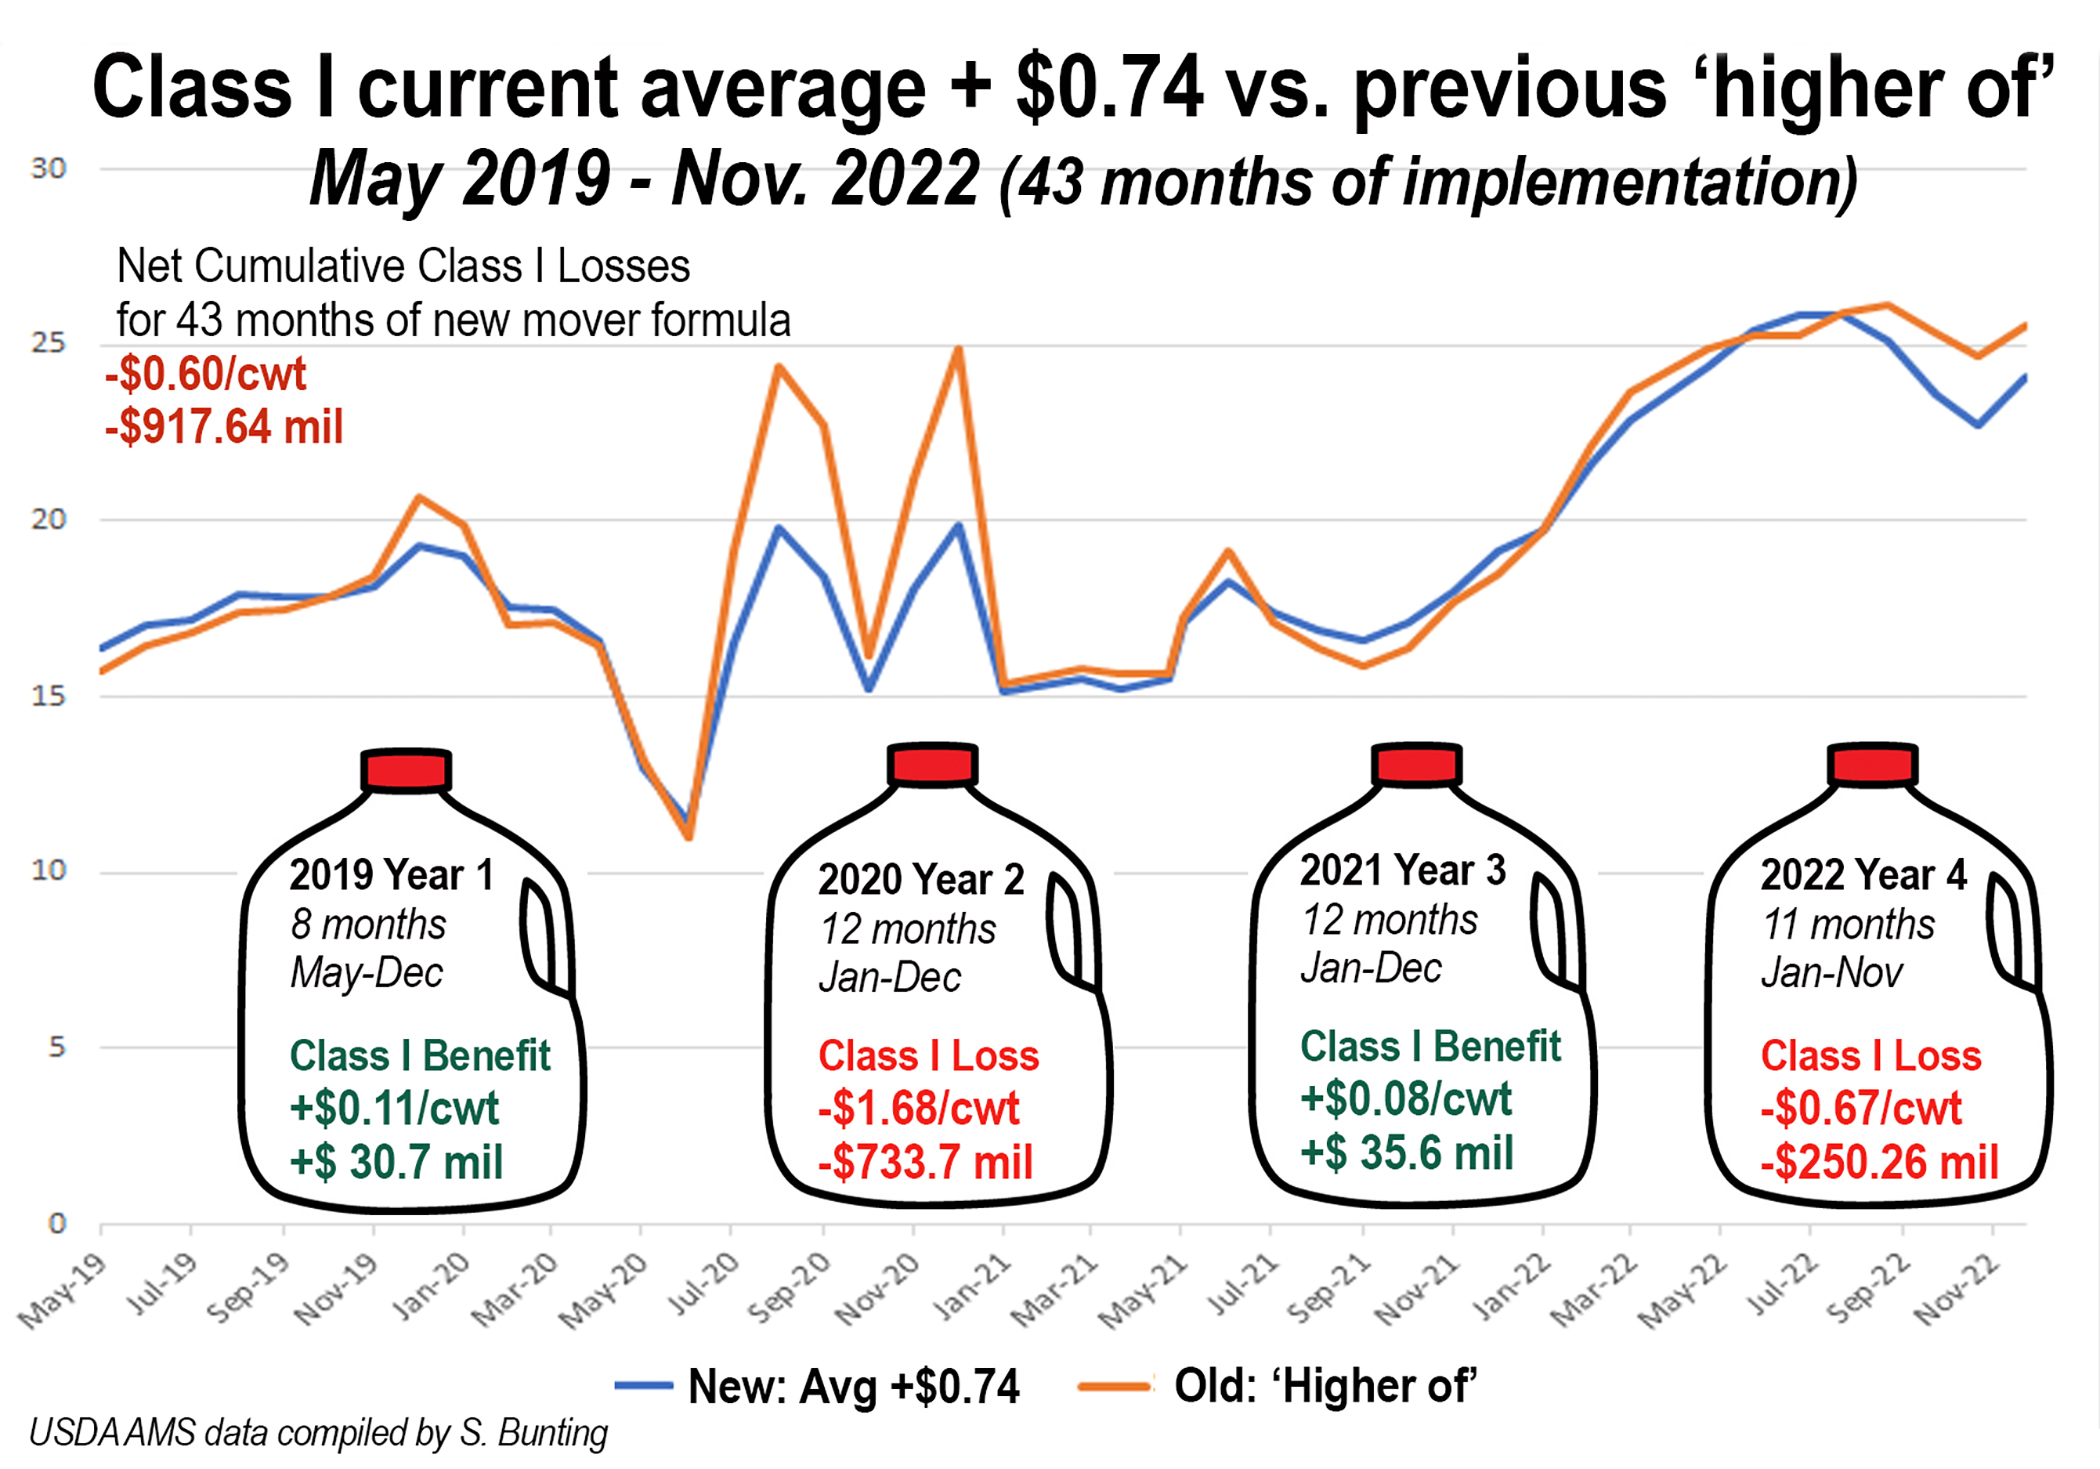
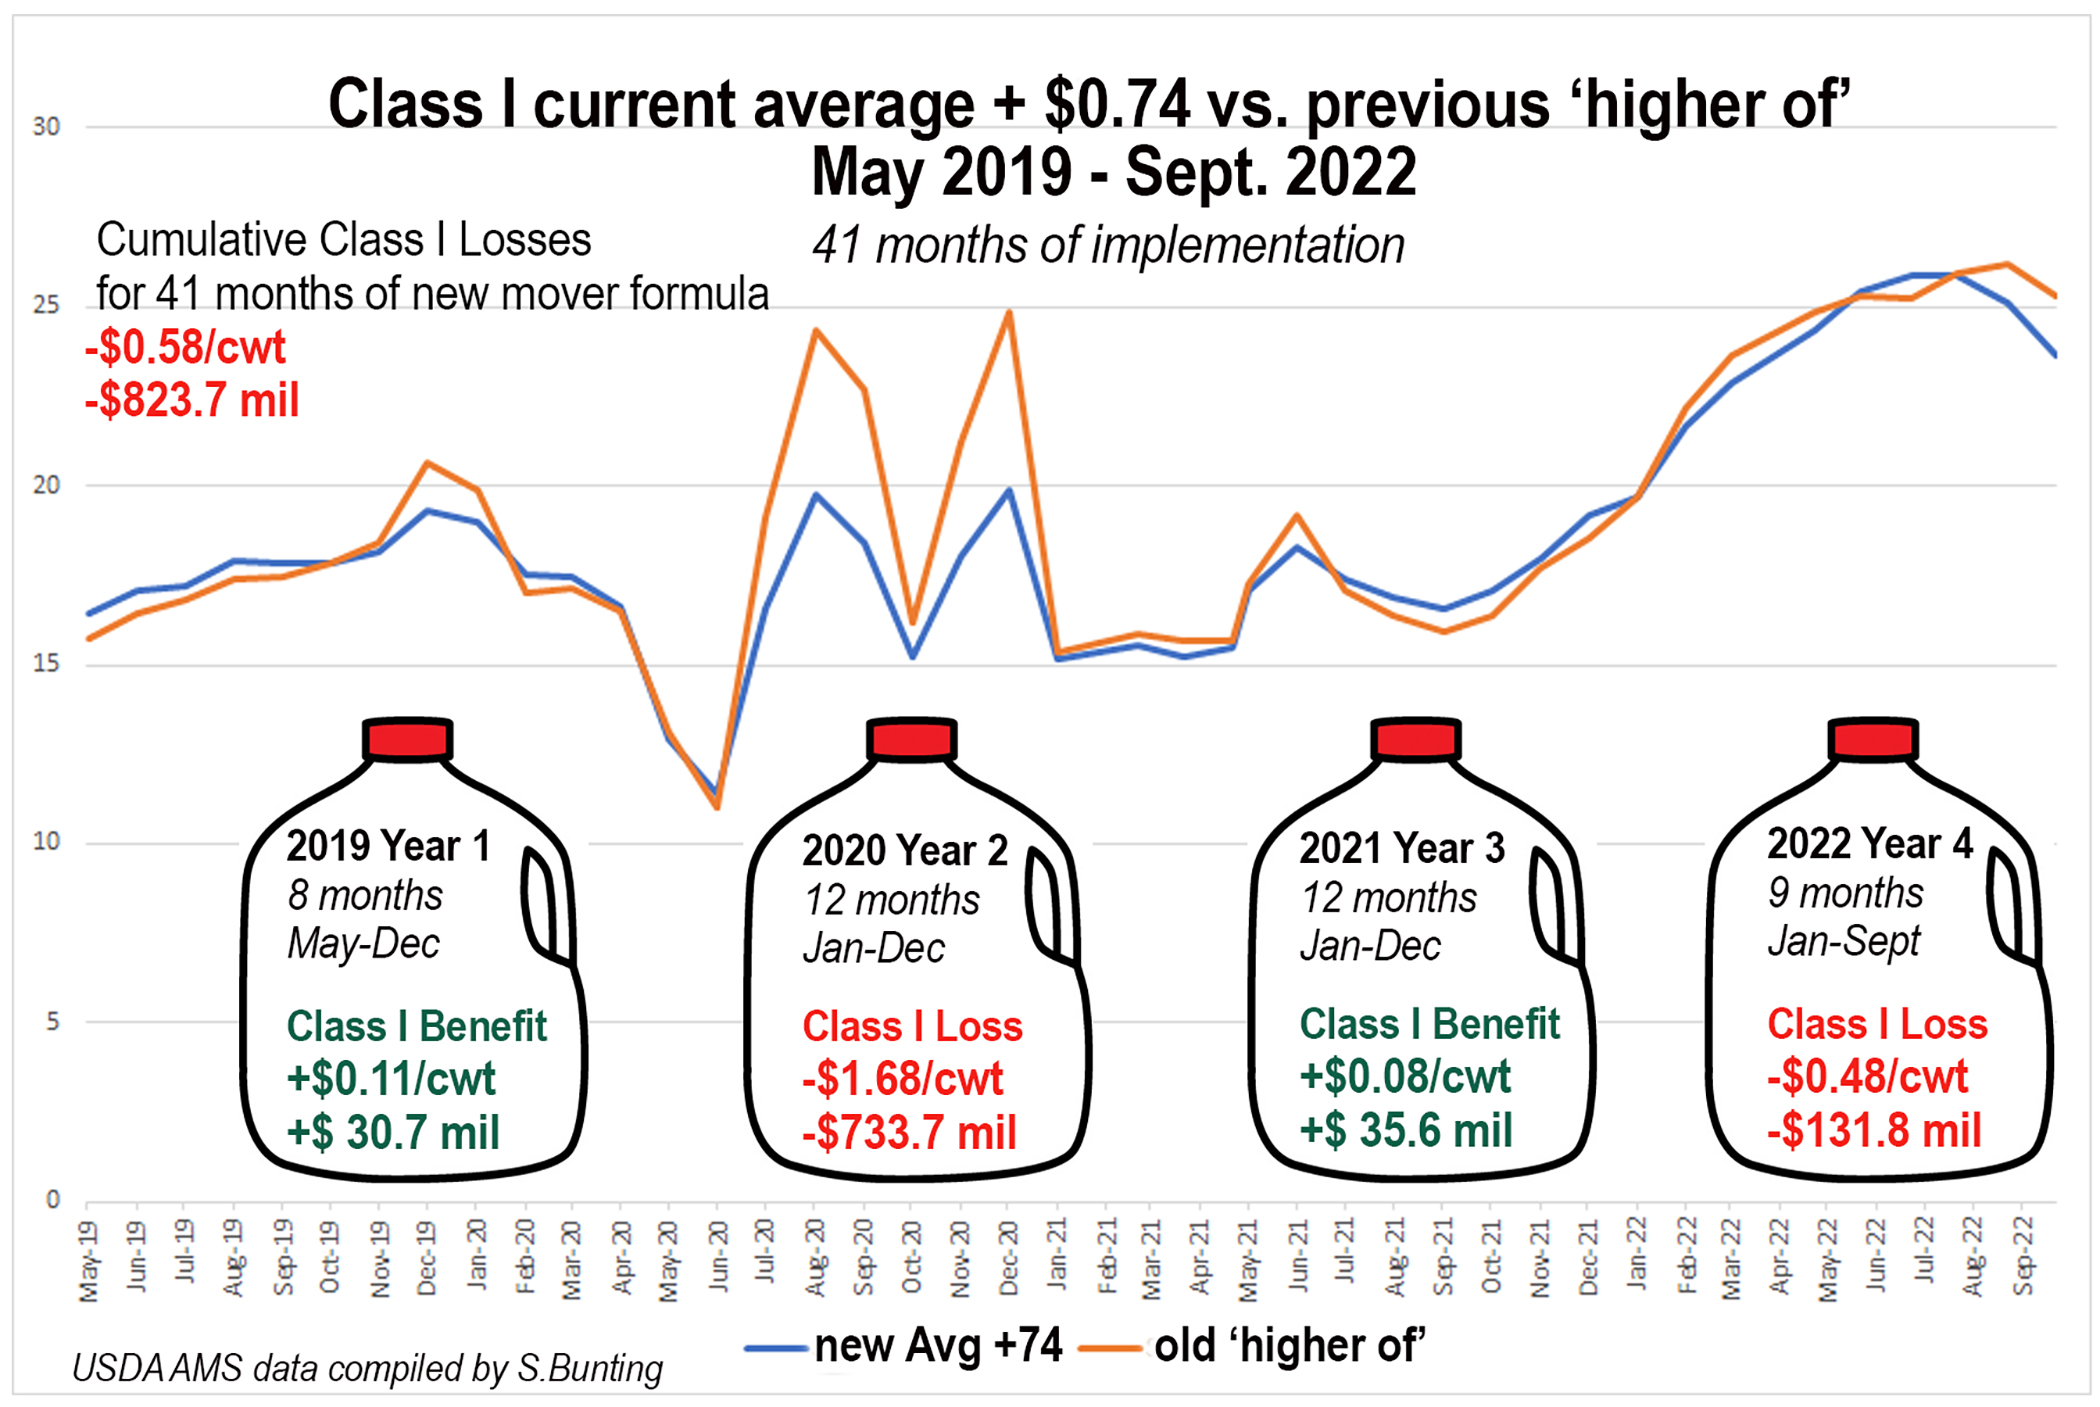
The recommendation to return to the higher of Class I mover is an important response by NMPF to dairy farmer concerns. That ball has been in USDA’s court after the first two years of implementation, according to the farm bill language that changed it to an averaging method in the first place. Four years and nearly $1 billion in cumulative Class I net value losses have passed (see chart), but Ag Secretary Tom Vilsack said he needed to see “consensus” before allowing a hearing to be opened.
In post-conference interviews, several Farm Bureau Forum attendees said this was their main priority for participating – to show Secretary Vilsack there is consensus to “fix the mistake.”
For NMPF to include it in their plan is a win.
Another item in the NMPF plan is to develop a process to ensure make allowances are reviewed more frequently through legislation directing USDA to conduct mandatory processor cost studies every two years and to update the make allowances contained in the USDA milk pricing formulas.
There was general agreement from stakeholders in Kansas City that processor costs need to be evaluated and make allowances updated. Over half of the table-groupings identified this. There was also healthy discussion of some ways to do this to minimize the sudden impact on farmer milk checks – all good points for developing a process and for a USDA hearing process to fully evaluate it.
Of the bones to pick, one NMPF recommendation that runs counter to what more than half of the table-groupings prioritized in Kansas City concerns expansion of the pricing survey to include more products. NMPF’s task force decided not to add any products to the price survey, and in fact they are recommending dropping one.
On the chopping block is the 500-pound barrel cheese price in the protein calculation for Class III.
Initially, NMPF’s task force committees looked at adding unsalted butter, skim milk powder (a higher value more standardized product than nonfat dry milk), and they looked at mozzarella cheese. In all three cases, the task force chose not to recommend additional products.
The fact that they are recommending elimination of a product from the pricing survey is curious.
Less than one-third of the Kansas City table-groupings listed elimination of barrel cheese pricing as a priority. Few people questioned NMPF economist Peter Vitaliano on the sensibility of this recommendation – except for yours truly.
I asked this question: “On the blocks and barrels, what do you foresee happening if the barrels are dropped? Right now we’ve got barrels doing more trading than blocks. We’re really not seeing much trading at all in blocks on the CME spot market. Also, would this mean that the cost of making those barrels will be backed out of the processing cost survey in terms of establishing new make allowances?
Vitaliano gave this answer: “That’s an interesting question. I’ve heard different interpretations of what’s going to happen to barrels if they are not used in the formula. Some folks feel they’ll just be priced at a discount to blocks, and the cash market for barrels will go away. I’m not sure I buy into that totally because barrel cheese is becoming a different product.”
The NMPF economist continued with his answer: “Under current quality standards, barrel cheese is the only major way that you can get uncolored whey, which is demanding a premium in the marketplace because all of these nutrition products, these high value nutrition products in demand by millennials and others, they don’t want to show ‘bleached whey’ on the label, they want the white uncolored whey powder that comes from barrel cheese production.”
Apparently, yellow whey from block Cheddar production is less desirable. But we’ve known this for at least 15 years.
In other words, according to Vitaliano, there is right now a ‘subsidy’ effect from the premium paid for the higher value of the uncolored whey that creates the environment to produce more barrel cheese – regardless of what the cheese market is doing.
Vitaliano noted that FDA is going to consider some changes that might alter how this cross-product scenario is playing out by allowing microfiltered milk to be used in plants producing standard-of-identity cheese, but the bottom line is that barrel processors making whey protein concentrate as co-products benefit from the white-whey premium whereas block cheese processors do not.
When the two are averaged together in the Class III protein formula, they represent different markets when they historically moved together, said Vitaliano.
Interestingly, however, barrels have traded higher — not lower — than blocks on the CME for most of this year.
In the purely cheese market history, barrels and blocks moved together more closely, then in times of market shocks beginning in 2009, we would see periods of wide spreads and inversions, sometimes barrels over blocks and most of the time blocks over barrels. During intervals in 2016-17, barrels sold at 10 to 20-cent discounts to blocks. Since 2018, we’ve seen long intervals of barrels over blocks by up to 25 cents and then the flipside with blocks over barrels.
This year (2022), barrels have sold at a premium to blocks consistently since April. The barrel premium over blocks stood at 15 cents per pound last week. That’s a significant impact on farm-level milk prices — to the good.
Coincidentally, barrel prices crashed this week, losing 22 cents, where blocks lost a nickel, thereby pushing barrels under blocks by a few cents on Oct. 25, the same day that the NMPF Board voted unanimously to endorse the multi-pronged modernization plan that includes dropping 500-lb barrel cheese out of the FMMO end-product pricing formula.
For the year (2022), barrels will likely average a nickel above blocks.
There is also the question of price discovery. For the year, we have seen more barrels traded on the CME compared with the volume of blocks.
When following up in a question about what happens to price discovery if the barrels are eliminated from the pricing formula, Vitaliano responded that 15% of the cheese reported in USDA’s weekly price survey is barrel cheese. Rather than reduce the weighted average to reflect that, and rather than including mozzarella in the pricing survey (a higher volume and value item than cheddar), NMPF is simply recommending the elimination of barrels to avoid the block/barrel spread.
Vitaliano said pricing formulas are based on the USDA price survey, not on the CME spot market. However, the CME spot market is used to set pricing for the USDA-reported sales.
Vitaliano also noted that price discovery on the CME spot market is achieved even if no product changes hands because it is a marginal market-clearing trade in the first place.
“The whole industry is watching that market, so if that block price is, let’s say, overvalued, and I have extra blocks and I think that market is high, anybody can go to that market and sell; or if you think it’s undervalued, you can go to that market to buy,” he said. “Just because there’s not a lot of trading, doesn’t mean it’s not necessarily representative of the market… we just have to trade the marginal excess or shortage.”
According to Vitaliano, even the regulators have looked at this and concluded that since the whole industry watches that market — everybody has the opportunity to jump in, and they are not shy if they have a different idea about what the market should be, they can go in and make bids or offers. Those bids and offers move the market whether or not a trade is completed.
Even in light of these explanations, the NMPF recommendation to eliminate barrels from the pricing formula remains a bit of a head-scratcher and needs more discussion and evaluation.
NMPF also wants to expand the forward pricing window for whey and nonfat dry milk (NFDM) price-reporting to 45 days instead of 30 in order to “capture more of the global market in the pricing formula.”
However, when asked why NMPF is not seeking to expand the price reporting to include skim milk powder (SMP) – the globally traded powder – as a means of capturing more of the higher-value global market, Vitaliano said SMP is sold at differing standardized protein rates as a value-added product. NFDM, on the other hand, often has more protein in it, but it’s variable and a lower-priced bulk commodity. It’s a true bulk product that is made to soak up excess milk, he explained.
Vitaliano also noted that NFDM is used by domestic cheese makers, whereas SMP is not.
Ditto the answer for unsalted butter. While the sales of unsalted rival salted butter in volume, and it is a bulk product more consistent with higher-value global markets, the NMPF task force perspective is that the unsalted butter is also a step up as a value-added product for a specific market in foodservice, not a commodity bulk product a plant would make with excess milk.
Ditto for mozzarella, which NMPF maintains is already priced off the USDA-reported cheddar price even though the U.S. sells more mozzarella than cheddar today.
Next week, we’ll dig into the yield factor changes in the NMPF plan and the glaring absence of a recommendation on depooling issues across the country. Solving the depooling conundrum was a priority listed by over half of the consensus-building table-groupings at the Farm Bureau Forum and producers from multiple regions were vocal about it throughout the three-day meeting.
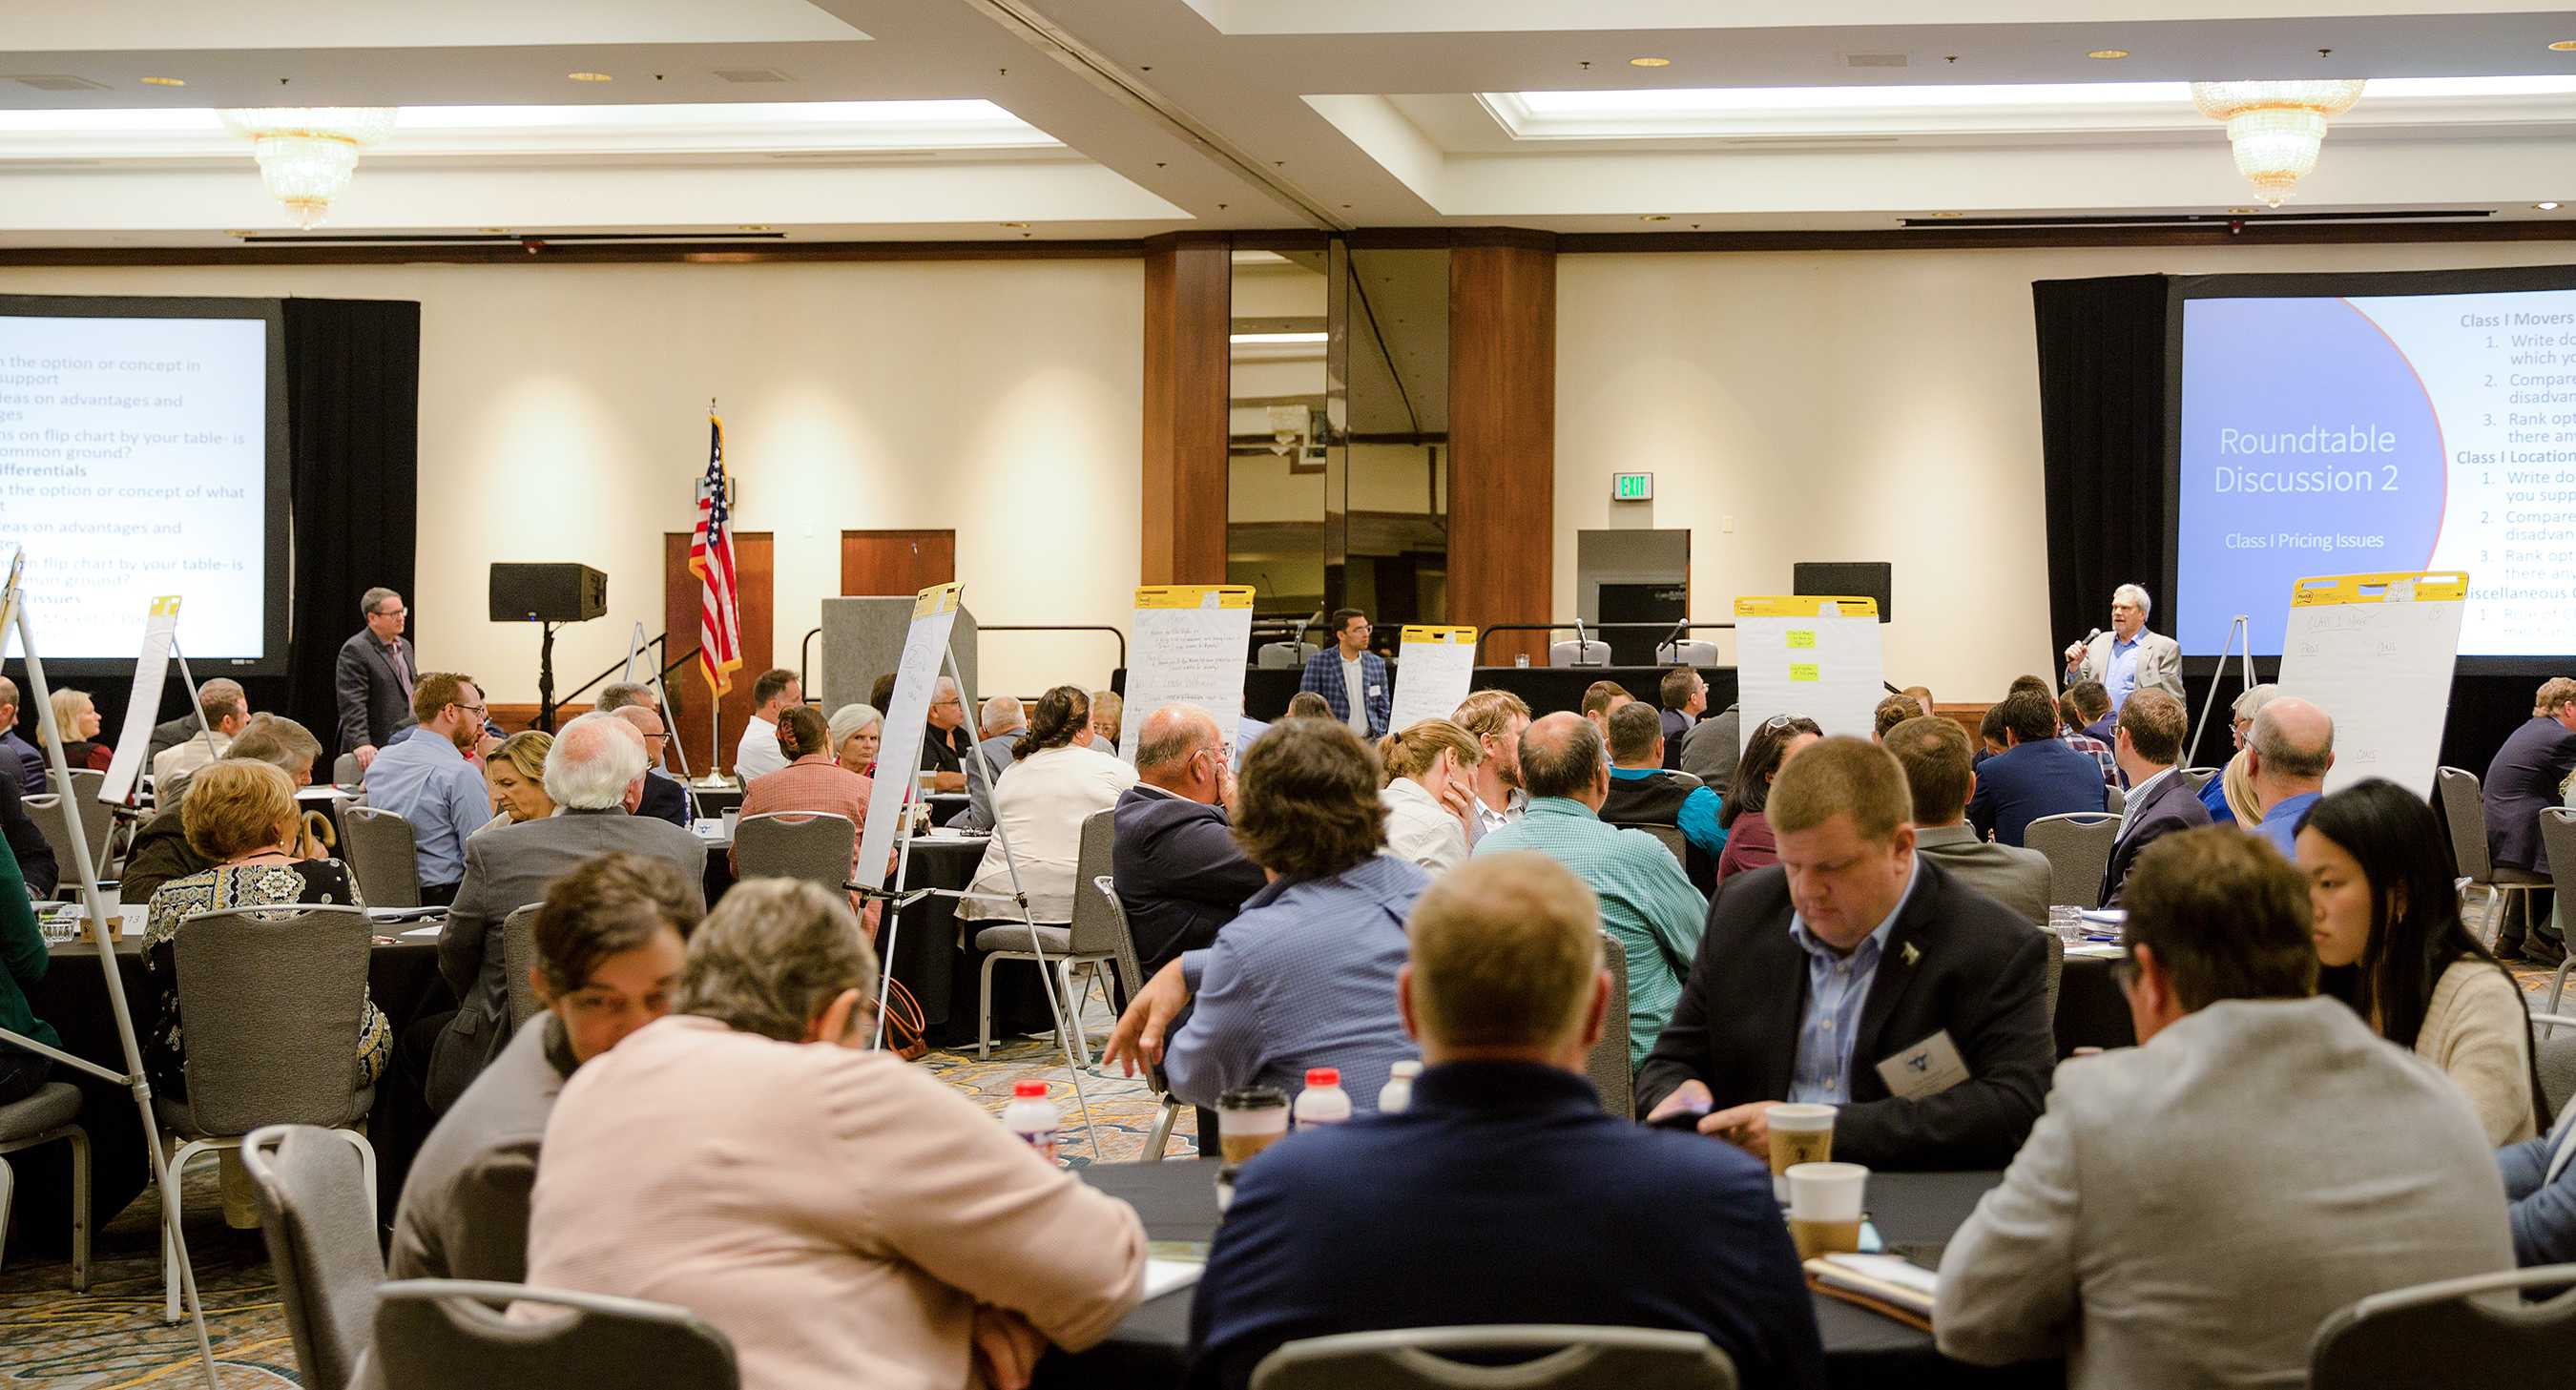
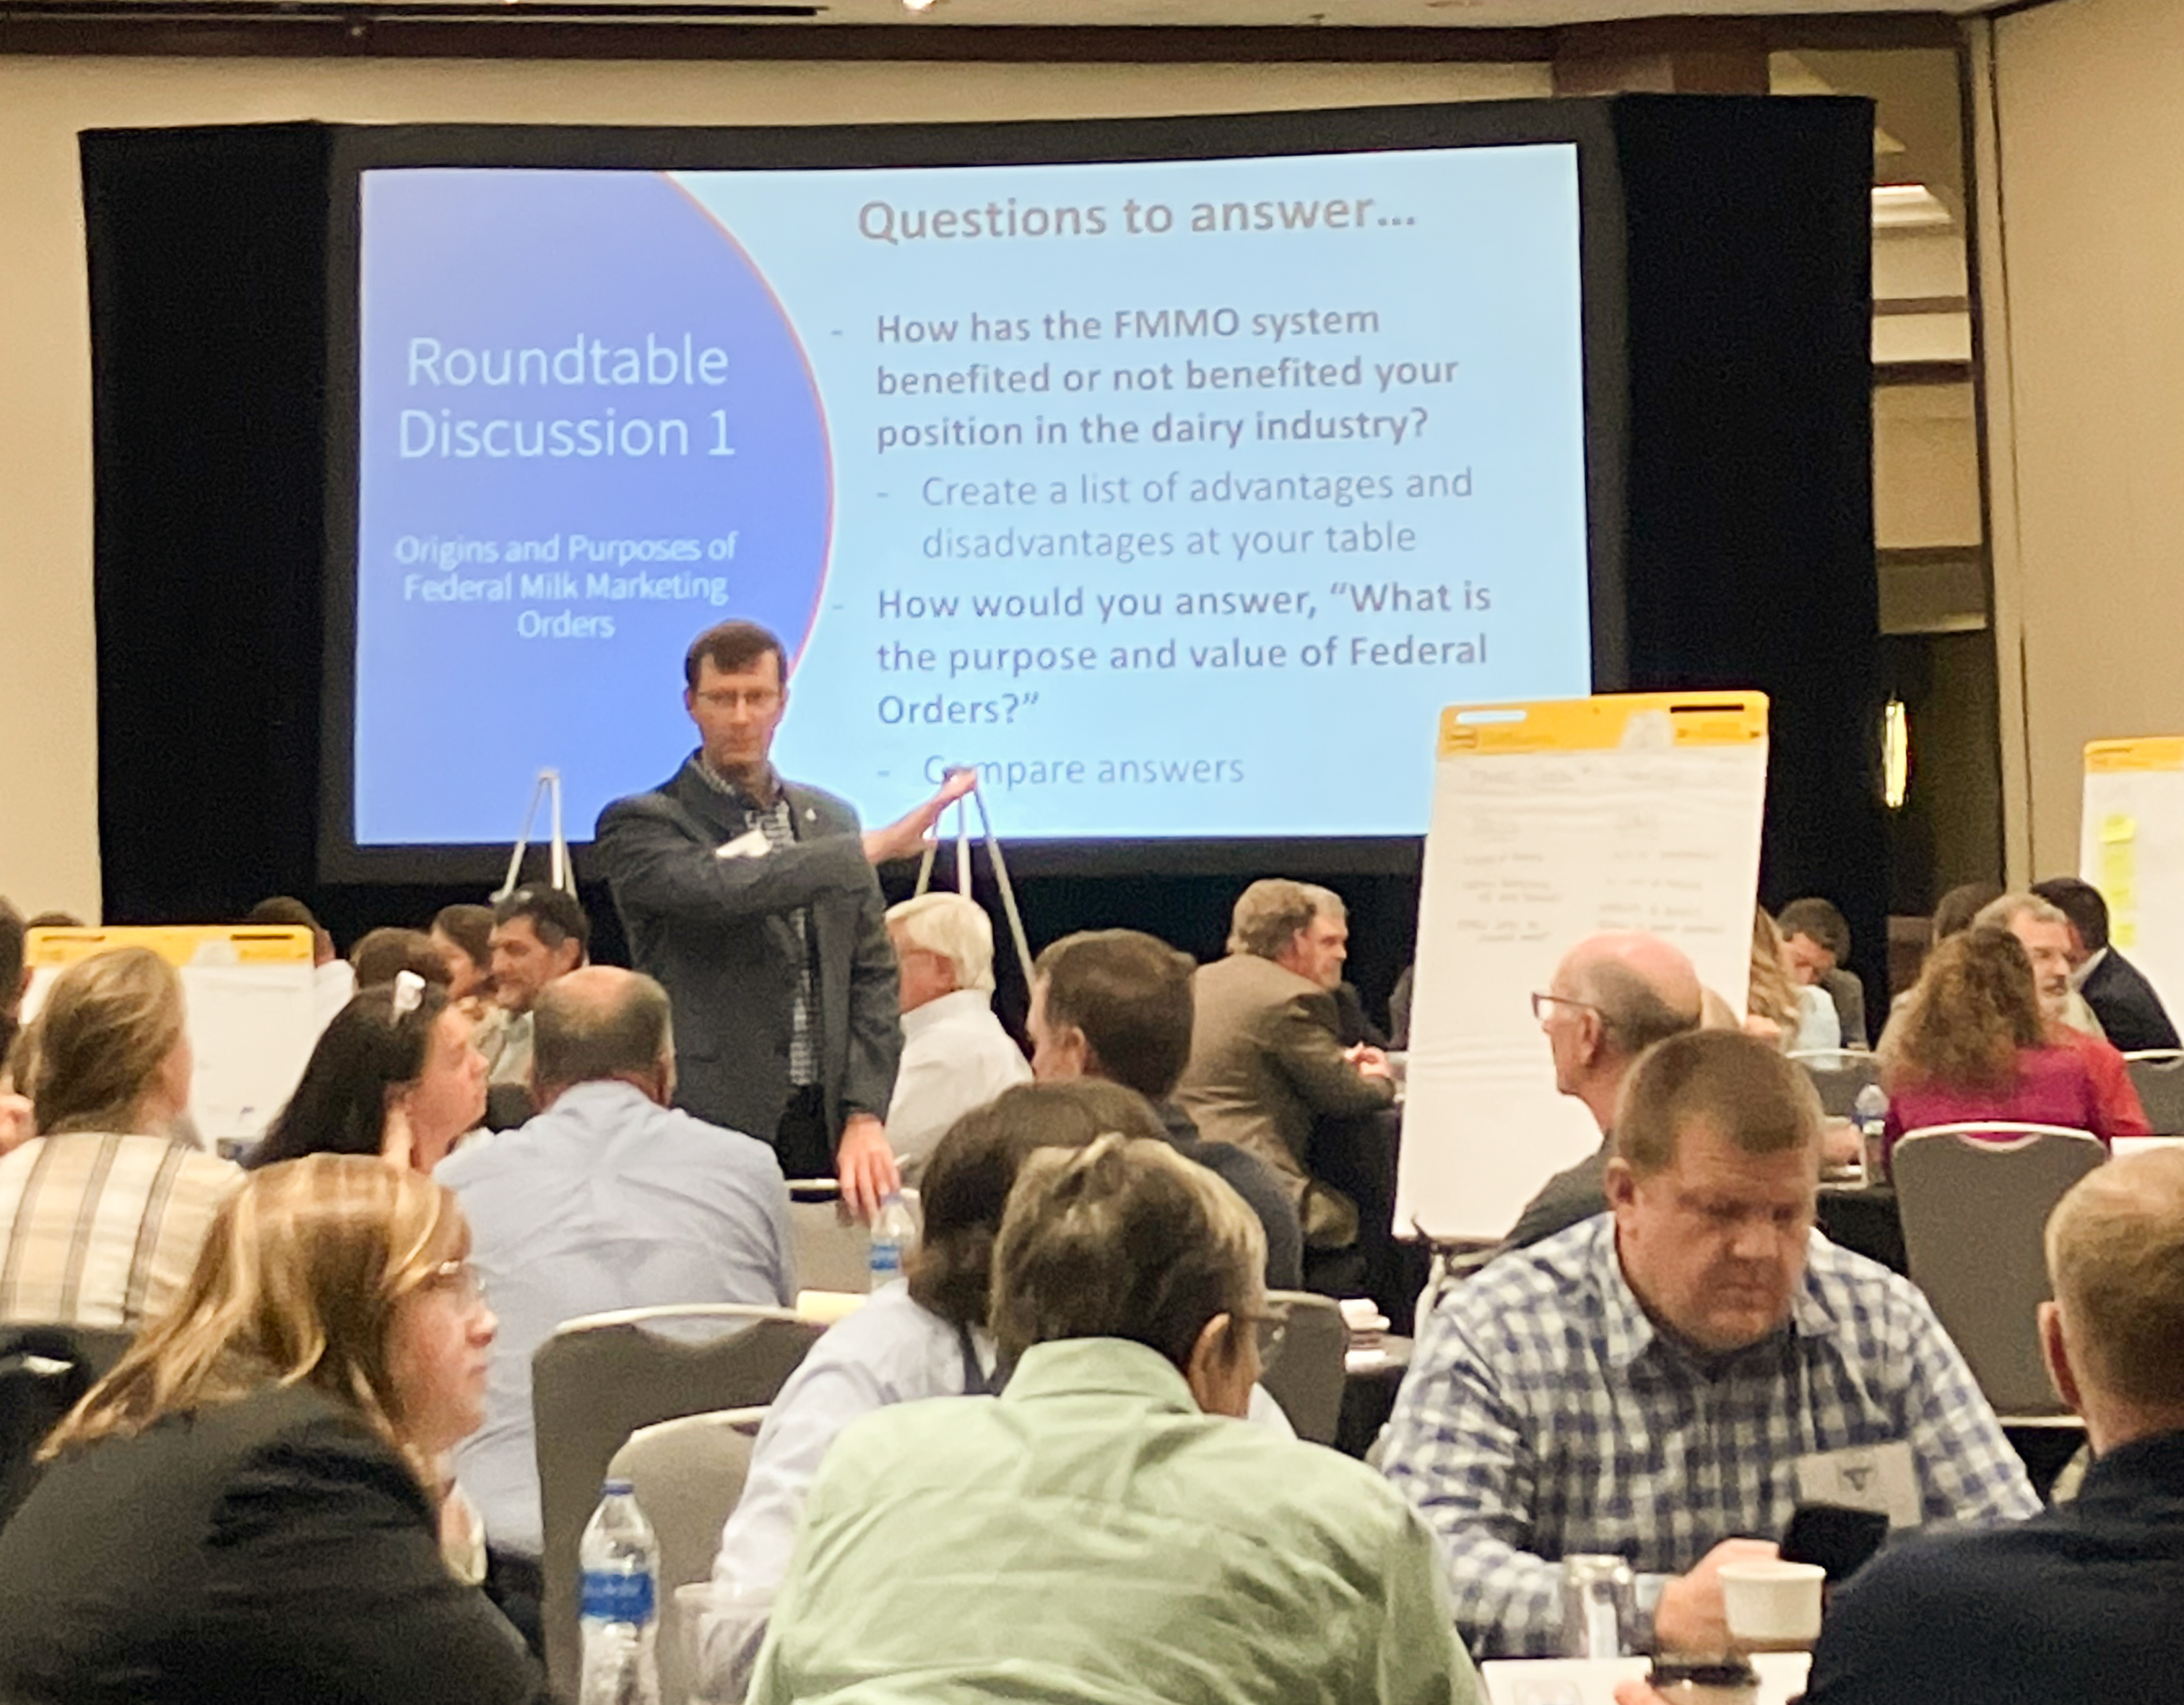
KANSAS CITY, Mo. — It was intense, productive, enlightening, and at times a bit emotional. And, yes, there was consensus on some key points during the American Farm Bureau Federation (AFBF) Federal Milk Marketing Order (FMMO) Forum in Kansas City last weekend (Oct. 14-16).
The event was a first of its kind meeting of the minds from across the dairy landscape, involving mostly dairy farmers, but also other industry stakeholders. It was planned by a 12-member committee representing state Farm Bureaus from coast-to-coast, working with AFBF economist Danny Munch.
Farm Bureau president Zippy Duvall kicked things off Friday afternoon, urging attendees to get something done for the future of the dairy industry, to stay cool, leave friendly, and set a pattern for continuing conversations.
“We have the people in this room who I hope can come up with guiding principles,” said Duvall, noting that a meeting like this is something he has dreamed about for years, even prayed for. He talked about his background as a former dairy farmer and assured attendees that milk pricing is a topic he is very interested in.
He challenged the group to come at it with “an open mind. The answers are sitting in this room, not on Capitol Hill. There are some geniuses in this room, people who really understand this system,” said Duvall.
“We all have ideas, and we can lend an ear to other ideas. We learn a lot if we listen to each other,” he said, noting a few of the existing Farm Bureau dairy policy principles: that FMMOs should be market oriented, with better price discovery. They should be fair and transparent, and farmers should be able to understand and compare milk checks.
Hearings not legislation
Duvall noted AFBF agrees with NMPF that future FMMO changes should go through the normal USDA hearing process, not through Congressional legislation. By Sunday, this seemed to be a point of consensus, along with the recognition that FMMOs need updating, but they are still vital for farmers and the industry.
On the Class I ‘mover,’ specifically, Munch noted Farm Bureau already adopted the recommendation through its county, state and national grassroots process to return to the ‘higher of’ — plus 74 cents. The addition of the 74 cents is to make up for the unlimited losses incurred over the past four years.
For NMPF’s part, chief economist Peter Vitaliano and consultant Jim Sleper laid out a series of updates the economic committee’s task force is recommending to the NMPF board, which will vote at the annual meeting at the end of October.
These recommendations include going back to the simple ‘higher of’ for the Class I ‘mover,’ updating make allowances and yield factors, doing a pricing-surface study to update Class I differentials, making changes in the end-product pricing survey to allow dry whey price reporting of sales up to 45 days earlier, not 30 days, and eliminating the 500-pound barrel cheese sales from the Class III cheese price formula to base it only on the block cheese.
Intense, informative, valuable
The three days were intense, covering a lot of information, and were shepherded by expert panels and ‘cat herder in chief’ Roger Cryan, AFBF’s chief economist since October 2021.
Munch served as the emcee — akin to the ghost of milk pricing Past (Friday), Present (Saturday) and Future (Sunday). He introduced the various panels and provided economic snapshots and questions for the 25 breakout tables to discuss, decide and deliver.
Meeting organizers reshuffled the deck of 200 attendees from 36 states and representing nearly 150 state and national producer organizations, Farm Bureau chapters, regulatory agencies, farms, co-ops, processors, financial and risk management firms, and university extension educators.
Attendees were assigned tables with a number on the back of each name tag. The goal was to mix the table-groupings for varied geographic and industry perspectives. Each table was equipped with its own large flip tablet mounted on an easel.
According to Munch, Farm Bureau will scan and collate the information from all of the large tablets and issue a preliminary report to attendees followed by a public report later this year.
On Sunday, the open microphone was lively and most tables reported from their flip tablets. Overwhelmingly, attendees said they found value in the meeting and appreciated the platform. They reported a desire to keep the conversations going, to do this again, not just every 20 years, and not just in response to a problem, but to be forward-looking with the many challenges on the dairy horizon.
Platform for next big issue
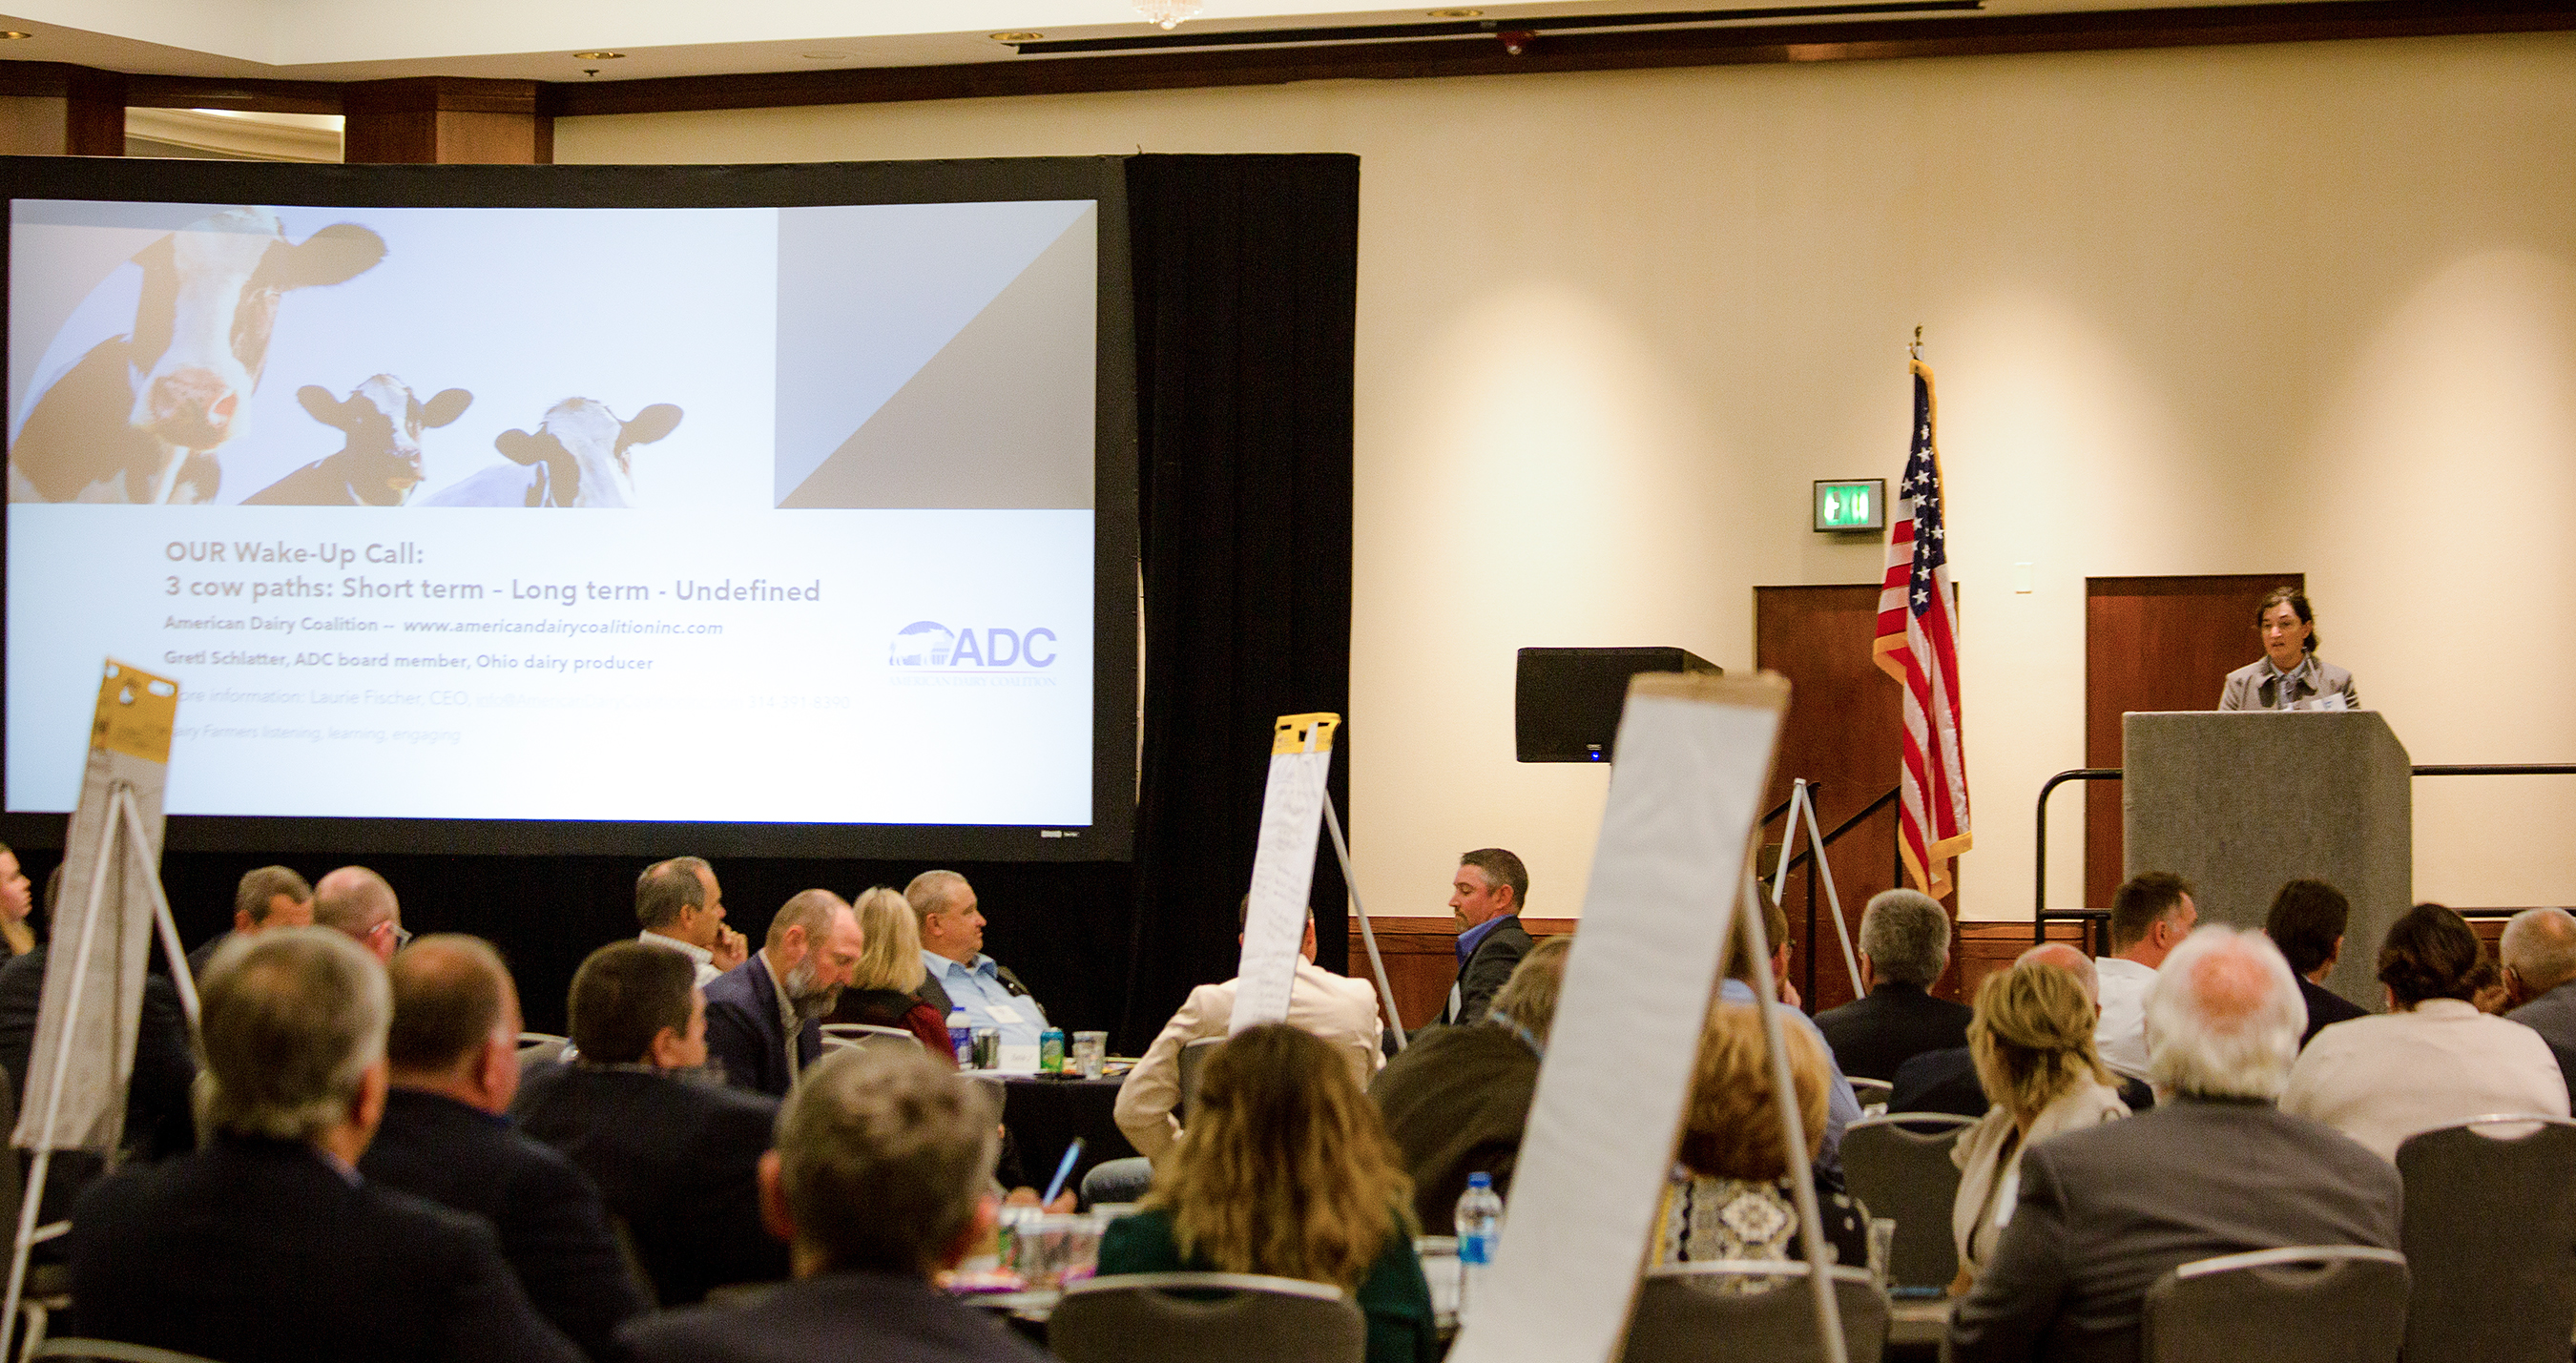
For example, Gretl Schlatter, an Ohio dairy producer on the board of American Dairy Coalition (ADC) noted that only Class I milk is mandated to participate in FMMOs, and that today, the FMMOs are weakened with only 60% of U.S. milk production participating in the revenue-sharing pools.
“Where will we be in five years? We do not want to give up on fluid milk – our nutrition powerhouse,” she said. “The issue now is federal milk pricing but the next one coming — fast — is the sustainability benchmarks, the climate scores. We need to keep meeting like this as an industry, keep talking to each other, and get ready for the next big thing affecting our farms and family businesses.”
This was touched upon by Duvall and others, but Cryan reminded everyone that, “Federal Orders are complicated enough without adding the sustainability discussion to it.”
Duvall reminded attendees that this meeting was Farm Bureau’s response to the words of Ag Secretary Tom Vilsack last year, when he said there would be no USDA hearing until the dairy industry reaches some “consensus” on solutions.
This set into motion an already dairy-active Farm Bureau that had formed its own task force, responding to grassroots dairy policy coming up from the county and state levels to national through AFBF’s grassroots process.
In fact, NMPF’s Vitaliano, noted that, “having Roger Cryan at Farm Bureau makes it easier to do this,” to partner on formulating dairy policy because of his background. Prior to coming to Farm Bureau a year ago, Cryan was an economist for NMPF and then for USDA AMS Dairy Programs.
The first hour of the first day included a recorded message from Secretary Vilsack and an in-person presentation by Gloria Montano Green, USDA deputy undersecretary for Farm Production and Conservation.
They encouraged attendees to work together and told them what the Biden-Harris administration has done and is doing for dairy. Primarily, they went through a list of funding and assistance, including the improved Dairy Margin Coverage, the PMVAP payments, Dairy Revenue Protection, Livestock Gross Margin, dairy innovation hub grants and the recent funding for conservation and climate projects that includes 17 funded pilots involving dairy.
They told attendees that the dairy industry is “far ahead” on climate and conservation because it has been involved in these discussions and is already mapping that landscape.
Dana Coale, deputy administrator of USDA AMS Dairy Programs, took attendees through the FMMO parameters. She engaged with the largely dairy farmer crowd in a frank discussion of what Federal Orders can and cannot do. The headline here is that this current time period before a hearing is a time when she and her staff can talk freely and give opinions. Once a hearing process begins, she and her staff are subject to restrictions on ex parte communications.
Consensus to go back to ‘higher of’ formula
If there was one FMMO “fix” that achieved a clear consensus and was given priority, it was support for going back to the Class I ‘mover’ formula using the ‘higher of’ Class III or IV skim price instead of the current average plus 74 cents method that was changed in the 2018 farm bill.
Since implementation in May 2019 through October 2022, the new method will have cost dairy farmers $868 million in net reduced Class I revenue, which further erodes the mandatory Class I contribution to the uniform pricing among the 11 Federal Milk Marketing Orders (FMMO), setting off a domino effect that has led to massive de-pooling of milk from FMMOs and decreased Federal Order participation.
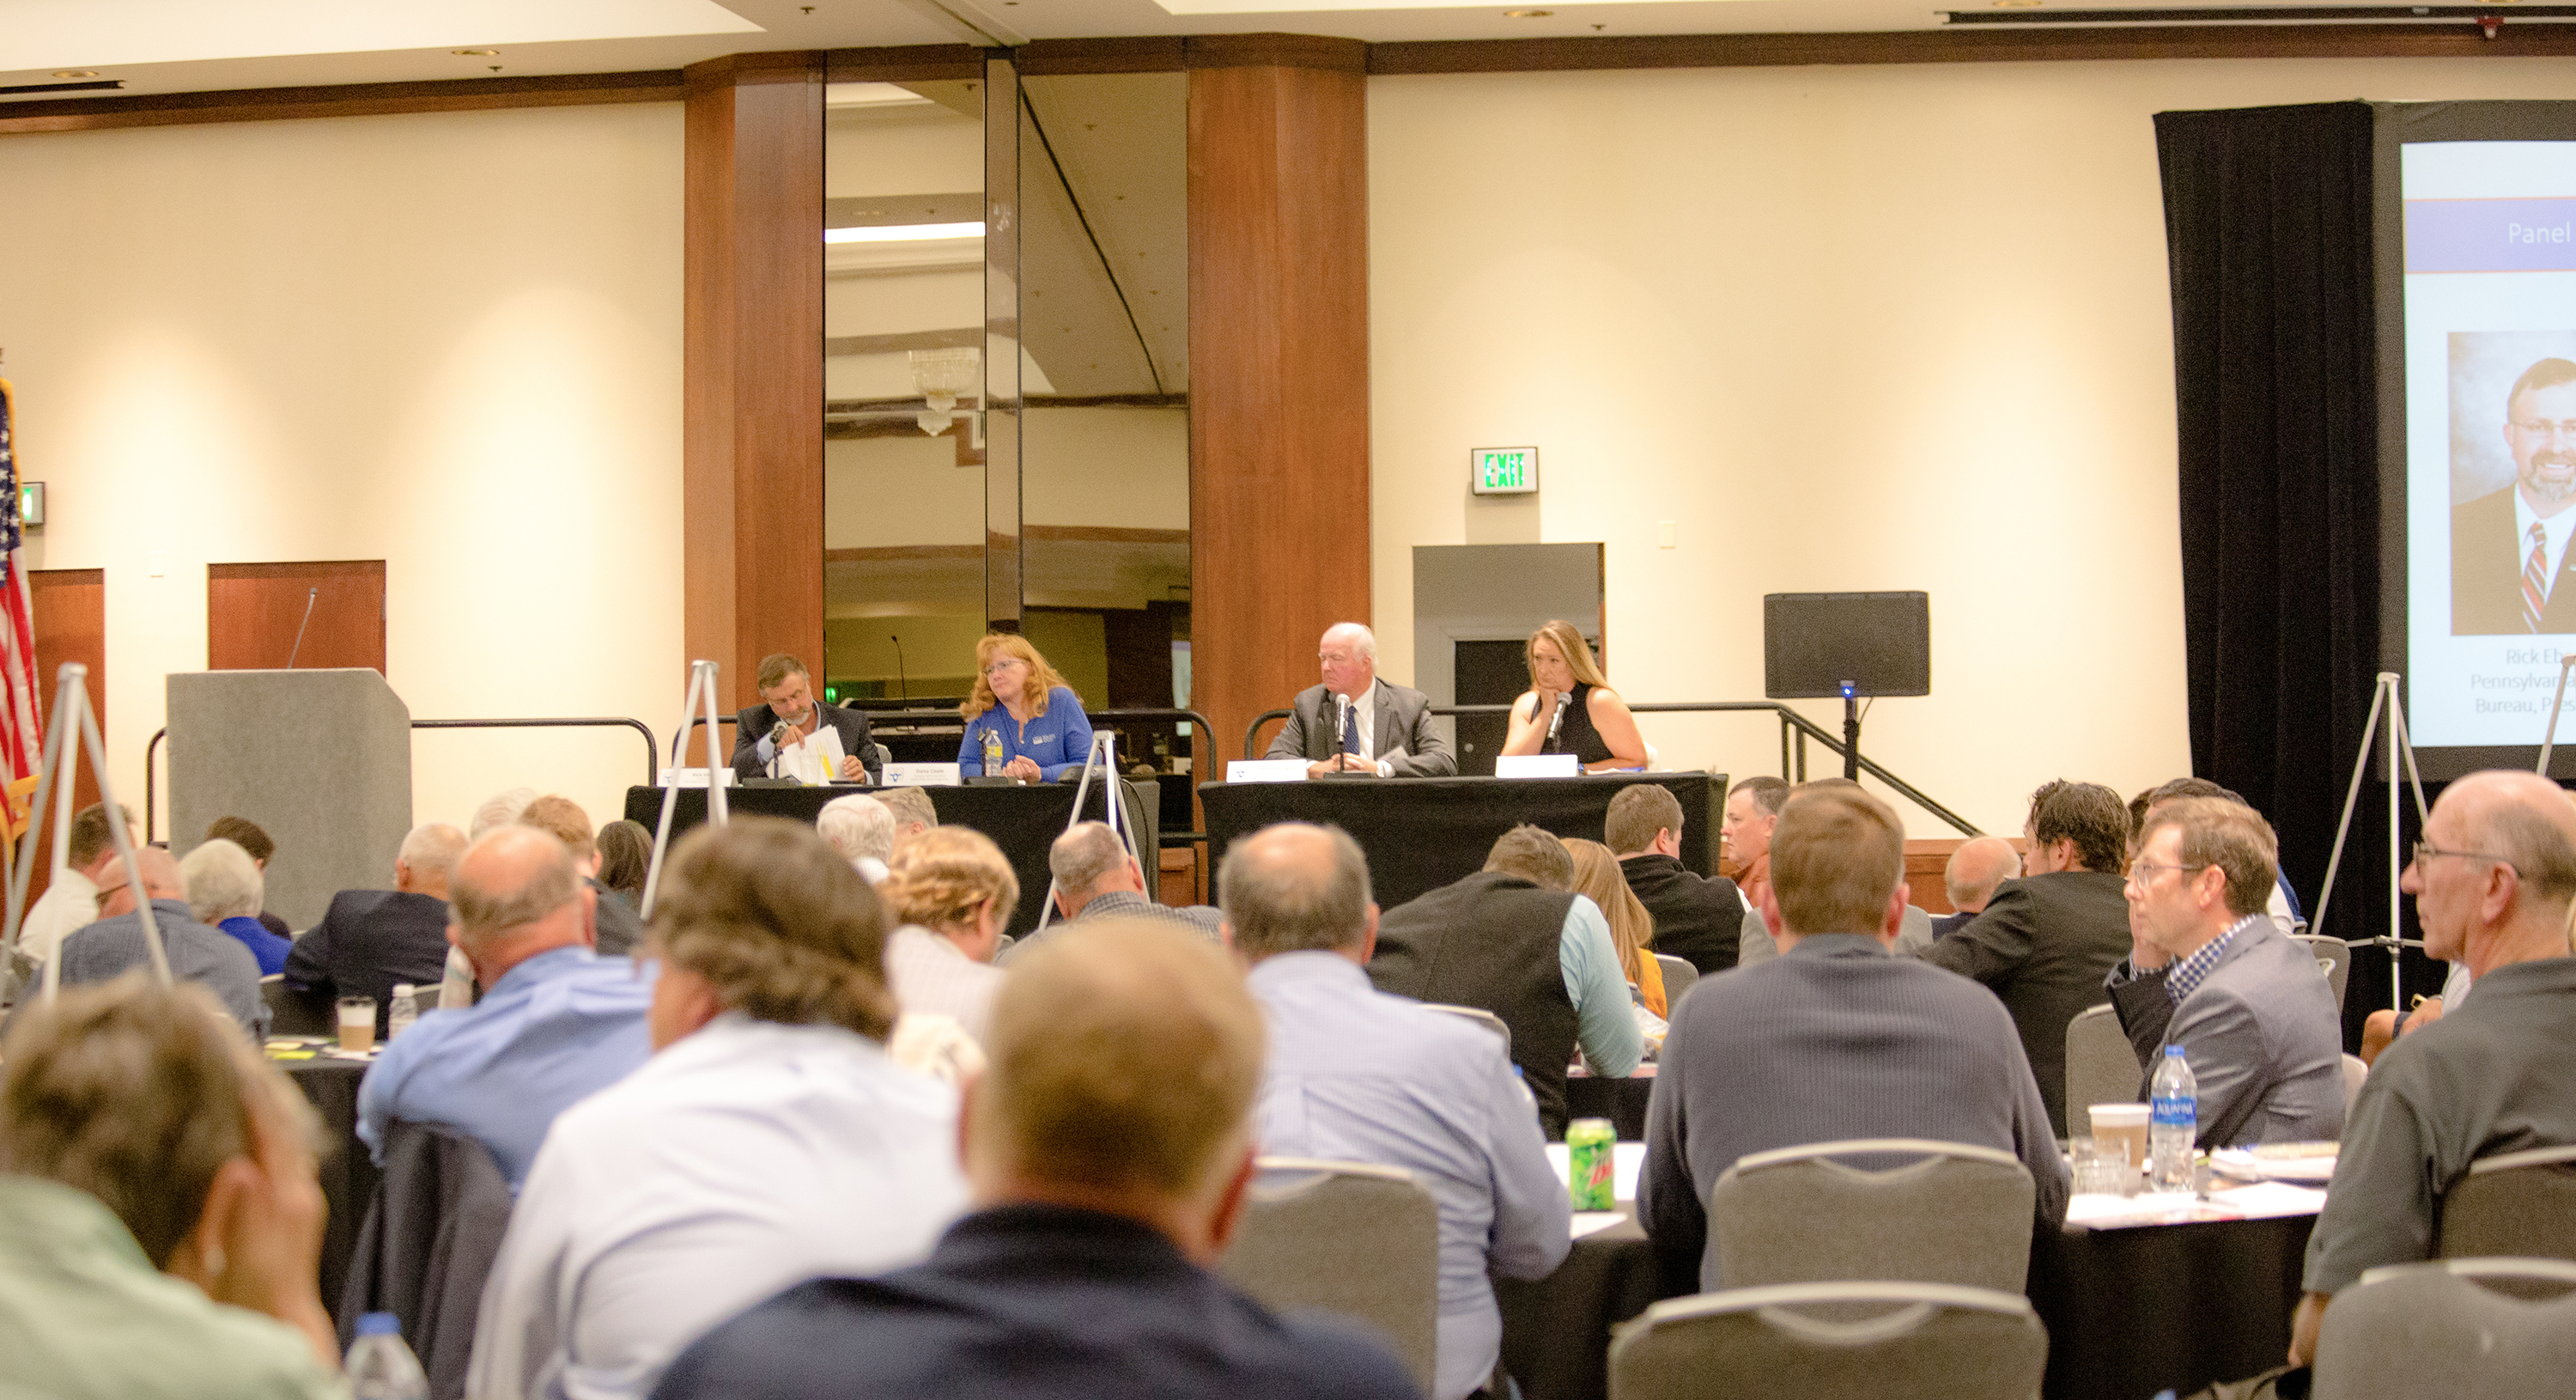
Pa. Farm Bureau presiden Rick Ebert (left), moderated the first panel Friday afternoon (l-r) Dana Coale, deputy administrator USDA AMS Dairy Programs; Calvin Covington, CEO emeritus, Southeast Milk; Anja Raudabaugh, CEO Western United Dairies. After this panel, during the first open-microphone and roundtable breakout, attendees were urged not to leave their flip tablets blank. “Groups with blank boards will have to drink the almond juice in the back,” said AFBF economist Danny Munch, taking note of the hotel offering and to have real milk on-site — provided Saturday and Sunday by Hiland Dairy.
During his presentation Friday, retired Southeast Milk CEO, Calvin Covington, said dairy farmers lost $69 million in revenue for the first 8 months of post-Covid 2022, alone. That figure will rise to an estimated $200 million when September and October Class I milk pounds are tallied.
Noting NMPF’s task force recommends the board approve petitioning USDA to go back to the ‘higher of,’ Vitaliano cited “asymmetric risk” as the reason.
This risk scenario was also explained by others. ADC’s Schlatter, for example, noted the current averaging formula “caps the upside at 74 cents, but the downside is unlimited.”
Vitaliano noted that whenever there is a ‘black swan’ event or new and different market factors, this downside risk becomes unacceptable for farmers, and he indicated these market events that create wide spreads in manufacturing classes are likely to continue into the future.
Dr. Marin Bozic, University of Minnesota assistant professor of applied economics, observed the way this downside ‘basis’ risk becomes unmanageable via new and traditional risk management tools. In his futuristic talk on Sunday, producers asked questions, to which he responded that, “Yes, farmers show me that they can’t use the Dairy Revenue Protection because of this basis risk.”
Bozic is also founder and CEO of Bozic LLC developing and maintaining the intellectual property for risk management programs like DRP.
He also spoke about the concerns of the Midwest as FMMO participation declines.
Presenting his own ideas and separately the ideas of Edge Dairy Farmer Cooperativ, Bozic said Edge is seeking a consensus to support two or three lines in the upcoming farm bill to simply “enable” FMMO hearings to introduce flexibility on an Order by Order basis, so that uniform benefits can be shared instead of a uniform price. Flexibility, they believe, would enable new ‘uniform benefits’ discussion that can help maintain or encourage FMMO participation in marketing areas with low Class I utilization.
Early in the Class I formula loss scenario of 2020-21, Edge had suggested a new Class III-plus formula to determine the ‘mover.’ Bozic said that “the idea of returning to the ‘higher of’ is not a deal breaker for Edge in the short-term.”
Even Mike Brown, senior supply chain manager for Kroger, unofficially indicated IDFA “could be open to the idea” of reverting back to that previous ‘higher of’ formula. As dairy supply chain manager on everything from Kroger’s milk plants to its new dairy beverages, cheese procurement, and so forth, Brown was asked if the averaging formula allowed him to ‘hedge’ fluid milk to manage risk as a processor.
The answer? Not really. Brown said there are ways for processors to manage risk under the ‘higher of’ formula also, but that they haven’t done any hedging under the averaging formula with fresh fluid milk – and very little risk management with their new aseptically packaged, shelf-stable milks and high protein drinks.
Incidentally, he said, the aseptic, ultrafiltered, shelf-stable dairy beverage category “is growing faster than plant-based” in their retail sales.
This exchange and other discussions suggested the averaging formula may have been geared more toward price stability that would encourage processors to invest in expensive aseptic, ultrafiltered and shelf-stable milk-based beverage technologies that result in a storable product needing risk management.
Fresh fluid milk is already advance-priced and quite perishable with a fast turnaround. Aseptic, ultrafiltered and shelf-stable products, on the other hand, can be packaged under one set of raw milk pricing conditions and sold to retail or consumers up to nine months later under another set of raw milk pricing conditions.
Frankly, it appears that the consumer-packaged goods companies (CPGs) may be driving such shifts, just as we heard from Phil Plourde of Blimling/Ever.Ag that CPGs are “all-in” on the climate scoring — the next big thing on the dairy challenge list.
Tacking de-pooling – regional or national?
Attendees came back to the specific concern about de-pooling, which Vitaliano and Cryan both described as an issue to be handled regionally and not through a national hearing.
This did not seem to satisfy some who raised the concern. Toward the conclusion Sunday, Cryan explained it this way:
“De-pooling is a national issue in principle but a regional issue in detail. Every region will have different ideas, needs and situations. If there is consensus (on pooling rules) in a region, then changes could move forward quickly,” he said.
Make allowances are sticky wicket
Attendees appeared to agree that make allowances should be addressed or evaluated through a hearing, but ideas on how to handle this sticky-wicket varied.
Attendees questioned panelists, pointing out that if a farmer’s profit margin on milk is only around $1.00 per hundredweight, then raising make allowances an estimated $1.00 per hundredweight is going to be a tough pill to swallow.
Vitaliano said NMPF is commissioning an economic study with their go-to third-party economist Scott Brown at University of Missouri to show the actual milk check impact of raising make allowances that are embedded into the end-product pricing formulas for the four main products: cheddar, butter, nonfat dry milk and dry whey.
He said the discussions about make allowances as a cost to farmers are “purely arithmetic” but that the “true impact” is not a straight math calculation. Instead, he said, when make allowances are set appropriately, dairy producers ultimately benefit, so in his opinion, it’s not a penny for penny subtraction.
Several other panelists and attendees observed that processors and cooperatives have been creating their own ‘make allowances’ through assessments, loss of premiums, and other milk check adjustments.
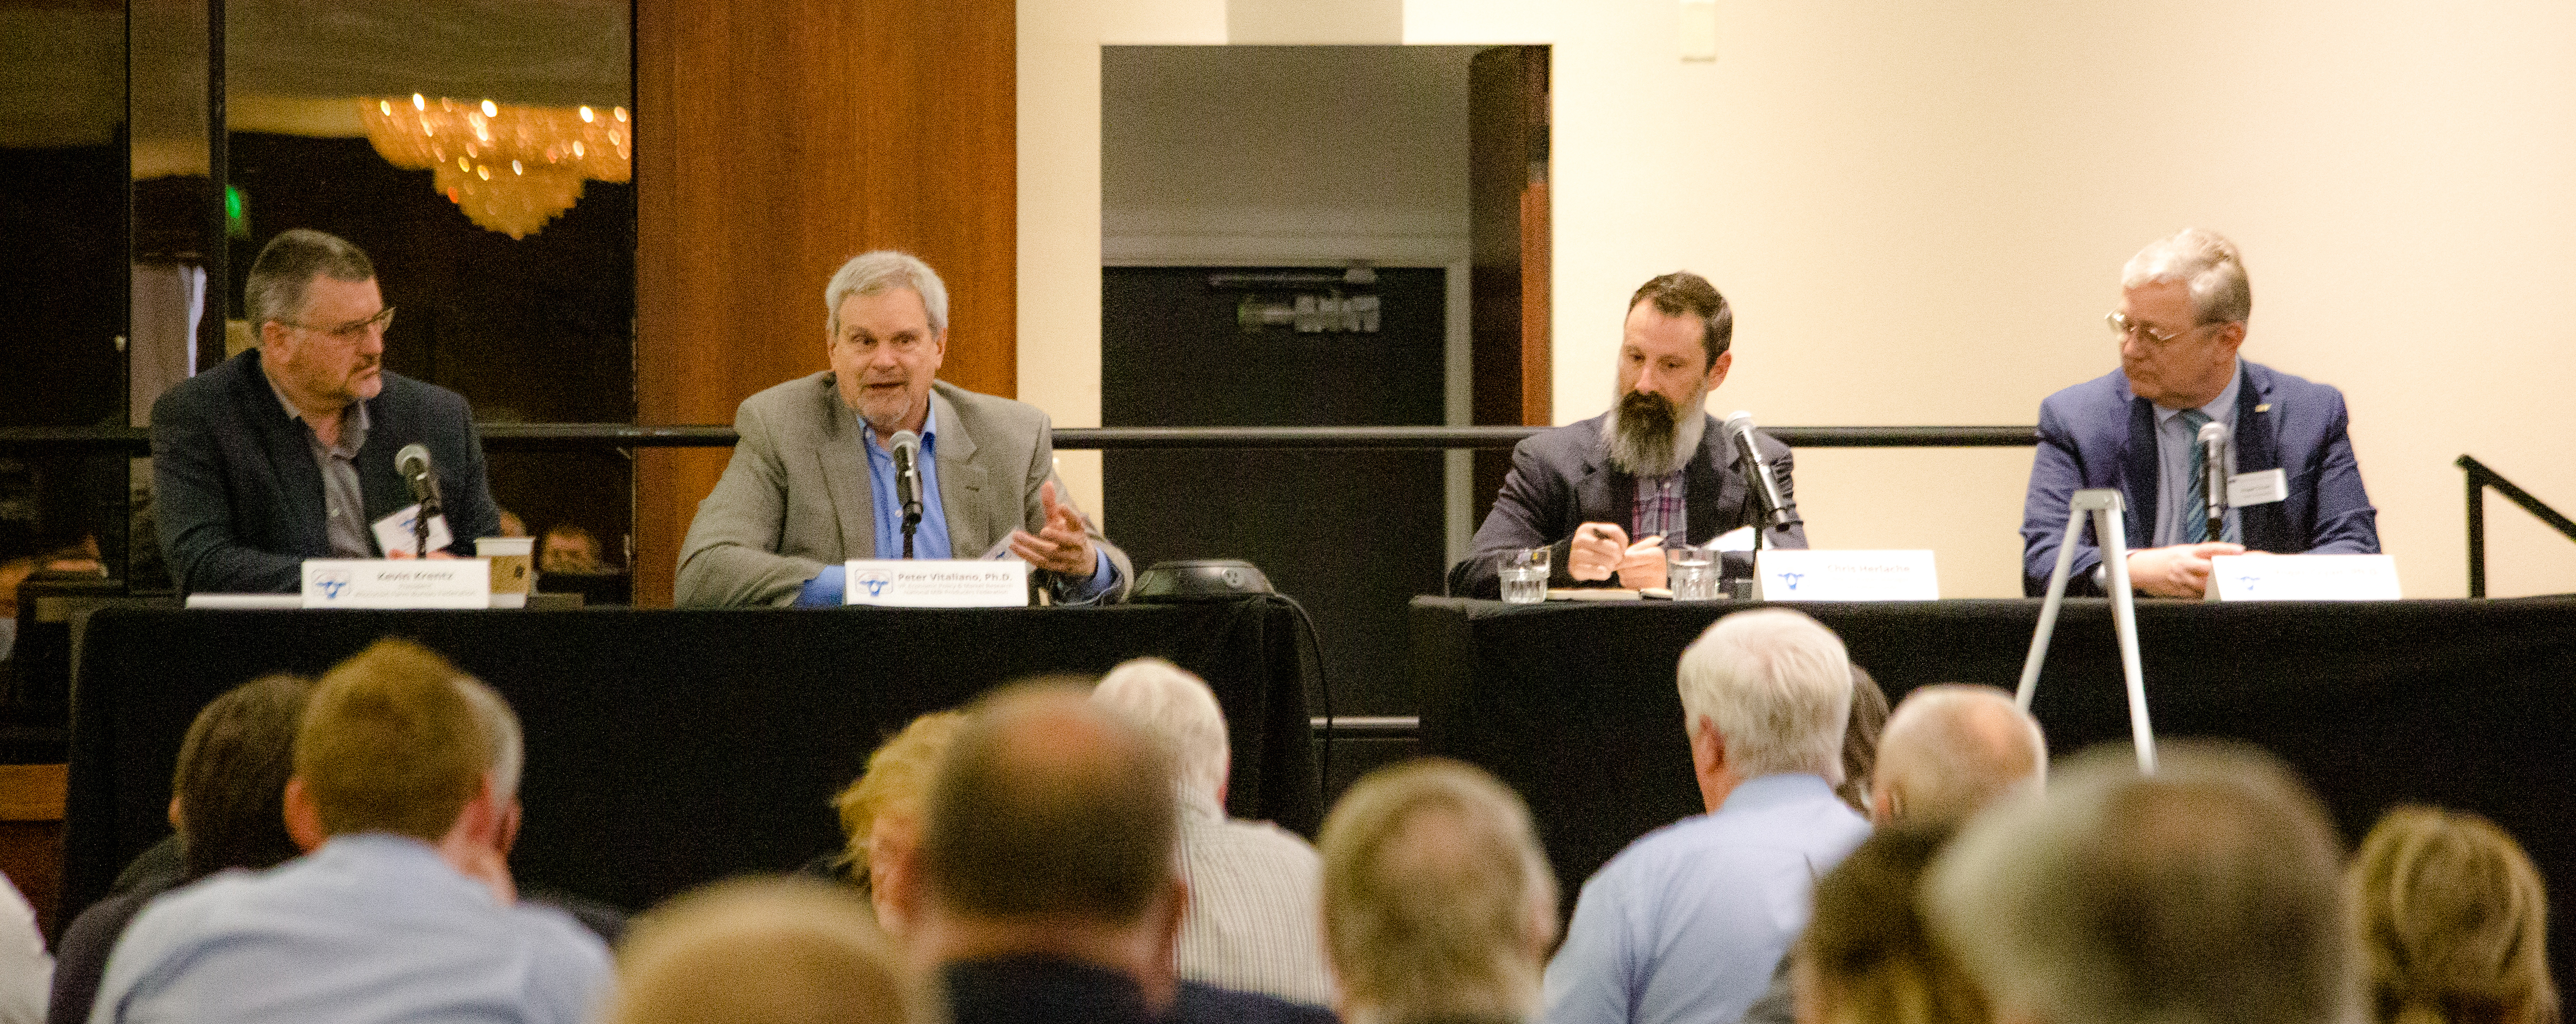
The Saturday afternoon panel of (l-r) Kevin Krentz, Peter Vitaliano, Chris Herlache, and Roger Cryan dove into Class III and IV pricing topics including make allowance formulations and structures.
Vitaliano stressed that when make allowances are set properly, the industry is stronger and better able to compensate producers. Initially, he said, raising make allowances would have a negative impact on expansion, which in turn would have a positive impact on producer prices.
When asked if raising make allowances would mean lost premiums would return to farmer milk checks, he responded by saying “that depends, and it won’t happen right away.”
In other words, raising make allowances will be painful in the short term, but in the long-term (to paraphrase) that pain leads to gain.
Some panelists and attendees referenced an idea of “phasing in” a future raise in make allowances.
Others wondered why it is necessary with the amount of innovation happening in the 15 years since they were last raised as processors make a wider variety of dairy products – not just those bulk items that are surveyed for end-product pricing formulas.
One idea suggested by a Wisconsin dairy producer was to tie make allowance increases to plant size — much the same way that dairy farmers are only assisted up to a production cap of 5 million annual milk pounds. Cryan said he heard a similar proposal previously to use a graduated scale for make allowance increases according to plant size and presumably age.
This is the crux of the make allowance issue because the new state of the art plants produce many types of products, both commodity and value-added; whereas some of the smaller and older plants that are still vital to the dairy industry are more apt to specialize in producing a bulk commodity with a more limited foray into value-added non-surveyed products.
Modified bloc voting?
While there appeared to be consensus that changes to the FMMOs should be done by USDA petition through the administrative hearing process, not through Congressional legislation, some of the discussion at tables and the open-microphone noted the importance of a producer vote after hearings and USDA final decisions. Many felt farmers should have an individual vote on FMMO changes.
Currently, cooperatives bloc vote for their members to assure that FMMOs are not ended inadvertently by lack of producer interest in following-through on a vote.
One compromise suggested by Bozic was to have a preliminary non-binding vote by individual producers, followed by the binding vote done in its usual way.
This, he said, would at least increase accountability and transparency in the FMMO voting process and bring producer engagement into the FMMO hearing process. To be continued
WASHINGTON — Against the backdrop of declining fluid milk sales, declining Federal Milk Marketing Order (FMMO) participation, coinciding with the accelerated pace of plant mergers, acquisitions and closures in the fluid milk sector, farm bill milk pricing reform discussions are bubbling up.
The two main issues are the negative impact from the Class I price formula change in the last farm bill, and how to ‘fix it,’ as well as how to handle or update processor ‘make allowances’ that are embedded within the Class III and IV price formulas.
Other issues are also surfacing regarding the pricing, marketing, and contracting of milk within and outside of FMMOs as historical pricing relationships become more dysfunctional — in part because of the Class I change.
The change in the Class I price mover formula was made in the 2018 farm bill and implemented in May 2019. It has cost dairy farmers an estimated $132 million in lost revenue so far in 2022 — increasing the accumulated net loss to $824 million over these 41 months that the new average-plus-74-cents method has replaced 19 years of using the vetted ‘higher of’ formula.
The change was made by Congress in the last farm bill in the belief that this averaging method would allow processors, retailers and non-traditional milk beverage companies to manage their price risk through hedging while expecting the change to be revenue-neutral to farmers. No hearings or referendums were conducted for this change.
Instead of being revenue-neutral for farmers, the new method has significantly shaved off the tops of the price peaks (graph) and only minimally softened the depth of the price valleys, while returning net lower proceeds to farmers and disrupting pricing relationships to cause further farm mailbox milk check losses in reduced or negative producer price differentials (PPD), reduced FMMO participation (de-pooling) as well as disruption in the way purchased price risk management tools perform against these losses.
In 2022, we are seeing this Class I ‘averaging’ method produce even more concerning results. It is now undervaluing Class I in a way that increases the depth of the valley the milk markets have entered in the past few months (graph), and as the Class IV milk price turned substantially higher this week against a flat-to-lower Class III price, the extent of the market improvement will be shaved in the blend price by the impact on Class I from what is now a $2 to $5 gap between Class III and Class IV milk futures through at least November.
During the height of the Covid pandemic in 2020, the most glaring flaw in the Class I formula change was revealed. Tracking the gains and losses over these 41 months, it’s easy to see the problem. This new formula puts a 74-cents-per-cwt ceiling on how much farmers can benefit from the change, but it fails to put a floor on how much farmers can lose from the change.
The bottomless pit was sorely tested in the second half of 2020, when the Class III and IV prices diverged by as much as $10, creating Class I value losses under the new formula as high as $5.00/cwt.
The bottomless pit is being tested again in 2022. The most recent Class I mover announcements for August and September are undervalued by $1.04 and $1.69, respectively, as Class IV and III have diverged by as much as $4 this year.
In fact, 6 of the first 9 months of 2022 have had a lower Class I milk price as compared to the previous formula. The September 2022 advance Class I mover announced at $23.82 last week would have been $25.31 under the previous ‘higher of’ formula.
This is the largest loss in value between the two methods since December 2020, when pandemic disruptions and government cheese purchases were blamed for the poor functionality of the new Class I formula.
No such blame can be attributed for the 2022 mover price failure that will have cost farmers $132 million in the first 9 months of 2022 on Class I value, alone, as well as leading to further impacts from reduced or negative PPDs and de-pooling.
The graph tells the story. The pandemic was blamed for 2020’s largest annual formula-based loss of $733 million. This came out to an average loss of $1.68/cwt on all Class I milk shipped in 2020.
These losses continued into the first half of 2021, followed by six months of gains. In 2021, the net gain for the year was $35 million, or 8 cents/cwt., making only a small dent in recovering those prior losses.
Gains from the averaging formula were expected to continue into 2022, but instead, Class IV diverged higher than Class III in most months by more than the $1.48 threshold. Only 2 months in 2022 have shown modest Class I mover gains under the new formula, with the other 7 months racking up increasingly significant value losses – a situation that is expected to continue at least until November, based on current futures markets.
Bottomline, the months of limited gains are not capable of making up for the months of limitless loss, and now the hole is being dug deeper.
True, USDA made pandemic volatility payments to account for some of the 2020 FMMO class price relationship losses. Those payments were calculated by AMS staff working with milk co-ops and handlers using FMMO payment data.
However, USDA only intended to cover up to $350 million of what are now $824 million in cumulative losses attributed directly to the formula change.
Furthermore, USDA capped the amount of compensation an individual farm could receive, even though there was no cap on the amount the new formula may have cost that farm, especially if it led to reduced or negative PPDs, de-pooling, and as a result, negatively impacted the performance price risk management tools the farm may have purchased.
The estimated $824 million net loss over 41 months equates to an estimated average of 58 cents/cwt loss on every hundredweight of Class I milk shipped in those 41 months.
Using the national average FMMO Class I utilization of 28%, this value loss translates to an average loss to the blend price of 16 cents/cwt for all milk shipped over the 41 months, but some FMMOs have seen steeper impacts where Class I utilization is greater.
This 16-cent average impact on blend price may not sound like much, but over a 41-month period it has hit mailbox milk prices in large chunks of losses and smaller pieces of gains, which impact cash flow and performance of risk management in a domino effect.
The 2022 divergence has been different from 2020 because this year it is Class IV that has been higher than Class III. During the pandemic, it was the other way around.
Because cheese milk is such a driver of dairy sales nationwide, the FMMO class and component pricing is set up so that protein is paid to farmers in the first advance check based on the higher method for valuation of protein in Class III. Meanwhile, other class processors pay into the pool using a lower protein valuation method, so the differences are adjusted based on utilization in the second monthly milk check.
This means when Class III is substantially higher than Class IV, as was the case in 2020-21, there is even more incentive for manufacturers to de-pool milk out of FMMOs compared to when Class IV is higher than Class III.
The PPD, in fact, is defined mathematically as Class III price minus the FMMO statistical uniform blend. Usually that number is positive. In the last half of 2020 and first half of 2021, it was negative for all 7 multiple component pricing FMMOs, while the 4 fat/skim Orders saw skim price eroded by the variance.
Now, the situation is different because Class III has been the lowest priced class in all but one month so far in 2022. The milk being de-pooled — significantly in some orders and less so in others — is the higher-priced Class II and IV milk. The Class II price has surpassed the Class I mover in every settled month of 2022 so far — January through July — and the Class IV price also surpassed the Class I mover in 2 of those 7 months.
By Sherry Bunting, Farmshine (combined 2 part series Aug. 12 and 19, 2022)
In Class I utilization markets, the landscape is rapidly shifting, and we should pay attention, lest we end up with ‘cow islands’ and ‘milk deserts.’
Farmshine readers may recall in November 2019, I wrote in the Market Moos column about comments made Nov. 5 by Randy Mooney, chairman of both the DFA and NMPF boards during the annual convention in New Orleans of National Milk Producers Federation together with the two checkoff boards — National Dairy Board and United Dairy Industry Association.
Mooney gave a glimpse of the future in his speech that was podcast. (Listen here at 13:37 minutes). He said he had been “looking at a map,” seeing “plants on top of plants,” and he urged the dairy industry to “collectively consolidate,” to target limited resources “toward those plants that are capable of making the new and innovative products.”
One week later, Dean Foods (Southern Foods Group LLC) filed for bankruptcy as talks between Dean and DFA about a DFA purchase were already underway. It was the first domino right on the heels of Mooney’s comments, followed by Borden filing Chapter 11 two months later in January, and followed by three-years of fresh fluid milk plant closings and changes in ownership against the backdrop of declining fluid milk sales and an influx of new dairy-based beverage innovations, ultrafiltered and shelf-stable milk, as well as lookalike alternatives and blends.
The map today looks a lot different from the one described by Mooney in November 2019 when he urged the industry to “collectively consolidate.” The simultaneous investments in extended shelf-life (ESL) and aseptic packaging are also a sign of the direction of ‘innovation’ Mooney may have been referring to.
Two months prior to Mooney issuing that challenge, I was covering a September 2019 industry meeting in Harrisburg, Pennsylvania, where dairy checkoff presenters made it clear that the emphasis of the future is on launching innovative new beverages and dairy-‘based’ products.
Here is an excerpt from my opinion/analysis of the discussion at that time:
“While we are told that consumers are ditching the gallon jug (although it is still by far the largest sector of sales), and we are told consumers are looking for these new products; at the same time, we are also told that it is the dairy checkoff’s innovation and revitalization strategy to ‘work with industry partners to move consumers away from the habit of reaching for the jug and toward looking for these new and innovative products’ that checkoff dollars are launching.”
These strategy revelations foreshadowed where the fluid milk markets appear to be heading today, and this is also obvious from recent Farmshine articles showing the shifting landscape in cow, farm, and milk production numbers.
When viewing the picture of the map that is emerging, big questions come to mind:
Are today’s Class I milk markets under threat of becoming ‘milk deserts’ as the dairy industry consolidates into ‘cow islands’?
Would dairy farmers benefit from less regulation of Class I pricing in the future so producers outside of the “collectively consolidating” major-player-complex are freer to seek strategies and alliances of their own, to carve out market spaces with consumers desiring and rediscovering fresh and local, to put their checkoff dollars toward promotion that helps their farms remain viable and keeps their regions from becoming milk deserts?
What role is the industry’s Net Zero Initiative playing behind the scenes, the monitoring, scoring, tracking of carbon, the way energy intensity may be viewed for transportation and refrigeration and other factors in Scope 1, 2 and 3 ESG (Environment, Social, Governance) scores?
Shelf-stable milk may provide solutions for some emerging (or are they self-inflicted?) milk access and distribution dilemmas, and maybe one view of ESG scoring favors it? But ultimately it also means milk can come from cow islands to milk deserts — from anywhere, to anywhere.
It also becomes clearer why the whole milk bill is having so much trouble moving forward. The industry machine gives lip-service support to the notion of whole milk in schools, but the reality is, the industry is chasing other lanes on this highway to ‘improve’ the school milk ‘experience’ and ensure milk ‘access’ through innovations that at the same time pave the road from the ‘cow islands’ to the ‘milk deserts.’
It is now clearer — to me — why the Class I mover formula is such a hotly debated topic.
If major industry-driving consolidators are looking to transition away from turning over cow to consumer fresh, local/regional milk supplies by turning toward beverage stockpiles that can sit in a warehouse ‘Coca-Cola-style’ at ambient temperatures for six to 12 months, it’s no wonder the consolidators want the ‘higher of’ formula to stay buried. What a subversion that was in the 2018 Farm Bill.
In fact, if the industry is pursuing a transition from fresh, fluid milk to a more emphasis on shelf-stable aseptic milk, such a transition would, in effect, turn the federal milk marketing orders’ purpose and structure — that is tied to Class I fresh fluid milk — completely upside down.
Landscape change has been in motion for years, but let’s look at the past 6 years — Dean had already closed multiple plants and cut producers in the face of Walmart opening it’s own milk bottling plant in Spring 2018. The Class I ‘mover’ formula for pricing fluid milk — the only milk class required to participate in Federal Milk Marketing Orders — was changed in the 2018 Farm Bill that went into effect Sept. 2018. The new Class I mover formula was implemented by USDA in May 2019, resulting in net losses to dairy farmers on their payments for Class I of well over $750 million across 43 months since then.
(Side note: Under the formula change, $436 million of Class I value stayed in processor pockets from May 2019 through October 2019, alone. DFA purchased 44 Dean Foods plants in May 2019 and became by far the largest Class I processor at that time.)
These and other landscape changes were already in motion when Mooney spoke on Nov. 5, 2019 at the convention of NMPF, NDB and UDIA describing the milk map and seeing plants on top of plants and issuing the challenge to “collectively consolidate” to target resources to those plants that can make the innovative new products.
One week later, Nov. 12, 2019, Dean Foods filed for bankruptcy protection to reorganize and sell assets (mainly to DFA).
Since 2019, this and other major changes have occurred as consolidation of Class I milk markets tightens substantially around high population swaths, leaving in wake the new concerns about milk access that spur the movement toward ESL and aseptic milk. A chain reaction.
What does Mooney’s map look like today after his 2019 call for “collective consolidation” and the targeting of investments to plants that can make the innovative products, the plants that DMI fluid milk revitalization head Paul Ziemnisky told farmers in a 2021 conference call were going to need to be “dual-purpose” — taking in all sorts of ingredients, making all sorts of beverages and products, blending, ultrafiltering, and, we see it now, aseptically packaging?
In addition to the base of Class I processing it already owned a decade ago, the string of DFA mergers has been massive. The most recent acquisitions, along with exits by competitors, essentially funnel even more of the market around key population centers to DFA with its collective consolidation strategy and investments in ESL and aseptic packaging.
The South —
The 14 Southeast states (Maryland to Florida and west to Arkansas) have 29% of the U.S. population. If you include Texas and Missouri crossover milk flows, we are talking about 37% of the U.S. population.
The major players in the greater Southeast fluid milk market include DFA enlarged by its Dean purchases, Kroger supplied by Select and DFA, Prairie Farms with its own plants, DFA and Prairie Farms with joint ownership of Hiland Dairy plants, Publix supermarkets with its own plants, an uncertain future for four remaining Borden plants in the region as Borden has exited even the retail market in some of these states, and a handful of other fluid milk processors.
Just looking at the greater Chicago, Milwaukee, Green Bay metropolis, the population totals are a lake-clustered 6% of U.S. population. Given the recent closure by Borden of the former Dean plants in Chemung, Illinois and De Pere, Wisconsin, this market is in flux with DFA owning various supply plants including a former Dean plant in Illinois and one in Iowa with Prairie Farms having purchased several of the Dean plants serving the region.
In the Mideast, there is Coca Cola with fairlife, Walmart and Kroger among the supermarkets with their own processing, and DFA owning two former Dean plants in Ohio, two in Indiana, two in Michigan, and a handful of other bottlers.
In the West: DFA owns a former Dean plant in New Mexico, two in Colorado, two in Montana, one in Idaho, two in Utah, one in Nevada and one in California, as well as other plants, of course.
The Northeast —
This brings us to the Northeast from Pennsylvania to Maine, where 18% of the U.S. population lives, and where consolidation of Class I markets, especially around the major Boston-NYC-Philadelphia metropolis have consolidated rapidly against the backdrop of declining fluid milk sales and a big push by non-dairy alternative beverage launches from former and current dairy processors.
DFA owns two former Dean plants in Massachusetts, one in New York, all four in Pennsylvania, one in New Jersey. The 2019 merger with St. Alban’s solidified additional New England fluid milk market under DFA. In 2013, DFA had purchased the Dairy Maid plant from the Rona family in Maryland; in 2014, the prominent Oakhurst plant in Maine; and in 2017, the Cumberland Dairy plant in South Jersey.
More recently, DFA struck a 2021 deal with Wakefern Foods to supply their Bowl and Basket and other milk, dairy, and non-dairy brands for the various supermarket chains and convenience stores under the Wakefern umbrella covering the greater New York City metropolis into New Jersey and eastern Pennsylvania. This milk had previously been supplied by independent farms, processed at Wakefern’s own iconic Readington Farms plant in North Jersey, which Wakefern subsequently closed in January 2022.
The long and twisted tale begs additional questions:
As Borden has dwindled in short order from 14 plants to five serving the most populous region of the U.S. – the Southland — what will happen with the remaining five plants in Ohio, Kentucky, Georgia, Louisiana, and Florida? What will become of Elsie the Cow and Borden’s iconic brands and new products?
What percentage of the “collectively consolidated” U.S. fluid milk market does DFA now completely or partially own and/or control?
Will the “collective consolidation” in the form of closures, sales and mergers continue to push shelf-stable ESL and aseptic milk into Class I retail markets and especially schools… and will consumers, especially kids, like this milk and drink it?
What role are rising energy prices, climate ESG-scoring and net-zero pledges and proclamations playing in the plant closures and shifts toward fewer school and retail milk deliveries, less refrigeration, more forward thrust for shelf-stable and lactose-free milk, as well as innovations into evermore non-dairy launches and so-called flexitarian blending and pairing?
Looking ahead at how not only governments around the world, but also corporations, creditors and investors are positioning for climate/carbon tracking, ESG scoring and the so-called Great Reset, the Net Zero economy, there’s little doubt that these factors are driving the direction of fluid milk “innovation” over the 12 years that DMI’s Innovation Center has coordinated the so-called ‘fluid milk revitalization’ initiative — at the same time developing the FARM program and the Net Zero Initiative.
The unloading of nine Borden plants in five months under Gregg Engles, the CEO of “New Borden” and former CEO of “Old Dean” is also not surprising. Engles is referred to in chronicles of dairy history not only as “the great consolidator” but also as “industry transformer.”
In addition to being CEO of Borden, Engles is chairman and managing partner of one of the two private equity investment firms that purchased the Borden assets in bankruptcy in June 2020. Investment firms fancy themselves at the forefront of ESG scoring.
Engles is also one of only two U.S. members of the Danone board of directors. Danone, owner of former Dean’s WhiteWave, including Silk plant-based and Horizon Organic milk, has positioned itself in the forefront on 2030 ESG goals, according to its 2019 ‘one planet, one health’ template that has also driven consolidation and market loss in the Northeast.
There is plenty of food-for-thought to chew on here from the positives to the negatives of innovation, consolidation, and climate ESGs hitting full-throttle in tandem. These issues require forward-looking discussion so dairy farmers in areas with substantial reliance on Class I fluid milk sales can navigate the road ahead and examine all lanes on this highway that appears to be leading to cow islands and milk deserts.
LENEXA, Kan. — Milk marketings through Federal Milk Marketing Orders (FMMO) accounted for 60.5% of total U.S. milk production in 2021, according to USDA FMMO statistics.
Last week, the Market Administrator for the Central FMMO 32 released its semi-annual report painting a picture of these marketings in the form of milk totals and FMMO-marketed percentages at the county-level across the U.S. — using the month of December 2021 as the “snapshot.”
Ranked 11th in the nation, Lancaster County, Pennsylvania remains the only county east of the Mississippi River that is among the top 13 counties accounting for 25% of the milk marketed through FMMOs. Seven of those top 13 counties are in California, two in Arizona, and one each in Texas, Washington and Colorado.
Of the top 54 counties accounting for 50% of the milk marketed through the FMMO system in December, Franklin County, Pennsylvania is included, along with four counties in New York (St. Lawrence, Genessee, Wyoming and Cayuga counties), four in Michigan, 12 in Wisconsin, two in Minnesota, six in Texas, four in New Mexico, two in California, and one each in Indiana, Iowa, Colorado, Kansas, Washington and Oregon.
According to the Central FMMO Market Administrator’s report, “the origin of milk marketings (through FMMOs) remains highly concentrated.”
In fact, it became more concentrated as the 54 counties that accounted for 50% of FMMO milk marketings in December 2021 was 59 counties in December 2016.
Those 54 counties represent just 3.9% of the total 1395 counties that had any FMMO milk marketings.
The report tallied more than 67 million pounds of milk marketed in the month of December 2021 by each of those 54 largest FMMO counties. By contrast, 624 of the 1395 counties marketed less than one million pounds each in December 2021.
Of the 1395 counties marketing milk through FMMOs, 57 increased their FMMO-marketed milk pounds while 1139 counties decreased in December 2021.
Twice a year, the Central FMMO 32 collects this data from all FMMOs to create these maps depicting milk production by county across the U.S. These maps illustrate the concentration of milk marketed through FMMOs within the 11 FMMOs for December 2021.
Thus the accompanying charts and maps are monthly totals based on December 2021 FMMO milk marketings and are a ‘snapshot’ of milk production based on one month and based on milk marketed through FMMOs, not including the 39.5% of total U.S. milk production that was marketed outside of the FMMO system in 2021.