Covington’s Southeast milk market outlook: Higher prices for 2025; higher-fat milk sales also put more money in milk checks

Calvin Covington gave his dairy market outlook during the Georgia Dairy Conference in Savannah. Photo by Sherry Bunting

By Sherry Bunting, Farmshine, January 24, 2025

SAVANNAH, Ga. – Flat milk production volume, but with higher components, and a more unpredictable demand are factors new to the dairy industry that make price projections more difficult for the year ahead.

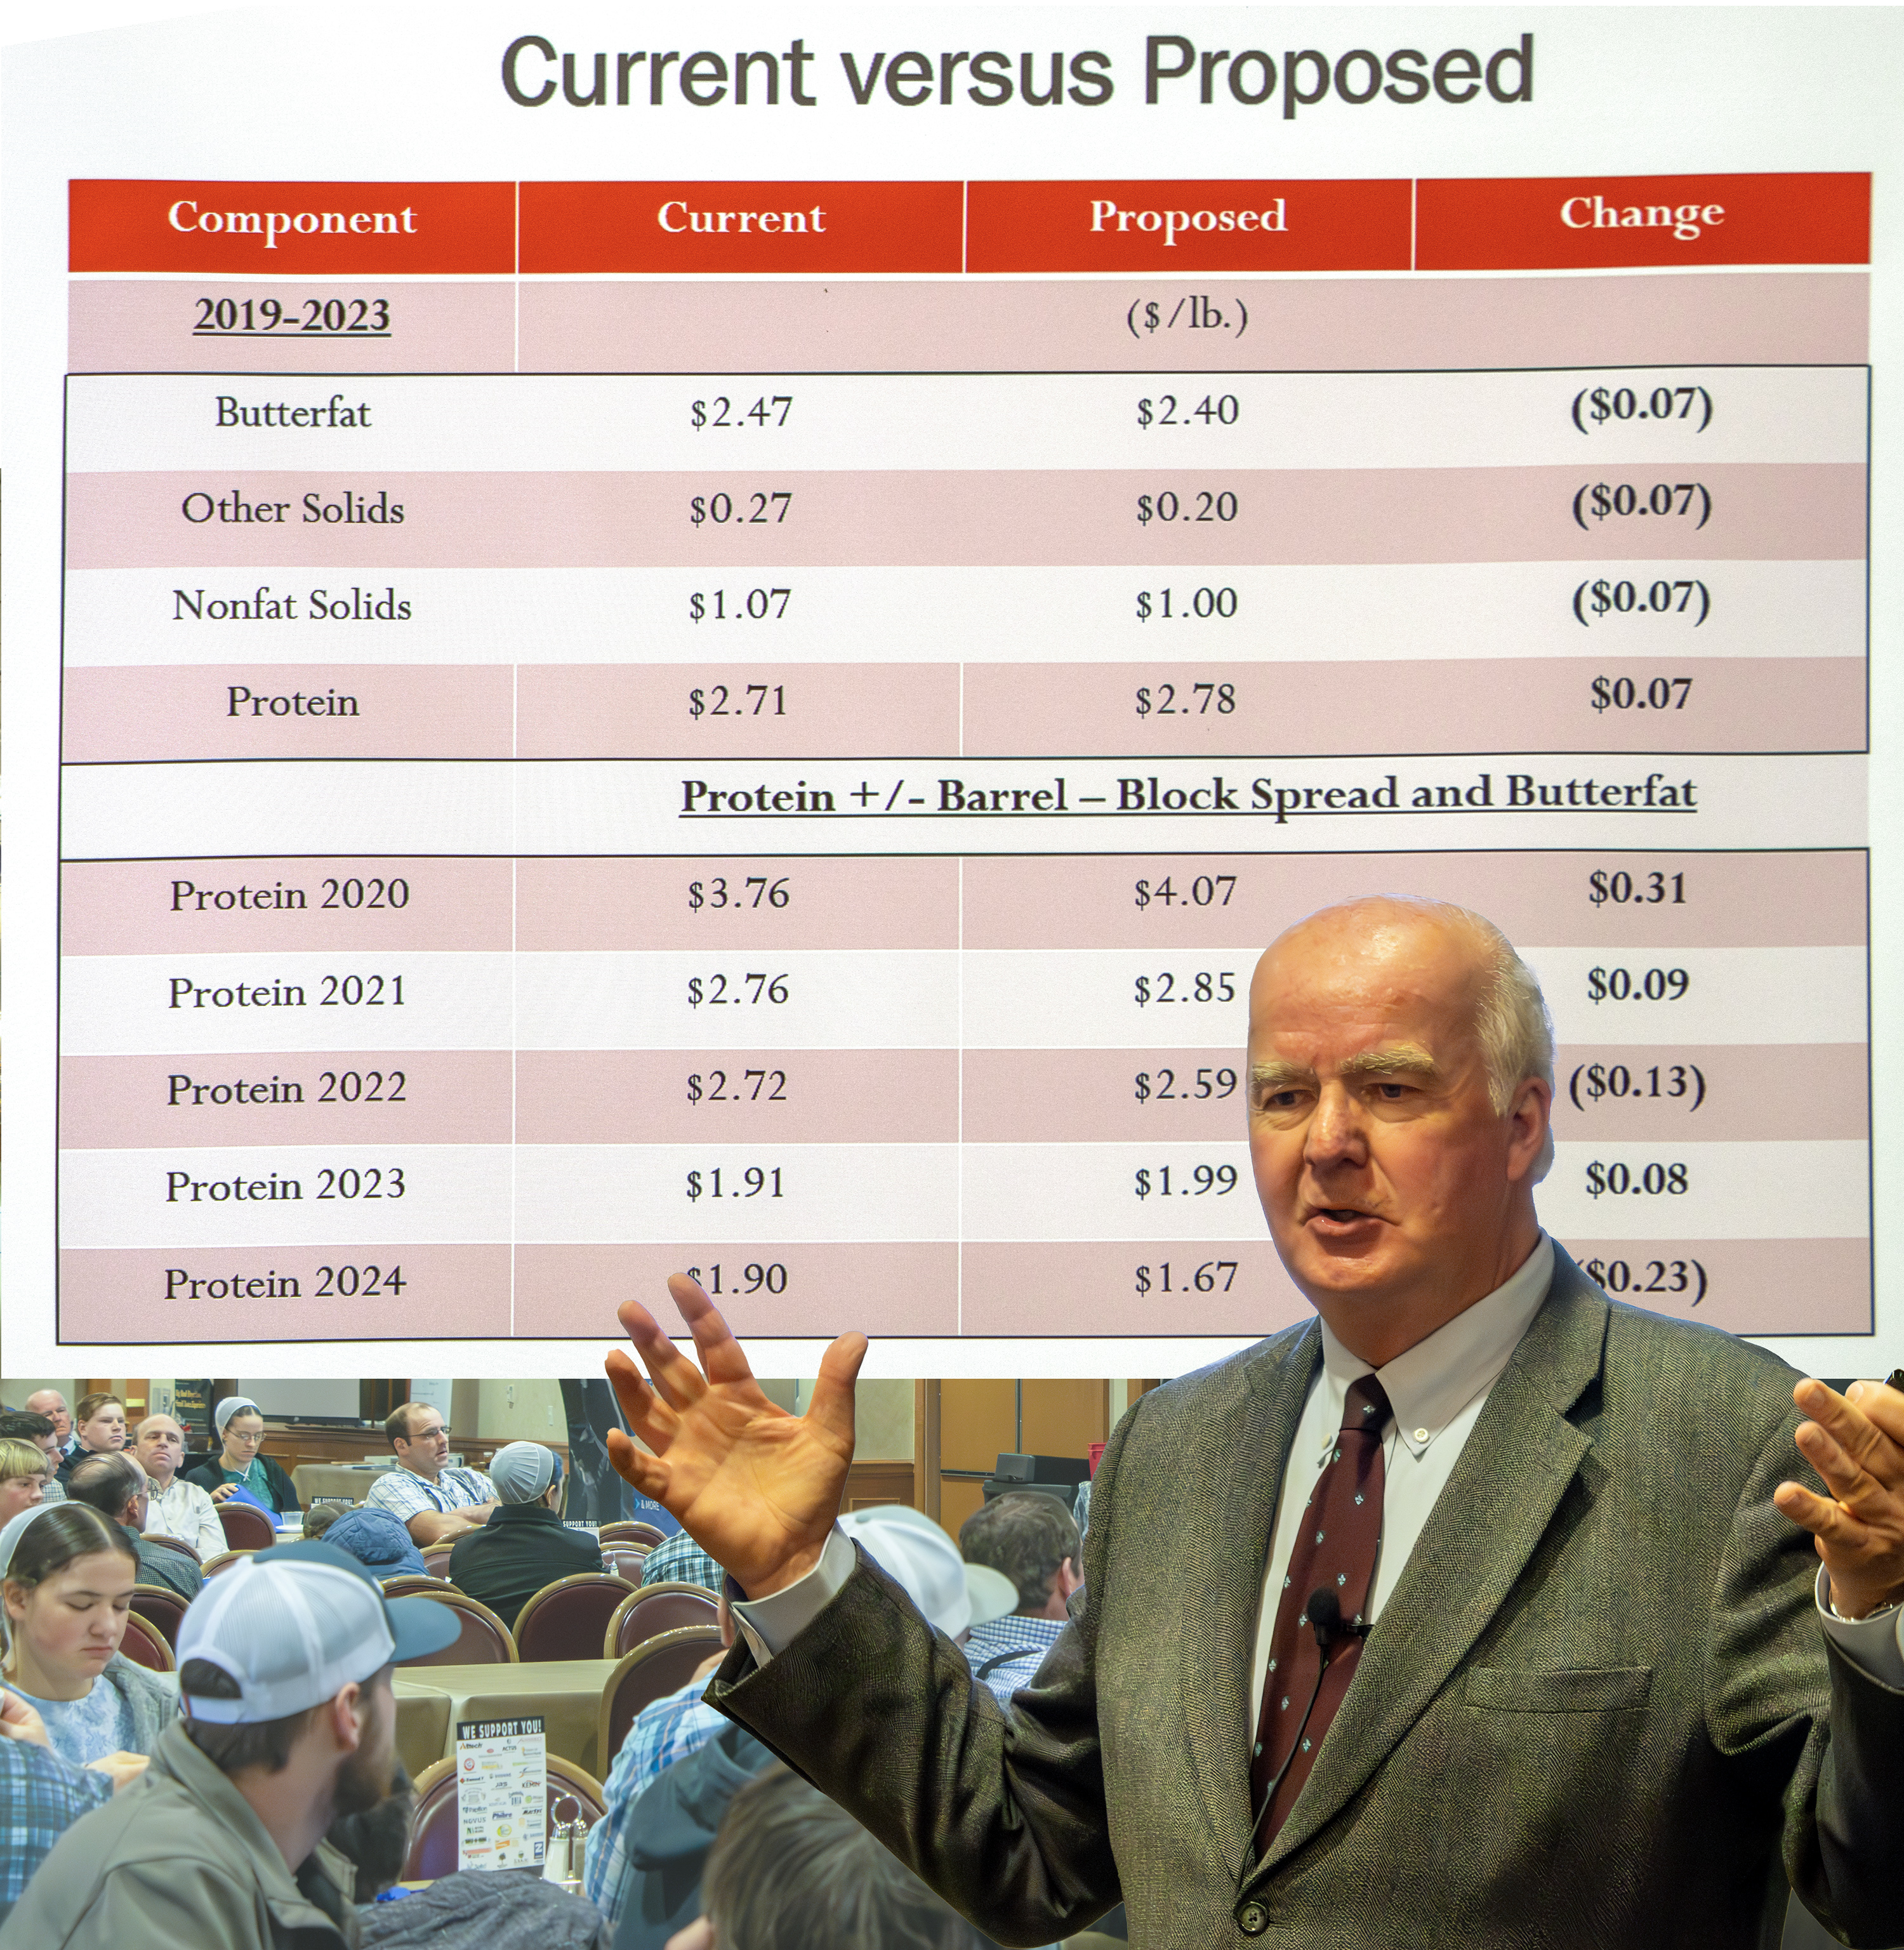
Calvin Covington has spent his life in milk marketing, now retired from managing Southeast Milk Inc., and before that working with cheese processors to see (and pay) the value of higher protein and fat when he was with the American Jersey Cattle Association earlier in his career.

Covington gave his dairy outlook for 2025, with emphasis on the Southeast markets during the Georgia Dairy Conference attended by over 400 in Savannah, Jan. 20th.

“I was way low on my projections last year. 2024 ended up with prices higher than anticipated,” he said.

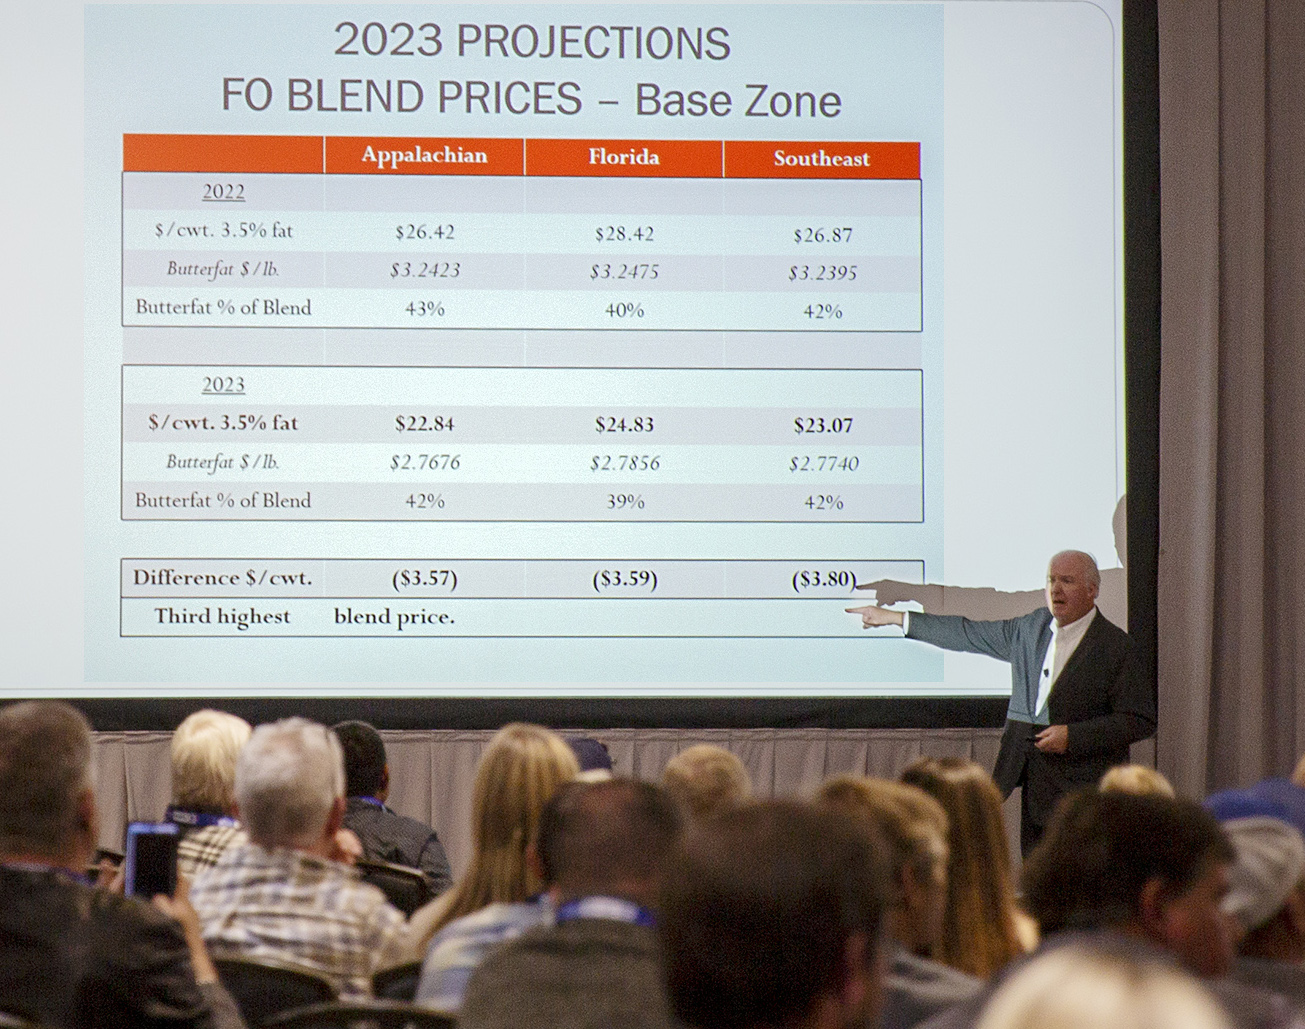
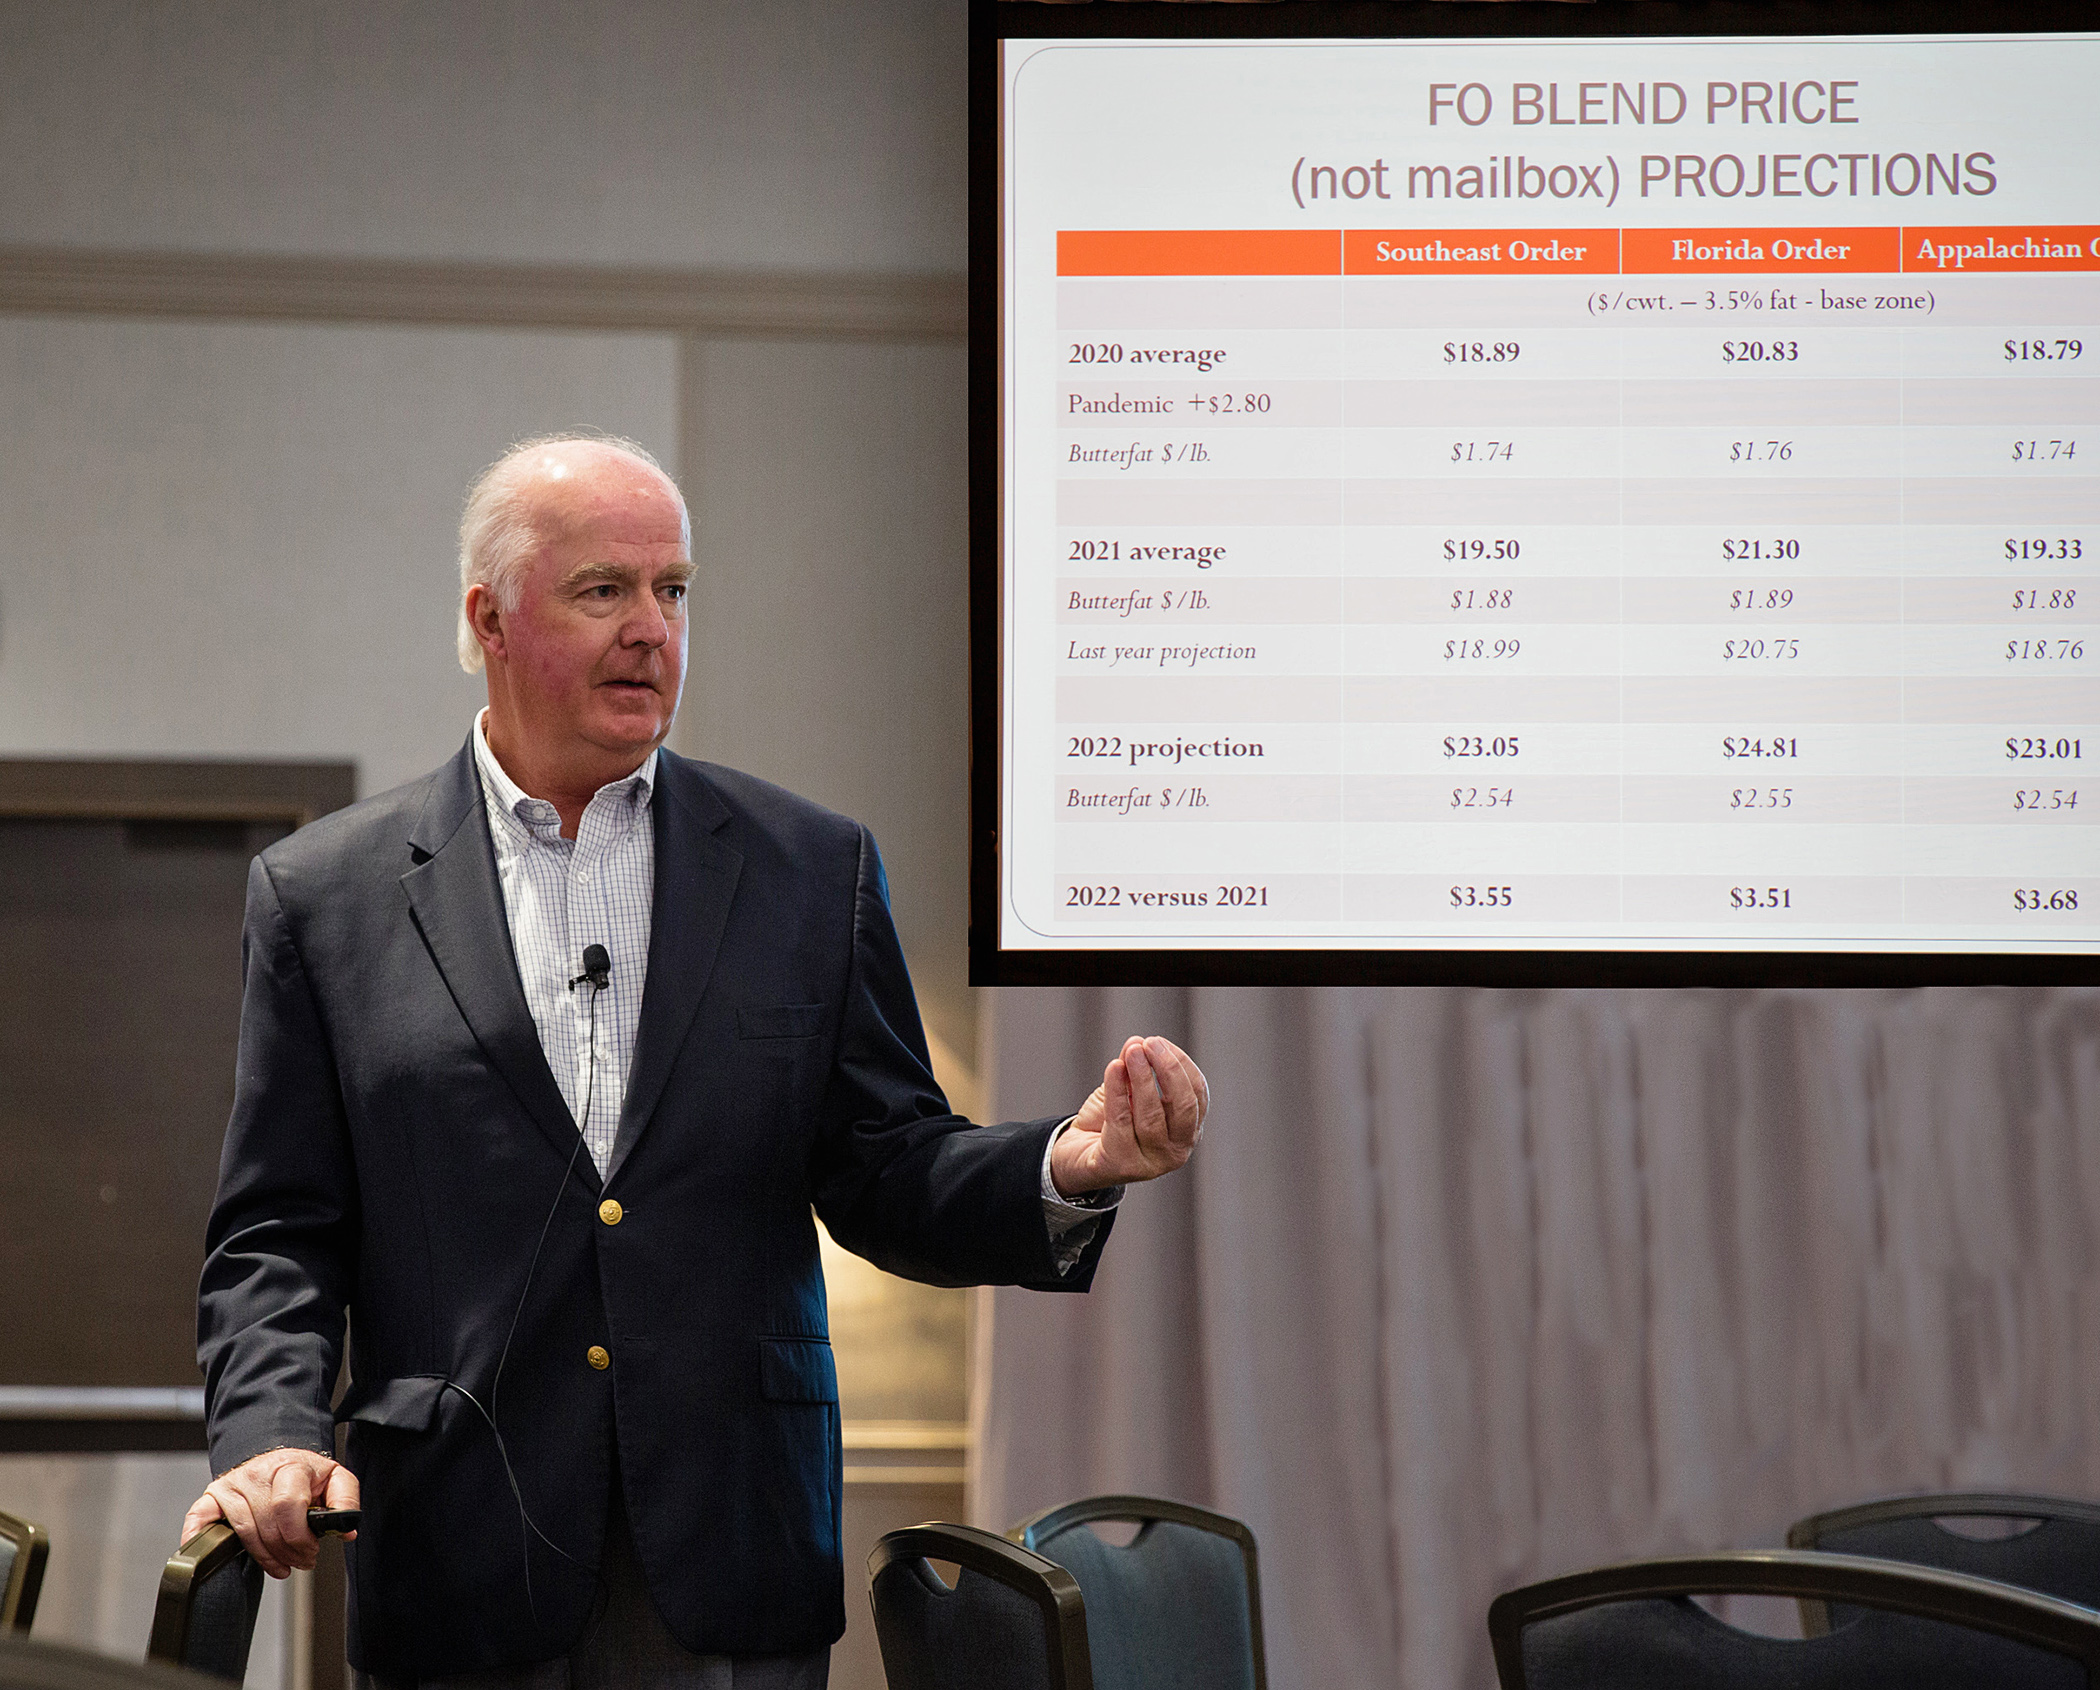
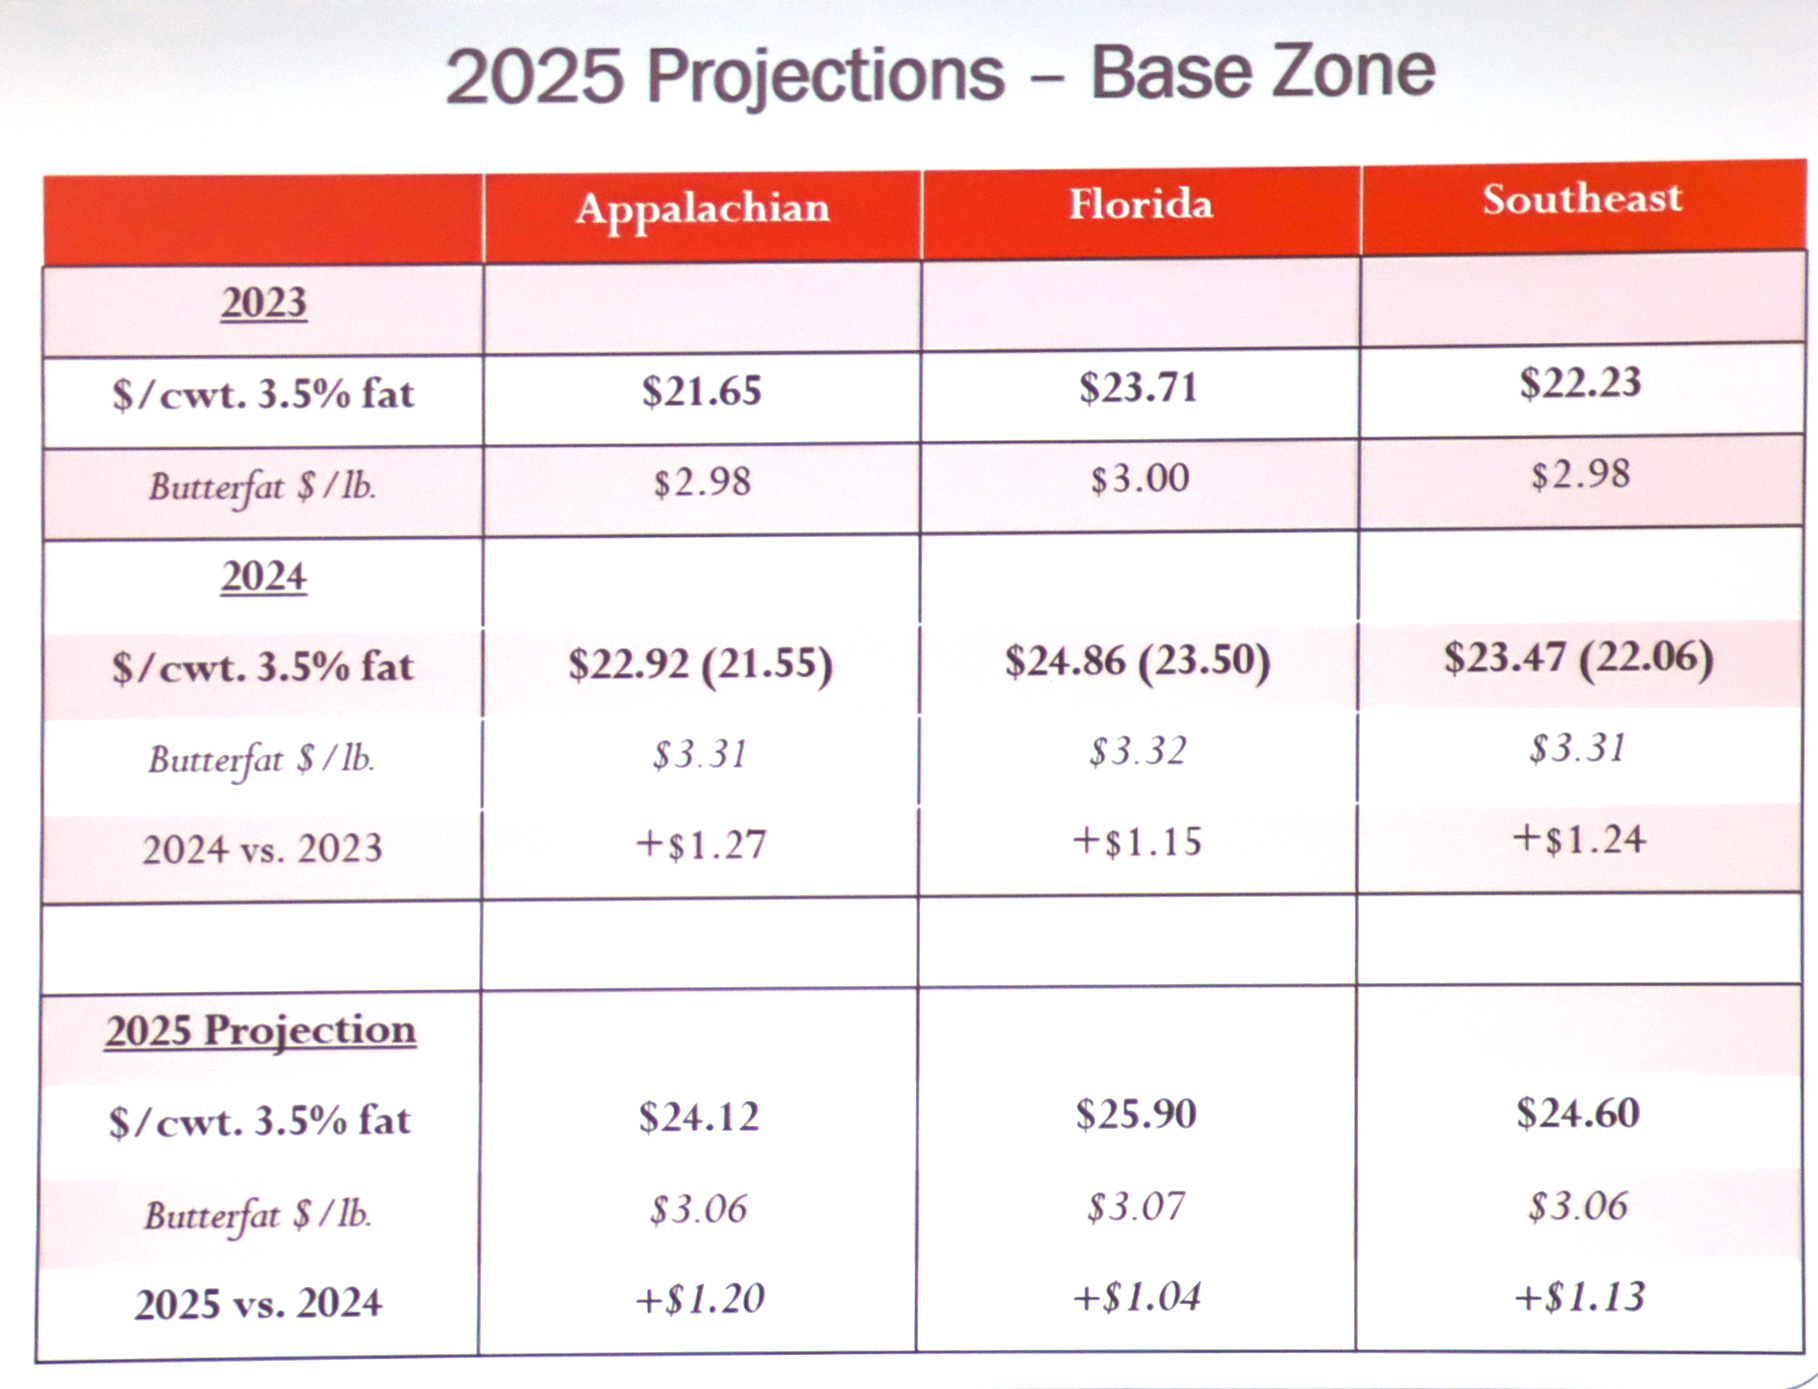
This year, he is projecting prices in the Southeast markets to rise by $1.20 per hundredweight as an average for 2025 vs. 2024 in the Appalachian region ($24.12), $1.40 in Florida ($25.90) and $1.13 in the Southeast Order ($24.60). Most of the increase will come from the skim side this year because the FMMO changes, which will be implemented in the second half of 2025, will pressure butterfat value.

Covington shared his price projections for Southeast milk markets for 2025.

Producers are making higher butterfat milk, averaging well over 4.0% across the three Southeast Orders at 4.06 in Appalachian, 3.92 in Florida, and 4.11 in the Southeast. This compares with 3.65% across the three Orders in 2010.

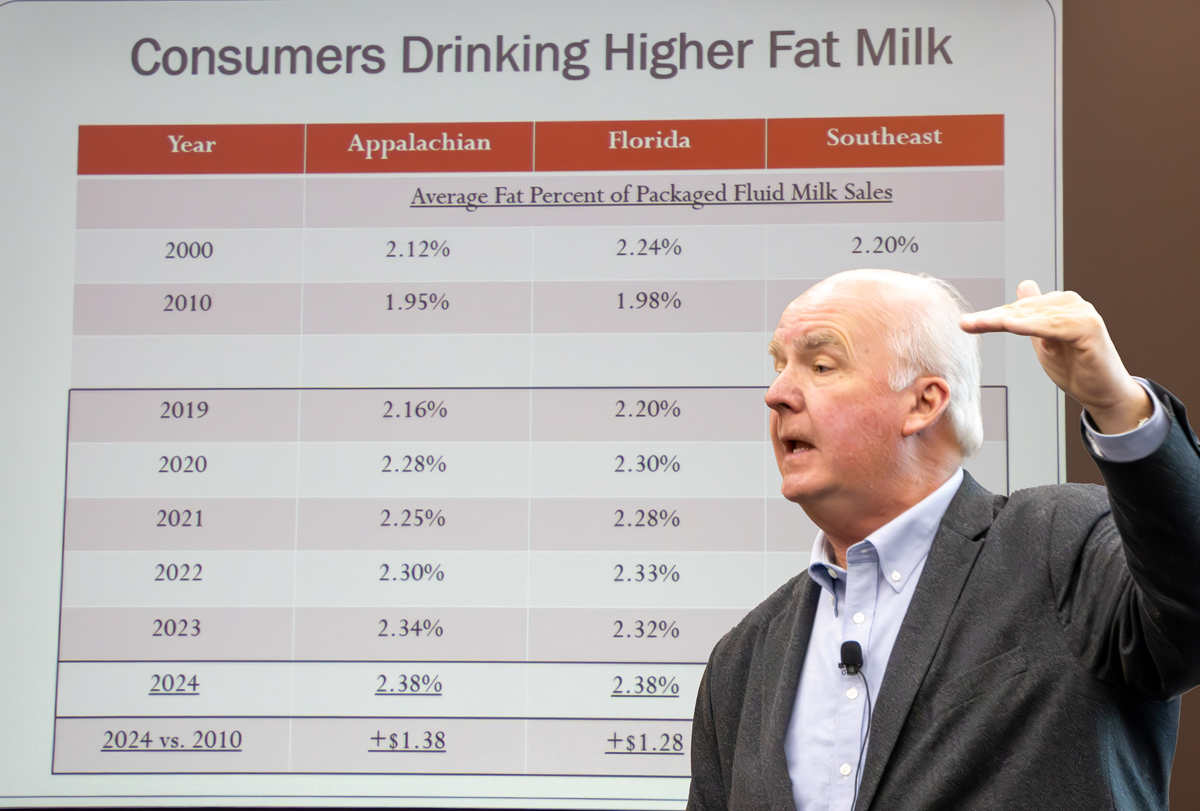
“Additionally, consumers are also drinking higher fat milk,” said Covington, calculating the average fat percentage of Class I sales in the three Southeast Orders rose from 1.95% in 2010 to 2.4% in 2024.

Covington calculated that fat percentage in milk sales showing the change in consumer preference for higher fat milk puts more money in producer milk checks.

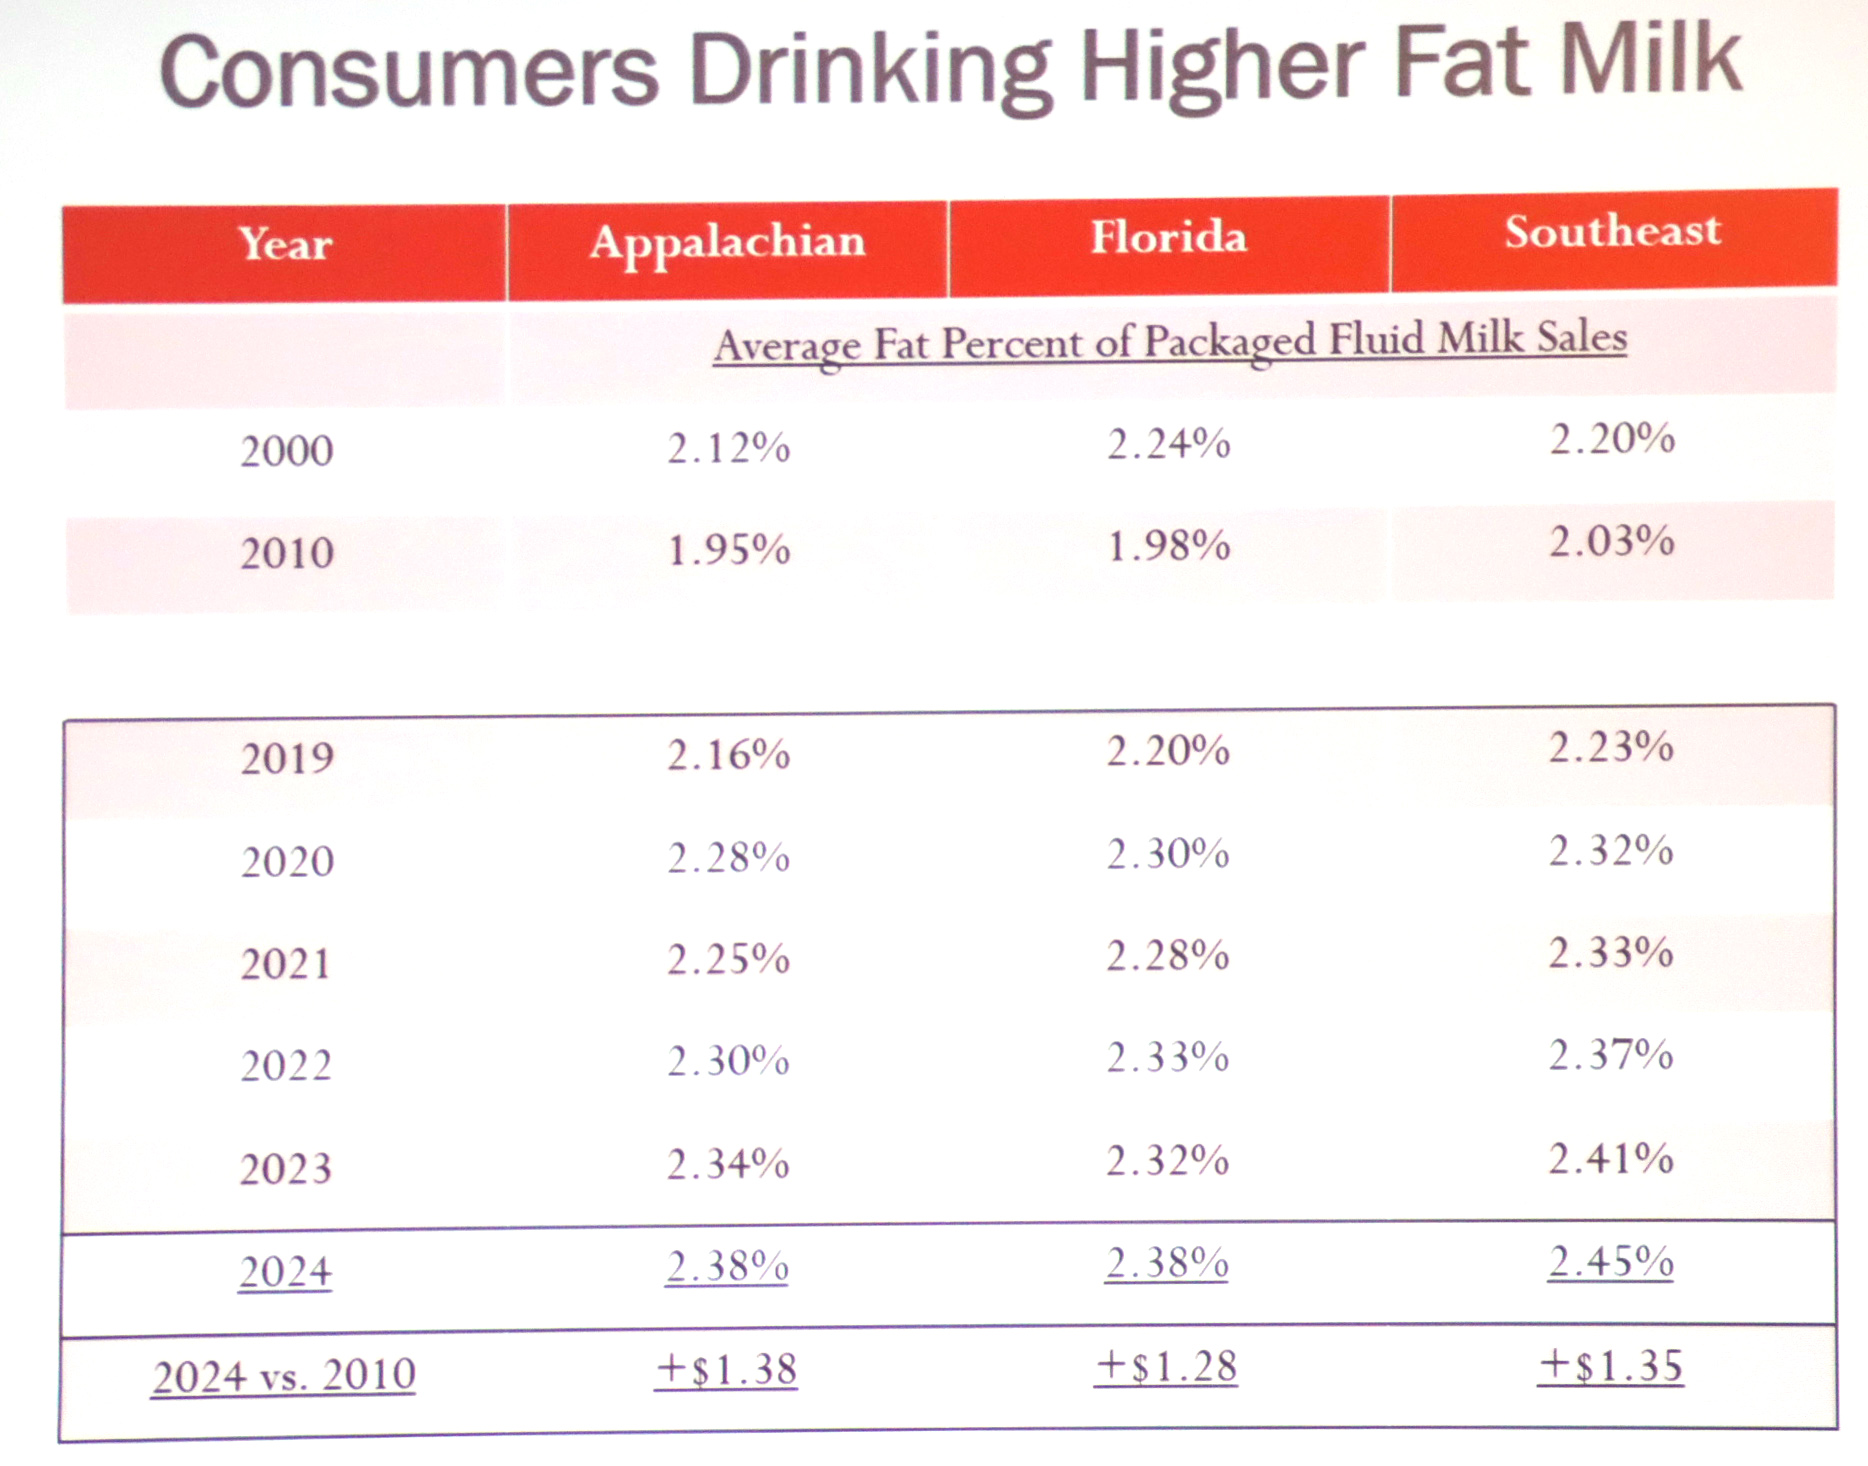
“In 100 pounds of Class I milk in the Appalachian Order, for example, that 2.38% fat made the milk worth more money, $1.38 per cwt more,” he said, with a chart showing Southeast producers saw a $1.28 benefit; Florida $1.35.

“There has been a big change in consumer preference, and that has raised your Class I price,” he said.

He commended dairy producers for improving their components, which has also improved their milk price.

“You’ve done this through genetics and feeding and nutrition programs, and it’s not going to stop. We are moving quickly to Holsteins making milk like Holsteins and testing like Jerseys.”

Other good news heading into 2025 is dairy product inventories are in good shape, he said. Cheese stocks are down, powder is up just a small amount, dry whey inventory is way down and butter inventory is flat.

Dairy product demand is up, but Covington sees a bit of a challenge looking at demand on a total solids basis because “we are exporting more cheese and less powder.”

Looking ahead, he gave attendees a lot to think about on the changing structure and markets in the dairy industry.

Covington observed that 10% (140) of the 1408 dairy farms that were counted in the 2022 Census of Agriculture in the Southeast had 64% of the region’s milk sales.

Of that 140, there were 22 farms with 2500 cows or more, producing 32% of the region’s milk.

“This is happening all over the country,” said Covington. “We are getting more concentrated.”

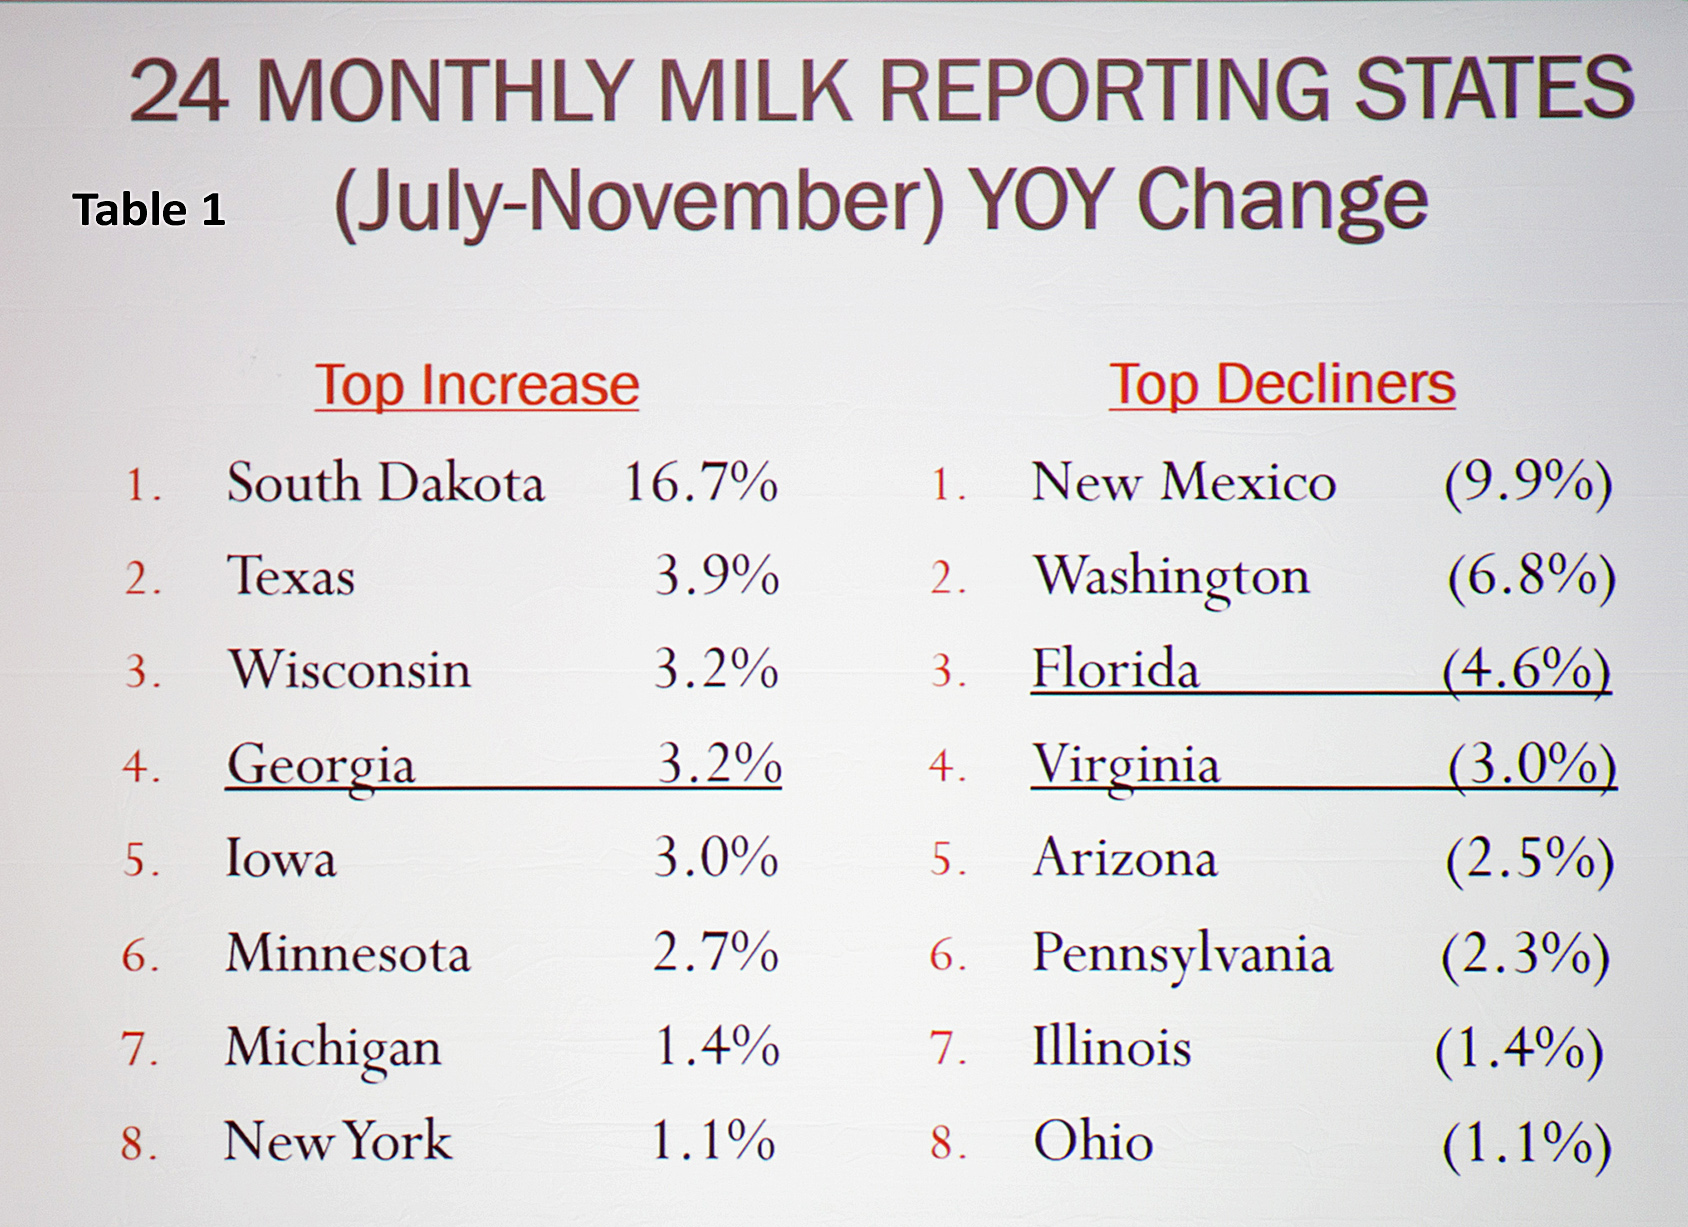
This year the milk production advantage flipped back to Florida by slightly more than Georgia, but the two states together have reached 50% of Southeast milk sales. Covington thinks by 2030, “we will see 60% of the milk produced in the Southeast coming from Georgia and Florida.”

When asked what has led to Georgia’s rapid increase in production over the past few years, Covington said “Georgia dairy farmers want to expand and they have the ability to expand. They are progressively making more milk per cow and have the land mass and support.”

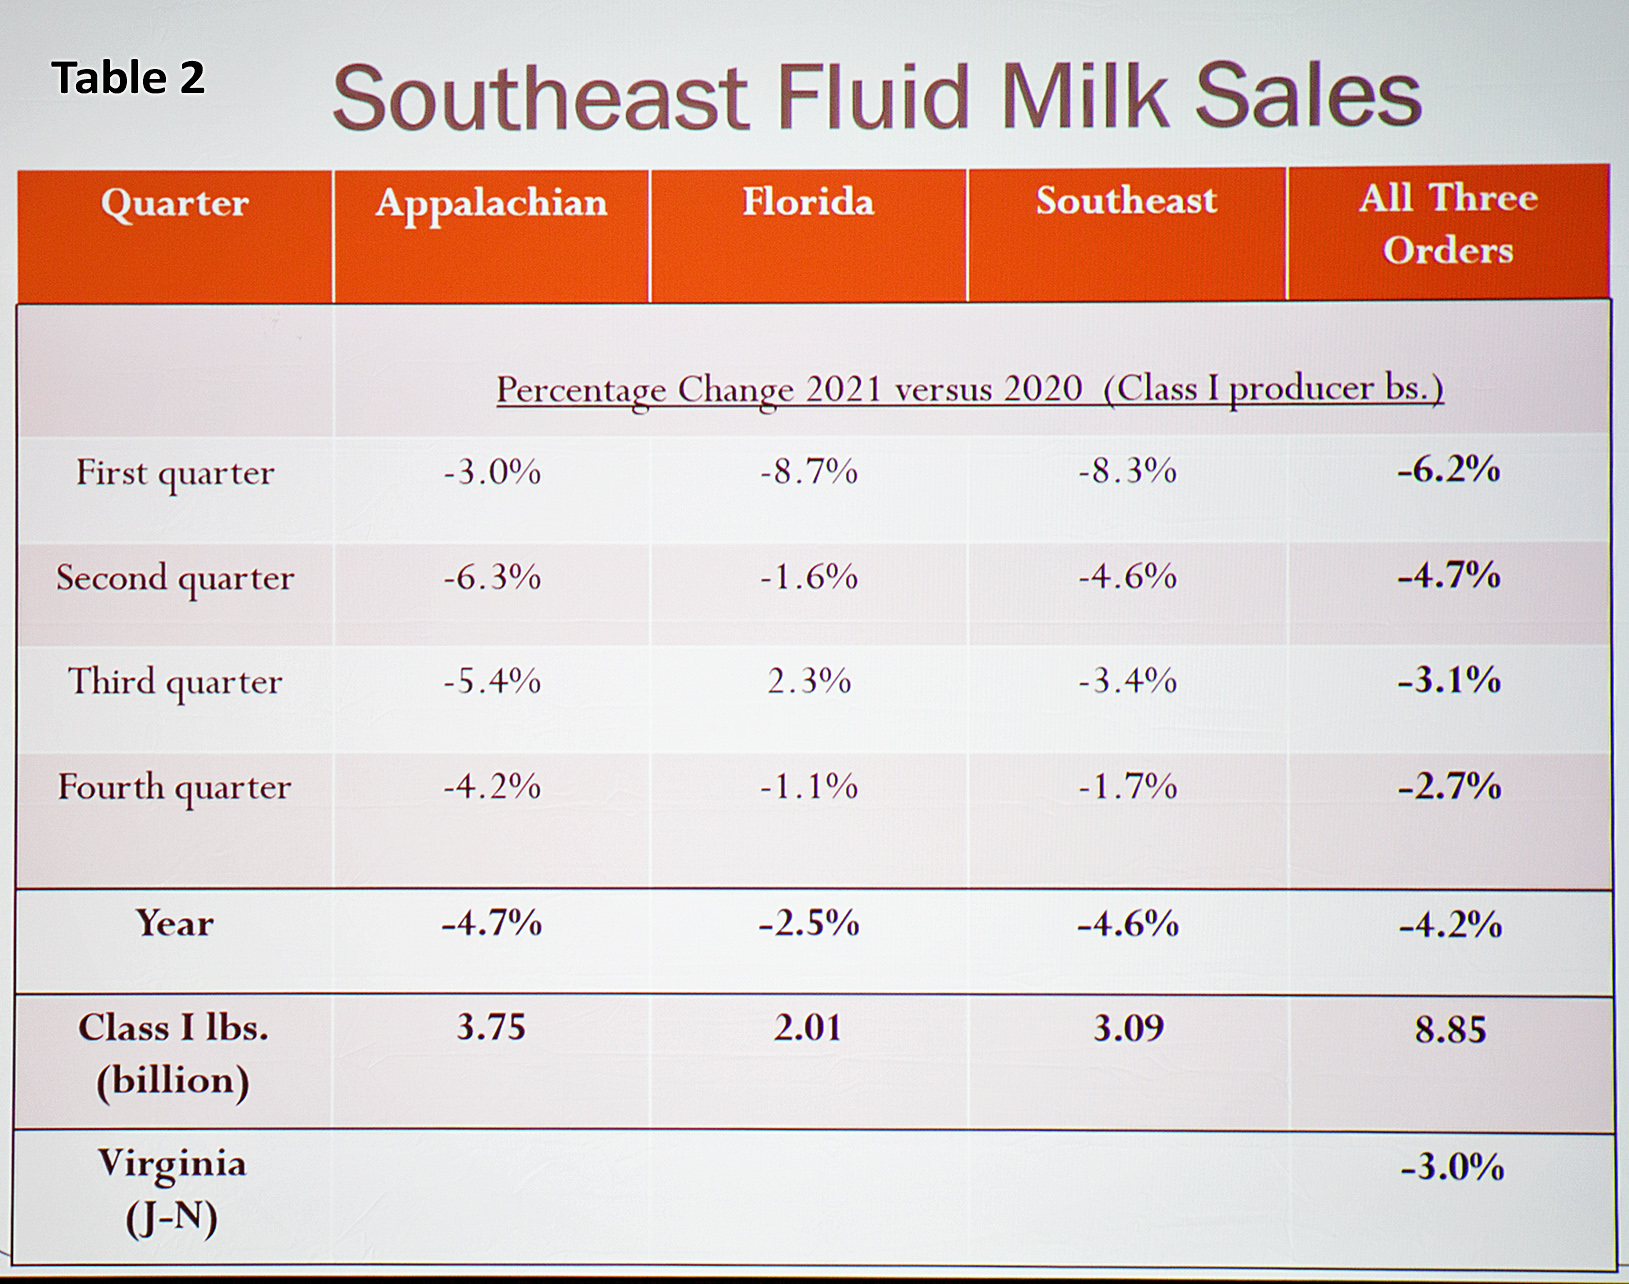
His “demand and supply” summary for the Southeast region shows 1160 dairy farms at the end of 2024, producing 8 billion pounds of milk with 32 regulated milk plants. The region had 8.3 billion pounds of Class I fluid milk disposition, and 0.9 billion pounds of Class II products processed.

Against those numbers, the amount of packaged fluid milk products sold in the Southeast was 10 billion pounds. “The Southeast is still a deficit area, and there is room for growth,” he said.

As for total U.S. milk production, Covington doesn’t see it rebounding any time soon. Cow numbers are moving lower and milk per cow is simply not making the year over year gains seen in the past.

“Milk production has been pretty constant for the last three years,” he said. “We have to go way back to see where that has happened before.”

But he also wanted producers to think differently about production, to realize that in making more components, their milk is generating more products. He calculates that today’s hundredweights of milk, nationwide, yield a half pound more cheese. That adds up.

“You as dairy farmers are doing this. By getting your components up, you are also improving sustainability over time. You are making more products from the same volume of milk,” Covington explained.

“Based on average component level changes, if a plant is making one million pounds of cheese a day, they now need 177 loads instead of 185 loads a day for that same output,” he said.

-30-

The good, bad, and unknown of new FMMO pricing formulas ‘approved’ by producer referendum

Calvin Covington shared that the collective impact of all the FMMO changes on the Northeast Order farms is likely to be neutral to slightly beneficial, while farms in the three Southeast Orders will benefit the most because of bigger Class I differentials and greater Class I utilization. Butterfat and other solids prices will be lowered, and the wild card will be protein because barrel cheese prices moved higher than blocks in 2024, but the barrel price will no longer be used in the protein price formula after June 1st. Photo by Sherry Bunting

By Sherry Bunting, Farmshine, Jan. 31, 2025

SAVANNAH, Ga. and EAST EARL, Pa. — As part of his annual outlook for Southeast milk markets, and also in his look ahead for the milk market nationally and in the Northeast, well-respected retired milk co-op executive Calvin Covington broke down the final USDA Federal Milk Marketing Order (FMMO) formula changes into three categories: The positive, the negative, and the unknown. (Plus, there is also the ‘unvetted.’)

Covington spoke to over 300 attendees from 10 states at the 2025 Georgia Dairy Conference in Savannah on Jan. 20th, just a few days after USDA’s announcement that producers in each of the 11 FMMOs approved the final rule. Then, on January 28th, he was in eastern Lancaster County, Pennsylvania speaking to 250 dairy farmers on this topic at R&J Dairy Consulting’s 18th Annual Dairy Seminar at Shady Maple Smorgasbord.

The FMMO changes will be implemented June 1, 2025, except for the increased milk composition factors, which will be delayed six months due to impacts on “risk management.”

Covington shared collective analysis based on USDA’s backward-looking data (2019-23), showing that all six pricing changes, combined, would have benefited producers by 26 cents per hundredweight across all FMMOs, nationwide, during those years.

“But, like the disclaimer on a financial prospectus, ‘past performance is not an indicator of future results.’ It is all relative,” he said. “The three Orders of the Southeast are by far the biggest beneficiaries, but going forward, there are a lot of things we just don’t know.”

Calvin Covington shared analysis of how the recently approved FMMO milk pricing changes could collectively impact each of the 11 Orders, but warned that analysis based on past performance, may not be an indicator of future results.

Orders with estimated negative net impact at test are: Pacific Northwest (124) -5 cents; Upper Midwest (30) -9 cents; Arizona (131) -11 cents; and California (51) -27 cents.

Orders with estimated positive impacts at test are: Appalachian (5) +$1.90; Southeast (7) +$1.80; Florida (6) +$1.43; Central (32) +52 cents; Mideast (33) +50 cents; Northeast (1) +35 cents; and Southwest (126) +7 cents.

The good

“The Southeast will see the majority of benefit, with the updated Class I differentials,” Covington reported, illustrating how they vary by location for an average increase of $1.42 per cwt across the country – but only for Class I milk. The three Orders of the Southeast will see more of this benefit because they have the largest Class I differential increases and their blend prices are predominantly Class I.

A University of Wisconsin-Madison study had previously looked at where the plants are and where the milk is, in order to think about moving milk from where it more is produced to where it is needed.

The highest differential increase is along the route 85 corridor, beginning near Atlanta, up into West Virginia, where there are plants but no milk. Interestingly, his chart showed that the smallest increases for the region are in Florida locations as well as Valdosta, Georgia, where the new Walmart milk plant is being built.

In the Northeast, Covington said dairy farmers will have to get used to what this looks like on their milk check, and they will also see more incentive to move milk South under these new differentials.

“Each county has a differential assigned to it,” he said, pointing to the area of the R&J Meeting, near New Holland seeing a $1.40 per cwt. increase in Class I differential, but this is a smaller increase compared to the much larger increase put on at Boston, Mass.

“That big increase in Boston is because there’s not any milk around there, and it’s raised to get the milk to move to the people there,” he said. This means that even though the new Class I differential will raise the Class I price in New Holland, “farmers will have to get used to seeing their location differential as a bigger negative on the milk check,” because the increased differential in Boston is so much bigger.

The milk composition factor updates are straightforward, he said, yielding about a 35 cents per cwt benefit to the Class I milk price in all FMMOs, and will raise the standardized skim value of the other classes in the three southeastern Orders that are still priced as fat/skim instead of by multiple component pricing.

The bad

The make allowance increases will lower the price for butterfat and other solids value, he said, “but we don’t know what will happen with the protein price because of the elimination of the barrel cheese prices from the formula.”

This will manifest as lower butterfat and other solids component prices for the Northeast, he said. “We would expect the protein price to be higher, based on history, but that depends upon the block to barrel price spread and its relationship to the butterfat price.

The unknown

Historically, the 500-pound barrel cheese price was lower than 40-pound block price.

Last year, however, barrels have been higher, so we don’t know,” said Covington.

Also in the unknown category is the return to the ‘higher-of’ as USDA’s method for setting the base Class I skim price.

“In the past five years, the average-of method cost dairy farmers millions of dollars, but we don’t know going forward if the skim factors (Class III vs. Class IV) will get back to being closer together, which would lower prices. If the spread stays wide, this change to the higher-of will increase prices,” he explained.

When asked if the Covid pandemic created the loss in Class I value under the average-of vs. higher-of, Covington said the Covid period — while most obvious — only accounts for one year out of five years in which the spreads between Class III and Class IV and between block and barrel cheese were detrimental.

“The thing going forward is, we just don’t know,” he said.

The unvetted

The sixth change is not listed separately in the Jan, 16th USDA notice to trade, and it was not part of any hearing proposal. Covington said he views the extended shelf life (ESL) adjuster as “a new class of milk.”

“The ESL adjuster is only on Class I. You’ll have a Class I mover skim price that will be calculated for conventional milk based on the higher-of III or IV,” he said. “Then you need a big spreadsheet to show what’s going to happen next. They’ll look 36 months previous to 12 months previous at the difference between the higher-of and the average-of, and that will be the adjuster to use for ESL milk that month.”

He estimates the ESL adjuster would have averaged -30 cents in 2024, but for some months it would have been a plus.

“My initial analysis is that it will not make a whole lot of difference in the short term, but we just don’t know going forward if some will try to manipulate this,” he said. “My concern is that it was not proposed at the hearing at all, and there’s no definition for extended shelf life. I know being in this business all these years, if there is a way to work around it for a benefit, they will find a way to do it.”

When asked about the competitive issues between conventional and ESL fluid milk and between out-of-area packaged ESL milk competing with in-area fresh milk, Covington observed potential competitive issues between conventional and ESL milk in the same area.

“You’ll have two different costs at the same location. What has always been the beauty of the Federal Order system is having the same raw product costs at the same location,” he said, adding that new ESL plants are being built and others are expanding.

“As ESL grows… there could be some months with a price advantage,” Covington suggested, pegging that difference historically to be as much as $1.00 per cwt in some months. “That kind of difference can create disparity between conventional and ESL milk.

“The thing is, we just don’t know, going forward, what it’s going to look like.”

Covington urged farmers to pay attention and be involved. Federal Order reforms are a slow process involving a lot of time and compromise. Changes this big only happen about every 25 years, he said.

He noted that Farmshine has kept dairy farmers “well-informed” with effective reporting on the markets and the FMMO process.

He said that as more manufactured products are sold and less fluid milk, compared with 25 years ago, the future could look different if future administrations and lawmakers feel differently about the pricing of milk. If manufacturers perhaps choose not to participate, FMMOs could some day be looked to primarily for handling the payments and test weights.

However the future plays out, Covington urged: “Stay informed and be involved because it is your milk check.”

-30-

Covington gives 2023 outlook at GA Dairy Conference; sees blend price pressure coming more from demand side, especially in Southeast

By Sherry Bunting, Farmshine, February 10, 2023

SAVANNAH, Ga. — In a much anticipated market outlook with its full complement of charts and graphs, retired milk co-op executive Calvin Covington told the crowd of 500 attending the mid-January Georgia Dairy Conference in Savannah that 2022’s record-high blend prices outpaced his earlier projections, and he sees the pressure in 2023 coming more from the demand side than the supply side.

At levels more than $7 per hundredweight higher than 2021, Covington calculated the 2022 Federal Order blend price averages at $26.42, $28.42 and $26.87 for Orders 5, 6, and 7, respectively.

The higher national butterfat price — up almost $1.50 per pound from 2021 — accounted for more than 40% of southeastern fat-skim blend prices and was a big factor in record milk prices for farmers in multiple component pricing FMMOs, nationwide, in 2022.

Covington projected the Federal Order blend prices to average $22.84, $24.83 and $23.07 for Orders 5, 6 and 7, respectively, in 2023.

If the more than $3.50/cwt. decline is realized this year, and prices don’t go below these projections, “2023 could still have the third highest blend prices on record,” he said.

He cautioned that his projections are FO blend prices, not farm mailbox milk prices and said relatively small changes can make a big impact on these prices. 

Covington stressed the high cost to balance the fluid milk markets affects how the blend prices translate to mailbox milk checks in the Southeast. 

“This high cost to balance Class I is something we have to keep educating the rest of the country about,” he said. (In fact this is one reason a public hearing is set to begin Feb. 28 for the Appalachian, Florida and Southeast Federal Orders to consider proposals to amend inter-market transportation credits in Orders 5 and 7 and adopt plant delivery credits, otherwise known as intra-market transportation credits, in Orders 5, 6 and 7.)

Nationwide, Covington expects milk production growth in 2023 to be constrained by several factors including interest rates, operating margins and available replacements.

On the demand side, however, he said domestic and export sales on a total solids basis — while up year-over-year – are showing softer growth.

Looking ahead, he said the dry whey price is something he watches because it is the dairy commodity with the most worldwide impact. He sees it as a bellwether for milk prices going up or down. (Dry whey prices had come under pressure in December and January, but showed strength in spot sales on the CME into the beginning of February.)

Over the longer term, Covington looks at total milk production, number of cows as well as demand in terms of sales and product inventories on a quarterly basis to take the month-to-month variation out of the equation.

“In 2022, we had three quarters of lower milk production that helped bring up prices. Why? Cow numbers. We had a lot of cows in the first half of 2021, and those numbers began to get depleted into 2022. 

“Now we are starting to get a little more milk from dairy farmers adding a few more cows,” he said.

On the demand side, Covington looks at domestic and export demand separately by tracking commercial disappearance, trade, and inventories. He reported domestic dairy product demand was up 0.5% in 2022 on a total solids basis vs. prior year, compared to a 5-year average annual growth of 1.5%.

“Domestic demand has slowed down,” he said.

On the export side, it was a record year; however, export sales on a total solids basis were up 3.5% year-to-date through October, compared with a 5-year average annual growth of over 6%, according to Covington.

Combining these figures for the first 10 months of 2022, he said total demand was up 1% from prior year, compared to a 5-year average increase of 1.8% on a total solids basis. Covington said this could change slightly when November and December figures are included.

Bottomline, he sees dairy demand is growing, but this growth is slower than the average annual growth over the past five years.

Higher prices and overall inflation are affecting butter sales as reflected in commercial disappearance comparisons and anecdotal evidence shared by Covington. Using a chart of commercial disappearance comparisons, he said American cheese demand appears to be declining, while other cheese categories are showing demand growth. Dry skim milk powder represents 72% of all exports, and even though exported quantities were up in 2022, total commercial disappearance was down.

Some of these commercial disappearance trends are also a function of what is being produced and manufactured in the first place.

“The good news going into this new year is inventories,” he said. “We have no overly burdensome inventories to be concerned about.” 

Covington projects 2023 milk production to increase by no more than 1% over 2022, and he thinks the increase could be less than that. Why? Higher interest rates, lower operating margins and the prevalence of beef-on-dairy limiting the supply of dairy replacement heifers. (A tighter than expected supply of dairy replacements was later confirmed in the January 1 semi-annual All Cattle and Calf Inventory Report released by USDA on January 31.)

In the Class I fluid milk markets during 2022, Covington reported sales January through November were off 2.3% from prior year, and he highlighted the fact that the number of fluid milk plants is dwindling. 

A producer asked why this is happening, and Covington’s answer was blunt: “There’s no money in it, no profitability. Class I sales are down, so that business is not able to grow volume, and some of those plants are on land that’s a whole lot more valuable to sell than to run a milk plant,” he said.

Over the past two years, the 10 southeastern states have lost 8 fluid milk processing plants, “and that’s done some damage,” said Covington.

At the end of December 2022, USDA listed 39 pool distributing plants for the three southeastern FMMOs — down from 44 a year earlier and down from 70 in the year 2000. The only balancing plants now located in the region are in Kentucky and Virginia.

Of the 39 pool distributing plants across Orders 5, 6 and 7, Covington said 18 are owned by cooperatives, 9 by grocery stores and 12 are privately-owned, but smaller.

“The bulk of your fluid milk is being processed by plants owned by cooperatives — by you — or by retail stores,” he said.

Meanwhile, most of the loss in fluid milk plants has occurred in Order 7, which has half as many fluid milk plants today as in 2000, according to Covington.

Located in Order 7 is Georgia, which has become the Southeast’s new leading state in total milk production. Georgia’s production growth is offsetting Florida’s production losses, moving Georgia to surpass Florida in total output. 

At the same time, Georgia has the fewest number of fluid milk plants — down to just two. This combination left Georgia’s farmers producing a per-capita fluid milk surplus of 53 pounds.

Together, the 10 southeastern states remain milk deficit, but the relationship between milk supply and fluid milk demand is steadier across the region, according to Covington. He said the 10-state production total over the past three years “has started to level a bit at 8.1 billion pounds, and is more concentrated to Georgia and Florida with Georgia as a milk producing state, not a milk processing state.” 

With producers making 101 pounds of milk per person across the 10 southeastern states, and fluid milk consumption at 133 pounds per person, the Southeast had a 32-pound per person deficit in 2022, he said. 

That is a smaller deficit than in 2010 — just before the accelerated annual declines in fluid milk sales began accumulating over the past decade. But as the milk supply in the southeastern states has steadied relative to declining fluid milk sales, the Class I utilization percentage across the three Orders has increased. Averaged at just over 74% for 2022, this was 4 points higher than in the year 2000, although the breakdown shows Class I utilization has been steadily increasing in Order 5 (Appalachian) while decreasing in Order 6 (Florida) and fluctuating in Order 7 (Southeast).

“The major challenge for milk markets in the Southeast is we need more of them,” said Covington. “A lot of the fluid milk products that are sold in the Southeast are not processed here. If we are going to have a viable dairy industry in the Southeast, we need growing and stable markets for milk produced in the Southeast.”

On the production side, he said the region has seen location shifts about every 40 years. “Since the 1980s, Florida was the highest and now into the 2020s, Georgia is number one,” Covington said. Together, they account for over 50% of the milk produced in the Southeast. Before the 1980s, Kentucky was number one with Tennessee a close second.

Covington predicts this pattern will continue while other states in the Southeast become smaller and are vulnerable to begin losing infrastructure.

When asked why Georgia is growing so fast, Covington said simply: “Good dairy farmers. If you look at production per cow and how this has improved, we see Georgia has had one of the highest per-cow production increases in the U.S.”

At the same time, he said, addressing the Georgians in the audience of around 500 people from multiple states: “Your farms are growing, and the state seems conducive to allowing you to grow. You just need to build some milk plants.”

The challenge for the Southeast region is to expand profitable sales at existing plants and/or seek to attract new dairy processing to the region, said Covington.

-30-

Covington: Southeast blend price forecast $3.50 higher for 2022

Industry trends explored at Georgia Dairy Conference

Calvin Covington gives Southeast Dairy Outlook at Georgia Dairy Conference in January. S.Bunting photo

By Sherry Bunting, published in Farmshine, Feb. 11, 2022

SAVANNAH, Ga. – “Everything is going up, and quickly. Class IV is driving milk prices, with good demand for both butter and powder, especially for exporting,” said Calvin Covington as he presented the Southeast dairy outlook during the 2022 Georgia Dairy Conference, attended by around 300 dairy producers and industry members in Savannah in January.

He forecast the 2022 Federal Order blend price average (not mailbox price) for the Southeast region will be up $3.50, with most of that increase on higher butterfat, predicted to average $2.54/lb.

Covington’s 2022 blend price projections range from $23.01 in the Appalachian Order 5 and $23.05 in the Southeast Order 7 to $24.81 in Florida Order 6.

He noted that the market beat his conservative 2021 projections by 50 cents to the good. 

“I’m still on the conservative side this year because prices can decrease as quickly as they increase,” Covinton said. “A small change in supply or demand makes a larger change – up or down – in your milk price.”

Covington went through the numbers for 2021, noting reduced milk production, reduced product inventories, reduced Class I sales, a narrowing of the Southeast milk deficit, expanded exports, and expanded domestic demand as trends that are expected to persist into 2022 – especially on the milk production side as supply programs, production cost increases and limits on available labor keep a lid on milk growth nationwide, even worldwide.

Come 2023-24, Covington sees production “jumping up” because of new cheese capacity coming on line in the next two to three years. 

“Texas and the I-29 corridor (Central Plains) are bringing cows to where the plants are growing. We can see this in the production numbers,” he said.

As the milk supply in 2022 is likely to be restrained, Covington looks to the signs that domestic and export demand will continue strong, but questioned how inflation will affect consumer buying power.

The availability and consistency of labor also continues to challenge the dairy supply chain and its customers on the foodservice side.

Be prepared for the unexpected, he cautioned, reminding producers that 2020 was forecast to be a good year, and then the unexpected happened – Coronavirus – so all bets were off.

Exports play bigger role in milk price

“Export demand has become very important to your milk price,” said Covington. “We are seeing the strongest demand yet… and look how dependent the industry is on the export market, sending a record 17.1% of supply overseas — up from 15.8% in 2020.”

Using the available figures for the first 11 months of 2021 to gauge it, Covington said overall export demand is up 11.5% for 2021. Over the past decade, the year over year export demand gains averaged 4.3% by comparison.

Add to this the increase in domestic demand, up 1.4% in 2021, and the net gain in dairy demand for 2021 is more than 3% — almost double the 10-year average year over year demand increase of 1.7%.

Unfortunately, on the fluid milk side, USDA reports sales are down over 4% in 2021 vs. 2020, according to Covington.

“Exports are having a bigger part in your milk price,” he said, noting that global milk production in major dairy exporting countries is flat to lower, pushing global dairy prices higher. “Our prices are well below the world prices, making us very competitive. We’re exporting twice as much butter, and 75% of our nonfat dry milk is being exported.”

That’s positive for the skim price, and the doubling of butterfat exports along with domestic demand push the other side of the fat/skim equation higher.

Milk production trends

Even though 2021 milk production will clock in at around 1% over 2020, Covington honed into the production and cow losses on the back half of the year, using July through November data.

Cow losses at 124,000 head in those five months “are the biggest drop since 2009,” he said.

At the same time, milk per cow had been increasing the first part of the year but flattened in the second half as cost of production caught up to milk prices.

“Production is lower now because of less milk per cow and fewer cows,” said Covington.

Looking at just the back half of 2021, Covington broke the 24 monthly milk reporting states into thirds and showed the geographic shifts (Table 1, above): 8 states were up more than 1% in production, 8 states had reduced production and 8 states were in between.

Significant in the gaining top-third is Georgia, with July through November 2021 production up 3.2% over the same period in 2020.

“Georgia added more cows and increased milk per cow,” said Covington. He said as Florida is losing production, Georgia is gaining and getting closer to Florida.

On the bottom third, the back half 2021 milk production decreases were 4.6% in Florida and 3% in Virginia.

“Florida lost 6000 head and Virginia 3000,” said Covington. “This tells me people are going out of business.”

Looking at the three major milk states of the Southeast region for the year, Covington noted that Florida is down 4.8%, Virginia down 3.3% and Georgia up 1.1%. The other seven states of the Southeast are collectively down about a billion pounds over the past few years.

In the Northeast, Covington’s chart showed New York’s production for those months was up 1.1%, barely putting it in the gaining third, while Pennsylvania’s production was 2.3% lower and Ohio of 1.1%.

In the West, the chart showed Texas up 3.9%, but New Mexico down 9.9%; Wisconsin and Minnesota up 3.2 and 2.7% and Illinois down 1.4%; South Dakota continues as the largest percentage gainer, up 16.7% on the back half of 2021.

“South Dakota tops the list with expansion in cheese capacity,” said Covington. “Cheese expansion is also underway in Texas, and milk production is growing there too.”

Dairy inventories and commodity production are down

Dairy inventories are down. “One of the best barometers for milk prices is looking at inventories, to see if they are building or declining,” said Covington. They are declining with butter inventory down 16%, powder down 21%, whey down almost 9%.

Cheese inventories are up 9.6%, which isn’t bad, according to Covington.

“We’re going into 2022 with really no challenge of inventory,” he said.

On the commodity production side, Covington observed that, “We do not have excess cream. Butter production is lower and powder production is lower. Fluid milk consumption is lower, but the fat percentage is higher, decreasing the cream supply. Demand for other cream products has also been good.”

With cheese production up 1.3% overall, Covington said the real positive here is Italian cheese production up 5.6% is the bulk of the increase. 

“This tells you the product is moving,” he said, “because it’s the fresh cheese production that is higher. They don’t usually make Italian cheese without a sale for it.”

Southeast fluid milk changes

Together, all three southeastern FMMOs had 4.2% less milk going into Class I in 2021. (Table 2, above)

“2021 was a poor year for Class I in the Southeast, but we are comparing to when the food box program was in effect, and that program gave quite a lift to fluid milk in 2020,” said Covington. This loss translates to about one million pounds per day.

Utilization percentage has remained about the same at a little over 72% across the three FMMOs. As Class I sales have declined (4.2%), Southeast production has also declined (3%), so there is little change in utilization percent.

The structure of Class I pool distributing plant ownership has also changed in the Southeast, post-Dean, with 9 of the 44 plants supermarket owned and 19 cooperative owned.

The Southeast region is producing 103 pounds of milk per capita annually, down 20 pounds while fluid milk sales per capita, at 134 pounds, are off by 7 pounds – putting Southeast per capita production 31 pounds below fluid milk per capita consumption.

“The size of the deficit gap is smaller than it was in 2010 due to sales declining more than the production declines over the past decade,” said Covington.

Looking ahead to questions asked about FMMO reform and the Class I mover calculation, Covington said he “would hope we can get back to the ‘higher of’ – realizing what it costs to serve a fluid milk market.”

He shared concern about what happens to orderly marketing when Class I is underpriced vs. the other milk classes.

“Fuel cost estimates are a big concern, and there are other costs,” said Covington. “The cost to serve Class I markets keeps going up. The biggest issue is the FMMO system started when fluid milk was king, and now it is becoming a minority, especially in some areas of the country where processors will wonder, why be in the Federal Order?”

 -30-