Milk Market Moos, Nov. 29, 2024

USDA Standoff?

DTN policy editor Chris Clayton is reporting that a standoff could be brewing at the USDA between current Ag Secretary Tom Vilsack and the Trump transition team. Vilsack has urged the Trump team to sign “key ethics documents required by the Presidential Transition Act as soon as possible” so they can start the process of “educating folks… about what they are walking into,” and so the next Secretary of Agriculture “can be fully prepared for the job she is undertaking.”

After 12 years at the helm of USDA, with a 4-year intermission between the Obama and Biden Administrations, pulling a cool million in dairy checkoff salary, Sec. Vilsack has watered down dairy in the WIC program, mangled the recently completed Dietary Guidelines Advisory Committee selection and recommendation process, further deflated whole milk and dairy’s position in the school lunch and other nutrition programs, and has been tightly tied to his pet projects, especially the climate-smart partnerships he lobbied the Senate for in 2019 while working for DMI, given the ‘slush fund’ appropriated through the so-called Inflation Reduction Act that many describe as the undercover Green New Deal.

For that initiative, alone, Vilsack told the House Ag Committee a year ago he was hiring 4000 new USDA employees and that 4000 more would be needed at local levels to gather data, do the monitoring, and herd farmers into the data-collection squeeze chute to participate in climate-smart projects. The House Ag Committee expressed their concern about funds getting to actual farmers. (See Feb. 16, 2024 Milk Market Moos ‘carrot and stick’)

Hog wrestling strategy?

One could say there are a lot of pigs at the USDA climate trough. The whole deal needs a good auditing to see how much of what was spent or promised is getting into the hands of actual farmers and their on-farm contractors vs. going into the black hole of bureaucracy.\

While Trump’s Ag Secretary-Designate Brooke Rollins, still to be confirmed by the Senate, is only the second woman nominated to head the USDA, don’t let her femininity fool you. One thing we learned watching Rollins, 52, as a guest on legendary football coach Lou Holtz’s Nov. 4th Show about faith and leadership, this Texas Aggie was a hog wrestling champion.
Holtz asked Rollins about the hog wrestling title. It was 10 years ago when she and her sister Ann went to Bandera, Texas for an annual festival. They decided that year to enter the annual Wild Hog Explosion Contest. They won, even set a record, against younger women in the competition.

Rollins recalled: “We had a strategy and a plan, which seems to be a common theme in my life. You always have to have a strategy, and you always have to have a plan. We had a plan to wrestle that wild hog — and he was a wild, big hog — and put him into a bag and drag him across the finish line.”

A mom-coach could do wonders

USDA Secretary nominee Rollins also revealed that while coaching her daughter’s softball team a few years back when she was 10, they wrote their own mission statement that hung on the fence for every game. “Coaching is a reflection of life, to be our best, work as a team, have a common goal, never give up, and go for the win, every time.”

Rollins and Holtz talked of her leadership style to “find amazing people” to build teams that work together “not caring who gets the credit, but what gets accomplished.”

When asked the Bible verse most meaningful in her life, she said for this season in time “with the arrows slinging every which way,” Joshua 1:9 “Be strong and courageous. Do not be afraid; do not be discouraged, for the Lord your God will be with you wherever you go.”
One that strikes a chord throughout her life is: Matthew 25:40: “Whatever you did for one of the least of these brothers and sisters of mine, you did for me.”

When it comes to USDA’s failed nutrition policy, this verse rings true. It’s also worth noting that Rollins is a mother. That may be just what USDA needs at the top! Mom’s understand the school meal and school milk issue! Can we imagine how many more hungry children could be nourished if USDA devoted funds to the food that are now going to the bureaucrats calculating fat percentages and other criteria to regulate schools so they don’t violate the fat limits; and how much better off those children most reliant on school meals would be if they could choose nutrient-dense delicious whole milk, 3.25% healthy fat.

What’s up with milk production?

USDA Dairy Market News reports that milk availability is still tight for processors. Some processors expect milk availability to loosen in coming weeks, as plants slow production or shut down during the week of Thanksgiving. Class I bottling is strong as demand from schools is steady up to the coming holiday, and consumer demand increases. Demand from Class III is strong. Cheesemakers report that some plants are running as much as possible. Component levels are reported to be strong across the board. We’ll did into the report next week.

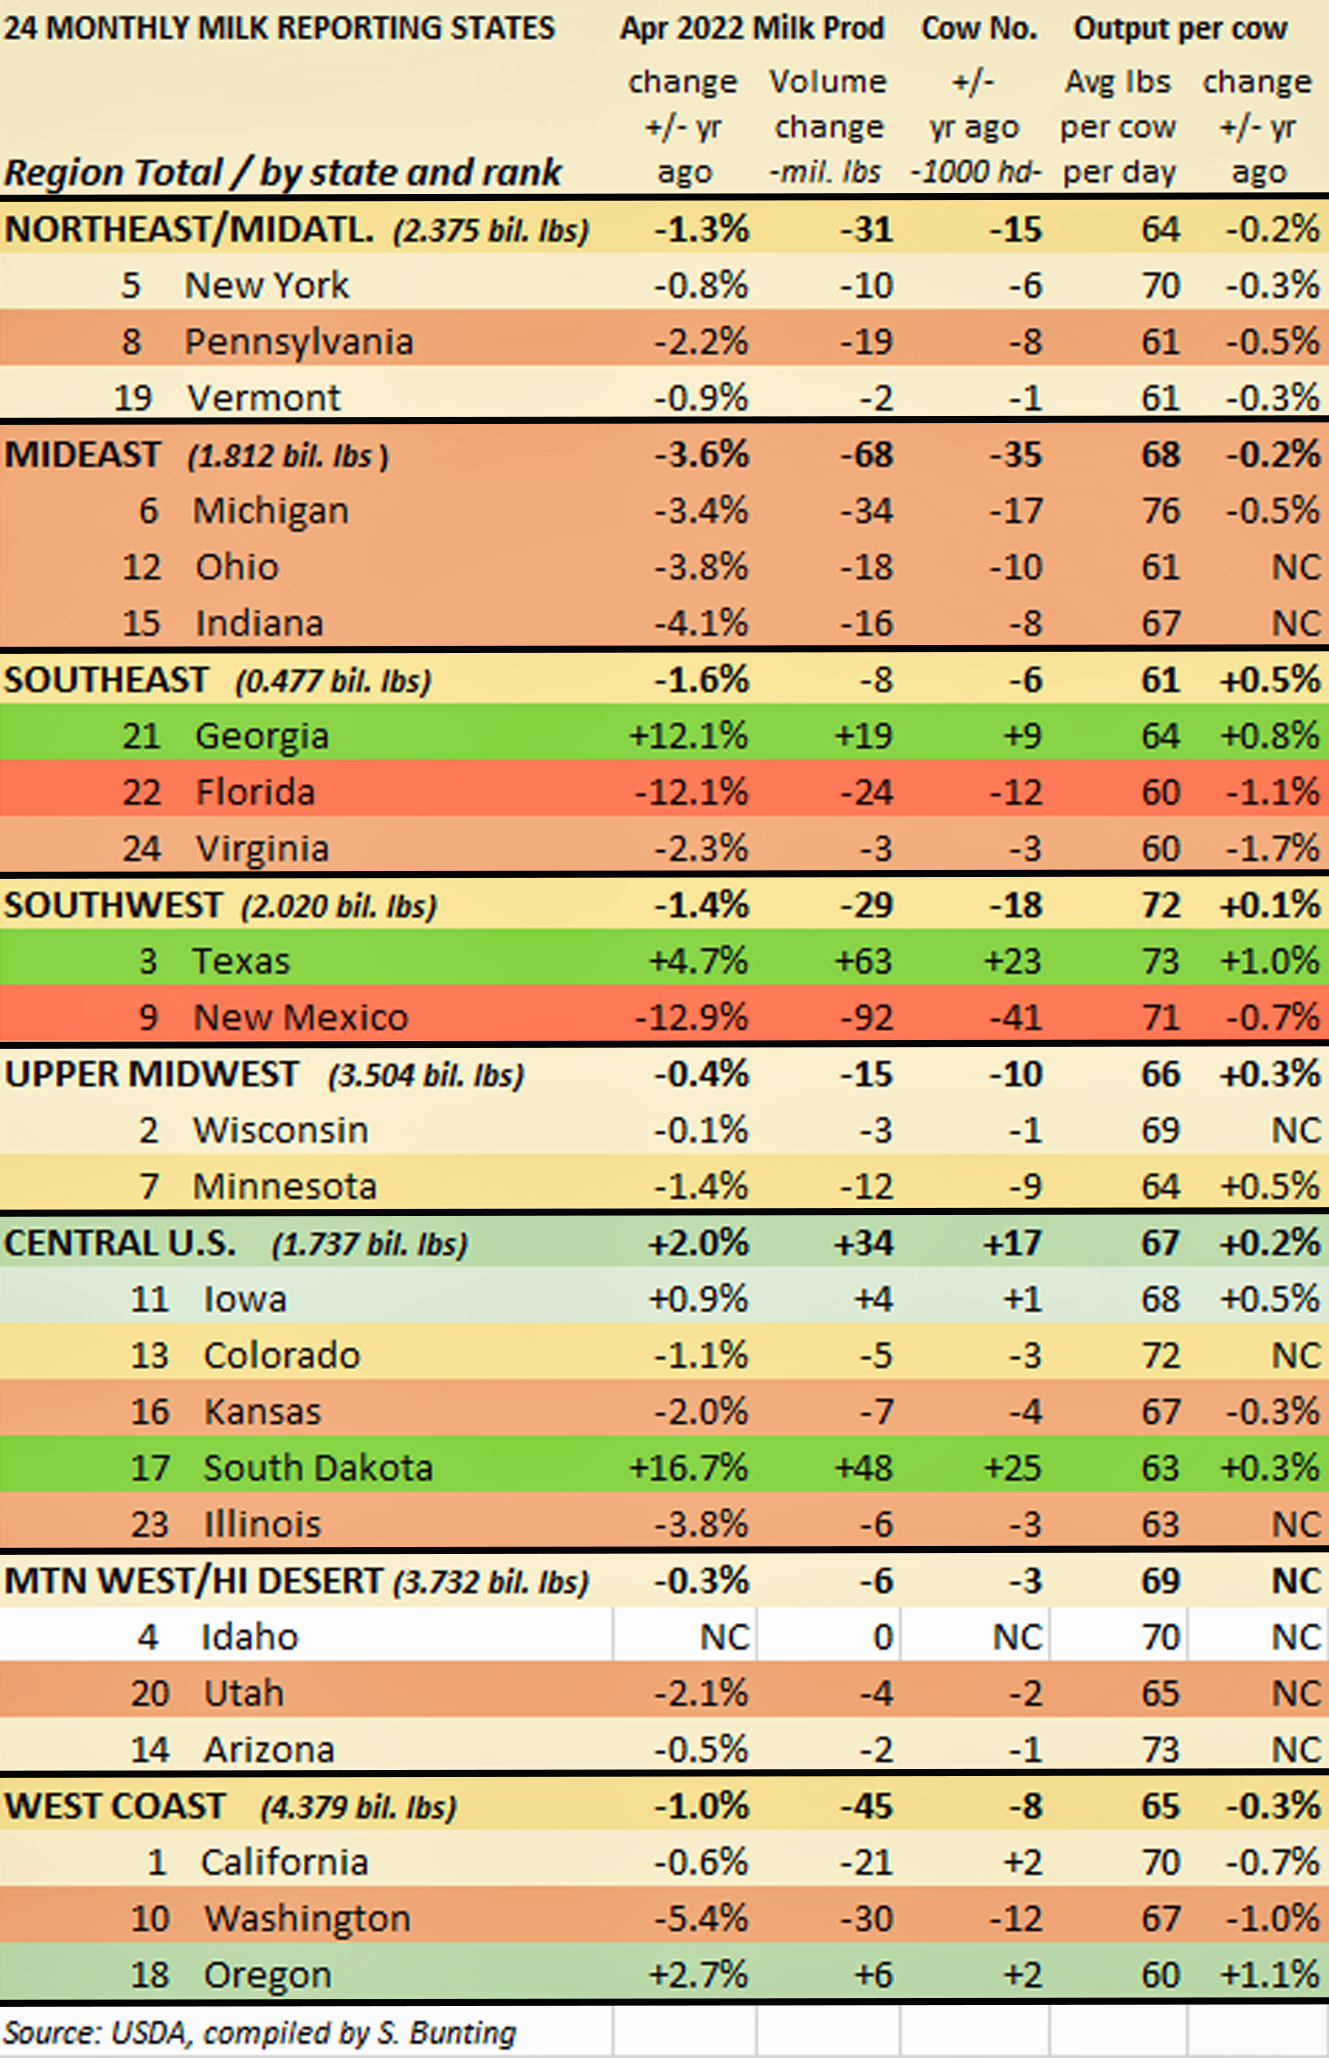
The USDA NASS milk production report released late Wednesday showed total U.S. milk production was up 0.2% in October vs. year ago. Meanwhile, milk production in the 24 major milk producing states gained 0.4% over year ago. For Q3, USDA reports total U.S. milk producers virtually flat with a year ago.

This indicates that states and regions that are expanding milk production rapidly in the Plains from western Minnesota, Iowa, South Dakota south to Texas, have large expansion units coming online — and their own circular systems for heifer-rearing are geared up to fill new stalls to supply new cheese processing that is coming online — perhaps not at all impacted by the overall tight supplies of milk cows, springing heifers, and bred heifers in today’s marketplace.

Remember, the current Secretary of Agriculture, Tom Vilsack, canceled the July 2024 mid-year All Cattle and Calf Inventory, so the industry won’t get a look at dairy and beef numbers until the end of January 2025.

In the East and Mideast, October’s milk production was generally steady vs. year ago. USDA estimates for Northeast and Midatlantic: Pennsylvania up 0.6%, New York up 0.2%, Vermont and Virginia down 0.5%; In the Southeast, Florida down 0.6% and Georgia up 1.9%; In the Mideast: Michigan up 0.5%, Indiana up 0.3% and Ohio down 0.2%.

Midwestern milk production slipped 0.2% and 0.5% in Wisconsin and Minnesota, but grew across the Central Plains, up 3.3% in Iowa, up 4.2% in Kansas, up 9.6% in South Dakota.
Southwest milk production grew a substantial 8.8% vs. year ago in the No. 3 milk producing state of Texas, while New Mexico continued its decline, off 4.4%.

California is in the midst of an escalation in bird flu with production down 3.3% vs. year ago. USDA APHIS reports 261 herds have had the virus in the past 30 days in California, 436 since the first outbreak there in September.

Dec. Class I mover drops $0.90 at $21.43

The December advance Class I base price mover was announced at $21.43 on Wed., Nov. 20 for a loss of 90 cents per hundredweight below November’s Class I mover, but up $1.67 per cwt. above a year ago.The USDA NASS milk production report showed total U.S. milk production was up 0.2% in October vs. year ago. Meanwhile, milk production in the 24 major states gained 0.4% over year ago. For Q3, USDA estimates total U.S. milk production virtually flat vs. year ago.

Class III milk slips lower despite less cheese

Despite USDA again reporting cheese stocks smaller than a year ago for the 8th straight month, dwindling to levels 8% below year ago, the CME spot cheese price headed south this week, dragging Class III milk futures lower too. On Tues., Nov. 26, Class III milk future averaged $18.77 for the next 12 months (Nov24-Oct25), losing 29 cents/cwt — more than was gained last week. Class IV milk futures were mixed, but the 12-month average fell a dime to $20.85.

CME dairy lower, but whey skyrockets

Dairy product prices on the CME daily spot market lost ground across the board this week, except dry whey gained an unprecedented nickel per pound, reaching just shy of what would be a near record 70 cents per pound.

On Tues., Nov. 26, the ‘market clearing’ dry whey price on the spot CME was a whopping 69 cents/lb with 6 loads trading over the 4 days pre-holiday. That’s more than a dime per pound higher than the weekly USDA National Dairy Product Sales Report price that has lagged all year and is the one used in the Federal Milk Marketing Order pricing formulas. Whey is usually the commodity to watch in relation to future milk prices, but it’s not translating. The 40-lb block cheddar price was pegged 4 cents lower at $1.6950/lb with just 2 loads trading over 4 days. Pegged at $1.64/lb, the 500-lb barrel cheese price lost 9 cents per pound with 8 loads trading across the 4 days.

On the Class IV side, the spot butter price fell 11 cents per pound, pegged at $2.4850/lb with 18 loads trading. Nonfat dry milk lost the penny gained last week, pegged at $1.39/lb with 21 loads trading in 4 days.

Live cattle imports from Mexico ‘paused’

USDA APHIS will halt cattle imports from Mexico due to a detection of New World screwworm (NWS) in Mexico Nov. 22. It was discovered in a cow at an inspection checkpoint close to Mexico’s border with Guatemala. USDA reports that around 5% of feeder cattle placements come from south of the border, meaning this pause in live cattle imports will further tighten beef supplies. The USDA cold storage report indicates red meat supplies continue to run below year ago levels.

USDA recommends changes to milk pricing formulas and other Milk Market Moos

By Sherry Bunting, Milk Market Moos column in Farmshine, July 5, 2024 (with updates)

USDA issued a 332-page recommended decision on July 1 for changes to pricing formulas in all 11 Federal Milk Marketing Orders, which was later published in the Federal Register July 15.

The bottom line is a mixed bag of positives, negatives, and questions requiring further study.

USDA AMS professionals did yeoman’s work with the 49 hearing days across five months of proceedings on 21 proposals, yielding 500 exhibits; more than 12,000 pages of transcripts of testimony from farmers, cooperatives, processors and others, along with cross-examination; and over 30 post hearing briefs and correspondence.

Once the draft decision is officially published in the Federal Register in the coming weeks, the 60-day public comment period begins, followed by 60 days of USDA evaluation of the feedback, followed by a final rule, followed by a producer referendum.

According to the FAQ section at the USDA AMS national hearing website, only producers who are pooled in the selected representative month in each Federal Order will be eligible to vote. Each of the 11 Orders votes separately.

If two-thirds of those eligible dairy farmers OR two-thirds of the pooled volume they represent in an Order vote “yes,” then that Order continues, as amended. If neither two-thirds threshold is met, then that Order is terminated. *AMS answered our question on the two-thirds determination that it is determined by the number of eligible (pooled) producers who actually participate in the vote, stating: “If a producer receives a ballot but does not return it, the producer is not included in either the numerator or the denominator of the two-thirds calculation.”

Here’s what’s in the USDA recommended decision package:

1) Milk Composition Factors: USDA recommends updating the milk composition factors to 3.3% true protein, 6.0% other solids, and 9.3% nonfat solids. This would mainly affect Class I in all Orders and the other Class prices in the fat/skim priced Orders.

2) Surveyed Commodity Products: The recommendation here is to remove the 500-pound barrel cheese prices from the Dairy Product Mandatory Reporting Program survey and rely solely on the 40-pound block cheddar cheese price to determine the monthly average cheese price used in the Class III and protein formulas. National Milk Producers Federation (NMPF) proposed this and International Dairy Foods Association (IDFA) opposed it. American Farm Bureau Federation (AFBF) had proposed adding unsalted butter and 640-lb block cheddar to the survey, and California Dairy Campaign had proposed adding bulk mozzarella. Neither of these proposals were included in USDA’s recommended decision.

AFBF chief economist Roger Cryan discussed this recently on Farm Bureau Newsline, where he also talked about USDA decision not to include AFBF’s proposal to raise the Class II differential.

3) Class III and Class IV Formula Factors: USDA chose to recommend make allowance increases that fall in between the lower increase proposed by NMPF and the higher increase proposed by IDFA and Wisconsin Cheesemakers. The USDA recommendation is to raise these manufacturing allowances from current levels to these new levels: Cheese: $0.2504; Butter: $0.2257; NFDM: $0.2268; and Dry Whey: $0.2653. The recommended decision also proposes updating the butterfat recovery factor to 91%.

By our calculations, the proposed make allowance increase would equate to roughly an additional 80 cents per hundredweight deduction from milk checks embedded in the pricing formulas. Current make allowances total up to about $2.75 to $3.60 per hundredweight, depending on product mix. New make allowances would total up to about $3.25 to $4.50 per hundredweight, depending on product mix.

AFBF economist Danny Munch was interviewed by Brownfield Ag on July 2, noting the increase is 5 to 7 cents per pound. “When we loop that into a per-hundredweight value, that means farmers will be seeing 75 cents to 87 cents less per hundredweight on their milk checks because of the increased make allowance.” He says the data used for the make allowances was based on voluntary cost of production surveys. 

Farm Bureau president Zippy Duvall did not mince words: “We strongly believe make allowances should not be changed without a mandatory, audited survey of processors’ costs. Our dairy farmers deserve fairness in their milk checks and transparency in the formula, but the milk marketing order system can’t deliver that unless make allowances are based on accurate and unbiased data,” he said in an AFBF news release.

American Dairy Coalition CEO Laurie Fischer also weighed in: “We are disappointed that USDA has proposed higher make allowance credits for processors, which are — in effect — deductions from farmer milk checks that are embedded within the pricing formulas. The industry does not yet have mandatory, audited cost surveys, and there is no connection between increased processor credits and a transparent, adequate price paid to farmers,” she said in an ADC news release, adding that these two elements have been key policy priorities for ADC since January of 2022.

4) Class I differentials: USDA recommends updating Class I differential values to reflect the increased cost of servicing the Class I market. The base differential for all counties stays at $1.60, and the county-specific Class I differentials are specified in the decision at levels higher than they are currently, but by less than the increases that had been proposed by NMPF.

5) Base Class I Skim Milk Price: USDA recommends going back to the higher-of the advanced Class III or Class IV skim milk prices to set the Class I mover each month. However, the Department did not go with Farm Bureau’s request to do this on an emergency expedited basis.

And, here’s where it gets tricky, the higher-of method would only apply to fresh fluid milk, while adopting a rolling monthly adjuster that incorporates the average-of for milk that is used to make extended shelf life (ESL) fluid products, including shelf-stable milk.

This means ESL milk would be priced differently from conventional fresh fluid milk within the same Class I category. A simple averaging method would be used as part of this special ESL adjuster, which would incorporate a 24-month rolling average (with a 12-month lag) of the difference between the higher-of minus the average-of, which is added to the current month simple average-of, and then the current month higher-of is subtracted from that sum. This adjuster could be either a positive or negative number.

In fact, we’ve learned that this ESL adjuster, using months 13 through 36 counting backward from the implementation date, would allow milk for ESL products to recoup, over time, some of the very large prior losses experienced by all dairy farmers during the average-of method that has been in place since May 2019. Because a simple average is used for the adjuster calculation, without the 74 cents, more would be recouped than the actual loss difference experienced under the years of the average plus 74 cents method. On the other hand, the rolling adjuster look back will include months in which a smaller make allowance was in effect than could be the case in the future if USDA’s make allowance recommendation becomes final.

Meanwhile, producers of milk bottled as ‘regular’ fresh fluid milk would start right out of the implementation gate at the higher-of and recoup zero prior loss endured under the current form of average-of, and be subjected to the higher make allowance, which is built into the advance pricing factors. (More on this feature of the USDA recommended decision in a future article.)

In its ‘notice to trade,’ USDA states that the ESL adjuster was developed to “provide for better price equity for ESL products whose marketing characteristics are distinct from other Class I products.”

Meanwhile, in his July 3rd CEO’s Corner, NMPF’s Gregg Doud appears to embrace what is essentially a fifth milk class given the different pricing methods proposed in the recommended decision for Class I — depending on shelf-life classification.

Doud writes: “Recognizing the need to restore orderly milk marketing, USDA decided to go back to the higher-of, with an accommodation for extended shelf-life milk, thus granting NMPF’s request for the vast majority of U.S. fluid milk. USDA’s solution is, frankly, as innovative as it is fair – a classic case of two sides not getting all that everyone wanted, but everyone getting what they most needed.”

Splitting the baby was not part of any hearing proposal that we could find; apparently processors made their case with USDA as to needing the average-of method (with calculated adjuster) to sell ESL milk products deemed the new milk beverage platform.

During the national hearing in Carmel, Indiana, representatives from Nestle, a major maker of ESL fluid milk products, said their sales increased once the average-of method was implemented in May 2019 through legislative language in the 2018 farm bill. They testified that they could manage risk when providing 9 to 12 month future pricing on shelf-stable fluid products to foodservice and convenience stores. They lamented that losing the average-of would hurt their sales.

Representatives for fairlife testified that forward pricing of their ESL products was critical to their ability to grow sales and that losing the average-of would impact future plans, including the size of the new plant being planned for New York State and other expansions elsewhere in the future.

However, since this bifurcation of Class I was not a proposal subject to vetting, no one had the opportunity to present evidence on future impacts.

Public comments on the recommended proposals will be accepted for 60 calendar days after the decision is published in the Federal Register. Comments should be submitted at the Federal eRulemaking portal: http://www.regulations.gov or the Office of the Hearing Clerk, U.S. Department of Agriculture, 1400 Independence Ave., SW, Stop 9203, Room 1031, Washington, DC 20250-9203; Fax: (844) 325-6940.

OTHER MOOS — July 3, 2024

Milk futures swap trends: Cl. IV up, III down

Class III milk futures moved lower this week especially on August and Sept. 2024 contracts; while Class IV milk futures were higher on 2024 contracts, steady to firm for 2025. On Tues., July 2, Class III milk futures for the next 12 months averaged $19.28, down 24 cents from the previous Wednesday. The 12-month lass IV milk futures average was $21.19, up 14 cents. This put the spread between Class IV over III at nearly $2.00 per cwt.

Block cheese, whey higher

Pre-holiday trade was firm to higher with little volume moved on most products. But nonfat dry milk lost ground, and the 500-lb barrel cheese trade was active at lower prices.
The 40-lb block Cheddar price was pegged at $1.90/lb on Tues., July 2, up 2 cents from the previous Wednesday, with just 2 loads trading the first 2 days. The 500-lb barrel cheese market lost 2 cents, pegged at $1.88/lb Tuesday with 12 loads trading the first two days. (Update gained it back July 3 at $1.9025/lb with 2 loads trading). Dry whey gained a half-penny on the week at 49 cents/lb; one load traded.

Butter higher, powder weak

The butter market saw no trades the first two days this week. By Tues., July 2, the daily CME spot price was pegged nearly a nickel higher at $3.1375/lb. Grade A nonfat dry milk lost a penny and a half at $1.17/lb Tuesday with 4 loads changing hands. (Update, NFDM up July 3 at $1.18/lb, 2 loads traded)

May All-Milk $22.00, DMC margin $10.52

USDA announced the All-Milk price for May at $22.00, up $1.50 from April and $2.90 higher than a year ago. The national average fat test was 4.17, up 0.02 from the previous month and up 0.11 from a year ago. The Pennsylvania All-Milk price for May, at $22.50, was just 70 cents higher than for April, and fat test fell by 0.10 from April to May.

USDA announced the May Dairy Margin Coverage (DMC) margin at $10.52/cwt, up 92 cents from April and up a whopping $5.69 per cwt from the May margin a year ago. This is the third consecutive month in which no DMC margin payments were triggered as the margin remains above the highest coverage level of $9.50/cwt. The $1.50/cwt gain in the national average All-Milk price in May outpaced the 58 cents/cwt increase in feed cost.

H5N1 detections fall to 57 in just 7 states

As of July 2, 2024, the confirmed cases of H5N1 in dairy cows decreased to 57 herds in now just 7 states as South Dakota moved past the 30-day window and off the active map. Colorado has the most detections at 23 in the past 30 days, 27 cumulatively since April 25. This has created some questions as it represents 20 to 25% of the 110 herds in the 13th largest milk-producing state. Colorado is followed by Iowa (12), Idaho (9), Minnesota (6), Texas (5), while Michigan’s previously high numbers over 25 have dropped to one, and Wyoming still has just one. Michigan and Wyoming will be past their 30 days on July 7 and 12, respectively, if no new detections are confirmed.

MILK MARKET MOOS – Bad news in this week’s mailbox, but better views ahead!

By Sherry Bunting, Portions reprinted from the May 10, 2024 column with a few preview notes for the May 17 weekly Milk Market Moos, available exclusively in Farmshine Newspaper

This week’s settlement checks for April milk are hard hit by the record-low protein price of $0.83/lb and the $4 to $5 spread of Class IV over III that continues to depress the Class I price via the ‘average of’ method — resulting in depooling of higher value manufacturing milk. But the good news is the cheese markets have sustained a 5-week rally that has been heating up, pushing Class III milk futures higher, while tight supplies of nonfat dry milk moved briskly at higher prices to keep Class IV forging ahead too.

First the bad news: April FO blend prices are mixed with component-pricing lower, Fat/skim-pricing generally higher

The record-low April protein price of 83 cents/lb and second lowest Class III price of the year pushed the Federal Order (FO) blend prices 25 to 45 cents lower in six of the seven FOs that use Multiple Component Pricing (MCP). The Northeast, was off just 9 cents, given the fact that processors still pooled some milk used for higher value Class II and IV products, although not as much. De-pooling of Class II and IV milk was heavier in other MCP FOs due to the whopping $5 spread between Class II and IV ($20.23 and $20.11) over Class III ($15.50) and the fact that Class II and IV were $1.00 higher than the Class I ‘mover.’

The wide spread pushed the Class I ‘mover’ price $1.00 lower using the ‘average of’ calculation than it would have been under the previous ‘higher of’ method. The May Class I mover price is even more disadvantaged — down $1.73 vs. ‘higher of’ — based on the advance pricing factors at the beginning of April before the CME cheese market rally begins filtering its way into USDA weekly surveys and FO formulas.

Three of the four fat/skim priced FOs — Florida, Southeast and Appalachian — have April blends that are mostly 20 cents higher than March. Fat/skim priced FOs benefitted from the butterfat price at $3.33/lb and a solids nonfat (skim) price at 97 cents/lb that was 14 cents higher than the protein price. This is the first time such an inversion has occurred.

Meanwhile, the fat/skim-priced Arizona FO (131) saw its April uniform price fall by 19 cents due to Class II and IV depooling, which increased the negative effect of a higher Class III utilization percentage.

The uniform price in the three southeastern region FOs (5, 6 and 7) would have netted an additional 70 to 80 cents per cwt — if Class I had been priced via the ‘higher of.’ The Mideast (FO 33) would have netted 40 cents per cwt more; the Northeast, Central, and Southwest (FOs 1, 32 and 126) 29 to 30 cents; California and Pacific Northwest (FOs 51 and 124) 20 cents; Upper Midwest (FO 30) 6 cents. All MCP FOs would have benefitted from better alignment keeping more of the higher-valued Class II and IV milk in the FO revenue sharing pools. It’s hard to say whether or how much of the windfall profits of depooling are consequently shared with dairy farmers shipping the milk.

Once again, the Upper Midwest (FO 30) had the rock-bottom uniform price of $15.95 at 3.5% butterfat, with over 92% of the utilization being Class III. If the ‘higher of’ had been used for pricing Class I, the pounds of Class II and IV utilization would likely be greater, which may have contributed to a more positive uniform blend price while yielding a little more than a nickel of additional Class I contribution. Instead, the blend price included less than 2% Class II and IV, and just over 6% Class I.

The FO 30 market administrator saw fit to send a reminder letter to handlers in March that they must show separately how milk payments were calculated for producers having both pooled and depooled milk to ensure the pooled milk was paid at the FO minimum price. Even 100% pooled producers have been seeing ‘milk check gymnastics’ such as underpayment of the FO minimum for ‘other solids’, and then using the producer’s protein premium to make up the difference in order to achieve the regulated gross minimum.

According to USDA AMS, Federal Milk Marketing Orders with multiple component pricing, use individual component values to determine the minimum gross value due to producers. The FMMOs’ primary function is to ensure that the gross payment to the producer is at least equal to the minimum payment for their pooled milk. Enforcement of individual component values may be pursued by FMMOs to prevent handler deception and maintain transparency. In FMMOs where it is common to pool only a portion of a producer’s milk, proprietary handlers are required to send statements to producers indicating the separate amounts paid for pooled and non-pooled milk.

The April 2024 uniform prices and PPDs were announced May 12 through 14 as follow (+/- change from month ago):

Now the good news! What’s UP with Class III?

For 18 months, Class III has been the underdog in milk pricing, especially rough for dairy producers in the Upper Midwest struggling under the brunt of FMMO 30 blend prices built mainly on Class III.

In fact, the April protein price hit a record low, announced May 1st at 83 cents/lb, which is 14 cents below the 97 cents/lb price for solids nonfat. This inversion has never happened before, according to our search of class and component pricing archives.

The butterfat price for April is quadruple the protein price at $3.33, creating additional divergence issues in multiple component pricing orders.

Meanwhile, the Class III milk futures haven’t offered much of a breakeven price to spend money protecting with hedges or DRP…

Until now…

Class III milk futures continued higher — skyrocketing limit-up for nearby contracts Wed., May 8, putting the exclamation point on five straight week of gains that have added $3 per hundredweight to the remaining 2024 contract months, going from the $16s and low $17s to the $19s and $20s, with 2025 contracts well into the $18s. This is the first time the Class III milk futures board has seen a $20 mark in over 18 months.

Class IV futures also made solid 20- to 30-cent gains charting over $20 and $21 across the board.

If the current Class III rally goes too far, too fast in the near-term, we could see negative PPDs in some Federal Orders in June for May’s milk because the May Class I advance base price mover was already announced in mid-April, and includes the much lower advance pricing factors of the (Class III) cheese and whey markets during the first two weeks of April.

The ‘average of’ method disadvantaged the May Class I mover by $1.73/cwt, which will undoubtedly be a factor for milk pooling / depooling decisions at the end of this month as Class I, at a base price of $18.46, will likely be rock-bottom lowest class for May, except where location differentials are high enough to boost it.

$20 finally appears on Class III futures board (June), Spot cheese hits highest price in over a year.

On Wed., May 8 the Class III milk futures for the next 12 months (May24 through Apr25) averaged $19.04, up 54 cents from the previous Wednesday. Class IV milk futures averaged $20.86, up 22 cents from the prior Wednesday.

The milk futures rally is driven by the upward momentum in CME daily spot cheese markets, reaching levels May 8 that are 50 to 55 cents per pound higher than six weeks ago.

The 40-lb block Cheddar price roared 11 1/2 cents higher to $1.95/lb in a single trading session Wed., May 8, gaining 20 cents/lb on the week, and hitting the highest level since last fall, with a single load trading. For 500-lb barrel cheese, at $1.90/lb, the gain was a dime on the week, and the highest price in over a year, with zero loads trading.

(Spoiler alert, the spot price for 500-lb barrel cheese skyrocketed well north of $2 on Tues., May 14 with a single load trading at $2.06. Conversely, Tuesday’s trading session on 40-lb block Cheddar started out moving a load as high as $2.00/lb, which would have been a 2-cent gain for the day. However, after the dust settled on the brisk trading session that moved a whopping 14 loads of blocks in a few short minutes, the market was pegged at the lowest load price of $1.93/lb — down 5 cents from the day before. A bid came in at $1.92 and was ignored after such an abnormally large clearance of blocks for a single session. More on this in the May 17 Farmshine.)

All other dairy commodity prices were higher Wed., May 8, with no trades changing hands. Dry whey gained a penny at 38 1/2 cents/lb (where it continued trading on Tues., May 14 with 2 loads changing hands). May 8th Butter was up 2 cents at $3.02/lb (but traded 16 loads at $3.00/lb Tues., May 14 and 1 load at $2.99/lb, which was a 3-cent loss since the low price is the peg for the day). Nonfat dry milk (NFDM) was up a penny at $1.13/lb on May 8 (and gained 3 1/2 cents more on May 14 at $1.1650/lb with an incredible 26 loads moving in a single session’s narrow $1.16 to $1.1650/lb range).

Dairy farmers will not see these gains in their milk checks until June, if the trend is sustained.

In the face of lower overall dairy exports, analysts tout the record volume of cheese exports in March, which were no-doubt prompted by the cut-rate January through April pricing that doesn’t pay bills on the dairy farm.

We have to go back to 2019 to find a 4-month Jan-April average Class III milk price that was lower than the first four months of 2024. We have to go back to the Covid shutdown in 2020 to find an April Class III milk price that was lower than April 2024. But even then, protein held up at $2.48/lb, not the 83 cents per pound that USDA announced for April settlement.

The difference this time is that fat is so much higher (quadruple the protein price at $3.33/lb for April). This essentially pulls a credit out of protein as an adjustment in fat values for cheese vs. butter. This is a seldom-discussed and little understood function of FMMO multiple component pricing, and another downfall of the many months of wide Class IV over III divergence.

Better views ahead… Higher Class I sales and record-high made-to-order fresh mozzarella production compete with stored product output for reduced milk supply

While the rear-view mirror shows the rough road traveled, the view ahead is improving for Class III milk and the beleaguered record-low protein price. Milk production is down. Packaged Class I fluid milk sales are UP. Processors are making record amounts of fresh (made to order) mozzarella cheese, causing Cheddar production to slow. Meanwhile, Class IV product supplies are tight. (One reason overall U.S. dairy exports were down is that inventories and production of milk powder is down!)

The most recent USDA Dairy Products Report showed Cheddar cheese production down 3.3% year-over-year (YOY) in March, with all American style cheeses down 2.9%. A positive this year that was missing last spring and summer is the draw for milk to make Italian cheeses.

Mozzarella production set records in March, up 6.8% YOY, but those products are not price-surveyed, nor are they included in the FMMO Class III pricing formula.

In addition to Cheddar cheese, the Class III price is also made up of dry whey sales via the ‘other solids’ component. Whey production for both human and animal use is accelerating as inventories of value-added whey protein concentrate (WPC) and whey protein isolates (WPI) were more than 40% below year ago at the end of March, despite March WPC production being up 1% for human use and up 40% for animal use; WPI up 73% YOY.

Dry whey is the commodity used in the FMMO Class III pricing formula with production up 2.4% for human use and 19.2% for animal use in March.

On the Class IV side, butter production was up 1.5% YOY in March with inventories up 2%.

As for powders: Whole milk powder (WMP) production was down 14.6% with inventory 36.3% lower YOY; Skim milk powder (SMP), typically made for export orders, was down 41.7%; and Nonfat dry milk (NFDM) output was down 7.9% YOY in March with inventories off 20.3%.

On the flip side, milk protein concentrate (MPC) production was the contrarian — up a whopping 38.5% YOY in March. MPCs are often used to bump cheese yields higher per hundredweight of raw milk.

These factors beg questions: Why were Class III milk prices for the first four months of 2024 at 5-year lows and protein at a record-low 83 cents per pound for April? Was it the plan to crush Q-1 2024 spot cheese and Class III milk prices to generate record cheese export volumes in March? Are cheesemakers using some of that big increase in MPC production to make more cheese from each cwt of raw milk? Are bioengineered fermentation yeast proteins that are marketed in trade publications as ‘dairy protein analogs’ diluting the supply and demand equation fractionally?

Global picture improving

The global picture is also improving. New Zealand tallied a lower output for the season, and recent reports show stable to lower milk output in EU countries.

In the Global Dairy Trade (GDT) biweekly internet auction Tues., May 7, the all products index was up 1.8% over the previous auction on April 16. This includes a whopping 8% increase in the GDT price index for bulk Cheddar sales contracted out through November, plus a 2.3% increase in bulk Mozzarella sales for July.

In fact, GDT Cheddar contracts for June were up 6.5% in Tuesday’s auction; July up 3.9%; August and September had no sales. October and November contracts were up 11.2 and 12.5%, respectively, compared with three weeks ago.

Feb. 16, 2024 Milk Market Moos in Farmshine: SHRINKFLATING DAIRY — steep loss of dairy farms, down 40%, and much, much more

By Sherry Bunting, Farmshine Weekly Column

Carrot… and stick?

Opening the Feb. 14th House Ag Committee hearing with USDA Secretary Tom Vilsack, Committee Chairman G.T. Thompson of Pennsylvania said the clear message he has heard as he has traveled across the country on farm bill listening sessions is that, “Agriculture needs government to work for them, not against them.”

Vilsack was pressed at least 8 times by 8 different members of the Committee for clarity and details on the Climate Smart deal. Representatives wanted an update on how the billions of dollars in Inflation Reduction Act (IRA) funds for conservation programs and Climate Smart Partnerships are making it directly to farmers.

Rep. Mary Miller of Illinois went so far to say the climate cult is a scam and pointed to what is happening in Europe, airing her concerns about incentives for solar panels on good farmland pricing farms out of rented acres. She expressed concern about getting farmers reliant on “environmental payments” instead of a food system that allows farms to succeed producing food, and she wondered about being beholden to the global climate-cult, which means (I’m paraphrasing) she is concerned about the stick that follows the climate-smart carrot.

While the purpose of these conservation and Climate-Smart IRA funds, said Vilsack, is to ‘get money to farmers,’ his update acknowledged that, “There’s a lot of work to do. We’re assisting and guiding (farmers) into participating,” he said.

“We’ve increased the number of people working at NRCS (1500 new hires, total 4000 new hires planned). We’ve entered into cooperative agreements so we have a broader reach (hire estimated 3000 technical staff through conservation partners), so that those who might not be able to understand that they qualify for the program are finding out,” Vilsack explained, noting that this is necessary in order to actually implement the Inflation Reduction Act.

(Translation: Money hasn’t gone directly to farmers so much as it has gone to program infrastructure, such as more USDA staff, partnership staff, and developing the herding routines to get farmers ‘guided’ on board for Climate Smart data collection and monitoring. In contrast, the IRA funds going to traditional and oversubscribed conservation program EQIP have largely been obligated to farmers at this point.)

“Roughly 85 to 88% of farmers in this country today require off farm income to be able to keep the farm. It’s about people who love what they’re doing and frankly want to do more of it, but they don’t have the income streams to support it, so they have to have an off farm job,” said Vilsack, defending the deal.

“To me, the key here is to create opportunities for that farm to generate more revenue,” he added.

Rep. Marie Gluesenkamp Perez of Washington State made the point that, “Farmers should not have to rely on value added ventures to survive, like agro-tourism or solar panel installations. These are ventures in their own right and should not be necessary for farmers to continue and pass on their farms to the next generation,” she said.

Rep. Doug LaMalfa of California pushed the point that farmers like the traditional conservation programs, like EQIP, but the IRA-funded Climate-Smart Partnerships deal for “tying up carbon is going to require them to jump through hoops,” he said, noting that no-till and cover crops aren’t possible on some types of farms, like rice production.

Vilsack countered: “It’s voluntary. It gives us the opportunity to figure out what works and what doesn’t work, and it doesn’t necessarily put people at a competitive disadvantage.”

He maintains that these projects “do not require farms to go through hoops and in some cases, it’s actually paying them for what they’re already doing.

“The idea here is to measure, monitor and verify the results so that we know what works and what doesn’t work, so that we don’t invest in what doesn’t work,” said Vilsack.

Congresswoman Abigail Spanberger of Virginia gave the example of a farmer in her district doing no-till and cover crops. Vilsack nodded and replied: “There is an opportunity, potentially, for that farm to qualify for ecosystem market payments. So, now, instead of just a crop, they’re going to get an environmental payment.”

That’s the carrot, where are they hiding the stick?

40% decline and a loss of 15,866 dairy farms in 5 years.

The number of dairy farms in the U.S. declined by 40%. That’s 4 in 10 dairies lost over 5 years. The 2022 Census of Agriculture Report released Tues., Feb. 13 held a bit of a surprise not seen on available summaries. Clicking through the ‘quick stats’, we learn that the number of dairy farms with milk sales on December 31, 2022 totaled 24,082, and the number of farms with milk sales but no milk cows or calves in inventory at the end of 2022 was 388 for a total 24,470 dairy farms with milk sales in the U.S. at the end of 2022.

It’s also 3,462 fewer dairy farms than the 27,932 licensed dairies reported as an average number for 2022 last February as part of the January 2023 milk production report.

(Note: The 2023 annual average dairy data that was included in the January 2024 Monthly Milk Production Report Feb. 21 pegged the average number of licensed dairies in the U.S. in 2023 at 26,290, down 6% from the annual report filed for 2022. The Census and NASS Milk Production Reports count some types of multi-site dairies under the same ownership differently. By the way, USDA revised the entire 2023 year of production lower yet for the fourth time, now revising 11 of the 12 months of prior data reported for milk production, cattle numbers, and output per cow. We questioned the figures all last year, asking where the cattle were coming from, pointing to cattle inventory numbers on heifer replacements a year ago indicating a shortage of freshening 2-year-olds, etc., and pointing to the substantial increase in Whole Milk Powder Imports into the U.S. and other factors USDA may have left unaccounted for in prior estimations.)

In Pennsylvania, dairy farm numbers declined from 6,914 on Dec. 31, 2017 to 4,027 on Dec. 31, 2022, that’s a 42% decline over 5 years. It’s also 973 short of the average number of licensed dairies reported by USDA NASS for the 2022 year.

The 2022 Census of Ag also shows that of the 24,470 farms with milk sales, 3,439 accounted for 59% of milk sales and 1012 accounted for 46%. This compares with the 2017 Census, which reported 3819 farms accounted for 55% of milk sales and 793 farms accounted for 43%.

We will dig into the national and state by state 2022 Census data relative to dairy in a future report.

In agriculture, overall, the 2022 Census of Ag shows a loss of 142,000 farms (down 7%) and a loss 20 million farm acres (down 3%) in the past 5 years.

Between 2017 and 2022, the number of U.S. agricultural producers held steady at 3.4 million, while the number of farms continued to decline at 1.9 million covering 880.1 million acres that generated food, fiber and fuel. Average age of farmers was up at 58 years. But the number of beginning farmers (over 1 million), increased also, according to the Report.

The number of small and mid-sized farms across all commodities declined between 2017 and 2022. Large (sales $1-5 million) and very large farms (sales of $5 million or more) increased in number. The 105,384 farms in those top two categories (sales of $1 million or more) represented fewer than 6% of all U.S. farms and sold more than 75% of all agricultural products. The largest farming operations and a small number of states accounted for the majority of agricultural production and sales.

The overall value of agricultural production and income increased between 2017 and 2022, according to the Ag Census. 2022 was a high year in agricultural price cycles, and government payments were still part of the economic calculus through prior CFAP and Pandemic Assistance. Milk made it into the top 5 commodities (at No. 5). Combined, the top 5 — accounted for two-thirds of the value of all agricultural production.

The value of crop production was $281 billion, up 45% in 2022 vs. 2017, while the value of livestock production (including dairy) was $262 billion, up 35% over the same period.

Shrinkflation this, shrinkflation that

The January Consumer Price Index (CPI) released Tues., Feb. 13 increased 0.3% on a seasonally adjusted basis. Over the last 12 months, the all items index increased 3.1% before seasonal adjustment. The food index, up 0.4% in January, increased 2.6% over the last 12 months. The food at home index was up 0.4% in January, and up 1.2% over 12 months, while the food away from home index rose 0.5% over the month and 5.1% over 12 months. The dairy and related products index is up 0.2% in January, down 1.1% over 12 months.

In contrast, the energy index fell 0.9% over the month, down 4.6% on the year due mainly to the decline in the gasoline index.

The Biden Administration announced intentions to investigate supermarkets for over-charging as the food index has not followed energy lower. What further complicates the food inflation indexes is that food commodities like milk and eggs have moderated while processed consumer packaged goods continue to inflate.

Another ripple is captured in the new term coined by food, ag, and business analysts — “shrinkflation” — meaning smaller packages, same price.

For farmers, shrinkflation is a good way to describe what is happening to milk margins. Yes the central feed and energy costs are moderating, but many other fixed and adjustable costs — from interest rates and insurance to supplies and services — continue to move higher, shrinkflating profit margins.

Meanwhile, the Census of Ag data showed big gains for farm revenue and net income in 2022 vs. 2017, but this unique comparison does not factor in the margin-squeeze in 2023, nor the impact of losing the last of the CFAP and Covid pandemic assistance payments that were still trickling into 2022.

In the dairy sector, the milk markets send mixed messages as the Class IV milk price sits $4 above Class III, with cheese being the market dog for the past 12 months. Yet milk is not moving from Class III manufacturing (cheese/whey) to Class IV (butter/powder). Why? New Class III manufacturing capacity has come online and will continue, needing to run full to turn a profit.

At the recent Pennsylvania Dairy Summit in a presentation about navigating the future, Phil Plourde of Ever.Ag highlighted the critical importance of exports to the industry. “Export or perish!” he said, focusing the admonition on the opportunities to export more cheese, including mozzarella.

IDFA CEO Michael Dykes in a presentation in January, issued the challenge to producers to fill the production gap that $7 billion in planned processing investments will bring online in the next three to five years.

Meanwhile, U.S. dairy farmers are seeing price pressure from a buildup of cheese via lackluster exports suffering from what are seen as inadequate trade policies and lack of new trade agreements.

Reflecting on the recently concluded FMMO hearing of 21 milk pricing proposals — some of which seek to reduce regulated minimum milk prices — we see processors are focused on a shrinkflated milk pricing system, shrink prices and inflate capacity because growth has got to happen.

They say USDA sets the regulated minimum prices too high, which must be reduced to ‘market clearing’ levels so they can have the freedom and band width to then be able to pay market premiums to their farmers.

On the eve of the Pennsylvania Dairy Summit Feb. 6, Cornell economist Dr. Chris Wolf talked about the recent FMMO hearing, noting that, “Regulated minimum prices are the whole deal right now. Premiums are gone.”

He showed charts tracking the difference between the All Milk price and Mailbox price (above), progressively negative since 2015, reflecting higher transportation costs and evaporation of over-order premiums, not to mention milk check assessments, marketing adjustments, balancing fees.

If regulated minimum prices are reduced, will processors voluntarily fill that gap by paying more premiums so producers have the financial wherewithal to fill the production gap?

Things are pretty bad for farmers right now in the milk markets that are based on cheese, where capacity has ramped up in the Central U.S., and where tough discussions are being had around kitchen tables about operating margins and the future.

Milk futures move lower

Milk futures were unevenly lower this week, with most of the downward pressure on first-half 2024 contracts for both Class III and IV milk. The spread between Class III and IV milk — according to this week’s CME futures markets continues to be range between $2.20 and $4.00 per cwt in every single month of 2024, well above the $1.48 mark where the ‘averaging’ formula is a loser for orderly marketing compared with the ‘higher of.’ On the close Wed., Feb. 14, Class III milk futures for the next 12 months averaged $17.91, down 10 cents from the previous Wednesday. Class IV milk contracts average was $20.57 — down 7 cents.

Back on the see-saw

The daily CME spot market for dairy products was mixed and mostly lower this week, except dry whey was higher and barrel cheese fully steady. Spot butter was pegged at $2.7175/lb, down a nickel from a week ago with zero loads trading. Grade A nonfat dry milk was $1.18/lb, down 4 cents with a single load changing hands. On the Class III side, 40-lb block Cheddar gave up 7 cents in Wednesday’s session, alone, when declining bids with no trades left the spot price pegged at $1.5150/lb, down 11 cents from the previous week. Barrel trade had moved higher earlier in the week, but a 2-penny loss Wednesday left the spot price firm on the week at $1.5750/lb with 2 loads trading. Dry whey at 52 cents/lb was 3 cents higher than a week ago with no trades.

-30-

MILK MARKET MOOS — May 18-25, 2022

Market Moos is a weekly column in Farmshine by Sherry Bunting

US Apr. milk output off 1%, Georgia surpasses Florida

In its May 18 report, USDA pegged total U.S. milk production at 19.2 billion pounds — down 1% from a year ago. The report tallied 9.4 million milk cows on U.S. farms reflecting a 98,000-head decrease (-1%) from a year ago, with output per cow unchanged.

Among the 24 monthly-reporting states, output per cow fell 0.1%, and cow numbers were off 78,000 (-1.1%), pushing production 0.9% below year ago in those major states.

USDA’s May 18 GAIN report noted an even larger pull-back in Australia’s 2022 output, forecast to be down more than 4% for the year, and New Zealand’s first quarter milk production is reported to be running 6% below year ago and the lowest level since 2013. 

Milk collection in the European Union is also running behind first quarter 2021 by a smaller degree, down 0.3%, according to an EU milk situation report delivered in Brussels last week. And, milk deliveries are reported to be 4% below year ago in Great Britain for the first quarter of 2022 — 3.3% below year ago in Ireland in March.

Throughout the world, these reports note that farmers are exiting the dairy industry. “The slump in milk production (in Australia) is largely due to farmers continuing to exit the dairy industry through farm sales, and some dairy farms partially or fully transitioning to less labor-intensive beef cattle production,” the GAIN report said.

In the U.S., the national impact of this trend is being buffered by the large production growth in places like Texas and South Dakota offsetting reduced production almost everywhere else.

In addition to the U.S. milking 98,000 fewer cows in April compared with a year ago, dramatic movements of cows out of some regions and into others is occurring. Notable shifts are also occurring within regions. (See chart above)

One region — the Mideast — that had been growing rapidly is now going through a substantial pull-back. The Mideast lost 35,000 cows and 68 million pounds of monthly milk production in April compared with a year ago. That is a collective 3.6% year-over-year decline broken down as -3.4% in No. 6 Michigan, -3.8% in No. 12 Ohio and -4.1% in No. 15 Indiana. Technically, western Pennsylvania is included in the Mideast when we look at the Federal Milk Marketing Order map, and the Keystone state, as a whole, recorded a 2.2% decline in milk production in April.

The Northeast and Midatlantic region lost 15,000 cows and 31 million pounds (-1.3%) of milk production with most of the decline coming from No. 8 Pennsylvania, down 8,000 cows and 2.2% in milk output vs. year ago while No. 5 New York (-0.8%) and No. 19 Vermont (-0.9%) were just under the national average.

In the Southeast region, the big news is Georgia’s milk production outpaced Florida for the first time, moving the relative 24-state newbie into 21st place and Florida to 22nd. Georgia and Florida were dead-even in March.

Georgia’s 12.1% year-over-year milk increase in April eclipsed Florida’s 12.1% year-over-year decline, with Georgia producing 1 million more pounds of milk with 7,000 fewer cows compared to Florida. Georgia producers milked 91,000 cows in April — up 9,000 head from a year ago. Florida producers milked 98,000 cows in April — down 12,000 head from a year ago.

As noted last month, Texas surpassed Idaho in March as the No. 3 milk-producing state. However, even the 4.7% increase in year-over-year April production in Texas (up 63 million pounds) could not overcome the 12.9% decline in No. 9 New Mexico’s production (down 92 million pounds), for a net 1.4% loss of 29 million pounds of milk from the Southwest region.

Regions holding steady-ish — lower by less than the national average — are the Upper Midwest down 10,000 cows and -0.4% in milk output and the Mountain States / High Desert down 3,000 cows and -0.3% in production, with No. 4 Idaho unchanged in both cow numbers and production vs. year ago.

In the Upper Midwest, No. 2 Wisconsin was almost steady as production was down just 0.1% with 1,000 fewer cows in April, while No. 7 Minnesota milked 9,000 fewer cows and made 1.4% less milk than a year ago in April.

The West Coast showed a net-loss of 1% just like the U.S. average: No. 1 California had -0.6% production (but milked 2,000 more cows), and the 2.7% production increase in No. 18 Oregon was not enough to make up for the 5.4% loss in No. 10 Washington State.

The Central U.S. was the only region to see a net gain — owing to a 0.9% increase in No. 11 Iowa and the whopping 16.7% (48 million pound) increase in milk production in No. 17 South Dakota, where cow numbers are up by 25,000 head. South Dakota is nipping at the heels of No. 16 Kansas (-2.2%), despite Kansas overtly seeking dairies to fill expanded processing there according to dairy market podcast advertising messages at the International Dairy Foods Association website. Elsewhere in the Central U.S., in addition to production losses in Kansas, declines were also recorded to the east for No. 23 Illinois (-3.8%) and to the west for No. 13 Colorado (-1.1%).

All of this bears note as farmers face escalating costs and milk futures are hesitatingly recovering the past three weeks of losses but under market conditions that are again creating divergence between Class III and IV that could create producer price differentials (PPDs). When milk is de-pooled from Federal Orders in these circumstances, we see inequitable distribution of losses and of value that can contribute even faster to the way the milk production map is changing.

At the same time, the USDA World Agricultural Supply and Demand Estimates for May highlighted an expected increase in fat-basis exports as the world is tight on butterfat, but a decline in skim-basis exports, which could change if China resumes its earlier level of milk powder imports. 

On the flip side, the WASDE report forecasts 2022 U.S. dairy imports to run well ahead of previous years’ on both a fat- and skim-solids basis. The WASDE report stated this increase in dairy imports will be boosted by larger than expected importation of products that contain dairy.

WASDE: 2022 imports up

According to the World Agricultural Supply and Demand Estimates (WASDE) last week, the 2022 All Milk price is forecast to average $25.75, down a nickel from April’s forecast.

The May WASDE raised the 2022 milk production forecast on what it says are higher milk cow inventories more than offsetting slower growth in milk per cow. But it is important to realize the April milk production report this week (as reported above) showed otherwise.

Cheese and butter price forecasts are raised from the previous month’s report on strong demand, but non-fat dry milk and whey prices are lowered. The Class III price is unchanged and Class IV is lowered.

Some are suggesting that higher retail prices for butter and cheese and other dairy products are negatively affecting demand and that the food industry can shift from butter to oils. However, recent reports from many sources indicate the global supplies of food oils and butter substitutes are also in reduced supply and rising in price at wholesale and retail levels.

Biden orders Operation Fly Formula via Dept. of Defense

Operation Fly Formula was ordered by President Biden invoking the Defense Production Act on Wed., May 18, sending military planes abroad to bring infant formula home to America’s babies, especially the specialty hypo-allergenic formulas for babies with allergies to milk or special health needs. Parents currently face 45 to 60% out-of-stock shortages in infant formula and two military cargo plane loads of hypoallergenic specialty formula have arrived from Europe and the UK over the past 7 days.

Spot out-of-stock undercurrents in baby formula and specialized milk-based meal replacements have been mentioned in this column several times over the past few months, but the situation has worsened. The USDA announced WIC vouchers allowing participants to buy brands other than sanctioned low-bidders.

By Thurs., May 19, the American Academy of Pediatrics had issued a statement telling parents it is safe to switch to whole cow’s milk for babies over 6 months of age that are not on “special” formula, making sure they are consuming other iron-rich foods or talking to their own pediatricians about supplemental iron.

Discussion is rampant through social media about goat milk as a substitute for formula. There’s something to this because goat’s milk is A2A2 in its protein composition, as is sheep’s milk and human milk. There are A2A2 cow’s milk brands available now also. Parents are urged not to switch to plant-based beverages that do not have the nutrition of whole milk and to be cautioned that lactose free milks may not have sufficient carbohydrate for electrolyte balance since the lactose IS the carbohydrate in milk.

The FDA also struck a deal to get the Abbott plant back up and going by June 4 after product recalls and a plant closure related to bacteria tests occurred in February, in part because of a whistleblower’s report that was delayed for months by a “mail room disruption” according to FDA.

‘Confusion is real’

Anxiously waiting for the expected FDA decision on label standards of identity for milk and dairy, NMPF reported this recent exchange between FDA Commissioner Robert Califf and U.S. Senator Tammy Baldwin of Wisconsin at a recent Ag Appropriations Subcommittee hearing. Baldwin chairs the Senate subcommittee that sets spending levels for FDA. Baldwin asked the Commissioner for his thoughts on how plant-based beverages masquerading as dairy products should be labeled. His response noted that when people think about dairy vs. plant-based beverages, they “are not very equipped to deal with what’s the nutritional value” of the products. Yes, the confusion is real.

Milk futures flip higher, Class III and IV diverge

Green ink the past two weeks replaced three weeks of red ink as milk futures posted back to back gains despite some waffling on the Class III side due to a report this week showing record natural cheese inventories. By Wednesday, May 25, the Class III contract average for the next 12 months was 25-cents higher than the previous week and fully steady compared with the end of April at $22.96. The Class IV milk futures went roaring $1 to $1.50, spots $2 higher — tripling the spread between the two. On the close Wed., May 25, Class IV contracts for the next 12 months averaged $24.05 — up $1.03 from a week ago and 60 cents higher than the end of April. Class IV continues to top Class III, with the average divergence now at $1.10. Aug. through Nov. contracts on the CME futures board now diverge by more than the $1.48 threshold that suppresses the Class I mover value under the new averaging formula.

Dairy products rally higher

CME spot cash dairy product markets have reversed course to move higher for two consecutive weeks, capped by a strong rally on Class IV products (butter and nonfat dry milk) driven by a 22% decline in butter inventories. Compared with the end of April, the May 25 daily spot prices for the four commodities used in federal milk order pricing are: Butter up 28 cents at $2.89/lb after 12 consecutive days of gaining more than 2-pennies per day in active trade volume; Nonfat dry milk up 13 cents at $1.84/lb; Cheese steady compared with a month ago at $2.30/lb, Dry whey firming up the 8-cent loss at 50 cents.

April blend up $1-1.50

The April uniform prices across the 11 Federal Milk Marketing Orders (FMMOs) moved $1 to $1.50 higher, with the Upper Midwest closer to $2 higher than previous month. This is the 6th straight month of gains, reported as follows:

  • FMMO 1 (Northeast) SUP $26.07 PPD +$1.65
  • FMMO 33 (Mideast) SUP $24.91 PPD +$0.49
  • FMMO 32 (Central) SUP $24.65 PPD +$0.23
  • FMMO 30 (Upper Midwest) SUP $24.55 PPD +$0.13
  • FMMO 126 (Southwest) SUP $25.43 PPD +$1.01
  • FMMO 124 (Pacific Northwest) SUP $24.79 PPD +$0.37
  • FMMO 51 (California) SUP $25.08 PPD +$0.66
  • FMMO 131 (Arizona) uniform price $25.52
  • FMMO 5 (Appalachian) uniform price $27.17
  • FMMO 7 (Southeast) uniform price $27.35
  • FMMO 6 (Florida) uniform price $29.13

June Class I ‘mover’ $25.87

The June Class I base price, or ‘mover’, was announced Wed., May 18 at $25.87. This is 42 cents higher than the May Class I ‘mover’ and $7.58 higher than a year ago. This marks the 9th consecutive month of Class I mover gains.

The June 2022 Class I mover is 61 cents higher under the current average-plus formula than it would have been using the previous ‘higher of’ for the second consecutive month after being a loss under the averaging formula for the previous four consecutive months. In 2022, alone, the average-plus Class I mover formula produced no difference in January and was 51 cents below the ‘higher of’ method for February, 79 cents lower for March and 50 cents lower for April before turning 17 cents higher in May and now 61 cents higher for June.
Since implementation in May 2019, the new formula has been negative more months than positive (18 of 38 months) for a net loss in Class I value of over $725 million from May 2019 through June 2022.

2022 milk futures rally continues as butter leads the spot market gains

Updated Market Moos, by Sherry Bunting, a weekly feature in Farmshine

2022 Class III futures avg. $20.10, Class IV $21.10

Milk futures surged to levels not seen since 2014 this week on the heels of previous weeks’ gains, and the Class III milk futures contracts for 2022 now average over $20 with Class IV over $21 as of Dec. 29, 2021.

Class III milk futures first broke into the $20s last week, hitting new contract highs daily since Wed., Dec. 22 on all 2022 contracts. The closeup contracts for Dec. 2021 and Jan. 2022 were flat in pre-Christmas trading, but see-sawed toward gains in post-Christmas trading.

On the milk futures close Wed., Dec. 29, Class III contracts for the next 12 months (Dec. 2021 – Nov. 2022) averaged $20.01, up $1.35 from a month ago, with January through October 2022 contracts all at or above $20.00.

Class IV futures broke the $21 mark for the Feb. 2022 contract last week, and then continued marching higher after Christmas with January through October 2022 contracts all at or above $21. At the close of trade Wed., Dec. 29, the next 12 months (Dec. 2021 through Nov. 2022) averaged $21.05, which is $1.89 higher than a month ago.

Excluding the lower and expiring current month contract, the 12-month average of 2022 futures contracts averaged at $20.10 for Class III and $21.10 for Class IV.

Class IV continues to dominate the board, and the average spread between the two widened to $1.00 this week with December’s contract pegged at a Class IV over III differential of $1.45; January’s $1.29.

Butter’s impressive gains lead the spot-market

Butter is leading the charge as CME spot dairy products moved mostly higher in pre- and post-Christmas trade. Cheese prices had weakened in pre-holiday trade while butter, nonfat dry milk and whey all made solid or impressive gains. In the post-Christmas spot calls, impressive gains were made on both cheese and butter while whey held firm and milk powder weakened.

On Class III dairy product spot markets at the CME Wed., Dec. 29, the 40 lb block Cheddar price was pegged at $1.95/lb — recovering all of the pre-holiday loss and then some. A single load traded at $1.94 and a spot bid to purchase at $1.95 was left on the table by sellers. Barrels have seesawed almost daily but moved decidedly higher on a nickel upswing Wed., Dec. 29, when 500-lb barrel Cheddar was pegged at $1.69/lb and 5 loads changed hands.

Dry whey gained 6 cents last week and held firm at that 75-cent level Dec. 27, 28 and 29, although zero product changed hands.

In the Class IV products, the spot butter market was very active, and the spot price was pegged at $2.43/lb on Wed., Dec. 29, up a whopping 24 cents from the previous Wednesday and 33 cents higher than two weeks ago. On Mon., Dec. 27, a whopping 10 loads of butter traded with the price pegged at $2.30. On Tues., Dec. 28, another big round of 12 loads traded with the price pegged at $2.40/lb. Then on Wed., Dec. 29, another rally resulted in 3 loads trading with the spot price reaching $2.43/lb with sellers on the sidelines holding their offers at $2.45.

Grade A nonfat dry milk had added a penny last week but lost two pennies this week. On Wed., Dec. 29, the NFDM spot price was pegged at $1.6475/lb with 5 loads changing hands.

November milk production fell 0.4% vs. year ago amid increasingly obvious geographic patterns

U.S. milk production was 0.4% lower than a year ago in November, but for the major milk states, the decline was 0.1%.

Cow numbers dropped 10,000 head nationally in the month of November, alone. Almost one-third of them (3000 head) left the count in Pennsylvania between October and November. Compared with a year ago, cow numbers across the U.S. were down 47,000 head.

In Pennsylvania, cow numbers at 472,000 head were down 10,000 vs. year ago with production off 3.5%. Elsewhere in the Northeast milkshed, New York’s production was down 0.2%, but cow numbers were up 2000 head. In Vermont, milk production fell 1.4% while cow numbers were stable compared with a year ago.

(Producers in Pennsylvania and through most of the Northeast and Midatlantic region report continued penalties on overbase milk, continuance of the 12% cuts in Northeast/Midatlantic producer base allotments instituted by the largest national footprint cooperative during the height of the pandemic. This, despite USDA Dairy Market News reports confirming very tight milk and cream supplies in the eastern markets, and increasing evidence of store shortages based on consumers facebooking their photos of empty dairy and milk shelves at prominent regional supermarket chains throughout the Northeast and Midatlantic states. The recent revelation that the iconic Readington Farms in New Jersey — that supplies ShopRites and other stores in the Wakefern Foods retail group throughout New England, New York, Pennsylvania and the Delmarva — will begin procuring milk for these stores from former Dean plants now owned by Dairy Farmers of America (DFA) also sent shockwaves throughout the Northeast last week)

In the Southeast, Florida dropped 6000 cows with production down 3.4% from a year ago. Georgia gained 1000 cows and 1.4% in production.

In the Mideast region, Ohio, Indiana and Michigan collectively lost 14.000 cows and were down 1.6% in milk vs. year ago.

Growth in the Central Plains continued. States that gained both cows and production vs. year ago include South Dakota, up 22,000 head and 16.7% in milk; Minnesota up 6000 cows and 1.9% in milk; Iowa up 6000 cows and 2.7% in milk; Wisconsin up 18,000 cows and 2.2% in milk; and Texas up 17,000 cows and 2.8% in milk.

California produced 1% more milk than a year ago but lost 1000 cows.

January Class I mover $19.71, Class IV pricing factor tops Class III by $1.48 per cwt.

The Class I mover for January 2022 was announced Dec. 22 at $19.71. That’s 54 cents higher than December’s mover and $4.57 higher than January a year ago.

By the hair of its chinny-chin-chin, the January Class I base price is identical under the new formula as it would have been under the old. Based on USDA AMS prices for cheddar, butter, nonfat dry milk and whey in the first two weeks of December, the January 2022 Class IV advance pricing factor was calculated by USDA to be 12.21 while Class III figured at $10.73.

Averaging the two advance pricing factors together and adding 74 cents is how we get to that $19.71 Class advance base price for January 2022 — under the new Class I formula. This is also the price it would be using the previous ‘higher of’ Class I formula because the $1.48 spread between the Class III and Class IV advance pricing factors (74 cents x 2) is the magic number that keeps the new method from calculating a Class I base price that is lower under the new method than it would have been under the old method. Any wider than $1.48, and the difference becomes negative.

Class IV is projected to be higher than Class III throughout 2022, if the current futures markets and market fundamentals hold out. This means the ideas circulating to change the Class I formula to a Class III-plus would be negative over the duration of time that Class IV beats Class III.

In volatile markets, where the dairy industry is vulnerable to market shocks, the use of the ‘higher of’ formula for Class I did help prevent further disparities that lead to de-pooling and negative PPDs, which affect not only producer milk checks but also their risk management.

Secretary Vilsack says bring me consensus, first

Last week during a farm visit in Wisconsin, Secretary of Agriculture Tom Vilsack told dairy producers he wants to see the dairy industry come together with a consensus on Federal Milk Marketing Order changes before holding USDA hearings.

Three weeks ago, Senators Kirsten Gillibrand (D-NY), Patrick Leahy (D-Vt.) and Susan Collins (R-Me) introduced the Dairy Pricing Opportunity Act of 2021, a bipartisan bill in the U.S. Senate that would direct the Secretary of Agriculture to provide notice of, and initiate, national hearings to review Federal milk marketing orders … “which shall include review and consideration of views and proposals of producers and the dairy industry on the Class I skim milk price, including the ‘‘higher of’’ Class I skim milk formula…”

In the past, whenever USDA has initiated administrative hearings to make specific FMMO changes, a consensus was typically sought before such hearings.

On the other hand, if the Senate bill becomes law, a more open process appears to be described that could make national hearings a review of the system, consideration of proposals, and specifically a look at the Class I formula change, which had been made legislatively without hearings, comment or a producer referendum in the 2018 Farm Bill.

Perhaps national FMMO hearings could open a consensus-building process.

PMVAP payments delayed

The Pandemic Market Volatility Assistance Program (PMVAP) payments related to the Class I formula losses from July through December 2020 will be delayed until late January or into February or March, according to Erin Taylor, USDA AMS. She told dairy farmers in a Dairy Industry Call hosted by the Center for Dairy Excellence this week that eligible producers should have been contacted by their milk cooperative or handler by now requesting proof they meet the Adjusted Gross Income limits of USDA payment programs.

USDA is in the process of finalizing agreements with each eligible handler that had any milk pooled on any FMMO during that time period and is providing workbooks with methodology on how the payments should be made to their producers based on how they were paid during the July-Dec 2020 period. Look for more information in the Jan. 7 edition of Farmshine and click here.

Whole Milk for Healthy Kids Update

There are 84 Congressional cosponsors from 30 states (including the prime sponsor, G.T. Thompson of Pennsylvania) who are now supporting the Whole Milk for Healthy Kids Act, H.R. 1861. However, for those readers who live in the New England states as well as Maryland, Delaware, South Carolina, West Virginia and several western states, representation is absent.

To-date, there are no cosponsors yet from the following states: Colorado, Connecticut, Delaware, Hawaii, Maine, Maryland, Massachusetts, Montana, Nevada, New Hampshire, New Mexico, North Dakota, Oklahoma, Oregon, Rhode Island, South Carolina, Utah, Vermont, West Virginia, and Wyoming.

This bipartisan bill was introduced in March by Congressmen G.T. Thompson (R-PA) and Antonio Delgado (D-NY), to end the federal prohibition of whole milk in schools. It gained 18 new cosponsors over the past two weeks to reach 84 from 30 states, but needs at least 100 cosponsors representing all 50 states to get moving in committee toward the goal line.

Consider contacting your Representative with thanks or a request to cosponsor this bill that simply allows school children the healthy milk choice they love and will drink. To find your Representative, enter your address at https://www.govtrack.us/congress/members


Milk Market Moos, June 25, 2021

By Sherry Bunting, published weekly in Farmshine Newspaper

Cutting through consumer confusion

Consumers and producers of food and beverages — anything in the protein market — are going to see a disruptor explosion of new products. As I look through the food-related publications coming across my desk and into my email inbox — Culinology, Progressive Grocer, Food Navigator, Meat + Poultry, Dairy Foods, Food and Beverage, and the list goes on — the sudden onslaught of animal-free cellular agriculture, portrayed as dairy and meat without the animals, is stunning.

Even Facebook pop-up ads push Nick’s ice cream every day in my Facebook ‘newsfeed’ — with the tagline ‘dairy without the cow’ courtesy of Perfect Day Foods.

They use ‘climate’ to generate interest from companies wanting to reduce a carbon footprint by incorporating the excrement of genetically-altered yeast to replace a portion of real dairy protein in the dairy manufacturing space. It’s an easy swap, Perfect Day founders say, and according to the USDA Bio-engineered labeling regulations that became official last January, the stuff doesn’t have to be labeled BE because the genetically-altered yeast are not being consumed — just their excrement harvested from the fermentation vats.

“We ran the numbers, and if we partnered with the dairy industry to use Perfect Day protein in just 5% of their products, we’d save 12.3 million metric tons of greenhouse-gas emissions – equivalent to the carbon emitted from every single car registered in the city of Los Angeles,” says Nicki Briggs, Perfect Day’s vice president of corporate communications in a Berkeleyside online interview on the third day of June 2021. Ms. Briggs was formerly an employee of Chobani.

There are other dairy turncoats and straddlers moving between real and fake and seeking to blend them to some sort of climate / carbon standard. But data like that of Ms. Briggs doesn’t tell the whole cow story. Just like the data Impossible Foods is using to coax schools to replace 50% of their beef with Impossible Burger — now that it has the coveted USDA Child Nutrition Label — are figures that do not consider the entire cycle of cattle for a net figure on GHG.

It is maddening. This onslaught of bright packaging with new and clever names and claims populating the meat, dairy and seafood offerings — starting with plant-based concentrates and chemical combinations and leading to cells growing in bioreactors and yeast excreting protein in fermentation vats. Big Tech is the new wannabe farmer, and Big Ag, Big Food, Big Finance, and Big ole Uncle Sam are in for the deal.

Consumers will begin to feel like they are stuck inside a pinball machine, or to be more current with my analogy, a warp-speed version of a video game bombarded by bangs, pops and whistles.

That’s what Gen Z wants, they all say. And yet, a survey by the Hartman Group recently showed Gen Z — just like the Millennials before them — are most comfortable with the food choices they grew up with, but unlike Millennials who still had a preference for local, seasonal and farm-to-table, Gen Z-ers have a preference for fast food and foods with familiar tastes.

We’ve got some work to do to navigate all of this with a straight forward message that cuts through the climate half-truths and outright lies about cows, that penetrates the government dietary restrictions based on outdated and incomplete reviews of the scientific literature on dietary fat.

We’ve got our work cut out for us to keep educating others, giving them the facts that are being ignored and bullied out of the national, even global, conversation about food as the industry grows its margins for investors through consumer confusion at the expense of consumer’s knowing what’s real.

USDA joins global school lunch deal

USDA can’t even get U.S. school lunch right, but now plans to lead America’s joining into a “global coalition” called the “School Meals: Nutrition, Health and Education for Every Child.”
There’s also a bill before Congress seeking to make three meals and a snack universal for all children through school.

As for the global coalition, this is right up Secretary Vilsack’s alley. In a press release Wed., June 23 about USDA’s leadership in joining the global deal, Vilsack talked about “powerful incentives” and “building resilience to future shocks” by focusing on improving the nutrition, health, and education of vulnerable children and adolescents worldwide. Sounds good, right? Who can argue with words like that? But like everything else out of USDA these days, where’s the details? And what’s it really mean?

The global coalition is centered around education and school meals and will launch at the United Nations’ Food Systems Summit in September. Like the 30 x 30, the Net Zero initiatives, and everything else coming through the pipeline from World Economic Forum, the goal line for this, too, is 2030 — making nutritious meals available for all children by 2030, with other benchmarks set for 2022.

Who can argue with nutritious meals for all children? There’s not a single person who doesn’t want all children to have nutritious meals. The problem is this: Who defines what is nutritious? How will the systemization child-feeding change the future of food and agriculture?

Details, please, because the track record so far where USDA is concerned is marred by lack of logic and reduced application of current nutrition science via institutions like the Dietary Guidelines and restrictive policies for feeding children.

“We look forward to bringing our expertise to bear, expanding our reach, and benefiting millions more vulnerable children by partnering with the World Food Program and other like-minded countries as part of this important coalition,” said Vilsack in Wednesday’s press release.

Okay, let’s hear those details.

Will USDA do dairy?

In a June 15 press release about previously authorized aid for dairy, USDA announced $580 million for Dairy Margin Coverage base changes and $400 million for Dairy Donation Program would be implemented within the next 60 days, but we’ve yet to see the details.

As part of that news release, USDA also noted that, “Additional Pandemic Assistance for Producers (PAP) payments would be targeted to dairy farmers who have demonstrated losses not covered by previous payments.” No details on that either.

However, on the same day of that press release — June 15 — Senator Patrick Leahy, Chairman of the Senate Appropriations Committee, asked USDA Secretary Tom Vilsack about delivering urgently needed relief to dairy farmers. Vilsack replied to say that USDA was announcing that day (again without details).

In the exchange between Vilsack and Leahy during a Senate hearing, Vilsack said: “We are creating a program to help reduce the differential that occurred between Class I and Class III milk pricing because of the disproportionate number of purchases of cheese during the Food Box effort. That distorted the market, and it caused a lot of harm to smaller producers. We’re putting resources in to reimburse those producers for some of the loss they incurred.”

Those ‘differential’ discrepancies have not been outlined yet by USDA, but here are several manifestations Farmshine and other publications have been documenting:

  1. Due to the new Class I base calculation that uses a III / IV averaging method instead of the prior ‘higher of’, which was implemented by USDA in May 2019, over $750 million in cumulative Class I value was lost from May 2019 through May 2021.
  2. As much as $3.5 billion was potentially withheld or represented as inequitable transmission of milk value when massive volumes of Class III milk were withdrawn from FMMOs, as further reflected in severely negative PPDs. This would be a net loss after months of positive PPDs are applied; however, even positive PPDs in some months were smaller than normal.
  3. Both 1 and 2 contributed to the inequitable transmission of Class III value to many producer milk checks
  4. These losses affected the performance of purchased risk management tools, meaning that a change in Class I pricing that was supposed to help dairy processors manage their risk, had the resulting effect of making it more difficult or impossible for dairy farmers to manage their risk — during a time when they needed it most.

Conundrum: U.S. milk production up 4.6% in May

But here is the conundrum in regard to USDA dragging its feet on details for ‘dairy aid’: May milk production nationwide was up a whopping 4.6% over year ago — so says the USDA report released June 22. April production was up over 3% vs. year ago.

USDA looks at this as though dairy producers are doing so well that they are expanding their herds. In fact, in May, there were 145,000 more milk cows in the U.S. than a year ago. Could this be another sign of the inequitable transfer of value in the milk pricing formulas?

More insight on the production report next week’s Market Moos.

July Class I advance $17.42

The July advance Class I base price, or ‘mover,’ was announced Wednesday (June 23) at $17.42. This is 87 cents lower than June’s Class I base price and 86 cents higher than a year ago. The July 2021 Class I base price at $17.42 — using the current formula of average plus 74 cents — is 34 cents higher than it would have been if figured using the previous ‘higher of’ method at $17.08.

July 2021 marks the first time in 12 straight months that the new calculation method resulted in a higher Class I base price than the old method. However, there’s a lot of ground to make up, considering that for 16 of the 27 months since the new method was implemented, the difference between the new ‘average plus’ and the old ‘higher of’ was lower and only 11 months were higher.

In fact, the Class I base value losses for 16 months averages to $3.28 per hundredweight while the value gains (including upcoming July 2021) for 11 months averages to just 39 cents.

Class III/IV milk futures plunge

Class III and IV milk futures were all lower across the board this week. The only green in the sea of red, was the Class III current month gained a dime heading into the last week of June contract trading, but the Class III July contract lost 15 cents and August plunged by $1.00 below week ago, with the rest of the board on Class III milk ranging 10 to 50 cents lower. On the Class IV board, the losses were more evenly spread ranging 20 to 50 cents lower across all 12 months.

As all four dairy commodities trended lower on the CME spot market this week, the 12-month futures average lost 29 cents on both classes, equally, by midweek, so the spread between Class III and IV 12-month future contract averages remained exactly at 67 cents on Wednesday, June 23 — right where it was a week ago and still well below the $1.48 mark.

On Wed., June 23, Class III milk futures for the next 12 months averaged $17.67, down 29 cents from the previous Wednesday’s average, the 7th straight week the 12-month Class III futures price average was lower than the prior week. Class IV contracts averaged $17.00 — down 29 cents from the 12-month average on the previous Wednesday.

Dairy commodities all lower

Butter slid lower almost daily, on the CME daily spot market. By Wed., June 23, the price was pegged at $1.73/lb — down 7 cents from the previous Wednesday with 6 loads trading.

Grade A nonfat dry milk (NFDM) also slipped this week. On Wed., June 23, the CME spot market price was pegged at $1.2575/lb, a penny lower than a week ago with a single load trading.

Cheddar trade plunged lower on the CME, then firmed up a penny or two at midweek. Barrels took the brunt of the decline and by Wed., June 23, both the 40-lb block Cheddar and 500-lb barrel cheese were pegged at $1.49/lb on the spot market with 2 loads of blocks and a single load of barrels changing hands. This was a net 3-cent loss for the week on blocks and a 15-cent loss on barrels.

Whey price was firm on the CME spot market, pegged at 59 1/2 cents with zero loads trading.

Dairy Exports: Jekyll and Hyde

MilkMarketMoosHeader070914web.jpgDairy Exports: Jekyll and Hyde

By Sherry Bunting, Milk Market Moos, Farmshine, February 2, 2018

Talk to dairy farmers and industry observers about dairy exports and the response runs the gamut from enthusiastic full-court-press to cautious optimistic pursuit to a pessimistic skepticism about the profitability they bring to the table.

awGDC18-Day1-56.jpgNo matter where you are on the scale of good, bad or indifferent, exports are essential for agriculture and for dairy.

The hands of time do not turn backward on technology and progress, and so we are in a global market. If we want to be competitive in our domestic market, we need to also be competitive globally.

The food industry is increasingly served by global players and multinational companies that can source and supply from all corners of the globe. People would be surprised to learn how relatively small the transportation cost is in exporting ag commodities, especially further processed dairy products, overseas compared with cross country, on a per-unit basis.

If our ships are not arriving at other ports because we can’t compete, then other ships will arrive at our ports because we can’t compete.

That said, forward progress in supplying markets overseas needs to be pursued, not with reckless abandon finding ‘homes’ for excess milk, but with strategic thinking that includes the marketing and a consideration for the well being of our dairy farm sector.

As Secretary of Agriculture Sonny Perdue pointed out in his visit to Pennsylvania last week, America’s food security is America’s national security. Our farmers are the thin green line that, along with our military, keep our nation safe. After 9/11, the U.S. set out to be energy independent within 25 years and accomplished this in 10, according to a talk, given by Dr. David Kohl, Virginia Tech professor emeritus, in Lancaster County, Pennsylvania last Friday.

Just as our growing economy became at one point dependent on other nations for a portion of its energy needs, to its peril, we should take care that we do not become dependent in the future on other nations for our food.

A laughable thought, perhaps, but the rapidly consolidating agriculture industry needs its wide and varied base of family farms, small independent businesses, that support a varied and competitive rural infrastructure and provide the safety net of food security for American consumers through their independent pursuit of partnering with industry and academia to producer more, with less.

Kohl talked about how important trade is to American farmers, including the dairy industry, which currently exports 1 out of every 7 days’ worth of milk.

He made some observations about China’s agriculture. That Chinese interests purchase of Smithfield was largely to purchase the food safety protocols to ensure their food security. Here’s a statistic Kohl shared that got me thinking. He said that while there are 2 million farmers in the U.S., there are 314 million farmers in China.

“They are not taking on technology there as rapidly because there are 800 million people living in rural China and they need something to do,” said Kohl.

Just think about that for a minute. Technology is as essential to the future in agriculture as are our trade negotiations and exports; however, this statistic made me think about our rural youth both on and off the farm.

Dairy farming, like the hog business in the 1990s, is at a crossroads. Farmers, through their cooperative memberships, partnerships and other arrangements, own some of the largest and most aggressive processing assets that are strategically consolidating markets and distribution.

They hold in their hands their futures as individual small businesses — parts of the whole, contributors to a market, dairy farmers who not only are improving their own business acumen but continually improving how they manage their herds and possess a passion for what they are doing, a passion that is being called upon to directly market their farming lifestyle to consumers to counteract the negative attacks of anti-animal activists casting doubt wherever they turn.

U.S. Dairy Export CEO Tom Vilsack has set a lofty goal of getting U.S. dairy exports to 20% of production vs. the current 14. That would be nearly one and a half days’ worth of milk production out of every seven.

That sounds exciting, but when have we heard percentage of increase goals set for the fluid milk category? Could that incremental effort not also be exciting?
There are reasons why we are not seeing this, and in some respects, those reasons bring us back full circle to the export discussion.

Beverage milk is not exported on the scale that dairy commodities and dairy products are. Yes, DFA is among those exporting shelf stable milk to China for supermarkets, but this is not a globally traded product as are cheese, butter, and particularly dairy indgredients and protein powders.

While dairy processors eye up the opportunities and build inventories around allocated sales, and manage their risk with offsets, dairy farmers are in the price-taking position with the promise that if exports grow, they and their families can grow their businesses, without a serious discussion about the profitability in that proposition.

All of this to say, that the main market for U.S. farm milk is here at home as not only a beverage but also a growing number of dairy products finding good demand.
We are not New Zealand, which exports most all of what they produce.

The U.S. has, already, a strong robust customer base for cheese, yogurt, butter and a host of dairy products, as well as a sector of our industry (beverage milk) that needs our committed attention through dynamic labeling, comparative promotion vs. the imposters, consumer education about MILK, not how many situps and pushups to do each day. It needs people in charge who truly believe it is important, not an offhand remark by a checkoff-paid employee for U.S. DEC speaking at a conference, saying that fluid market is a dead horse as he proceeded to dig into the exciting team of horses (exports) waiting in the wings to save the day.

Having said all of this, it is imperative that U.S. dairy farmers be competitive to be involved in the global marketplace because it is here, with all of its pluses and minuses, but that does not mean we turn way from the prize in which the Federal Orders place high value and for which other products are taking over because we have, in effect, laid down and allowed the incremental loss of beverage milk sales.

But let’s examine the fluid milk dilemma further in the next edition.

Author’s Note: Re-inventing this Ag Moos blog for the times….  Milk Market Moos is a column I have been writing in Farmshine since 2003. It became a weekly feature in 2007. Find some of this content here, at Ag Moos, along with other dairy and beef market related stories, agriculture news, and, in between, the stories and images of the inspirational people of agriculture… but you can get it first, and you can get it all, in Farmshine Newspaper, just $15/year. Farmshine is a weekly newspaper published in Brownstown, Pennsylvania — now in its 39th year of publishing all-dairy, all-the-time.