Covering Ag since 1981. The faces, places, markets and issues of dairy and livestock production. Hard-hitting topics, market updates and inspirational stories from the notebook of a veteran ag journalist. Contributing reporter for Farmshine since 1987; Editor of former Livestock Reporter 1981-1998; Before that I milked cows. @Agmoos on Twitter, @AgmoosInsight on FB #MilkMarketMoos
By Sherry Bunting, published in Farmshine, Feb. 4, 2022
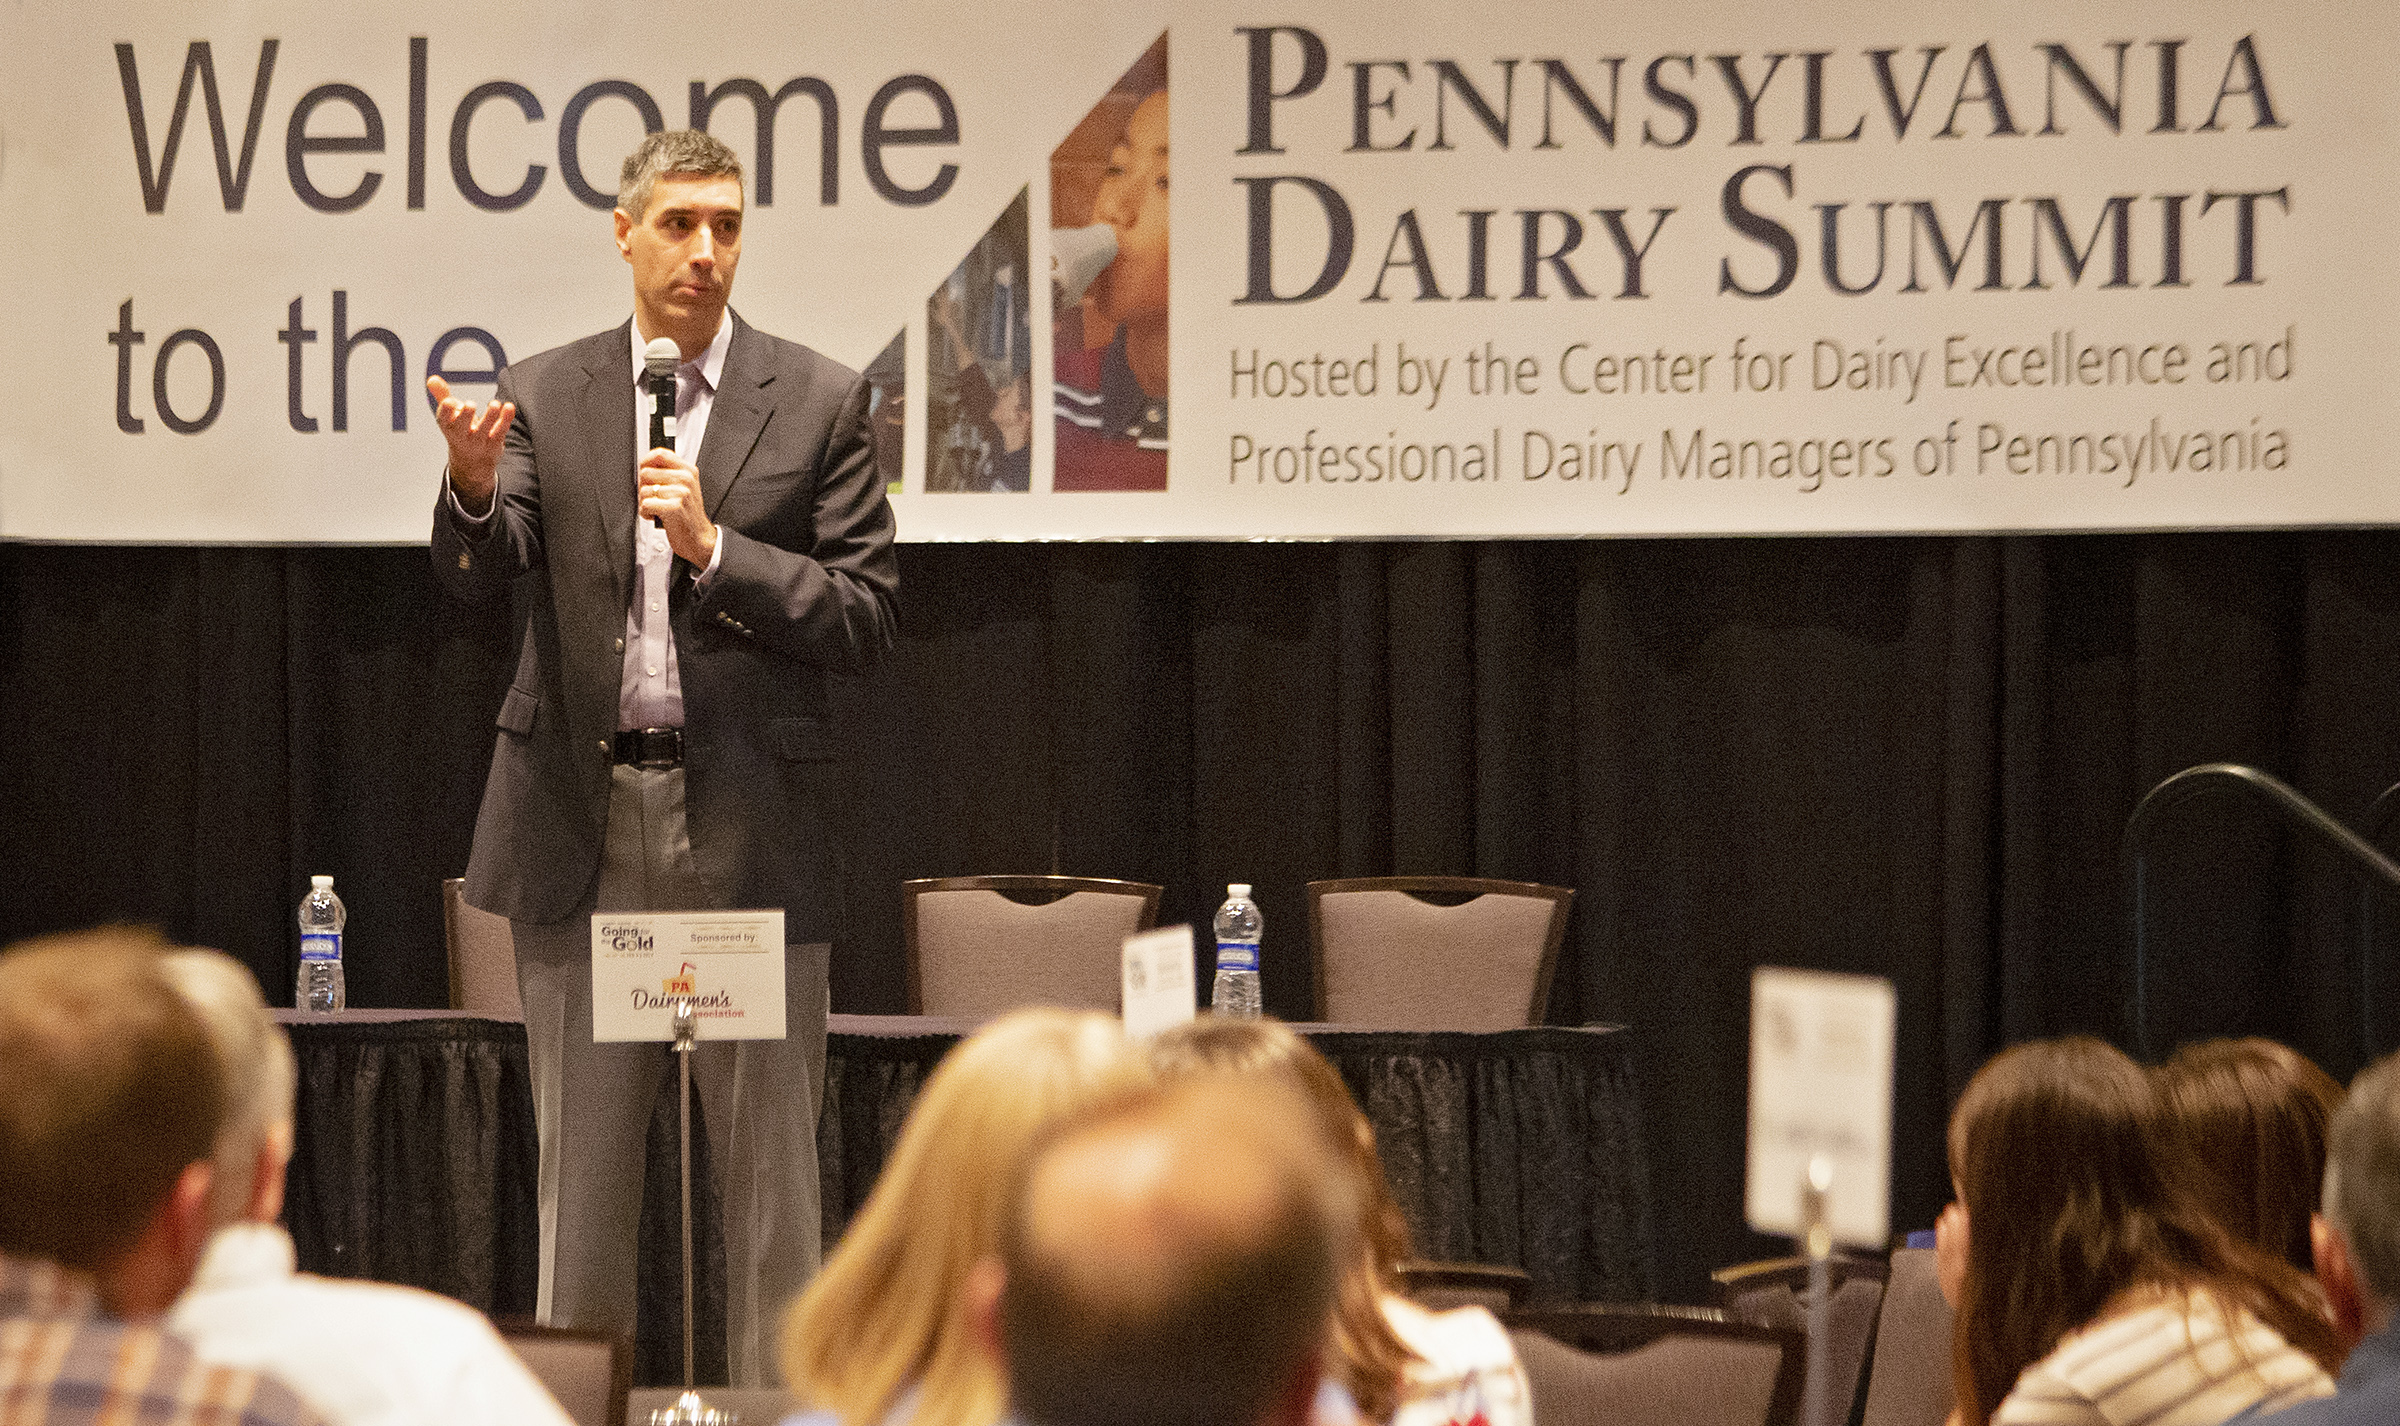
LANCASTER, Pa. – “The optimum level of tension is not zero,” said Dr. Marin Bozic. While he is an assistant professor of applied economics at the University of Minnesota, it his independent work that he spoke of during a 90-minute reveal of bold ideas for the future of milk pricing.
Bozic was the keynote speaker for the 2022 Pennsylvania Dairy Summit in Lancaster this week. His first public presentation of what he has been working on for months fueled questions and applause from the over 300 attending dairy producers and industry members.
The first is something he has already begun bringing to fruition. Receiving milk checks from producers in some parts of the country, so far, his goal is to start publishing a Milk Check Transparency Report that would allow producers in a region, or nationally, to see how they are paid — to make milk checks more comparable, and work toward a way for producers to plug in their volume and components and be able to see how decisions affect their price.
He urged dairy producers to consider providing milk checks for this purpose with the goal to cover all regions and buyers. Only Bozic and his assistant see the milk checks, and they are destroyed once the data is entered.
“Making milk checks more comparable brings accountability,” said Bozic. “Transparency is empowering. It gives perspective, and we can have those meaningful conversations.”
While acknowledging that the conversations could get “loud,” and this could get “messy” for a while, he said again, “The optimum level of tension is not zero.”
This new Milk Check Transparency Report will be a way to introduce accountability and competitiveness into the system, said Bozic.
On the milk contracting side, he laid out several ways that producers can have a more level playing field. Key among them is that milk buyers should not be allowed to limit a farm’s production and require exclusivity at the same time.
“Those are two separate lanes, and when they cross, we have traffic accidents,” said Bozic. In other words, a milk buyer or co-op should not require a patron farm to sell only to them while at the same time having a two-tiered pricing scheme — putting limits on how much they will buy at a non-penalty price.
Bozic talked about tweaking the FMMO system to “reinvigorate” fluid milk. He had ideas for a processor premium — raising the price of fluid milk with a premium that, for example, processors can earn back through innovation of packaging and promotion that improves fluid milk marketing.
He also discussed having an open debate about how to price Class I differently for more stability. So much important ground was covered. Look for details in a future Farmshine.
NEW HOLLAND, Pa. — “Milk pricing is backward, but look forward, and focus on components,” said Dr. Normand St-Pierre of Perdue Agribusiness speaking at Homestead Nutrition’s December Dairy Seminar in New Holland, Pennsylvania, where 200 dairy farmers heard from experts about the markets and the all-important goals of modifying milk price by improving components, and improving the milk margin by feeding healthy cows.
St-Pierre urged producers to be smart as they look at their costs — to not cut costs that sacrifice early lactation milk yield. He also pointed out how these higher prices for all components make feeding for components a continued area of focus to help the dairy in the face of milk check deductions related to cuts in base allotments and balancing.
Earlier in the program, Dr. Mike Van Amburgh shared Cornell University research on how to feed cows in a way that optimizes component yield by percentage, not just in total volume pounds. Total component pounds have historically been a function of total milk volume, but today, percentage counts because of per-hundredweight milk check deductions and over-base penalties.
“Milk volume is being discouraged in many regions of the country,” said Van Amburgh. “So the opportunity for producers here is to enhance their milk components, to make components a primary strategy, while still making your milk volume.”
St-Pierre noted that the next six months will be better than the last six months with a better milk price, and the futures markets certainly confirm this — moving even higher over the past four weeks. Global milk production is down 1% year-to-date, global skim milk powder stocks are low, butter production has been down for three months, stocks are low, and the world is getting short on butterfat, he said.
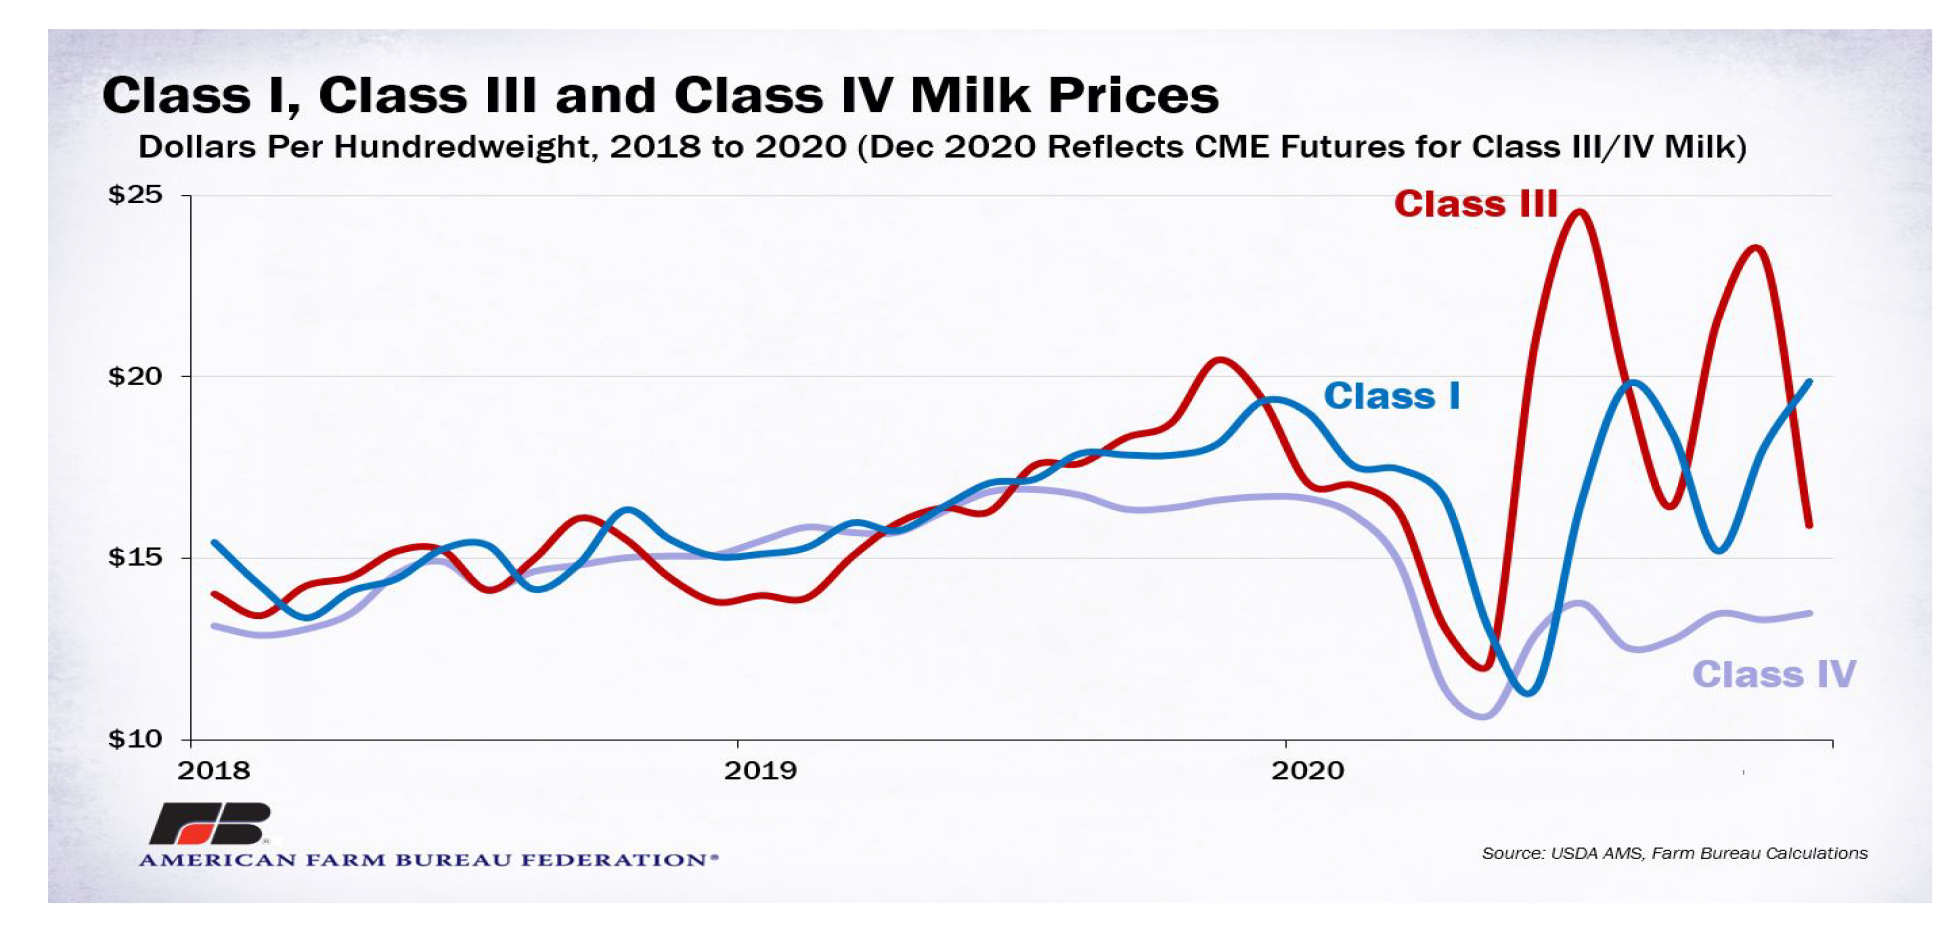
He observed that the Class III price was averaging over $19 and Class IV over $20 looking out six to 12 months in the futures markets. (That was the case on December 8, and now Class III is averaging over $20 and Class IV over $21.)
He sees the milk check butterfat price averaging $2.30 over the next six months; however, he said he believes this average could actually go higher, while protein should average $2.80.
Another positive he mentioned is the ‘solids nonfat’ are being priced higher, and the ‘other solids’ are priced at almost double the historical average, driven by robust whey sales.
Even the USDA World Supply and Demand Estimates (WASDE) report the day after this meeting (Dec. 9, 2021) revised forecasts higher for butter, cheese and whey with NFDM forecasted at steady prices in 2022. As pointed out by St-Pierre, the current trends suggest this report could revise upward again in January, although much hinges on consumer responses to inflationary pressure in their buying habits.
The 2021 All Milk price average was increased in the WASDE report to $18.60, buoyed by yearend strength, and the 2022 All-Milk price forecast was revised upward to $20.75.
If current futures market levels are realized, these higher trending milk prices should help dairies keep pace with rising input costs, although experts calculate feed costs to be up by around $2.50/cwt for 2022 vs. 2021 and all costs combined could be up by almost $3.50/cwt for 2022 vs. 2021.
St-Pierre dug into this from a milk pricing standpoint, and he shared the good news that negative producer price differentials (PPD) from 2020 and the first half of 2021 have “quieted down.”
Negative PPDs eat into location adjustments and change the way components are ultimately valued when massive de-pooling of milk occurs in Federal Milk Marketing Orders.
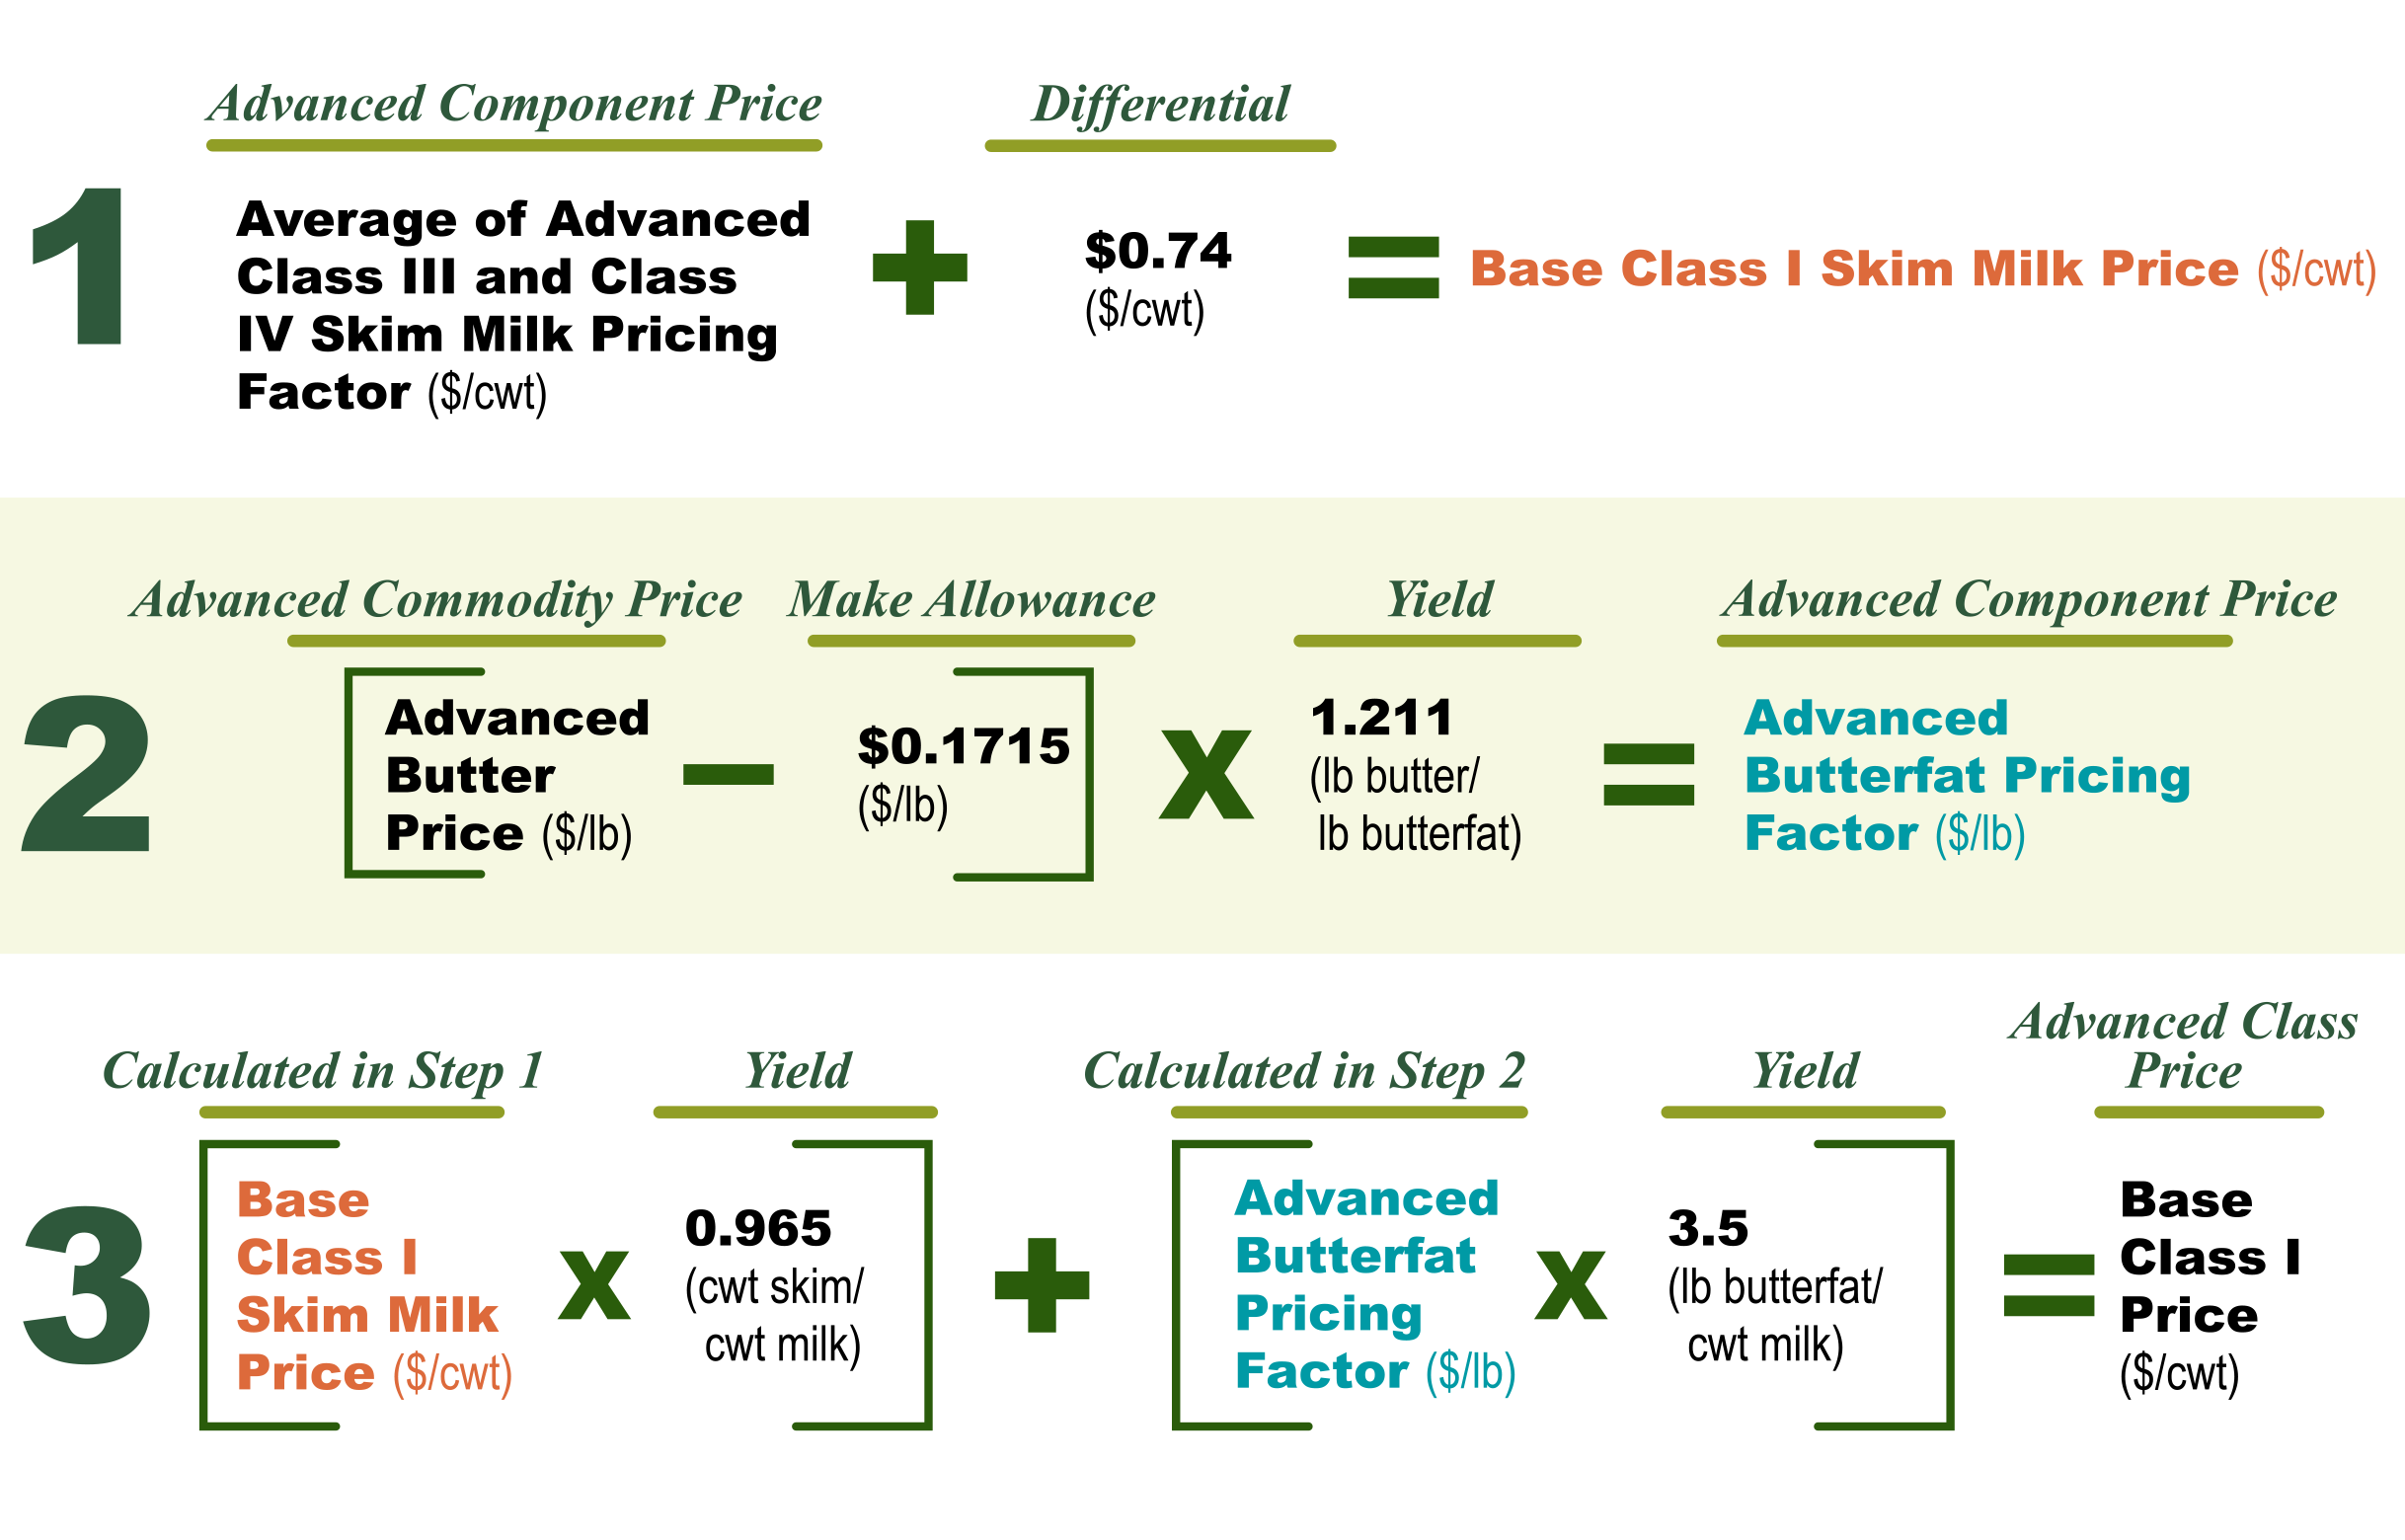
“We have positive PPDs right now because Class III and IV are trading closer together,” he said, noting that the new Class I formula averages the two manufacturing classes and adds 74 cents, so when they trade farther apart, the producer sees the hit in Class I also, dragging down the blend price and leaving smaller or negative producer price differentials (PPD).
The Class I pricing change and negative PPDs are issues St-Pierre has written about.
“Now they are asking the people who made the mess to fix it. That escapes me,” he said, noting the Federal Milk Marketing Orders (FMMO) were created in the 1930s and designed at a time when there were hundreds of cooperatives and milk did not move all over the country and the world.
St-Pierre said FMMOs exist for “orderly marketing,” but the government made a ‘fix’ that is like fixing an old horse. “He’s fixed but not running very fast and may be at the point where the horse has had enough.”
FMMOs were also created at a time when people drank more milk. Today, he said, they eat more cheese.
Showing a graph of per-capita fluid milk sales from 1980 (234 pounds per capita annually) to 2018 (146 pounds per capita annually), St-Pierre asked: “Does that look to you like an area of growth? If that marketer worked for Coca-Cola, he would have long been unemployed.”
While he acknowledged fluid milk has been disadvantaged by “lazy marketing,” he also said promoting milk is very hard because “we are not in the same world as in 1980. We are competing against water — with food in a bottle that we have to keep refrigerated. Cheese is easier to sell.”
The per-capita rise in cheese consumption since 1980 reflects this.
In the past, said St-Pierre, the FMMOs were designed to put the highest price in the bottle because that was the most perishable product. Today, as for the past 20 years, the prices are still based on the surveys of four products at wholesale – cheddar, butter, nonfat dry milk, and whey.
It was designed to have those prices for Classes 1 through 4 go in that order, he explained. “But it doesn’t work that way anymore.”
“As the butter price goes up, just make more butter, right?” he asks. “But it’s hard to make butter in a cheese plant and vice versa.”
“If I’m a processor, and I built a big cheese plant, and it cost me $150 million, I make a lot of cheese,” St-Pierre quipped.
Plus the built-in make allowances encourage single-product, single-class production plants running at full capacity, regardless of what the market is doing.
“It will take a while to change that dynamic,” he said.
“All milk is paid on components, but handlers don’t pay for components in the same way in the (FMMO) pool,” said St-Pierre. He explained that milk handlers pay for components according to how the milk is used, what “class” of products the milk was utilized in.
Class I price is based on butterfat and skim, Class II on butterfat and nonfat solids. Class III, which is 55% of the milk utilization, pays mainly on protein and other solids with an adjustment for butterfat because cheese production also uses a lot of fat. Class IV pays on butterfat and nonfat solids.
“We price things backward. Tell me one thing that you can go out and buy and drive out of the store and a month later tell that store what you will pay for it,” St-Pierre said, noting this is essentially what milk buyers do through the FMMO system, month after month, year after year.
He encouraged producers to be looking ahead three months, which he admitted is hard to do when the pricing for their product is so far behind the transaction. Still, he said following the markets gives a good indication, and there is more reliability in the 3-month window than 6 to 12 months out in the futures markets.
The Class III price is normally higher than Class IV, but for the next few months, even through the next year, it looks to be flip-flopped.
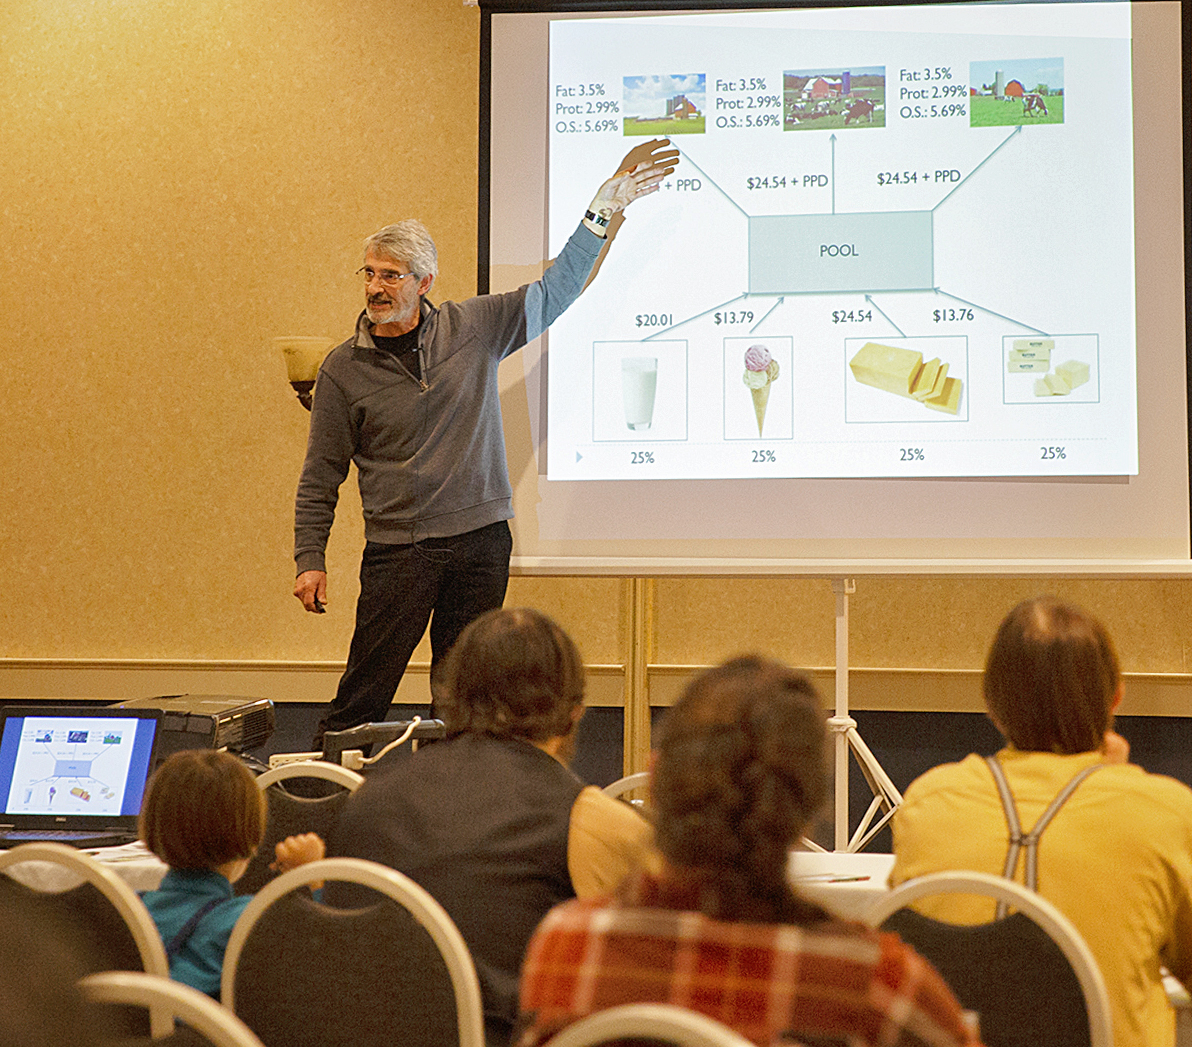
Using an ‘imaginary’ FMMO, he divided all four classes as 25% utilization, which in reality is not too far off what the Northeast Order can come close to. In that four-class FMMO, the different ways different classes pay for components cause the books to be out of balance after producers are paid their advance check based on protein. Knowing each class pays differently, the class price differences and utilization become the key to how that PPD is either positive, flat or negative.
When Class IV was $6 below Class III, cooperatives and processors de-pooled a lot of milk, St-Pierre observed: “They could just pay 20 cents over that $13.80 price to get the milk and then sell it back at the $20 (Class III) price. That makes the co-op look good but the producer gets shafted,” said St-Pierre.
In FMMO 30, where most of the utilization is already Class III, processors made a lot of cheese in 2020-21, but they didn’t pool a lot of that milk, and they got it cheaper, he explained.
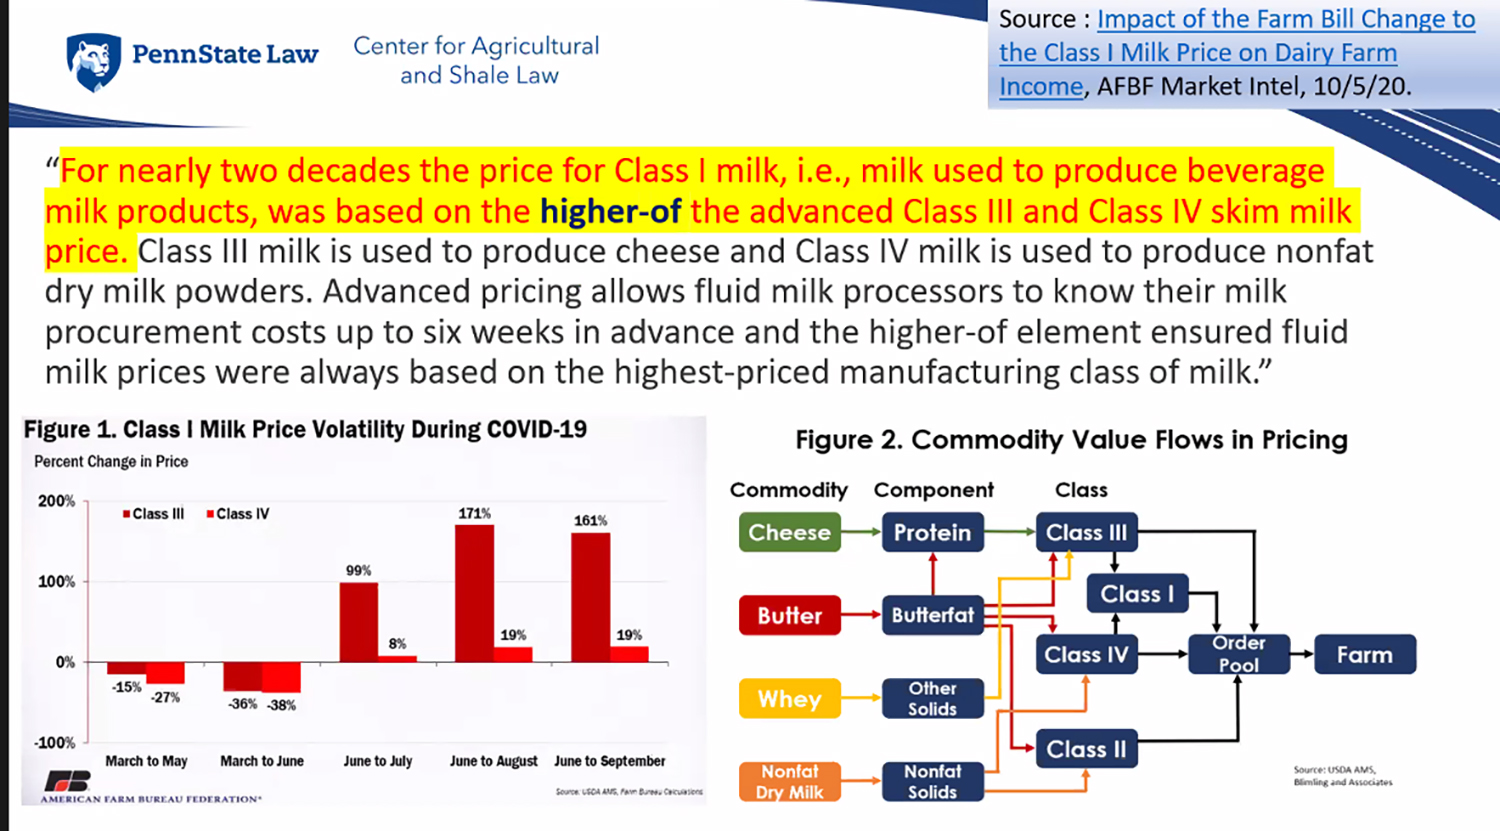
Bottom line, said St-Pierre, the Federal Orders were never designed to operate this way. Then along came the “little change” in the Class I price. In the past, the FMMOs used the ‘higher of’ Class III or IV as the way to set the Class I base.
“If I am a bottler, I don’t like that (higher of) because I don’t know how to hedge it,” said St-Pierre. “I know my price ahead of time anyway (through advance Class I pricing), but I still don’t like the ‘higher of’ so I go and tell Congress to average it and add 74 cents. Then Covid-19 hits, and producers lose over $750 million.”
St-Pierre notes that the industry is trying to fix the system, backwards.
He confirmed that where the negative PPDs kick Northeast producers is in the location adjustments. A smaller than normal positive PPD is a loss, and when it goes negative, it eats into the location adjustment, which is also supposed to be positive.
Working through all of these thoughts about pricing and consumption pattern, St-Pierre left dairy farmers with the good news that for the foreseeable future, the PPDs should be positive, although smaller than normal in some months, and Class III and IV prices are both on the rise.
Production has slowed, and demand is good, including for milk powders and whey. These positive supply and demand factors are confirmed in the dairy product production and cold storage reports.
With the very reasonable expectation of good prices for milk components, in the face of base penalties, balancing assessments, and other milk check deductions that a dairy producer encounters, the best way to navigate is focusing on component yield because the deductions are a flat amount per hundredweight of total volume, whereas component yield becomes a percentage increase in the value of those milk hundredweights.
Look for more on other interesting nutrition topics and milk quality award winners as this article continues in a future Farmshine.
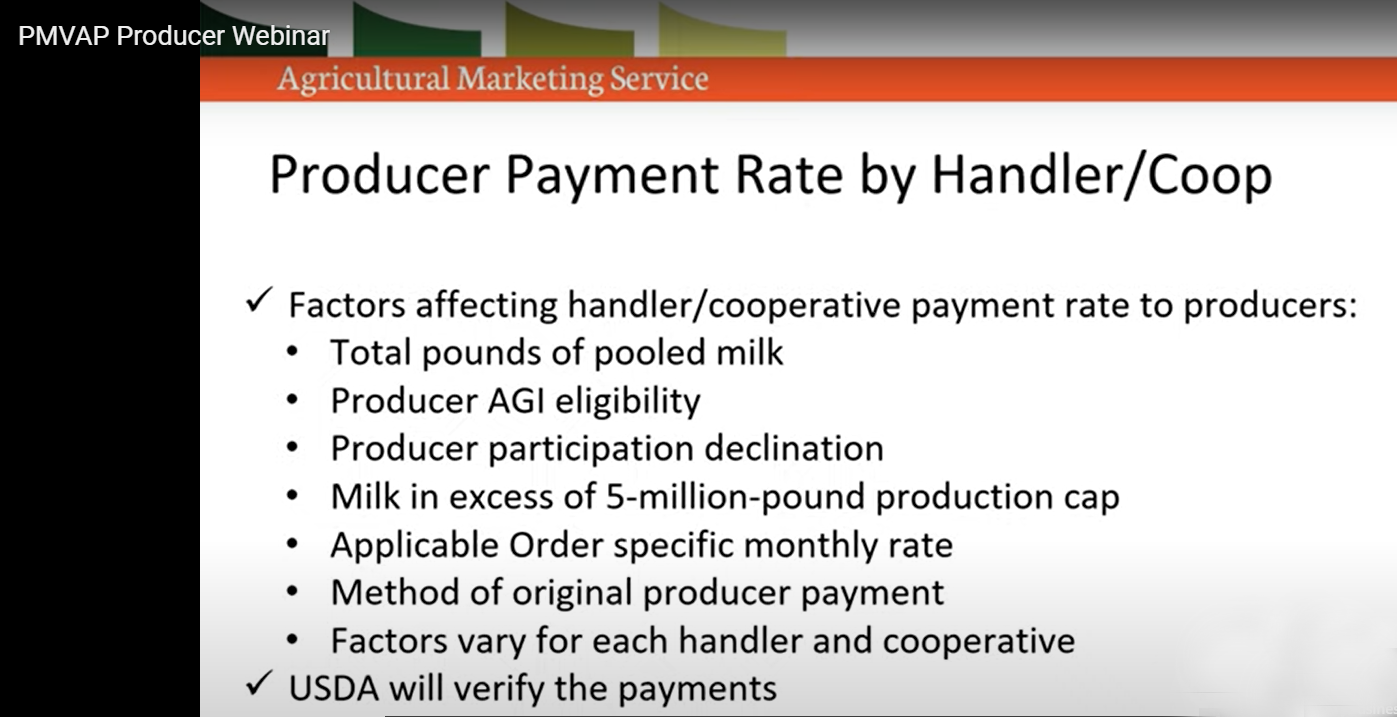
Just some of the criteria for PMVAP are listed on this slide. There is no generally-applied formula per-cow or per-cwt for how producers will receive these USDA program funds via their handlers or cooperatives. The PMVAP payments are milk handler-specific. Criteria were explained in a USDA webinar and during a recent Center for Dairy Excellence industry call.
Producer payments will vary by handler eligibility, specific Federal Order data, how producers were paid during the covered time period, and are delayed to Q1 2022. Only those handlers and cooperatives that pooled any portion of their milk on a Federal Milk Marketing Order at any point during the July-Dec. 2020 time period are eligible.
By Sherry Bunting
WASHINGTON, D.C. – Dairy farmers are wondering about the PMVAP payments. They were expecting to see roughly $350 million in Pandemic Market Volatility Assistance Program funds disbursed by USDA through eligible milk handlers by the end of 2021.
According to Erin Taylor at USDA AMS Dairy Programs, those payments will be delayed until the end of January or into February or even March because of the unique and complicated handler-specific internal clearing process being used.
During a recent Center for Dairy Excellence dairy industry call, Taylor said USDA has been working diligently with eligible handlers and cooperatives since the program was announced on August 19, 2021.
It is a complex process of USDA AMS dairy program staff meeting with milk handlers and cooperatives that pooled any milk on any Federal Milk Marketing Order at any point from July through December 2020 to formulate specific payment agreements on an individual handler basis that include the calculated lump sum to the handler and specify how the producers affiliated with that handler are to be paid.
“We have started sending out these agreements and expect to get them all out to handlers for signing and returning by early January,” said Taylor. “Once approved, we will distribute payment dollars to those handlers. Then, they have 30 days to disburse the funds to their eligible producers.”
In short, she said, USDA is striving to get the money sent to handlers in early 2022. Later this spring, she said, USDA will audit handlers to verify these payments were made correctly, in full, to their producers.
It is important to know that not all handlers and cooperatives are eligible to participate, not all eligible handlers will choose to participate, and therefore, not all producers will receive PMVAP payments.
Who iseligible for PMVAP payments?
Only those milk handlers and cooperatives that participated in a Federal Order system during some or all of the July through December 2020 time period are eligible, according to Taylor.
Eligible handlers must also obtain from each producer the verification of meeting the Adjusted Gross Income (AGI) limits USDA has for its farm programs.
“You should have been contacted by your handler by now, if you are eligible, because they need to verify that you meet the AGI requirements,” said Taylor, noting that any producer who has not been contacted by their handler but thinks they are eligible for PMVAP can contact their handler and directly ask if they are participating.
“If that doesn’t work, or if you would rather ask USDA, then email pmvap@usda.gov or call 202.384.3417. Tell us who your handler is, and we can look it up,” she added. These email and phone contacts can also be used by producers who have other questions about the PMVAP.
During the Center for Dairy Excellence call, producers asked if there was a formula for how they can expect to be paid per cow or per hundredweight. Taylor explained there is no general formula for many reasons.
First, she said, there are requirements in this program that will be met differently by different handlers according to their Federal Milk Marketing Order data.
Also, payments to producers are limited to payment of 80% of losses on up to 5 million pounds of production and only on milk that was pooled or in cases of non-pooled producers who were paid by their handlers based on the pooled volume – together with the pooled producers.
“Each factor is different for every handler,” said Taylor. “We are working with handlers to ensure the milk pounds to be paid on and the methodology for payment are correct according to the program.”
She said doing it this way was deemed “the easiest way to do it through handlers that have this payment relationship with (dairy farmers), to get the money out quickly and with USDA oversight.”
In short, these are targeted payments based on Federal Order pooling fund losses as reflected by a much lower Class I base price under the new average-plus formula compared with the old ‘higher of’ formula for the July through December 2020 time period.
“A lot of these factors differ by handler in terms of how producers were paid in aggregate,” she said. “In the FMMOs, handlers don’t have to pool all of their milk. Some don’t pool any, and those that didn’t pool any milk are not eligible.”
For other handlers, the payments are based on the pooled portion, but if they paid all their producers the same way (pooled and non-pooled), then their payments to their producers will be done in the same way over all the milk in aggregate, not just the pooled milk.
“Otherwise, it would be the luck of the draw because a producer is not the one who decides on what milk is pooled and what milk is not pooled,” Taylor explained. “We compute the payment rate (for each handler) in a way that ensures fairness and equity in how the payments are distributed (based on how the producers were originally paid) for those months.”
Taylor said each eligible handler will have received workbooks pre-done by USDA with their approved data for covered milk pounds and the payment methodology so they can simply do the calculations and distribute the payments to their producers accordingly.
FMMO staff will audit and verify with handlers after these payments are made, according to Taylor.
The eligible and participating milk handlers will be reimbursed to administer these payments, which includes providing an educational component for their producers. These funds do not come out of the producer payments but are calculated separately.
She noted that handlers do not receive their administration reimbursement until after USDA verifies producers have been paid in full and the educational component is met.
When asked what percentage of U.S. milk production will be covered by PMVAP payments, Taylor said it depends on the percentage of handlers pooling milk and choosing to participate in the PMVAP. Normally, she said, about 70% of U.S. milk production is pooled on Federal Orders, but in 2020 this percentage was lower (due to massive de-pooling of milk in many Federal Orders in the face of severely negative PPDs).
Producers also asked if there is any chance that a Class III producer that was not paid that higher Class III price during the July-Dec 2020 period may be able to receive PMVAP payments.
“This program pays on pooled milk and depending on if the handler pooled any milk at all will determine if that handler’s producers get a payment,” Taylor replied. “Those that didn’t pool any milk during those months are not eligible under the current program rules.”
While these PMVAP payments are meant to assist against the losses influenced by pandemic volatility in 2020 exacerbating issues with the Class I formula change, the payments will be received by producers in 2022, and it will be considered earned income for that tax year, according to Taylor. Handlers will be sending 2022 Form 1099 Misc. Income statements to producers receiving these payments.
The educational component of the PMVAP requires handlers to outline their plans and to verify they have met them. USDA AMS has provided links at the special website with educational resources on an array of federal dairy policy topics that meet the requirement. Handlers can also choose to use other resources to provide education on one or more areas that include dairy markets, risk management, how FMMOs work, how marketwide pooling works, Dairy Margin Coverage and other topics via a variety of methods, including in-person meetings, webinars, newsletters, emails distributions and mailers.
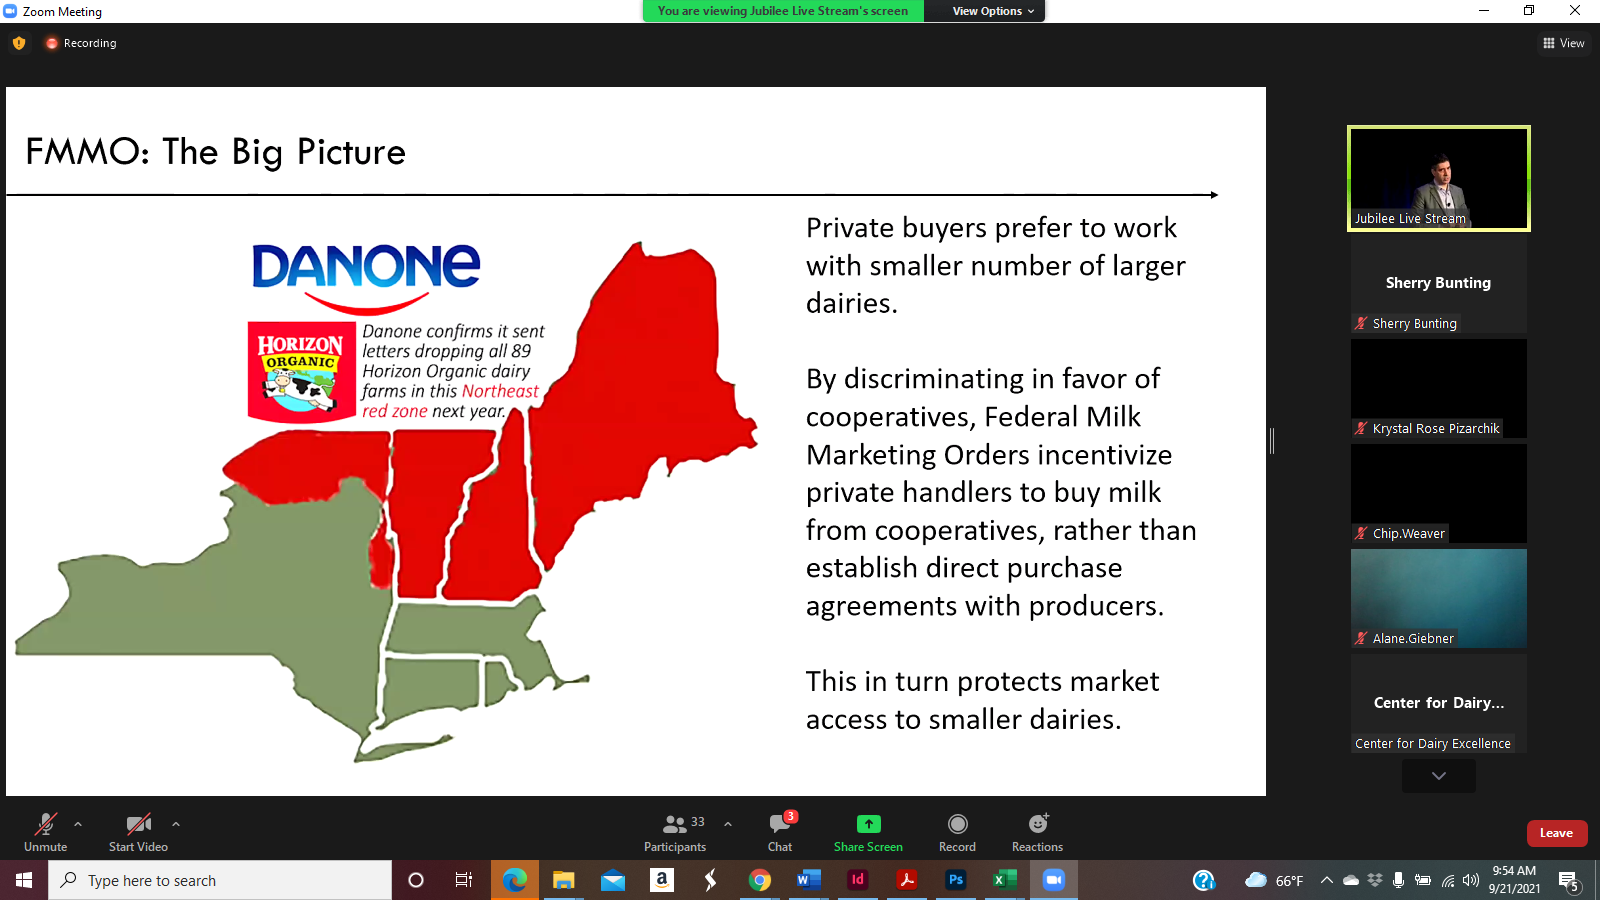
Using a graphic pulled from the September 10, 2021 edition of Farmshine in which a follow up story ran about Danone dropping 89 organic dairy farms from its Horizon brand — all of its Horizon farms in the Northeast — Bozic explained that the ‘social mission’ of cooperatives is to market all of their members’ milk. He said the “primary function of the future” for the Federal Milk Marketing Orders — as an extension of the cooperatives — is to ensure market access for dairy farms. “Market Orders are there to ensure orderly consolidation at a humane pace,” he declared.
By Sherry Bunting, Farmshine, Sept. 24, 2021
HARRISBURG, Pa. – ‘Turning the page’ was the theme for the annual Financial and Risk Management Conference where key takeaways about a changing dairy industry were presented.
The conference was hosted by the Center for Dairy Excellence Sept. 21 in Harrisburg.
Pennsylvania Secretary of Agriculture Russell Redding summarized his own thoughts: “I am still very positive about dairy, but dairy will change. It is changing,” he said.
The Center’s risk management educator Zach Myers set the stage for attending lenders, vendors, producers and industry talking about Dairy Margin Coverage and Dairy Revenue Protection and how these programs have worked (more on that in a separate article.)
Digging into the stress — the ‘change’ — was Marin Bozic, University of Minnesota associate professor of applied economics and dairy foods marketing, who also serves as facilitator for the Midwest Dairy Growth Alliance. He dug right into how and why, discussing some of the Federal Milk Marketing Order complexities, industry trends and pricing relationships. He made the case that more flexibility, competition and innovation are needed in the Federal Orders for a “level playing field” so winners and losers can “self-select.”
Bringing up the 89 organic producers Danone will drop from Horizon next year, Bozic said it is an example that, “One new farm in Indiana replaced 89 or 90 farms in the Northeast, and they can do that. There is nothing illegal about it. They could say they have a fiduciary responsibility to stakeholders and are minding their bottom line, but none of that helps you if 90 producers get dumped in a year.”
He pointed out the “social mission” of the cooperatives is to leave no member behind, so remaining an independent producer carries more risk today than in the past.
Bozic connected the dots to say the “primary function of the future for Federal Milk Marketing Orders — as an extension of the milk cooperatives — is to ensure market access for dairy producers.
“Market orders are there to ensure orderly consolidation at a humane pace,” he declared.
That’s a change from the central promise of the FMMOs today, which Bozic described earlier as “broken.”
“To navigate our businesses over the next year and longer,” said Bozic, “we have to count the passes and see the gorilla” — a nod to the visual exercise he had the audience participate in.
Bozic mentioned a few gorillas in milk. Gorillas in the FMMOs, in risk management, in dairy markets and in the macroeconomic situation – what else is going on in the world.
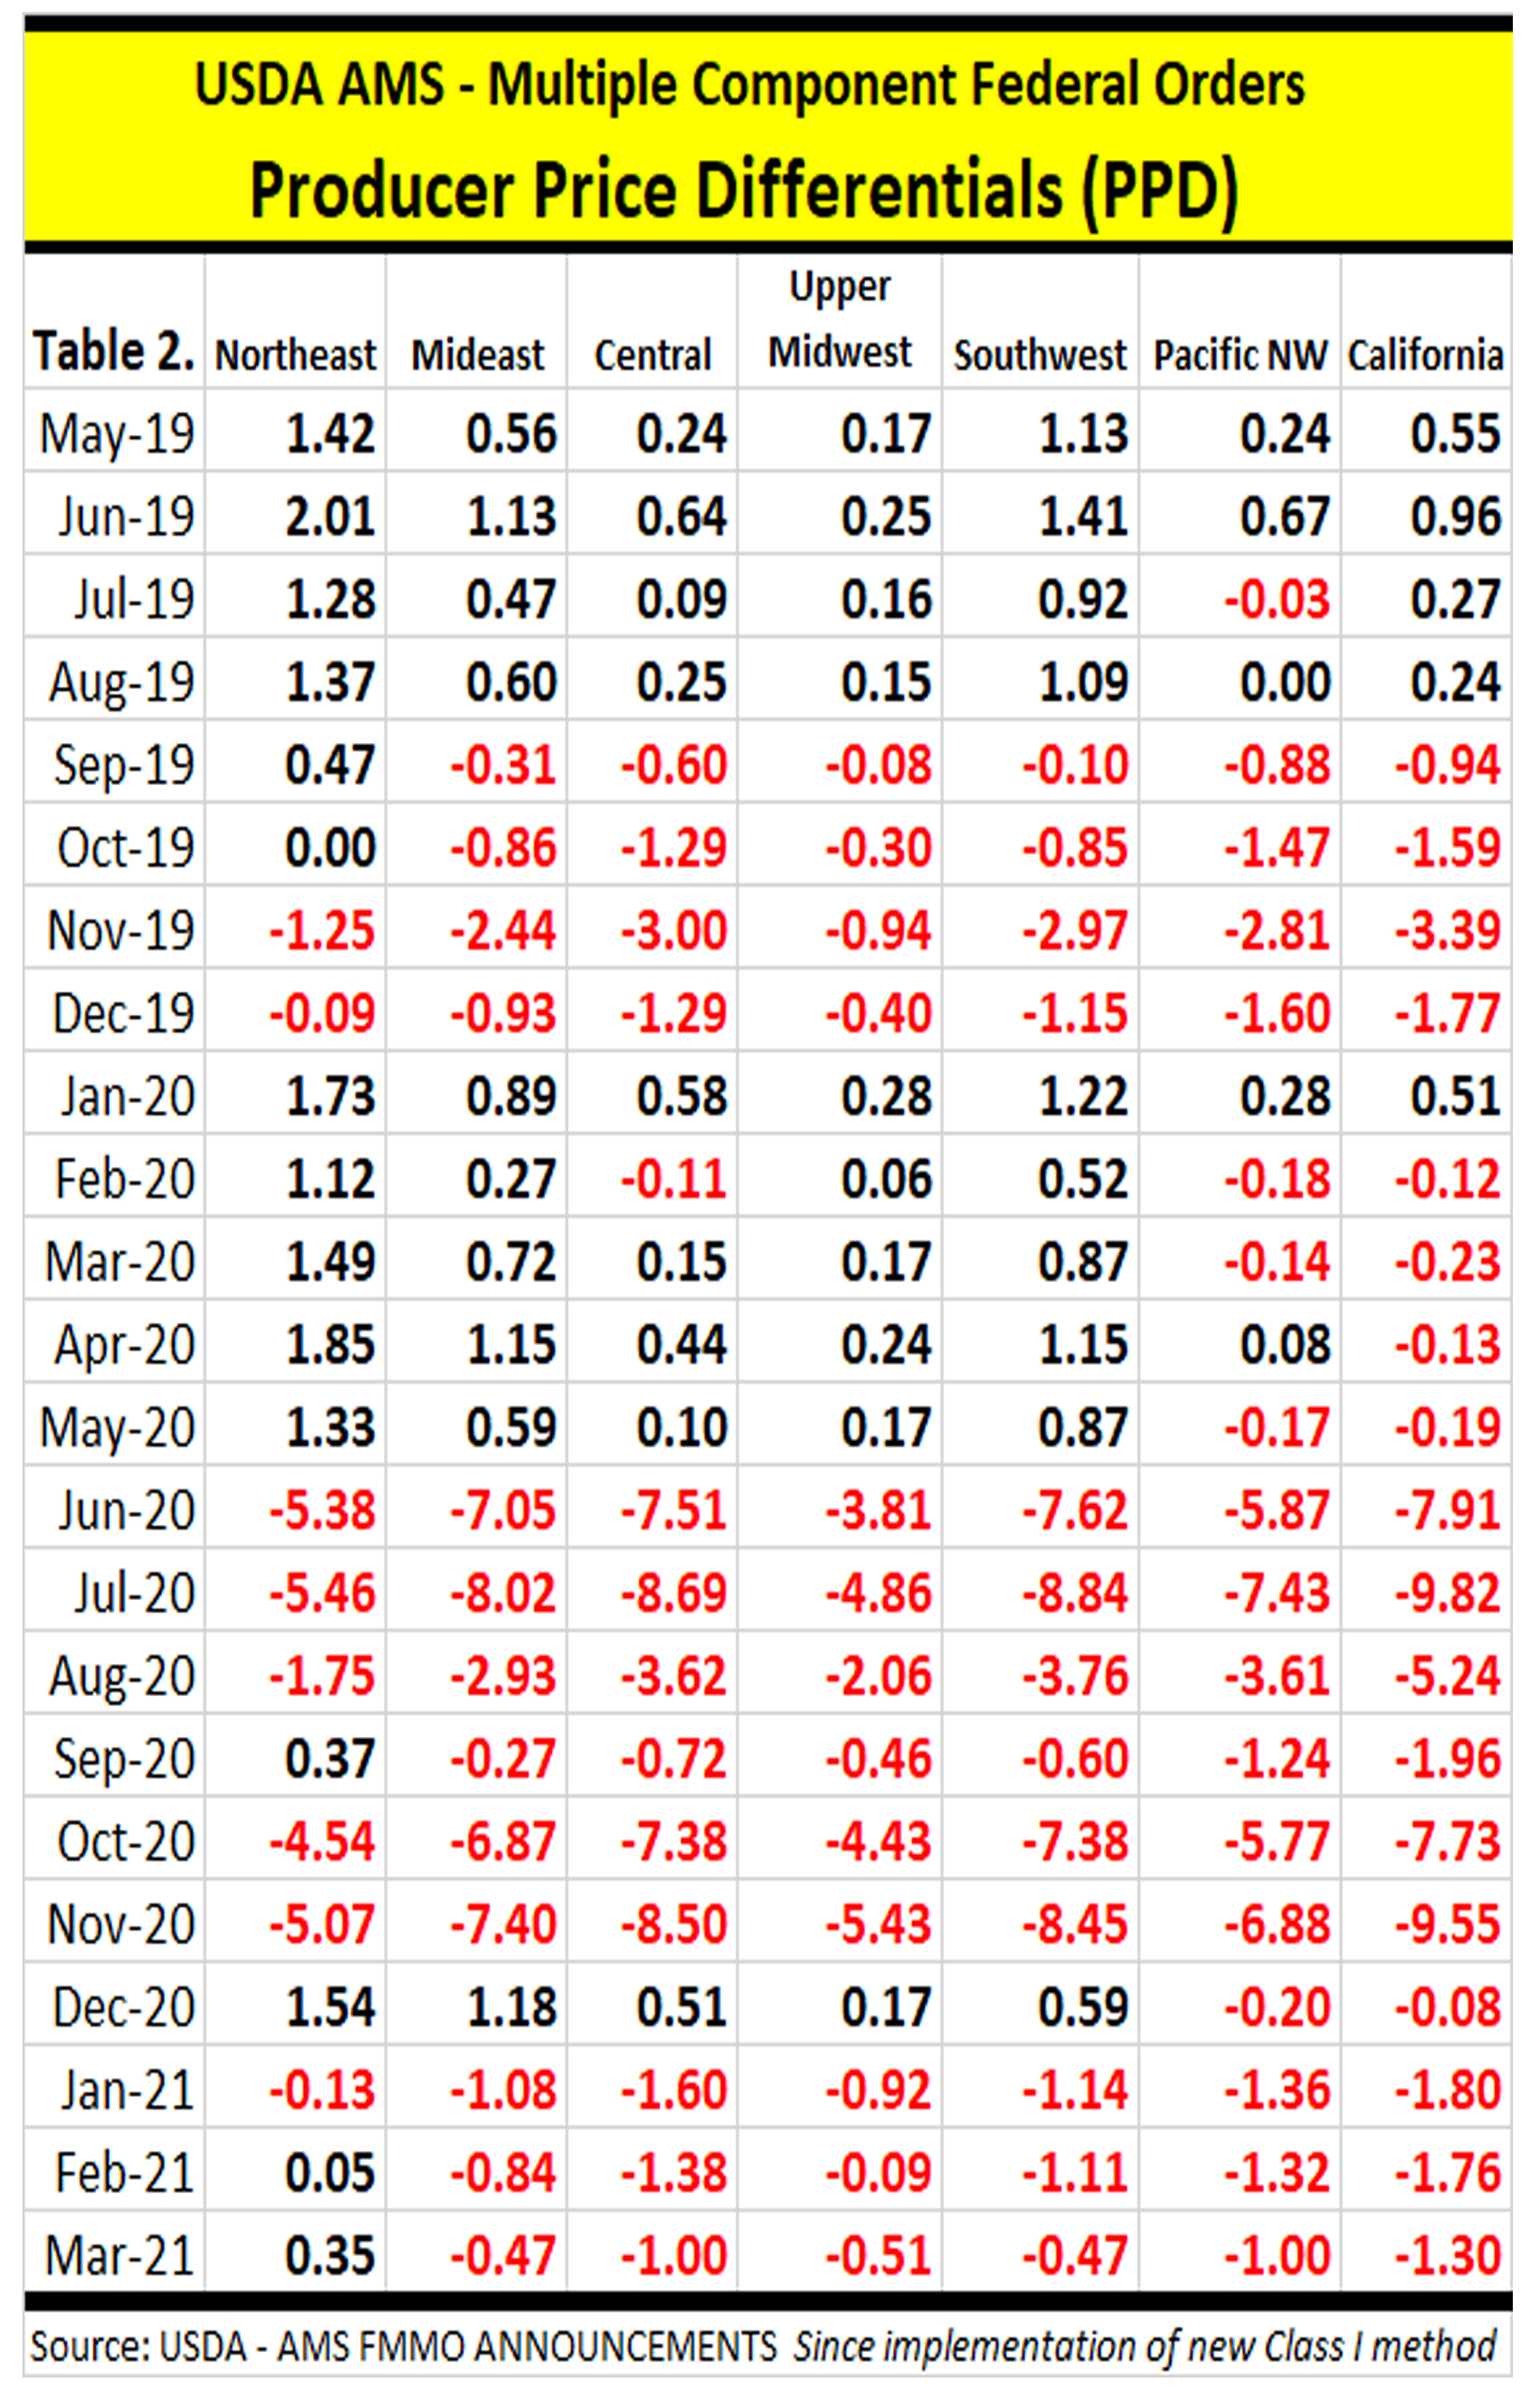
He showed graphs of what Producer Price Differentials (PPDs) looked like for the Northeast in 2020, the $4 and $5 negatives that represented cash flow bleeding, equity bleeding.
While the futures show the view out to the horizon over the next 6, 12, 15 months that would suggest there won’t be a repeat of that carnage, Bozic cited some of these risks, or gorillas, in the market and in world events that could represent shocks that can make the whole thing “go haywire again.”
Observing that the FMMOs are not the same today as when they were designed many decades ago, Bozic stepped conference attendees through the various long- and short-term impacts that reduce PPD, such as declining Class I utilization compared with increasing Class IV utilization and production.
“Orders were designed around the assumption that there would be plenty of fluid milk usage (as a percentage of total production), and we can just take it and designate it to be the highest and use those funds to make everyone whole,” said Bozic.
“The central promise of the FMMOs is that if your milk is as good as your neighbor’s, you get paid the same, so one farmer does not bid against another for market access and a good price,” he asserted. “That promise is now getting broken, not as much here, the East Coast FMMOs still have Class I.”
The next effect in the Northeast is the rise of protein tests. This impact comes through two channels where higher protein reduces PPD, the economist explained.
“Envision FMMOs as all processors paying into the pool and then taking from the pool. First they pay to the pool with classified pricing based on their respective milk solids. Class I pays on pounds of skim milk as volume, not on protein pounds,” he explained. “Even if sales are the same and the only thing that changes is protein, those (Class I) processors would pay the same amount (on skim) into the pool and take more money out (on protein) so there is less money remaining and a lower PPD.”
The second way higher protein production affects PPD is when the value of protein is lower in the powder than it is in the cheese. The butter/powder plant pays to the pool on nonfat solids price but takes money from the pool on protein price, “so that spread between the value of protein in cheese and powder also leaves less money for PPD,” said Bozic.
He explained the Class III price as an index of butterfat, protein and solids, in a straight formula that equals the class price. “When Class III price is higher than Class IV price, the predicted PPD for the Northeast Order declines,” said Bozic. “It’s almost linear.”
Conversely, when IV is above III, PPD goes up. “This has to do with paying the pool based on protein and nonfat solids, but when handlers take money out of the pool for components, everyone takes protein price leaving less money in the pool for PPD.
Bozic explained the demand shock to this system when the Food Box program “focused on smaller packages of cheese to put in every box. They didn’t take bulk powder and butter. So we went from a record low cheese price on the CME to a record high and no one expected this.”
The pull of 5% of the cheese supply for immediate delivery had everyone scrambling, said Bozic.
The amount of spare cheese available was not as high a volume as the government wanted to buy so cheese went from being long to short, and the price skyrocketed. This translated to an historically higher gap between Class III and IV prices as wide as $10 apart.
So why not just send more milk to make cheese? Bozic maintains that Class IV processing is accustomed to “balancing” fluid milk seasonality so there is extra capacity in that system.
Not so with Class III because those plants already run at capacity. “That’s the only way processors of commodity cheese make margin is to run at capacity, so when the demand shock came, and spare product was used up, there was no spare capacity and the price went higher. That was the main driver of negative PPD in 2020,” said Bozic.
Will it happen again? Bozic doesn’t foresee Food box programs with the same intensity in the future, but, “yes, it can happen, but I would say you need to have a pandemic in an election year. Don’t count on a program like this.”
The industry did ask USDA back in the 2008-09 recession to buy consumer packaged cheese instead of bulk commodities, so it could move instead of being stored to overhang the market later. That wasn’t working either.
“Now we understand that this other method disturbs PPDs so the dairy industry is united behind a more balanced approach,” said Bozic, describing the next iteration of purchases through the Dairy Donation Program will not be as aggressive in moving the markets by three orders of magnitude.”
Bozic said quick rallies and crashes impact PPDs also because of advance pricing on Class I based on the first two weeks of the prior month and announced pricing for the other classes at the end of the month.
Bozic explained why the change in Class I pricing was made: “The dairy industry wants to attract new distributors like Starbucks and McDonalds that are used to hedging their input costs. They don’t want to change prices every month. They want it to be what it is for a year, so the industry wants stable, predictable milk price costs to win favor with new distribution channels by making it easier for them to hedge.”
He said the new average plus 74 cents was designed to be revenue neutral. Looking forward, when Classes III and IV have less than $1.48/cwt spread, PPD under the new system is higher than under the old. But the most it can be higher is by 74 cents on Class I, which translates to 20 cents on the blend price.
“The best case scenario is to add 20 cents to the blend price, but when Classes III and IV are far apart “the PPD can go haywire. Bottom line, the upside benefit of the averaging method with 74-cent adjuster is limited but the downside risk is big,” said Bozic.
WASHINGTON, D.C. — Federal Milk Marketing Orders, their purpose, performance, problems and solutions — including a recent change in the Class I fluid milk pricing formula — were the focus of a Senate Ag subcommittee hearing on ‘Milk Pricing: Areas of Improvement and Reform” Wednesday, Sept. 15 in the Capitol.
“We are in the midst of a modern dairy crisis, magnified by a Class I pricing change in the 2018 Farm Bill. The pandemic and economic downturn are not the only causes of this problem, but they did exacerbate it. This system cannot adapt to market conditions and thus is not fairly compensating our dairy farmers. The formula change is a symptom of larger problems in a system that is confusing, convoluted and difficult to understand,” said Gillibrand Wednesday.
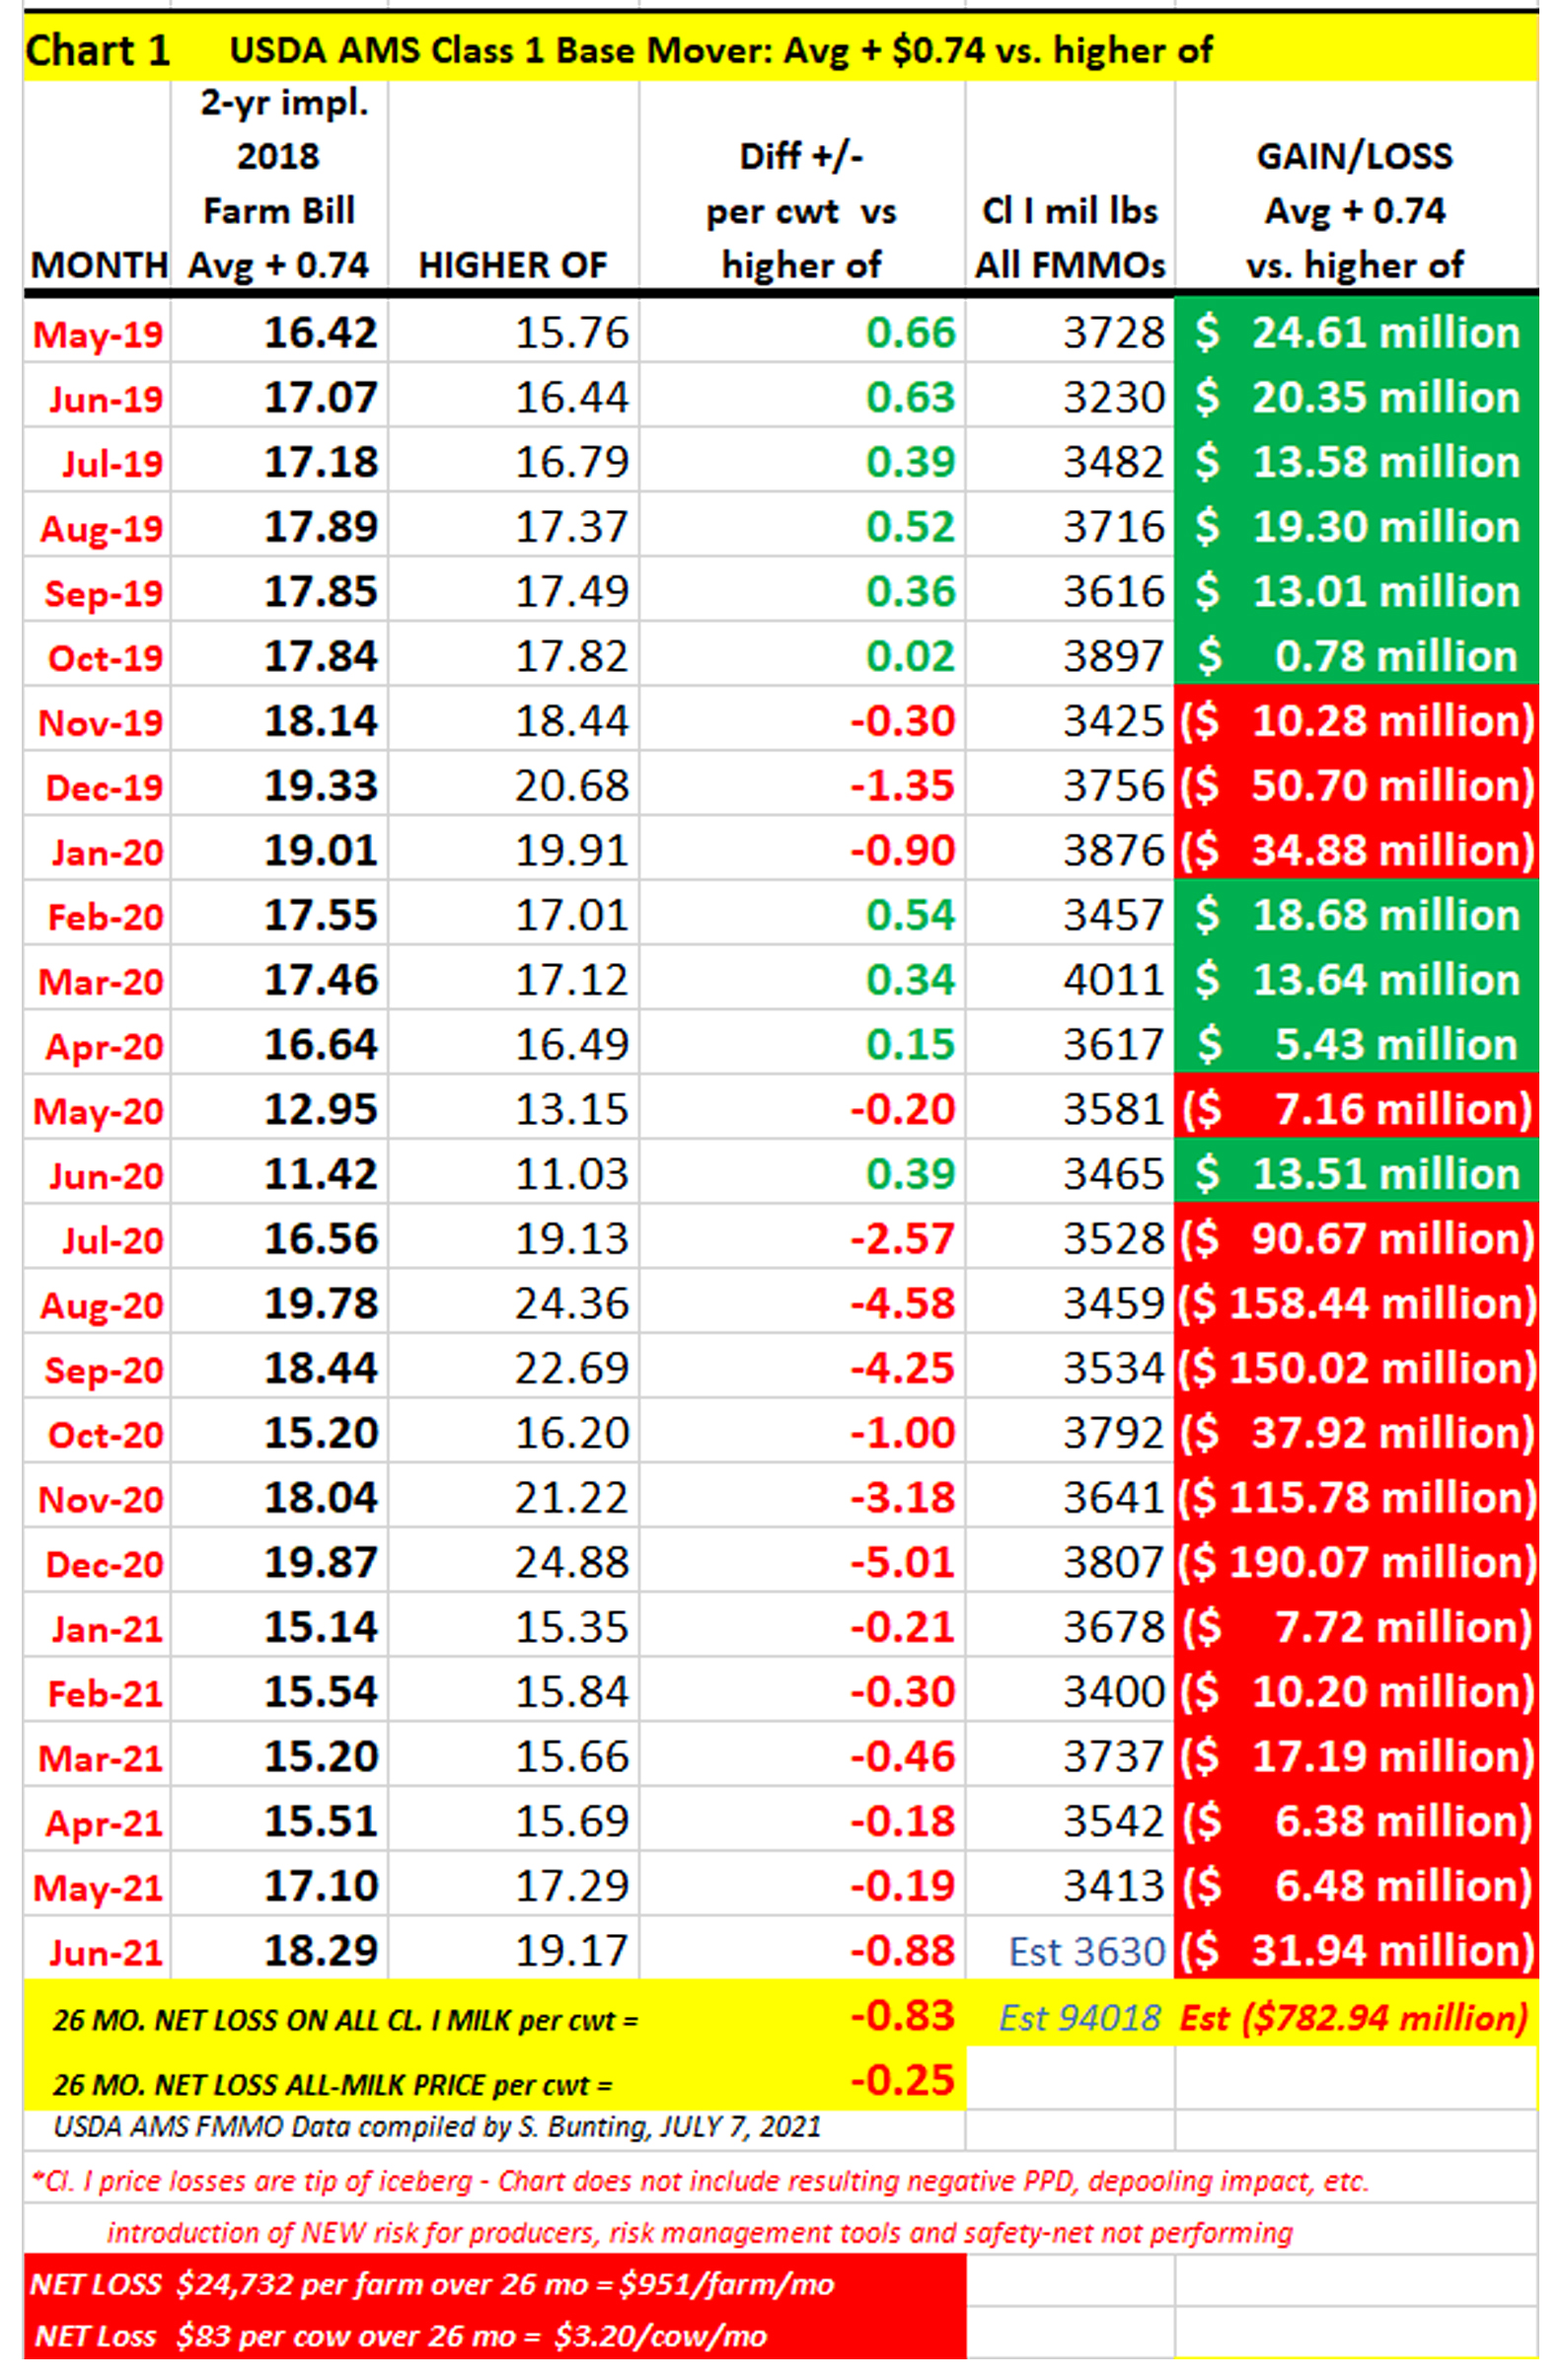
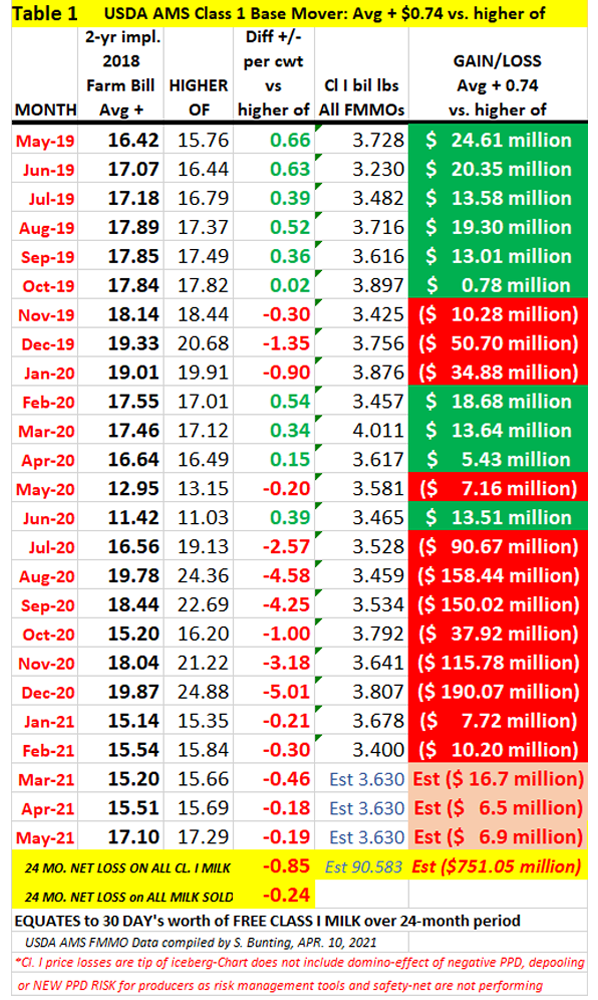
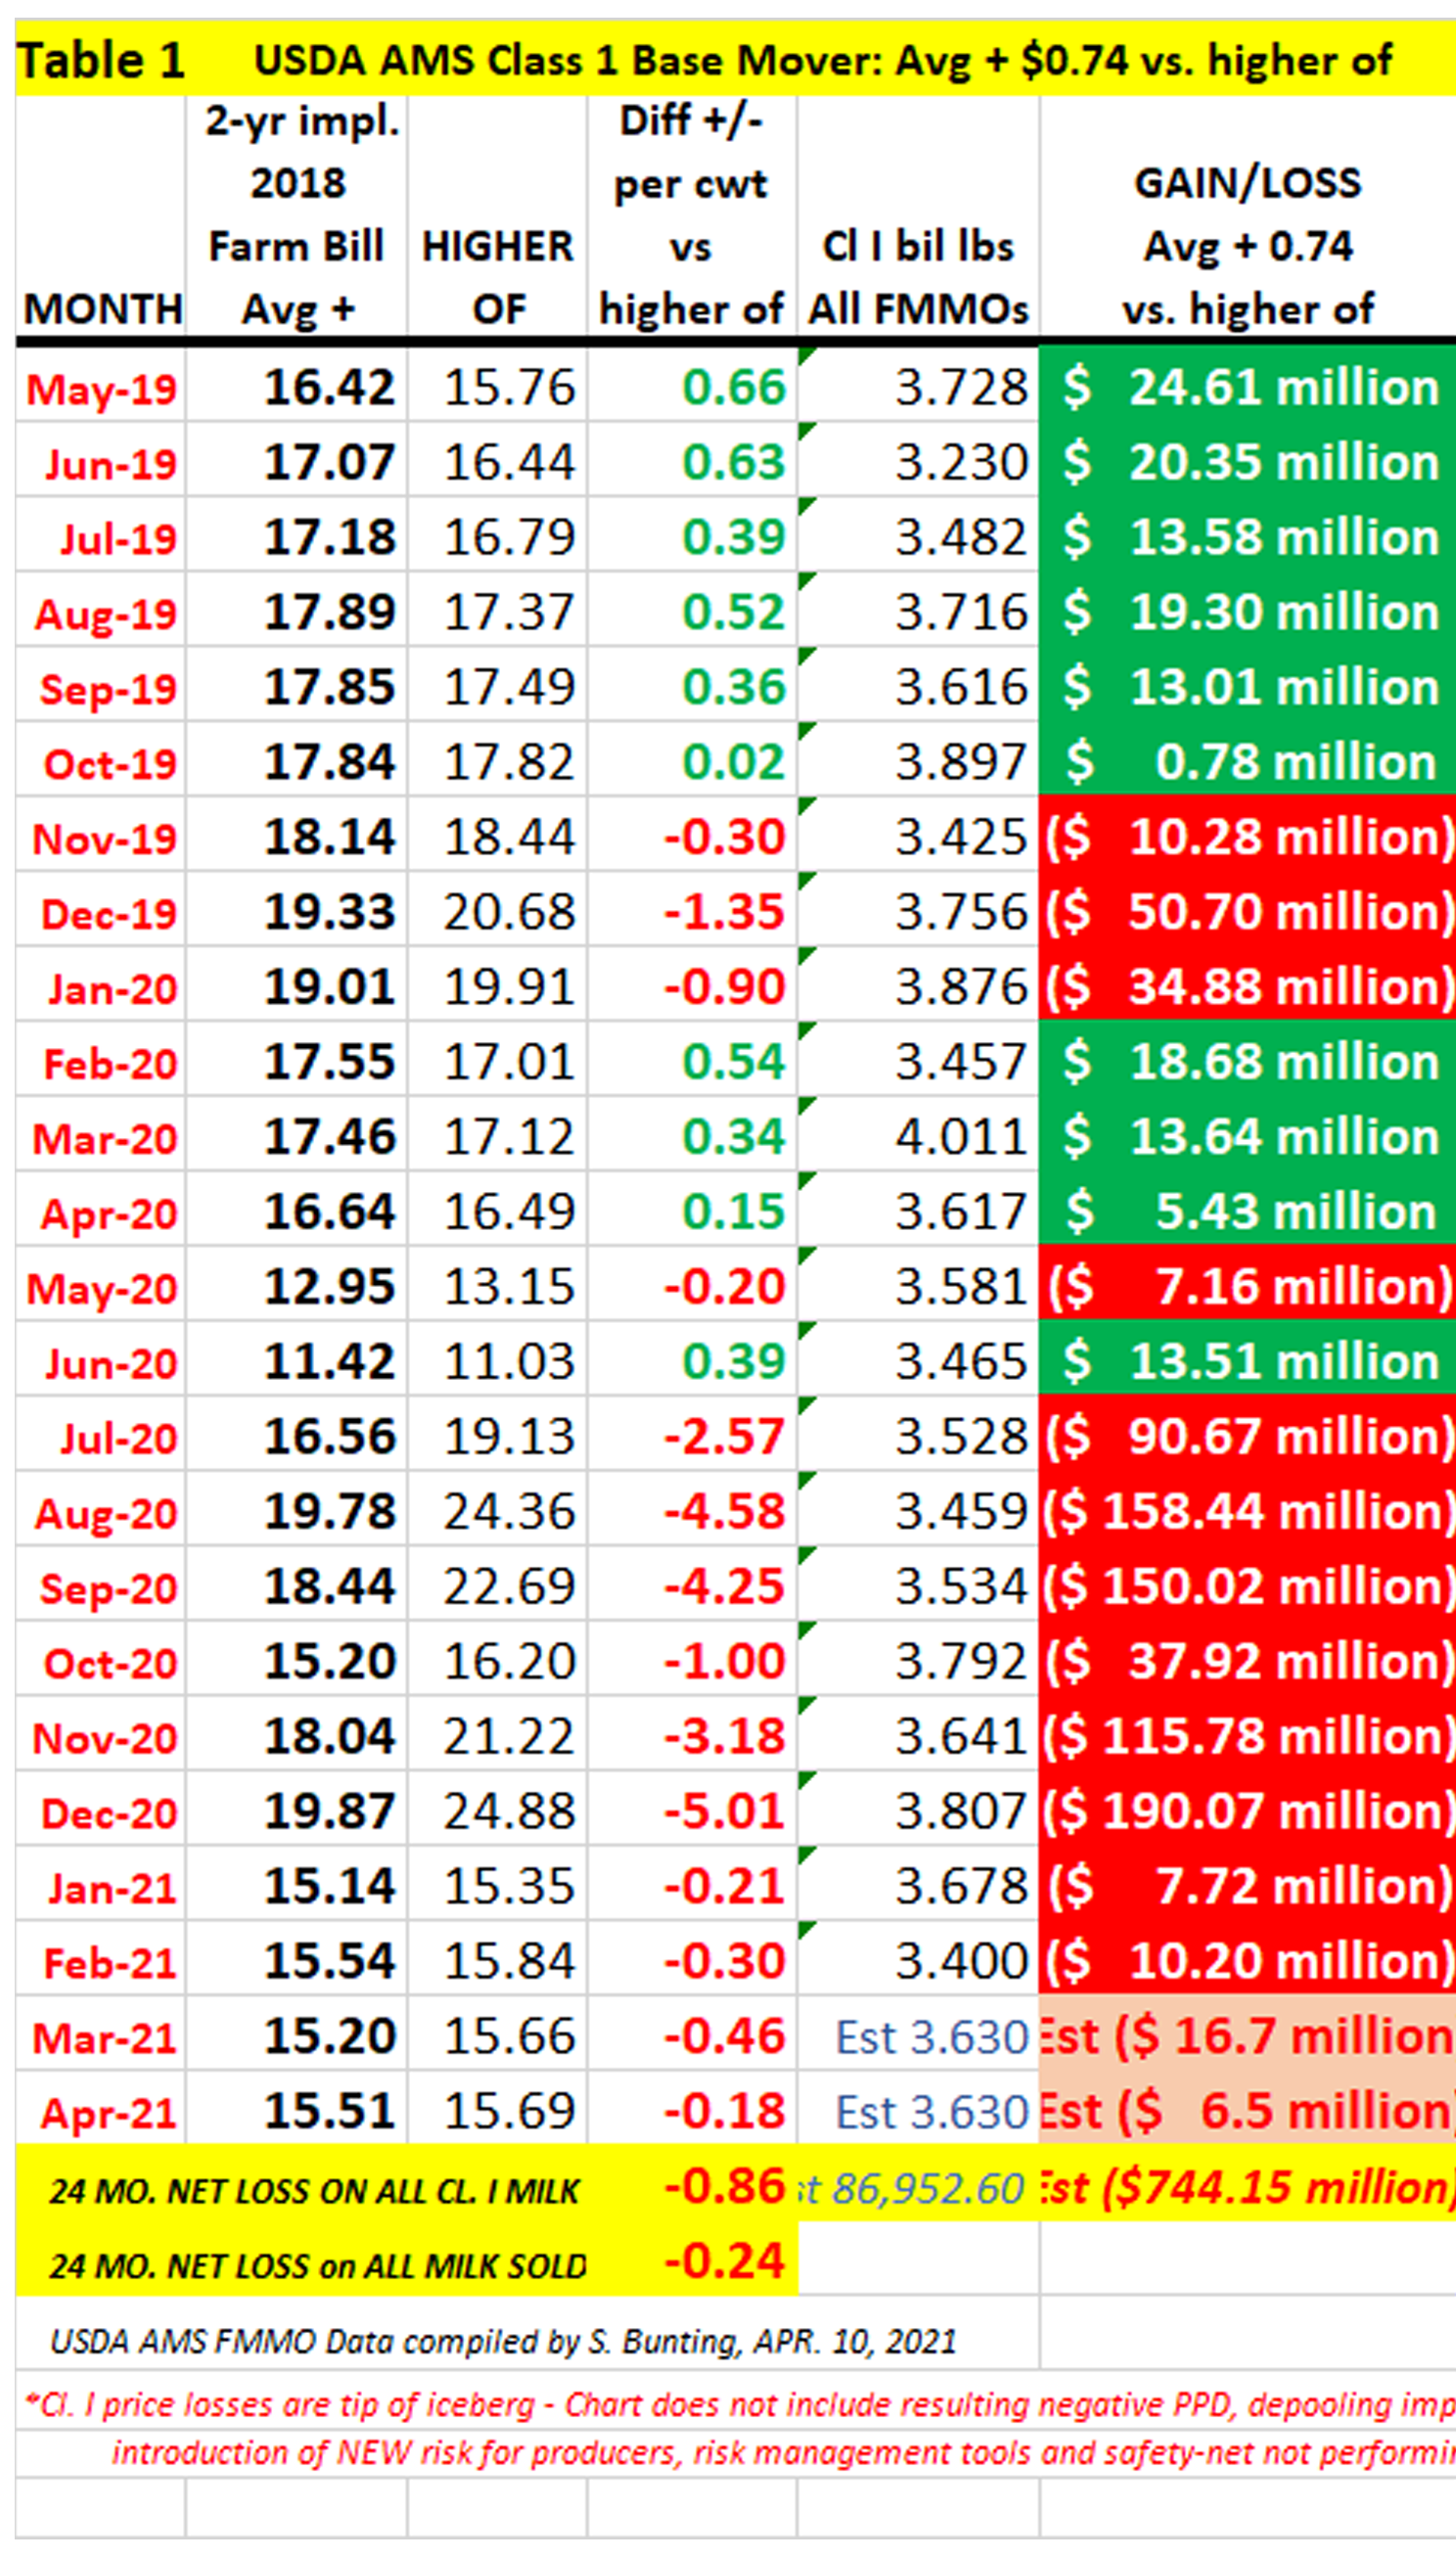
She recounted the more than $750 million in producer losses when looking at the previous Class I fluid milk ‘mover’ formula that used the higher of Class III or IV manufacturing milk prices and comparing it to the current formula that uses an averaging method plus 74 cents.
The hearing was a first step Sen. Gillibrand had previously indicated in a press conference last June, when the full extent of dairy farmer financial losses was becoming known.
As the hearing got underway, Gillibrand observed that from 2003 to 2020 there has been a 55% decrease in the number of dairy farms in the U.S.
“We are using an almost 100-year-old system with the last reform 20 years ago, where dairy farms are not operating as they were then. We need to put the power back in the farmers’ hands.” said Gillibrand.
The power to make the issues known was in the hands of three dairy farmers making up the first panel — Jim Davenport, Tollgate Farm, Ancramdale, New York; Christina Zuiderveen, Black Soil Dairy, Granville, Iowa, and Mike Ferguson of Ferguson Dairy Farm, Senatobia, Mississippi.
This was followed by a panel with Dr. Chris Wolf, ag economics professor at Cornell University, Dr. Robert Wills, president of Cedar Grove Cheese and Clock Shadow Creamery, Plain, Wisconsin, and Catherine de Ronde, vice president of economics and legislative affairs with Agri-Mark cooperative based in Massachusetts with members in New England and New York.
One thing everyone agreed on, in differing degrees, is that reforms are needed in the Federal Milk Marketing Order System.
Testifiers agreed that a key purpose of the FMMOs is to make blended payments more equitable between producers supplying different classes and uses of milk.
All three producers agreed the FMMO system should continue, although they shared differing ideas about how reforms could improve it.
There was also agreement that the new Class I ‘mover’ formula is not adequate for changing and uncertain markets. They agreed that using the USDA rulemaking process is the way to make such changes to be sure all parties are heard.
However, the current change in the Class I ‘mover’, implemented in May 2019, was made legislatively during the 2018 Farm Bill, not through the USDA hearing process.
Ferguson, a 150-cow dairy producer in Mississippi said he supported bringing back the previous ‘higher of’ method while a longer-term solution can be considered through the USDA hearing process. He noted periodic reviews of the adjuster could also be helpful, and that the situation should be addressed in the short term.
He explained that the Southeast producers across FMMOs 5, 6 and 7, produce about 45% of the annual fluid milk needs of their growing population, and when supplemental milk has to be brought in, those Southeast producers pay the price to get it there. That was very difficult and costly when class pricing inversions happened last year for a prolonged period of time.
Davenport, milking 64 cows in New York observed that the Class I price was aligning better in the past few months, but “we’re not out of the woods yet,” on Covid-19, he said.
“The FMMO system has served farmers well but needs adjusted to reflect current product mixes and market swings,” said Davenport, adding that the fluid market is very important for smaller sized dairies and regional supply systems. He proffered the hope that Class I, long-term, could be stabilized by basing it on something other than the volatility of cheese, butter and powder prices.
“The rulemaking process USDA uses will work, it just takes time,” he said, adding that the Class I price should reflect how hard it is to supply the fluid market.
Zuiderveen, whose family has dairies totaling 15,000 cows in Iowa and South Dakota, said FMMO pricing for milk of the same quality should align and foster innovation and competition instead of consolidation. It should also be transparent and promote a nimble industry that can respond to changes, she said.
“Distortions can cause the system to become unglued,” she said, noting that if producers can’t anticipate which classes will participate in the pool and don’t know how that will drive their milk price, then they can’t manage their price risk effectively, losses become compounded, and this discourages risk management.
Zuiderveen and others noted a variance as wide as $9 per hundredweight was experienced in mailbox milk prices from region to region and neighbor to neighbor at intervals last year.
“That creates a sense of helplessness among producers,” said Zuiderveen.
Dr. Wolf noted multiple reasons for the negative PPDs and milk check losses under the new formula, including declining Class I fluid milk sales and increased milk components, but said the two biggest reasons for milk check losses under the new formula compared with the old formula were the large volumes of de-pooled milk that reduced FMMO pool funds as well as the Class I change itself.
Wolf explained multiple factors in the wide divergence between Class III and IV. A primary one was government purchases being tilted to cheese during that time. “This large divergence in butter and cheese prices meant that the Class I milk prices were lower than they would have been under the former pricing rule,” he said.
Ferguson noted that the government cheese purchases were intended to support dairy producers as well as the public during the pandemic, but it ended up having a “devastating effect on our fluid market,” he said, noting that a more balanced approach may have helped.
Through difficult times in the past, price alignments were more stable in large part because of the ‘higher of’ method keeping the Class I price above the blended price so no matter what was purchased, all farmers, supplying all classes of products, benefited more equitably.
Under the current formula, the pandemic cheese purchases helped support dairy producers, but also led to distortions that contributed to large differences in milk prices at the farm level.
Dr. Wills was the only processor testifying. He said the survival of dairy depends on being able to evolve on these pricing issues. “Farmers are only better off if the premium (shared in the FMMO pools) exceeds the value of other classes, and that’s inefficient,” he said, adding his opinion that FMMOs have outlived their purpose.
“The redistribution makes it appear that all farmers are winners, when the evidence shows pricing equity is being lowered,” said Wills. “I fear for the future of the dairy industry. The federally administrated milk pricing now functions opposite of its intent, resulting in higher prices for consumers and lower prices for farmers. It responds slowly, encourages inefficient trucking and promotes consolidation.”
Wills also mentioned the wave of competition from an array of plant-based and blended products as well as cellular agriculture and bio-engineered analog proteins, none of which are included in the FMMO pricing structure.
Wills brought home the reality for rural communities when small and mid-sized farms are lost. Near the end of the hearing, he responded to a question from Senator Roger Marshall (R-Kansas) asking what are his farmers’ biggest concerns, what do they talk about when he sits down with them for coffee at a restaurant?
“My farmers tend to be smaller producers,” said Wills, president of two Wisconsin cheese companies supplied by 28 dairy farms. “They are concerned about having continued access to markets as the industry continues to consolidate. Even in Wisconsin, where we have more competition than most places, it is hard to find homes for those dairies that are cut loose from big plants.”
As consolidation accelerates, he said, there is a trend toward plants not wanting to make multiple stops. “The impact of losing all of those producers … that 10% per year loss (over time) just hollows out our communities. There’s not a restaurant in town anymore to have coffee at,” said Wills. “We lost our hardware store, our grocery store. A lot of it has to do with our rural communities being hollowed out. The ability to maintain those small farms is also important for our communities.”
On program safety nets and risk management tools, Dr. Wolf noted that the Dairy Margin Coverage program has a very positive impact on small producers vs. large producers, and that the Dairy Revenue Protection and Livestock Gross Margin are aimed at bigger farms. He said farms with those programs in place were “in a better place” last year.
However, elsewhere in his testimony and in that of others, the risk management difficulties during the unusual price inversions were also mentioned, when the Class I pricing change was exacerbated by pandemic disruptions creating those misaligned conditions.
As for simply nationalizing the FMMO pooling rules or making them more rigid, Zuiderveen said this would lead to more processors staying out of the pool, and Wills said de-pooling is the pressure relief valve processors need.
With a nod to pricing delays that affect the transparency in sending market signals through the FMMO system, Wills said he found out that week (Sept. 13) what he will be paying for the milk he bought on August 1, and his producers who sold that milk to him were also just finding out what they would be paid. That’s six weeks after shipping the milk.
Wills said this kind of inefficiency makes it difficult to plan and compete in business.
Another positive to come out of the hearing was when Davenport brought up legalizing whole milk in schools, to which Chairwoman Gillibrand, Senator Marshall, a doctor, and a few other members of the Senate Subcommittee gave hearty verbal support.
Eligible producers to be paid by agreements with milk handlers, co-ops
By Sherry Bunting, Farmshine, August 27, 2021
WASHINGTON, D.C. — According to USDA, milk handlers and cooperatives were contacted Aug. 23-27 about entering into signed agreements to distribute the approximately $350 million in Pandemic Dairy Market Volatility Assistance payments the agency announced on Aug. 19.
The agreements will be to disburse funds to their qualifying producers and provide them with education on a variety of dairy-related topics.
Handlers and cooperatives have until Sept. 10, 2021 to indicate to USDA their intention to participate. USDA will then distribute the payments to participating handlers within 60 days of entering into an agreement. Once payment is received, a handler will have 30 days to distribute monies to qualifying dairy farmers.
These funds will be disbursed to “eligible” dairy farmers through “eligible” Federal Milk Marketing Order (FMMO) independent milk handlers and cooperatives, not through FSA. There will be no signups for this program, and payment rates have not been published.
What is unique about the volatility payments is they will be producer-specific and targeted based on FMMO records and agreements with milk handlers to be the payment conduit.
USDA indicates this program is a “first step” and is aimed at compensating producers for volatility and federal pricing policy changes. The payments will cover 80% of the calculated lost value on Class I fluid milk pounds for July through December 2020.
This language suggests the payments will be limited to producers whose milk was pooled on FMMOs during those six months.
One point of contention with the “volatility assistance” is that the eligible producers will be limited to payments associated with up to 5 million pounds of annual production — even though farms of all sizes incurred these losses due to a combination of pandemic volatility and federal pricing policy changes. The Adjusted Gross Income verification will also be required, like for the prior administration’s CFAP payments.
A special webpage at the USDA AMS Dairy Programs website has been created where more details were provided this week. Officials responding to Farmshine questions said this webpage will be updated on an ongoing basis with more details as they become available. The webpage link is https://www.ams.usda.gov/services/pandemic-market-volatility-assistance-program
The actual cumulative net Class I value losses to dairy producers over a longer 27-month period (May 2019 through July 2021) were more than twice the amount of the program, pegged at over $750 million.
During the six months covered by the volatility assistance program – July through December 2020 – the difference between Class III and IV milk prices was $5 to $10 per hundredweight. Further amplifying the impact of this volatility on producer blend prices was the 2018 Farm Bill change (implemented May 2019) to use an averaging method instead of the previous ‘higher of’ Class III or IV skim prices to set the Class I ‘mover.’
This change also led to massive de-pooling and severely negative producer price differentials (PPDs) for most of the past 27 months. Even in some of the positive PPD months, the PPDs were smaller than normal, representing lost value to producers in excess of $3 billion.
In disbursing these volatility assistance payments, milk handlers and cooperatives will be reimbursed for limited administrative and educational costs, according to the USDA brochure.
The education piece stipulates that each participating handler or cooperative “will provide educational materials to all producers by March 1, 2022. The USDA brochure indicates that they may provide the education in the form of mailings, recorded online trainings, live virtual webinars, and/or in-person meetings.”
This education revolves around federal dairy programs, according to USDA. Example topics are Federal Milk Marketing Orders; Dairy Margin Coverage, Dairy Revenue Protection, Dairy Mandatory Price Reporting, Chicago Mercantile Exchange, and Forward Contracting.
USDA will make these education materials available, or the participating handlers and cooperatives may use their own educational materials or training.
Each participating handler will have to verify how many producers were provided with the information and the methods that were used for the education.
The Pandemic Dairy Market Volatility Assistance Program was announced during meetings with farmers and a tour of farms with Senator Patrick Leahy in Vermont last Thursday. Back in June, Agriculture Secretary Tom Vilsack had committed to provide additional pandemic assistance for dairy farmers in an exchange with Sen. Leahy during an Appropriations hearing.
“This (program) is another component of our ongoing effort to get aid to producers who have been left behind and build on our progress towards economic recovery,” said Vilsack. “This targeted assistance is the first step in USDA’s comprehensive approach that will total over $2 billion to help the dairy industry recover from the pandemic and be more resilient to future challenges for generations to come.”
In a press statement this week, NMPF president and CEO Jim Mulhern stated that the $350 million only compensates for some of the damage resulting from the pandemic.
“NMPF asked the department to reimburse dairy farmers for unanticipated losses created during the COVID-19 pandemic by a change to the Class I fluid milk price mover formula that was exacerbated by the government’s pandemic dairy purchases last year,” said Mulhern. “When Congress changed the previous Class I mover, it was never intended to hurt producers. In fact, the new mover was envisioned to be revenue-neutral when it was adopted in the 2018 Farm Bill. However, the government’s COVID-19 response created unprecedented price volatility in milk and dairy-product markets that produced disorderly fluid milk marketing conditions that so far have cost dairy farmers nationwide more than $750 million from what they would have been paid under the previous system.”
NMPF and IDFA suggested and agreed to the Class I pricing change during 2018 Farm Bill negotiations, and no hearings were held before the FMMO method for calculating the ‘mover’ was implemented in May 2019.
Mulhern went on to say that the arbitrary low limits on covered milk production volume mean many family dairy farms will only receive a portion of the losses they incurred on their production last year.
“Disaster aid should not include limits that prevent thousands of dairy farmers from being meaningfully compensated for unintended, extraordinary losses,” Mulhern said, adding that NMPF is “continuing discussions about the current Class I mover to prevent a repeat of this problem.”
For its part, the American Dairy Coalition has been facilitating nationwide discussions with other dairy groups on the dairy pricing, de-pooling, negative PPD losses and risk management impacts since last winter, including a letter signed by hundreds of dairy producers and organizations sent last spring to NMPF and IDFA seeking a seat at the table on solutions for the concerns about the Class I ‘mover’ change and supporting a temporary return to ‘the higher of’ until other methods can be appropriately vetted with a hearing process.
ADC’s nationwide discussions brought attention to this issue and contributed to Senator Kirsten Gillibrand and 20 other U.S. Senators sending a letter to Agriculture Secretary Tom Vilsack seeking financial assistance for dairy farmers for these milk price value losses. A dairy situation hearing is anticipated in the Senate Subcommittee on Dairy, Livestock and Poultry that is chaired by Sen. Gillibrand.
— In addition, USDA announced on Aug. 19 an estimated $580 million in Supplemental Dairy Margin Coverage (DMC) to allow “modest increases” in the production history of enrolled dairy producers up to the 5 million pound annual production cap for Tier One coverage. Specific details for adjusting DMC production history have not yet been provided.
— Additionally, USDA announced the inclusion of premium alfalfa prices in the calculation of the feed cost portion of the DMC margin.
By Sherry Bunting, both parts of a two-part series in Farmshine, July 2021
The dairy industry continues to wait for USDA to provide details on three areas of dairy assistance already approved by Congress or mentioned as “on the way” by Ag Secretary Tom Vilsack.
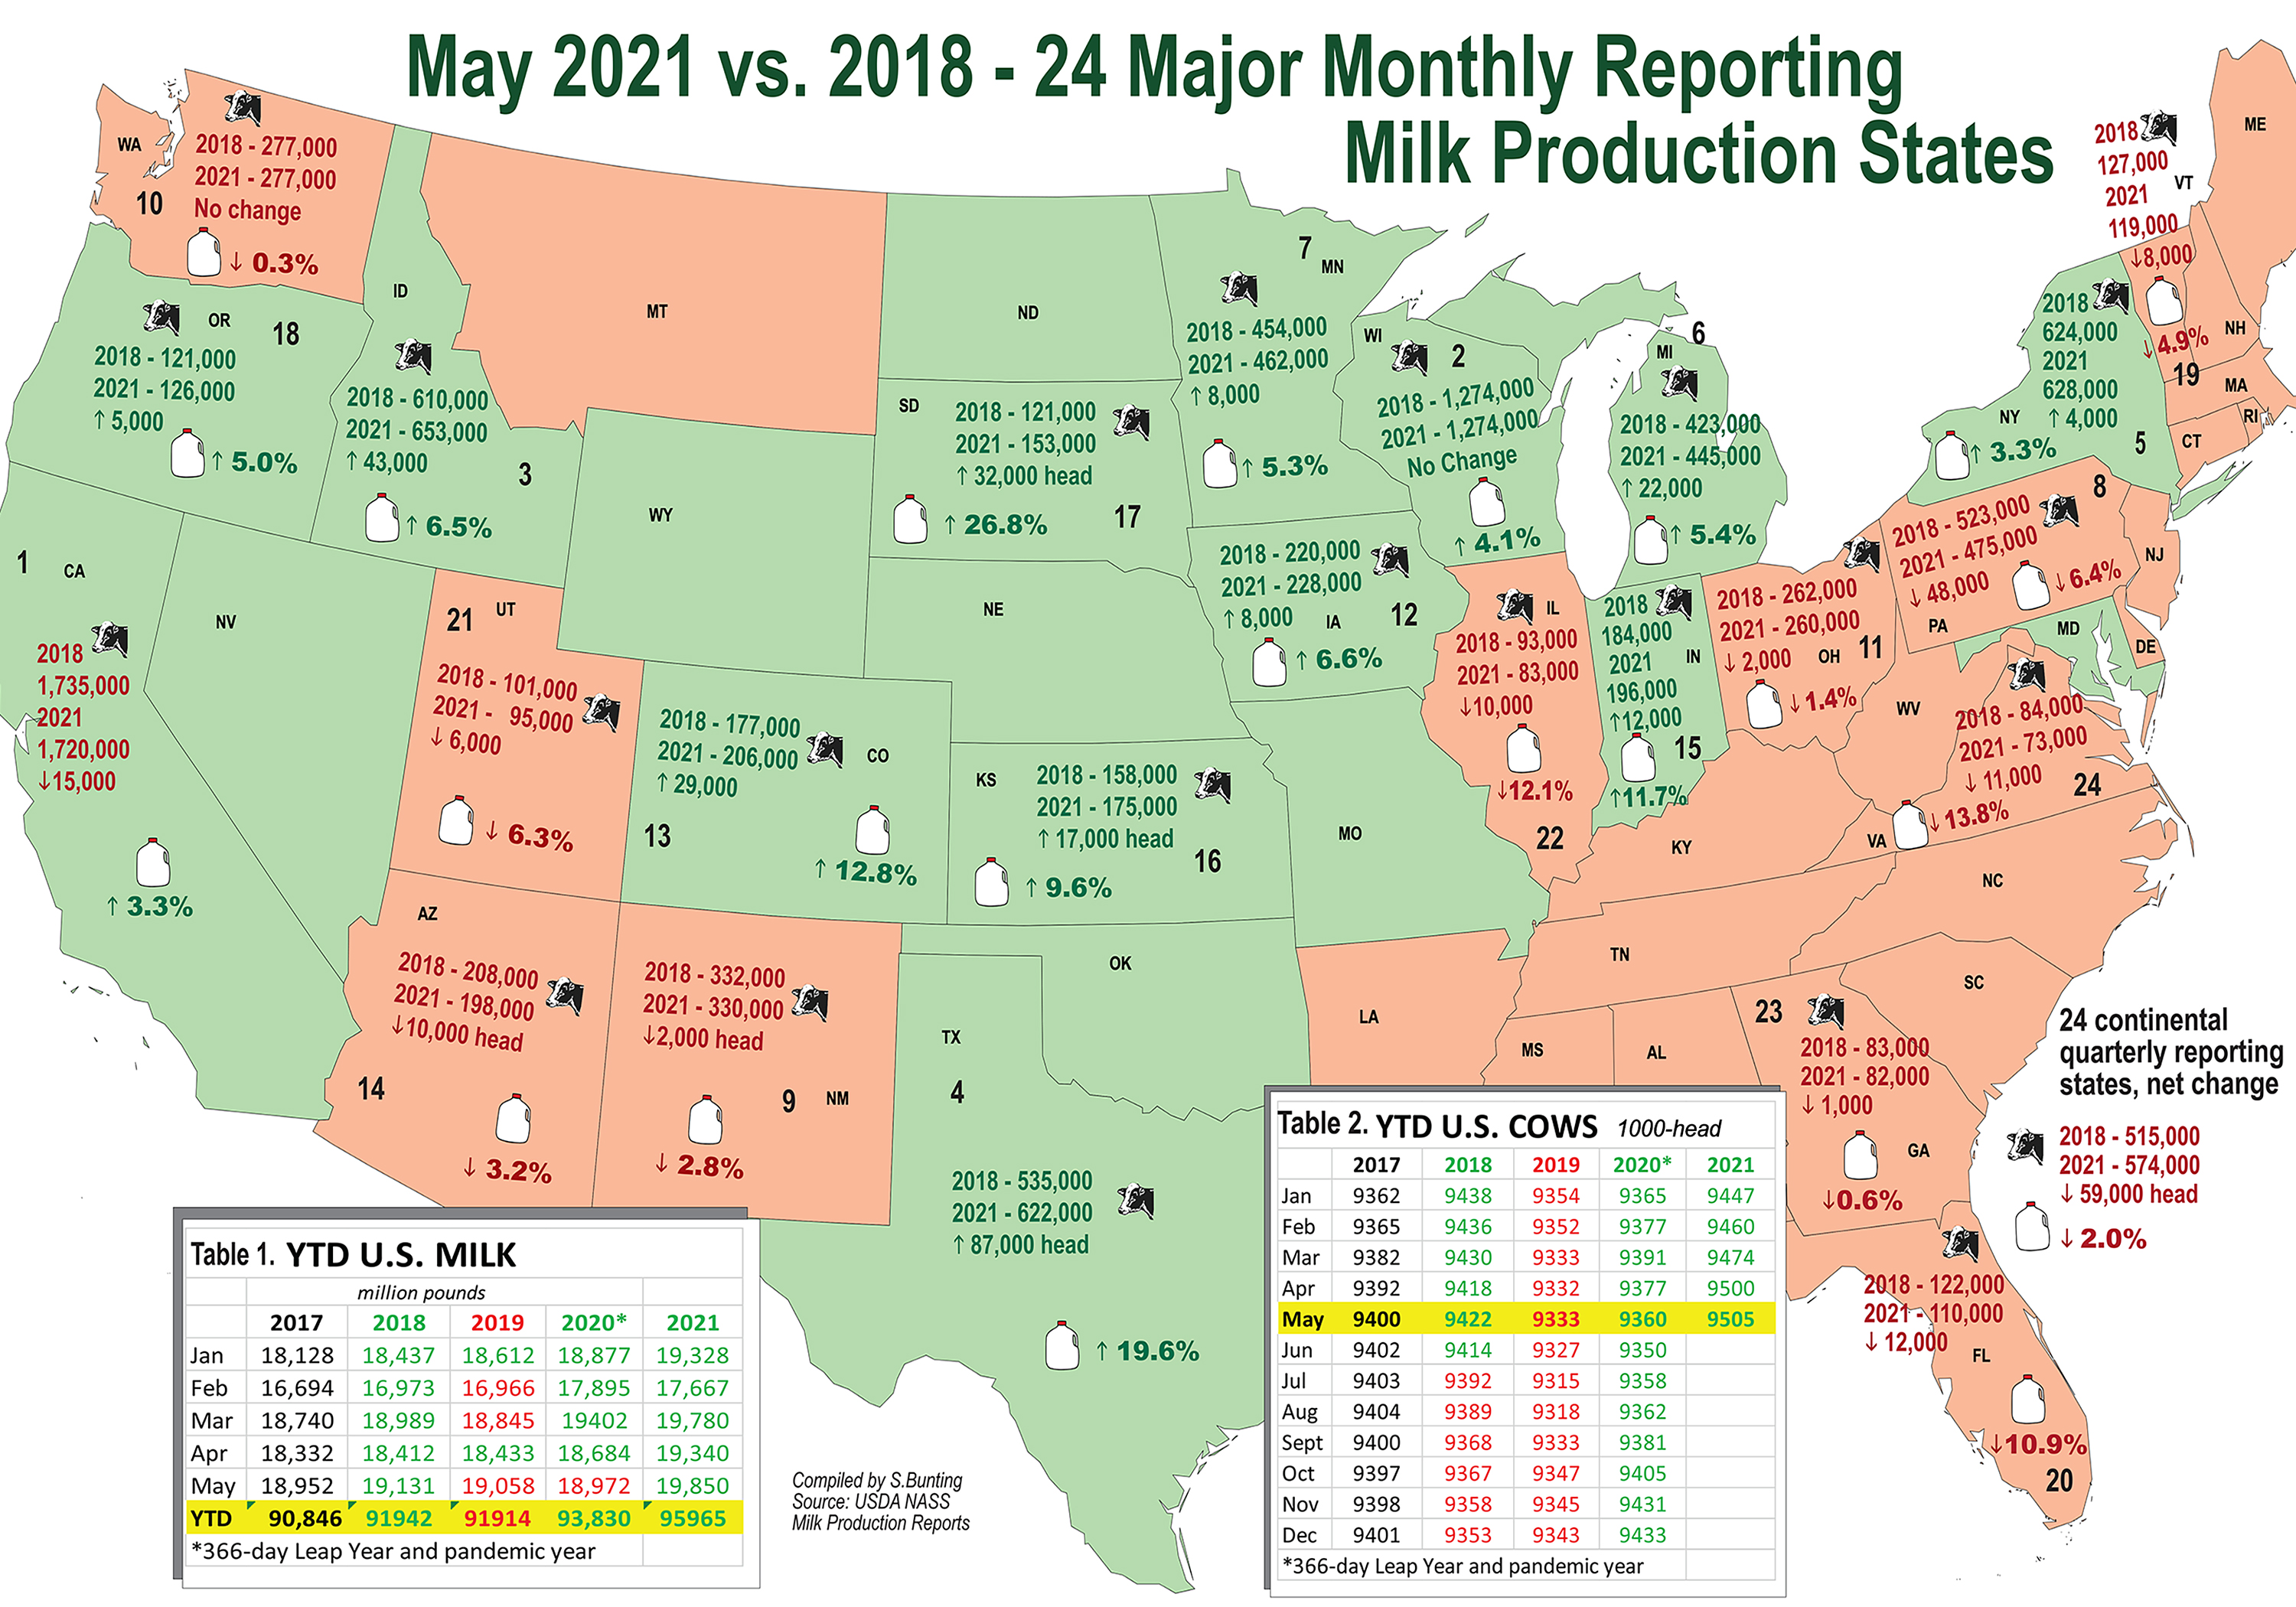
The fly in the ointment, however, is the record-high 2021 milk production (Table 1) and accelerated growth in cow numbers (Table 2) at a pace the recent USDA World Agriculture Supply and Demand Estimates (WASDE) expect to continue into 2022.
USDA is reportedly looking at production reports — up vs. year ago by 1.9% in March, 3.5% in April, 4.6% in May — to determine how to assist without adding fuel to expansion that could threaten late 2021 milk prices in the face of rising feed costs and a worsening western drought. (The latter two challenges could temper those forecasts in future WASDEs.)
May milk production a stunner
U.S. milk production totaled 19.9 billion pounds in May. This is a whopping 4.6% increase above 2020 and 2018 and a 4.1% increase over May 2019.
Let’s look at year-to-date. For the first five months of 2021, milk totaled 96 billion pounds, up 2.3% vs. the 93.8 billion pounds for Jan-May of 2020, and it is 4.4% greater than the 91.9 billion pounds of Jan-May milk produced in pre-pandemic 2018 and 2019. Of the four years, only 2020 had the extra production day as a Leap Year.
Milk per cow was up 3% over year ago in May. Compared with 2019, output per cow is up 2.2%, according to USDA.
Cow numbers vs. 2018 tell the story
Milk cows on U.S. dairies in May 2021 totaled 9.5 million head, up 145,000 from May 2020’s 9.36 million, up 172,000 from 2019’s 9.33 million, and up 83,000 head from 2018’s 9.42 million.
Counter to the national trend, Pennsylvania had 48,000 fewer milk cows than May 2018 — dropping 30,000 into 2019; 10,000 into 2020, and 8,000 into 2021.
Elsewhere in the Northeast and Southeast milksheds, among the 24 major monthly-reported states, New York had 4000 more milk cows in May 2021 than 2018, Vermont 8000 fewer. Georgia dropped 1000, Florida 12,000, and Virginia 11,000. In the Central states, Illinois was down 10,000 head.
The total decline in cow numbers for the 24 lesser quarterly-reported states, the collective loss in cow numbers is 59,000 head from May 2018 to May 2021
Accelerated growth is coming from three key areas where major new processing assets have been built or expanded.
In the Mideast, where the new Glanbia-DFA-Select plant became fully operational in Michigan this spring, there is a net gain of 32,000 cows for 2021 vs. 2018, Ohio’s cow numbers that had been declining 2018-19, began recovering in 2020-21. Indiana had 18 months of substantial growth, and Michigan returned to its growth pattern in 2020. Taken together, the Indiana-Ohio-Michigan region had a loss of 8,000 cows heading into 2020, but gained a whopping 40,000 cows over the past year.
In the Central Plains, where new plant capacity is starting up this spring and summer — Minnesota, South Dakota and Iowa, combined, added 40,000 cows May 2018 to May 2021.
In the Southern Plains, where joint-venture processing capacity continues to grow, Texas has continued full-steam-ahead, gaining 87,000 cows from 2018 to 2021, along with 29,000 added in Colorado and 17,000 in Kansas. New Mexico regained earlier losses to be 2000-head shy of 2018.
The growth patterns in these regions somewhat mirrored dairy exits from other areas — until Jan. 2020 (Table 2). The past 17 consecutive months of year-over-year increases in cow numbers leave the U.S. herd at its largest number in 26 years (1995).
However, the assumption that ‘dairy producers are okay because the industry is expanding’ ignores several essential factors. The playing field has become more complicated and inequitable. There are four main factors at play. We’ll look at them one at a time.
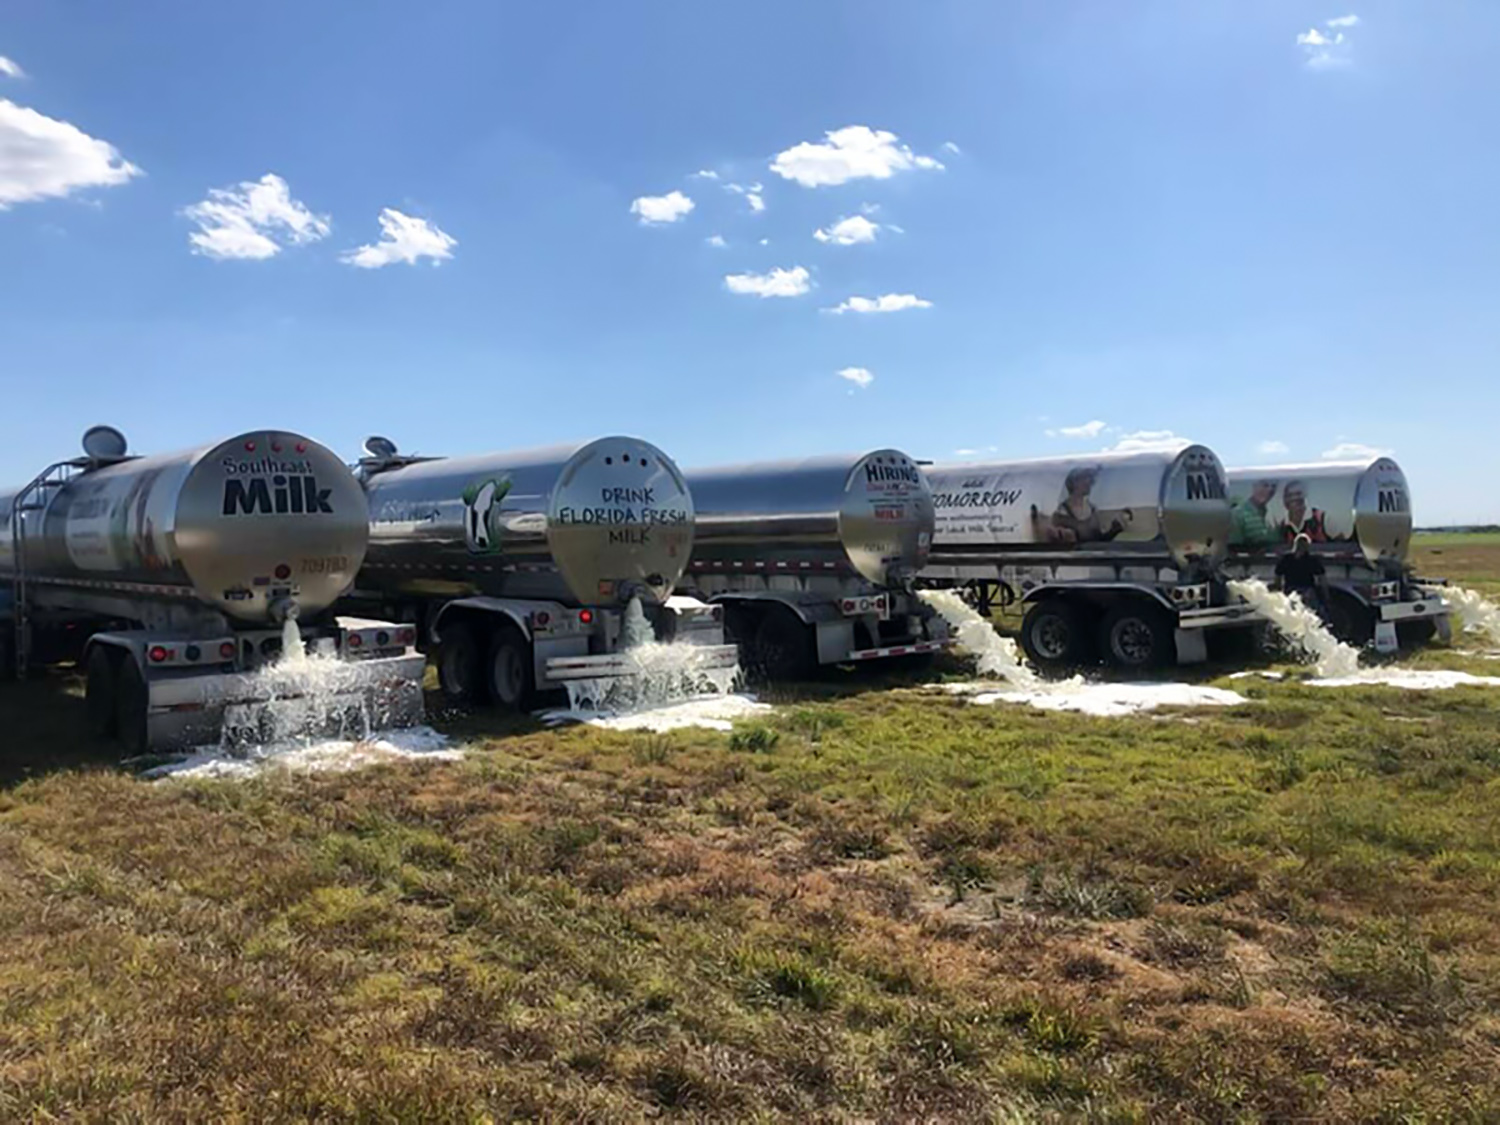
Ben Butler of South Florida posted this photo that went viral on Twitter April 2, 2020 of milk being dumped in Florida because there was no home for it. A few days later, he tweeted photos of milk gallons also being donated to Palm Beach County families in need. Challenges abound in the dairy supply chain. The unofficial tally of milk dumped in the Northeast and Mid-Atlantic region the first week of April 2020 was north of 200 loads, with additional reports of 130 loads dumped in the Southeast. Meanwhile, stores were not well stocked, most were limiting purchases and foodbanks were getting more requests as over 10 million people were newly out of work.
Factor #1 — Milk dumping and base programs
A year ago in April and May 2020 — at the height of the Coronavirus pandemic disruptions — the dairy industry saw dumping of milk, stricter base programs and bigger milk check deductions. Producers culled cows, dried cows off early, changed their feeding programs, even fed milk in dairy rations.
But milk production still grew, according to the USDA data.
Some cooperatives and milk buyers, like Land O’Lakes, had base programs already in place and triggered them. Others made changes to prior programs or implemented new ones.
Dairy Farmers of America — the nation’s largest milk cooperative, largest North American dairy processor and third-ranked globally by Rabobank — quickly implemented a new base program in May 2020, seeking 10 to 15% in production cuts from members, varying by region, with overage priced on ‘market conditions.’
It is difficult to assess the ‘equity’ in these base programs and the cross-layers among producers between and within regions, or to know how these ‘bases’ are being handled presently. When questioned, spokespersons say base decisions are set by regional boards.
Meanwhile, product inventory and pricing schemes affect all regions, and milk rides between FMMOs in tankers and packages — with ease.
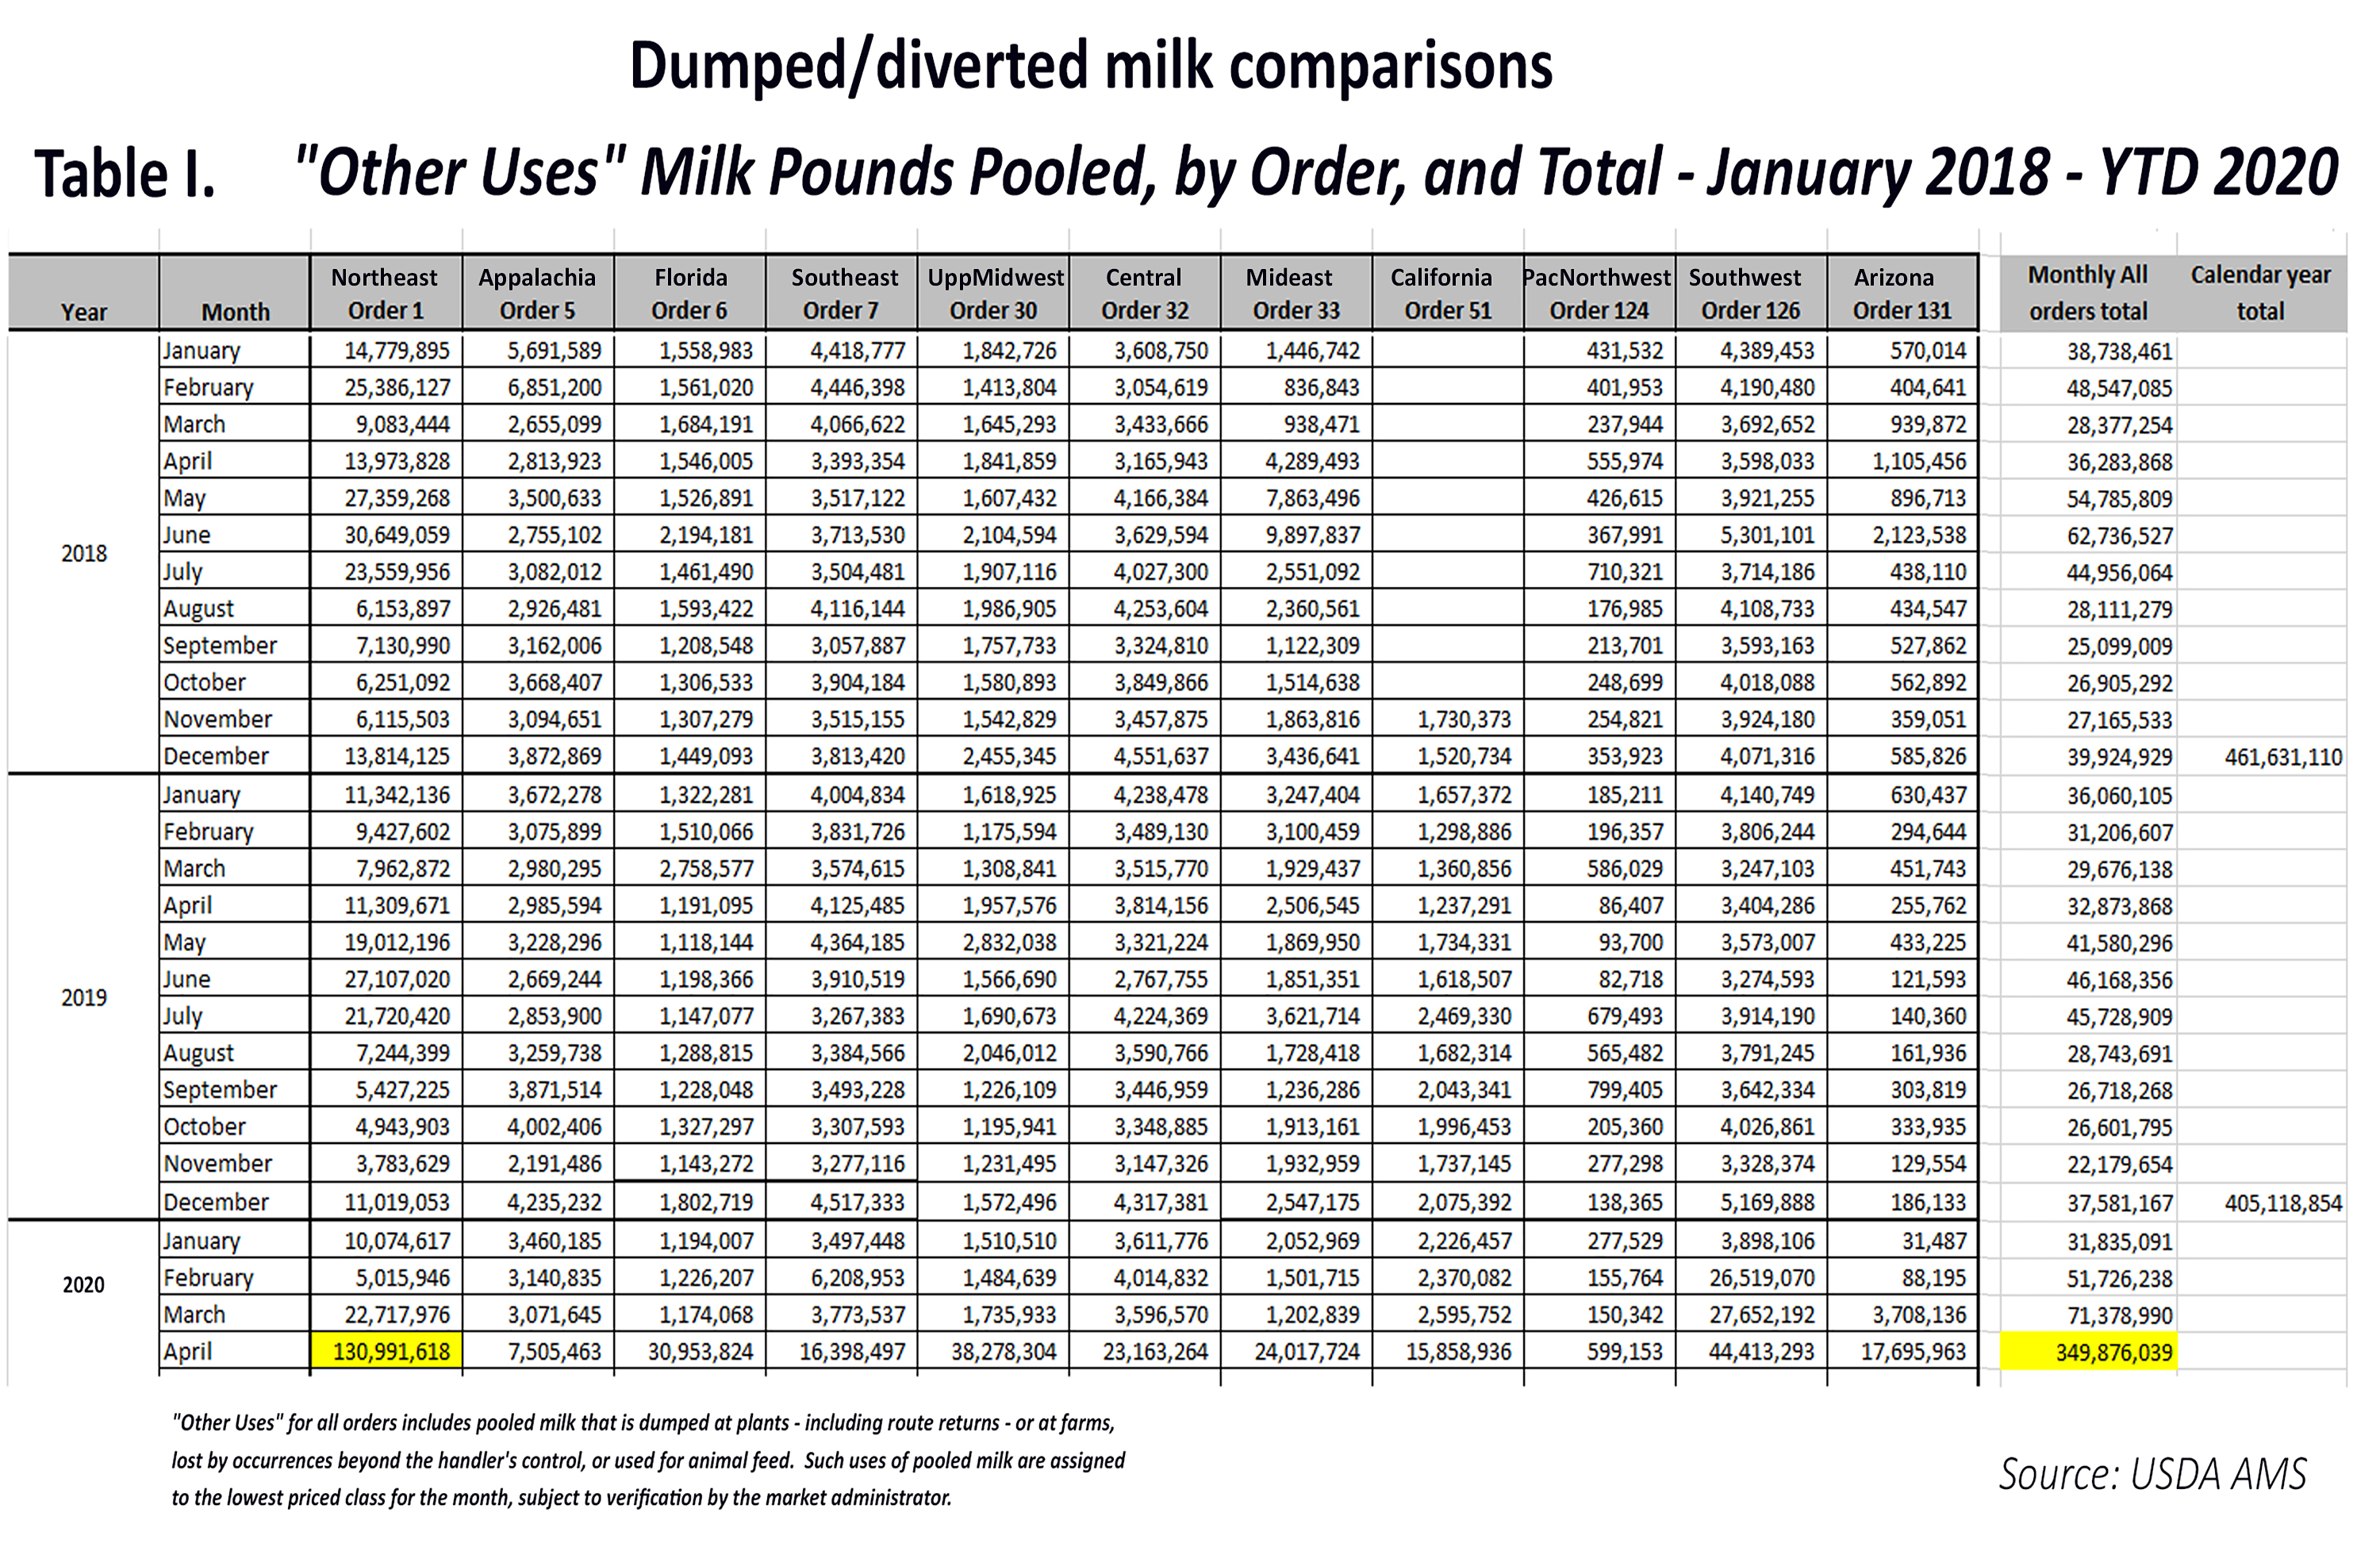
According to USDA, the 11 FMMOs dumped and diverted 541 million pounds of milk pooled as ‘other use’, priced at Class IV, during the first five months of 2020, of which 350 million pounds were in April alone. This is more than three times the ‘other use’ milk reported by FMMOs during the first five months of pre-pandemic 2019 (171.4 million pounds). By June, the amounts were double previous years.
Of this, the largest amount, by far, was the 181 million pounds of ‘other use’ milk in the Northeast FMMO 1 during Jan-May 2020, comprising one-third of all the dumped and diverted milk pooled across all 11 FMMOs in that 5-month period.
In the Southeast milkshed, the Appalachian, Florida and Southeast FMMOs 5, 6 and 7, together pooled 88 million pounds of ‘other use’ milk in the first five months of 2020. The Southwest FMMO 126 had 106.2 million pounds of ‘other use’ milk; Upper Midwest FMMO 30 had 46.1 million pounds; Central FMMO 32 had 36.7 million pounds; Mideast FMMO 33 had 30.7 million pounds; California FMMO 51 had 28.9 million pounds; Arizona FMMO 131 had 21.7 million pounds; and Pacific Northwest FMMO 124 had 1.3 million pounds.
The dumping had begun the last week of March 2020 and was heaviest in the month of April. Producers also saw deductions as high as $2/cwt. for balancing costs, lost quality premiums, and increased milk hauling costs. Unaccounted for, were the pounds of milk that had reportedly been dumped on farms without being pooled on FMMOs.
All of this against a backdrop of pandemic bottlenecks and record-high March-through-August imports of butter, butteroil, milkfat powder, and blends — adding to record-high U.S. butter inventories and contributing to the plunging Class IV, II and I prices vs. Class III (PPD).
Meanwhile, not only did production growth in key areas move ahead, so did strategic global partnerships. Just one puzzling example in October 2020, after eight months of deflated producer milk checks, depressed butterfat value, burdensome butter inventory, record butterfat imports, and a plunging Class IV milk price that contributed to negative producer price differential (PPD) losses, Land O’Lakes inked a deal to market and distribute cooking creams and cream cheeses — Class II and IV products that use butterfat — from New Zealand’s Fonterra into United States foodservice accounts.
The New Zealand press reports were gleeful, citing this as a big breakthrough that could be followed by other of their cheeses entering the “huge” U.S. foodservice market through the Land O’Lakes distribution.
Factor #2 — Class price wars and de-pooling
As reported in Farmshine last summer, dairy farmers found themselves in uncharted waters. As Class IV prices tumbled from the get-go with all of the ‘other use’ dumping and diverting, butter inventory building as butter/powder plants tried to keep up with diverted loads at a disruptive time, the USDA Food Box program started drawing products in the second half of May, and really got going by July 2020.
Cheese, a Class III product, was a big Food Box winner. The cheese-driven Class III milk price rallied $7 to $10 above Class IV, and massive volumes of milk were de-pooled by Class III handlers, which has continued through May 2021.
Reviewing the class utilization reports, an estimated 80 billion pounds of Class III milk normally associated with FMMOs has been de-pooled over the past 26 months.
At the start of this ‘inequitable’ situation, academic webinars sought to explain it.
“We’re seeing milk class wars,” said economist Dan Basse of AgResource Company, a domestic and international ag research firm in Chicago, during a PDPW Dairy Signal webinar a year ago.
He noted that under the current four-class pricing system, and the new way of calculating the Class I Mover, dairy farmers found themselves “living on the edge, not knowing what the PPD (Producer Price Differential) will be” (and wondering where that market revenue goes).
“A $7.00 per hundredweight discount is a lot of capital, a lot of income and a lot of margin to lose with no way to hedge for it, no way to protect it, when the losses are not being made up at home as reflected in the PPD,” Basse said in that summer 2020 webinar.
What does this have to do with year-over-year milk production comparisons?
Two words: Winners. Losers.
Some handlers, and producers won, others lost — between and within regions.
Here’s why all of this matters from a production comparison standpoint: Dairy economists — Dr. Mark Stephenson, University of Wisconsin, and Dr. Marin Bozic, University of Minnesota — are both on record acknowledging that USDA NASS uses FMMO settlement data, along with producer surveys, to benchmark monthly milk production.
So, on the one hand: How accurate are these data for comparison over the past 26 months, given the inconsistent FMMO data from dumping, diverting and de-pooling?
On the other hand: Did the negative PPDs and de-pooling, resulting in part from the 2018 Farm Bill change in the Class I Mover, allow Class III handlers to capture all of that additional market value and use it to fuel the 2020-21 accelerated milk growth for regions and entities connected to the new Class III processing assets?
Factor #3 — New dual-processing concentrates growth
Accelerated growth in cow numbers is fueling record production in 2021. It is patterned around ‘waves’ of major new processing investments in some areas, while other areas — largely fluid milk regions — are withering on the vine or growing by smaller margins with fewer cows.
In the 24 major milk states, production growth was even greater than the All-U.S. total — up 4.9% vs. year ago. In part one, the breakdown was shown vs. 2018.
Here’s the breakdown for just the 12 months from May 2020 to May 2021 — a time in which the industry dealt divergences that created steep losses for some and big gains for others, while FMMOs became dysfunctional.
In just one year, over 40,000 cows were added in Indiana, Ohio, and Michigan, combined, and milk production was up in May 2021 by 12.6, 3.2 and 5.1%, respectively. The draw is the massive new Glanbia-DFA-Select joint-venture cheese and ingredient plant that began operations late last year in St. Johns, Michigan. Sources indicate it reached full capacity this spring. Add to this the 2018 Walmart fluid milk plant in Fort Wayne, Indiana and other expansions in Ohio and Michigan.
Ditto for the Central Plains, where new cheese and ingredient line capacity became operational this spring and summer. Supplying these investments, Minnesota grew production 6%, South Dakota 14.6%, and Iowa 6.2% over year ago.
Number two Wisconsin grew by 5.6% in May 2021 vs. year ago.
Milk production was up 5% in number one California, even though cow numbers were down by 1000 head, and dairy farmers in a referendum voted recently by a slim margin to keep their quota system. They are also dealing with a devastating drought that news reports indicate is now impacting both the dairies and the almond growers.
Then there’s Texas, where growth continues to be a double-digit steamroller, up 10.8% in May 2021 vs. 2020 — pushing New York (up 4.2%) to fifth rank.
The Southern Plains has had several strategic investments, starting in Texas and New Mexico (up 6% vs. year ago).
In Colorado, where production was up 5.3% in May, DFA’s joint ventures and strategic partnerships with Leprino, Kroger and others have fueled growth.
Kansas grew milk production 7.3% vs. year ago. In 2018, a state-of-the-art whole milk powder and ingredient plant became fully operational in Garden City, Kansas. The plant was to be a joint-venture between DFA and the Chinese company Yili but ended up as a joint-venture between DFA and 12 of its member farms that are among the 21 Kansas dairies shipping milk to it.
DFA’s Ed Gallagher gave some insights on this during a May 2021 Hoards webinar. He said, “We went through a period of investing in powder plants in the U.S. It seems like there is a follow-the-leader approach when deciding on investments, and it goes in waves. The industry just completed a wave of a lot of investment in Class IV manufacturing plants, and now… it’s flipping to Class III.”
Looking back on the Class IV ‘wave’ 2013 through 2018, there were several times in those years that Class IV beat Class III, leading to FMMO de-pooling, but not to the extreme extent seen in the past 12 months as Class III now beats all other classes, including Class I, leading to negative producer price differentials (PPDs).
Gallagher sees Class III and IV prices “coming together” in the “next period of years” because the ‘wave’ of capacity investment has flipped from Class IV to III. He predicted more Class III capacity will be added.
Are these past 26 months of PPD net losses for producers the industry’s answer to, in effect, increasing processor ‘make allowances’ without a hearing?
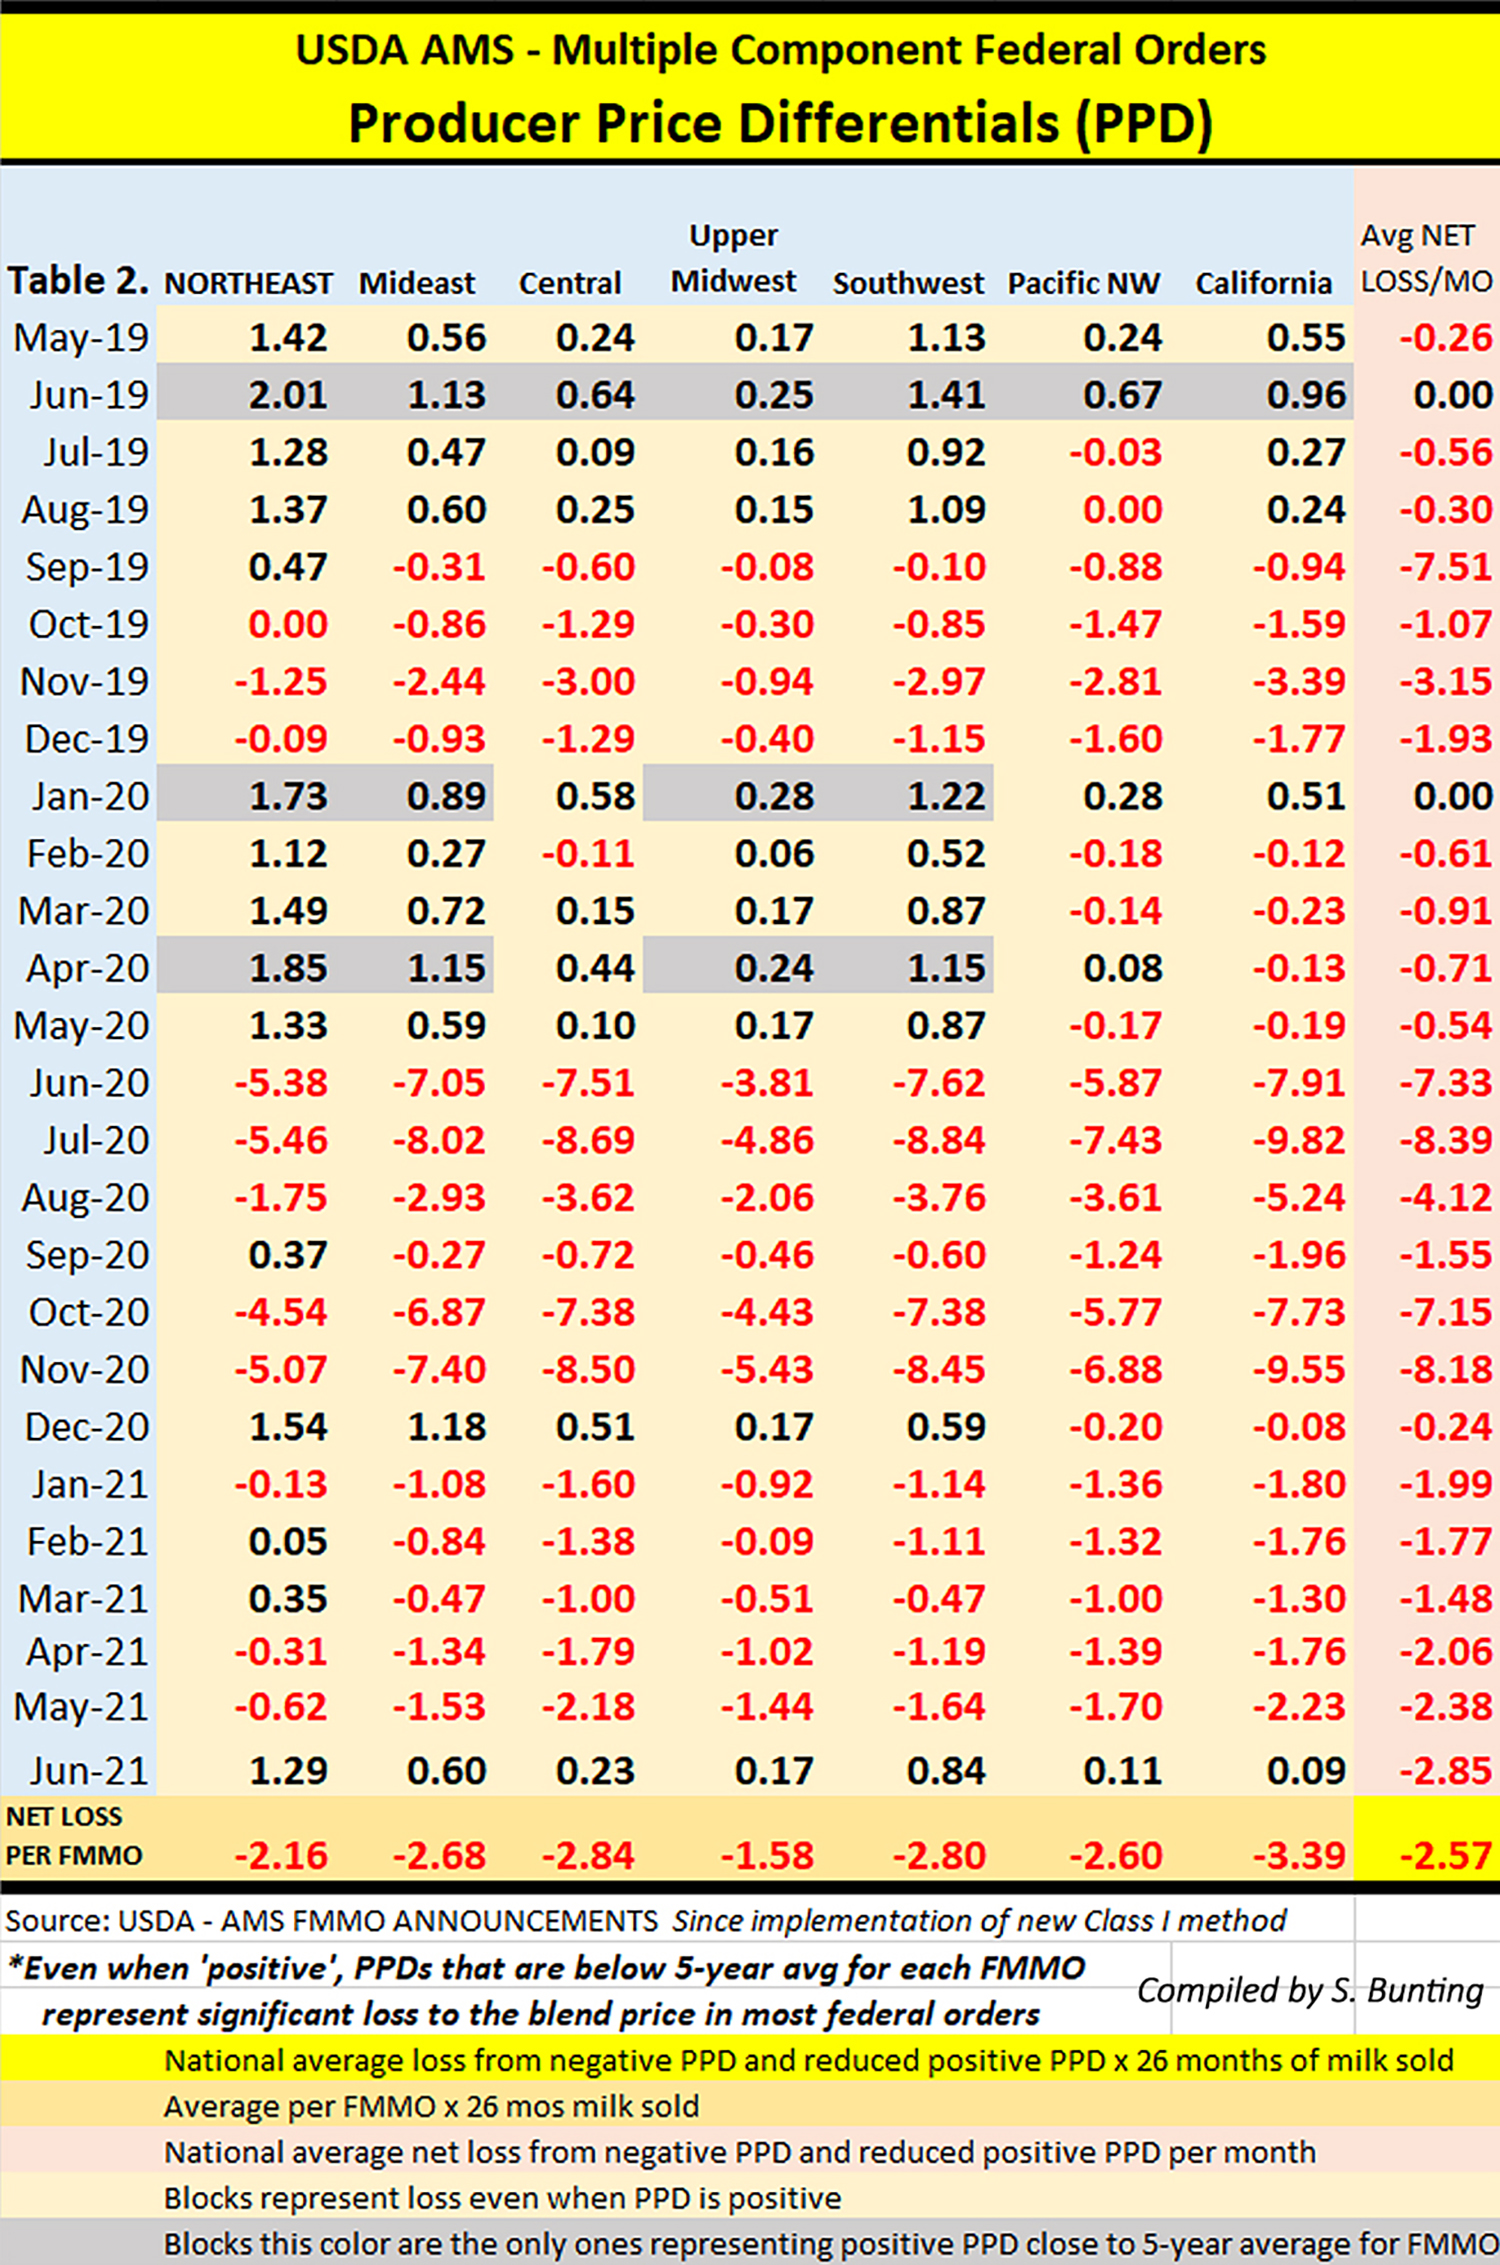
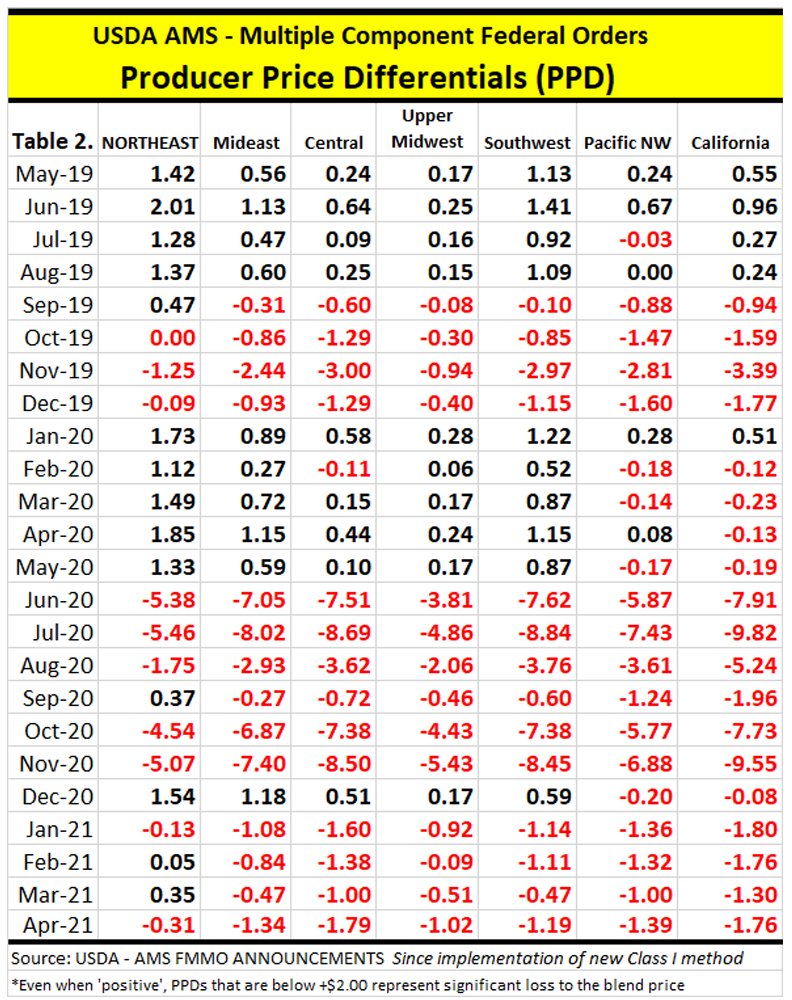
The average PPD value loss (see chart) across the seven multiple component pricing FMMOs was $2.57 per hundredweight for 26 months, which began with implementation of the new Class I pricing method May 2019 through the most recent uniform price announcements for June 2021 milk.
Applying a conservative 5-year average PPD (prior to Class I change) for each FMMO, only the few gray blocks on the chart represent ‘normal.’
This means even positive-PPDs show margin loss for farm milk pooled on FMMOs. In fact, the CME futures markets as of July 14 show August through December divergence between Class III and IV above the $1.48 mark, indicating Class I value loss and negative PPDs or smaller positive PPDs could return after barely a two-month reprieve.
Many handlers that don’t pool on FMMOs also use the uniform prices as a benchmark.
This $2.57 net loss for seven MCP FMMOs across 26 months represents almost a doubling of the current make allowance levels.
Current USDA make allowances and yield factors add up to a processor credit of $3.17 per hundredweight on Class III and $2.17 on Class IV. This already represents 11 to 25% of farm milk value, according to 2018 analysis by John Newton, when he was Farm Bureau’s chief economist.
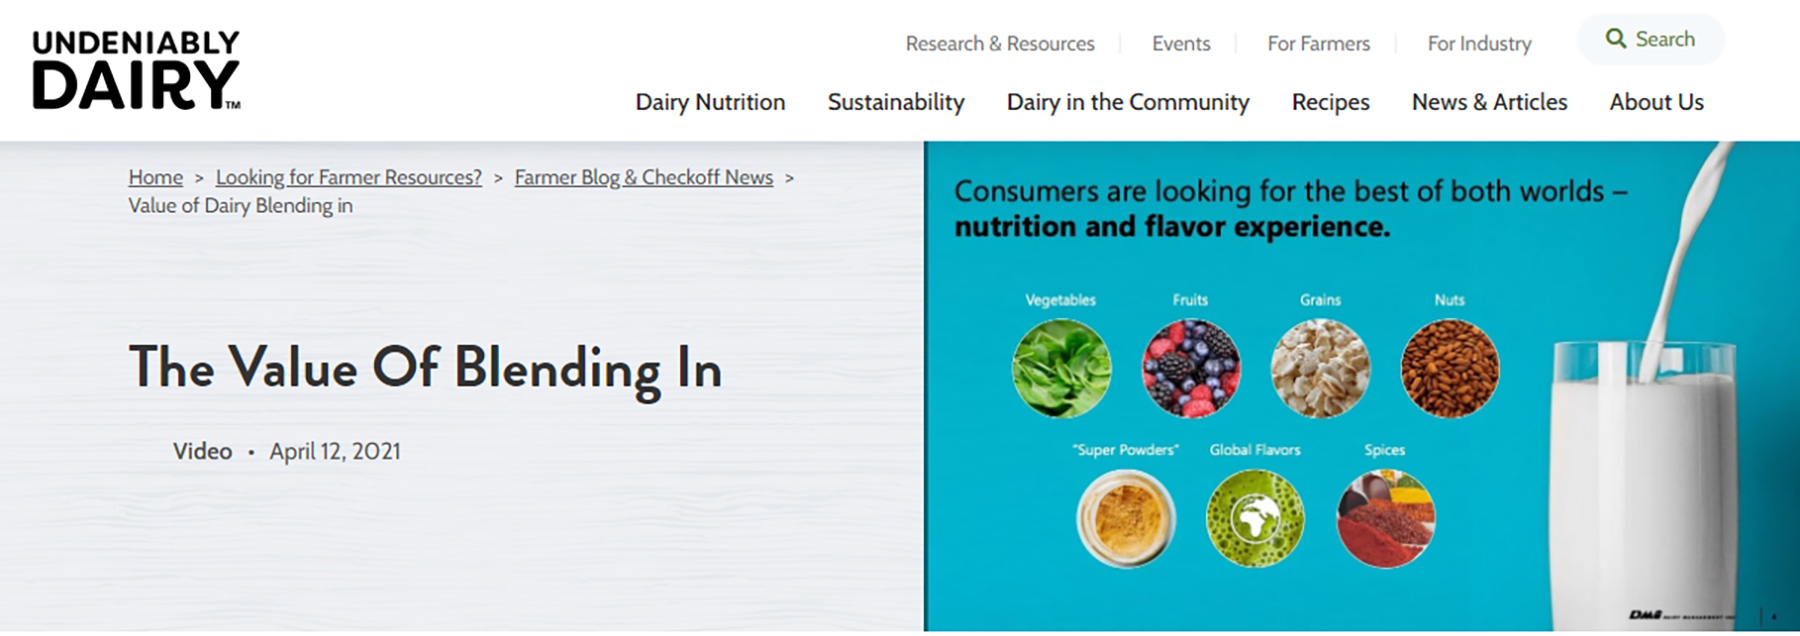
Why is this important? Because we are already seeing additional margin transfer from Class I to Class IV as the industry moves to blended beverages that mostly use ultrafiltered (UF) milk solids. Blends using whey would fall under Class III.
Looking ahead, DFA now owns most of the former Dean Foods’ Class I fluid milk plants since May 2020. New manufacturing synergies are undeniable, considering the direction of dairy checkoff’s fluid milk revitalization plan emphasizing these dairy-based-and-blended beverages and ‘dual-purpose’ processing facilities.
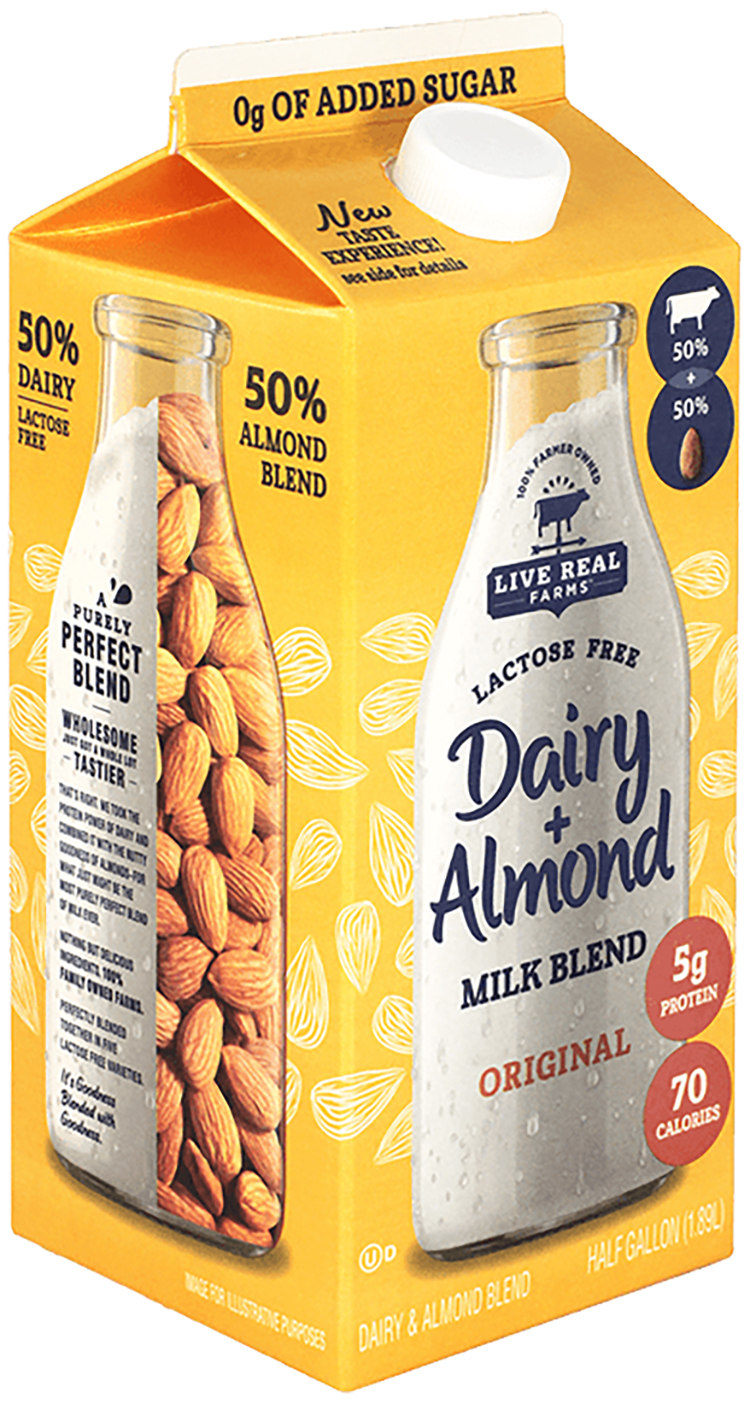
Dairy + Almond is a Live Real Farms beverage made by DFA and was launched through DMI’s Innovation Center with checkoff funds paid by all dairy farmers. The milk in this beverage is not priced as Class I, though it competes in the dairy case and is being promoted as a “Purely Perfect Blend.”
As low-fat UF milk solids are blended with other ingredients in a manufacturing process to make new combined beverages, the result is a competing beverage, and the milk in the beverage drops from Class I to Class IV.
Meanwhile, these beverages cost more at the grocery store, and the ingredients are not part of the USDA end-product pricing ‘circle’. Therefore, no new make allowances should be requested because processors are already getting a reduced class value, and a higher margin.
DMI’ vice president of global innovation partnerships, Paul Ziemnisky, gave some insights into this “future of dairy beverages” — and how it ties into new processing plants investments during the virtual Pennsylvania Dairy Summit in February.
Ziemnisky went so far as to say new processing facilities will “need to be built as beverage plants able to handle all kinds of ingredients” for the blended products of the future. In essence, he said, the future of fluid milk is “dual purpose” processing plants.
DMI’s usdairy.com website touts the checkoff launches of ‘blended’ dairy-‘based’ beverages — key to DMI’s fluid milk revitalization plan. Not flavorings, these blends dilute milk out of Class I, the highest farm-level pricing, and mainly into Class IV, the lowest. The resulting beverages compete in the dairy cooler with Class I fluid milk. Screen view
While 11 of the top 24 states had milk production increases of 5% or more in May, the 13 states with increases below 5%, or negative, are mainly located within traditional Class I fluid milk marketing areas: Florida, up 0.5%, Georgia up 2%, Virginia down 2.3%, Illinois up 1.9%, Arizona, down 0.5%, Washington, down 0.9%, Pennsylvania and Vermont both up 1.8%, and New York up 4.2%.
Idaho and Utah, up 2% and unchanged, are outliers and largely unregulated by FMMOs. Some beverage assets are coming to that region in the form of ultra-filtration and aseptic packaging, including a plant renovation to make Darigold’s FIT beverage. Additionally, a new Fairlife filtration membrane plant was opened near Phoenix, Arizona in March, and Kroger is doing filtration and aseptic packaging in Colorado.
Meanwhile, Pennsylvania is often described as a ‘fluid milk state’ with a Milk Marketing Board setting minimum prices for fluid milk, and a string of independent milk bottlers that figure prominently in their communities.
Ranked fourth in milk production in 2006, Pennsylvania was passed by Idaho in 2007. By 2016, Michigan had pushed Pennsylvania to sixth. The very next year, in 2017, Texas leapfrogged both Pennsylvania and Michigan. Now, Minnesota has pushed the Keystone State to eighth.
How does the future of dairy affect traditionally ‘fluid milk’ states like Pennsylvania, or the Southeast for that matter?
New dairy-‘based’ beverage innovations can be made anywhere and delivered anywhere, often as shelf-stable products. Most are not Class I products unless they meet the strict FMMO definition which was last spelled out in the USDA AMS 2010 final rule.
For now, this also includes the Pa. Milk Marketing Board. Executive secretary Carol Hardbarger confirms that the 50/50 drinks are not regulated under PMMB, which generally uses federal classification, but that a legal interpretation of the Milk Marketing Law with regard to blends may be in order.
The 50/50 blends are already in some Pennsylvania stores and elsewhere in the Northeast, which is the second phase of the ‘undeniably, purely perfect’ marketing plan for fluid milk revitalization.
Factor #4 — USDA, industry coalesce around climate
Ag Secretary Tom Vilsack has been outspoken from the outset about using and aiming every available USDA program dollar in a way that also addresses the Biden administration’s strategies for equity, supply chain resiliency, and climate action.
Speculating a bit as to why USDA is taking so long to announce details about already funded dairy assistance, it could be that Sec. Vilsack is looking at the fit for ‘climate impact.’
Paid around a million a year in dairy checkoff funds to serve 4 four years as CEO of the U.S. Dairy Export Council — between prior and current Ag Secretary posts — Vilsack understands the future plans of the dairy industry’s checkoff-funded proprietary precompetitive alliances on a global scale.
Vilsack has been privy to the DMI Innovation Center’s discussions of fluid milk revitalization through ‘dual purpose’ plants and blended beverages. He is no doubt looking at the accelerating growth in milk production that is occurring right now for ways to tie dairy assistance to measured climate impacts in the net-zero file.
Producers on the coasts and fringes of identified growth areas have a target — fresh fluid milk and other dairy products produced in regional food systems for consumers who have a renewed zeal for ‘local.’ Fresh fluid milk will have to find a path outside of the consolidating system and cut through the global climate-marketing to directly communicate fresh, local, sustainable messages about a region’s farms, animals, environments, businesses, economies, jobs and community fabric.
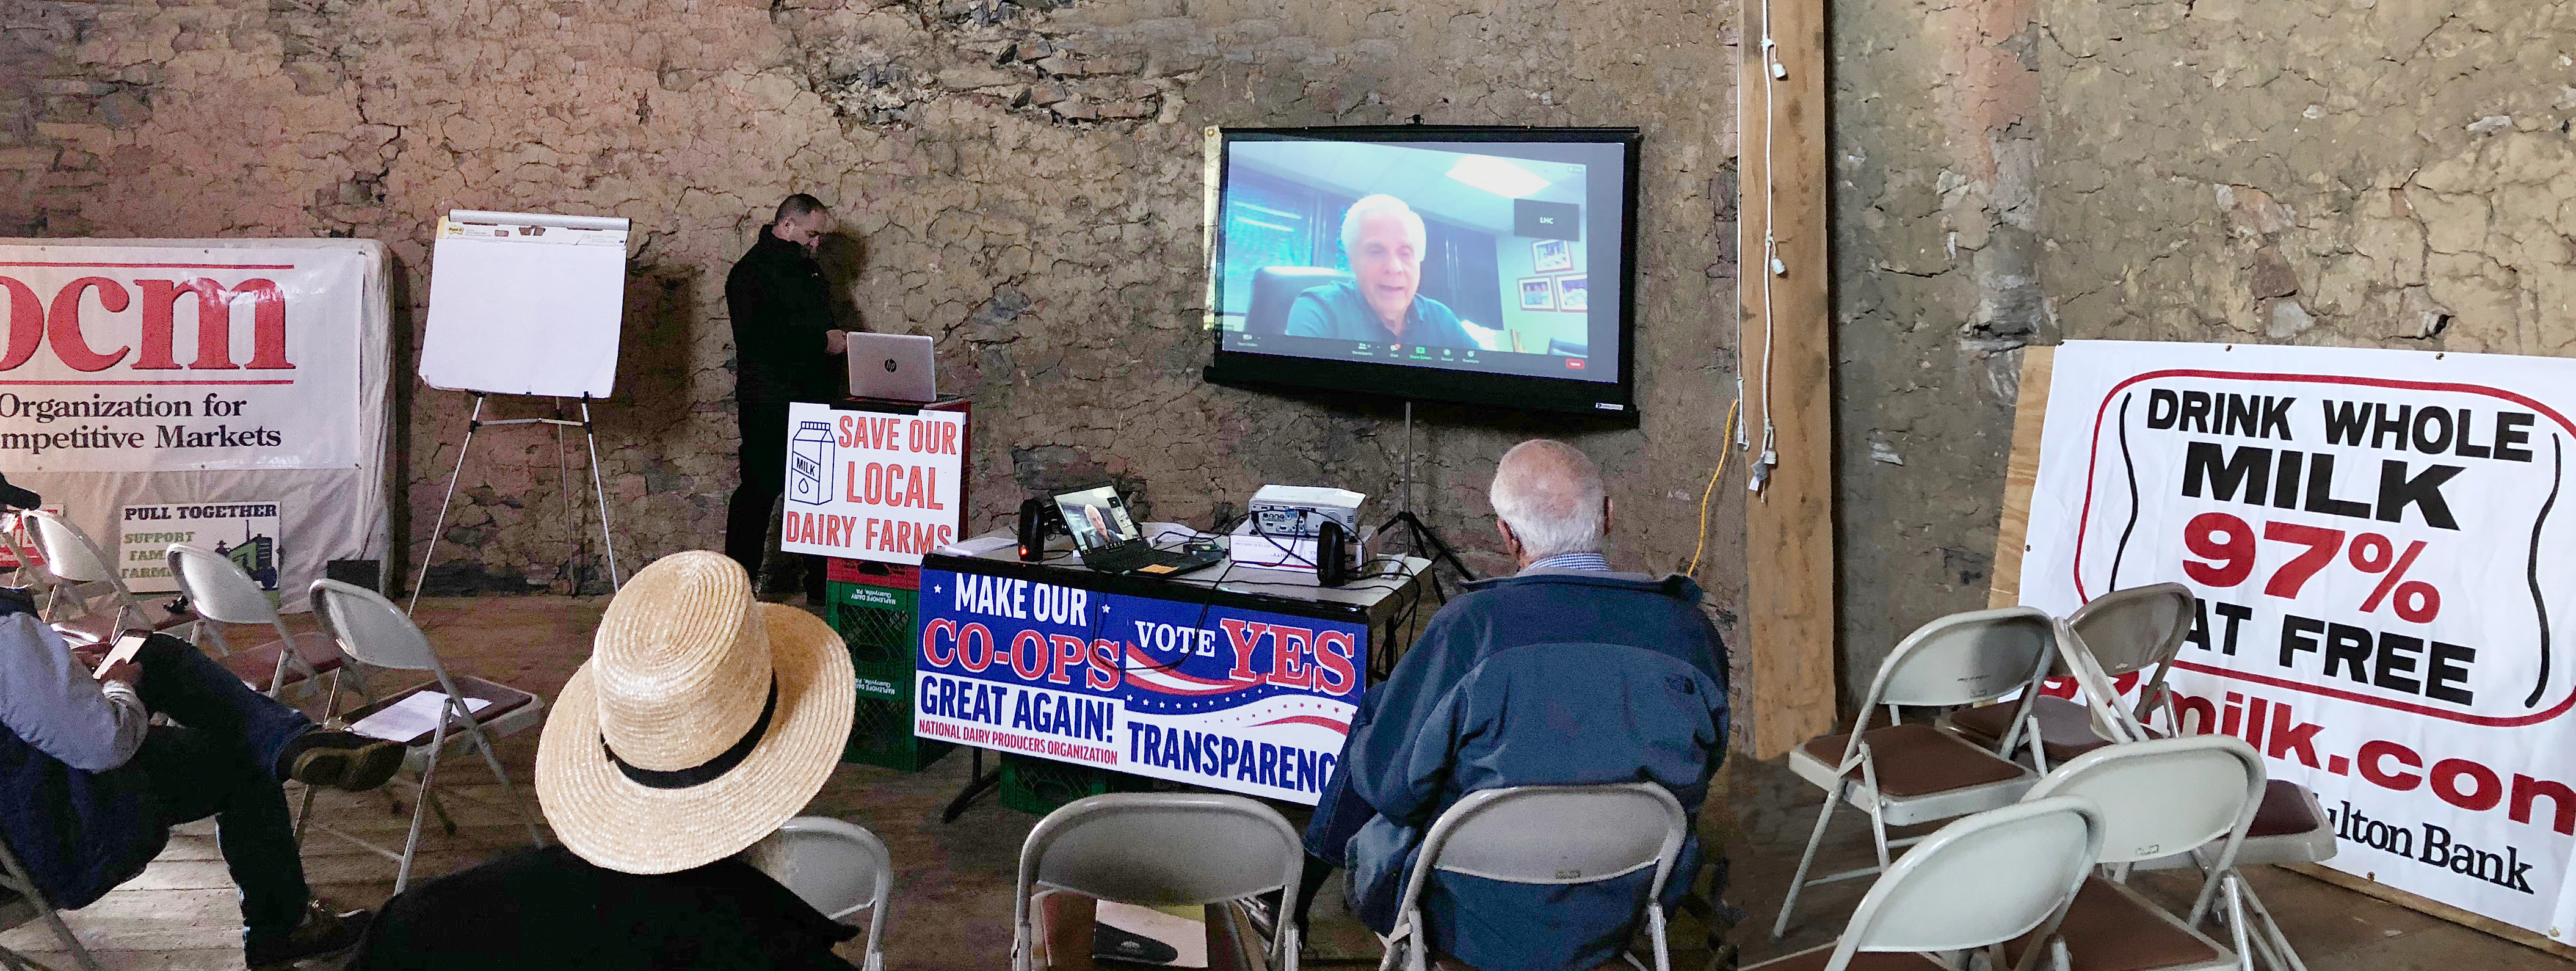
GORDONVILLE, Pa. — Empowerment. One word with power in it.
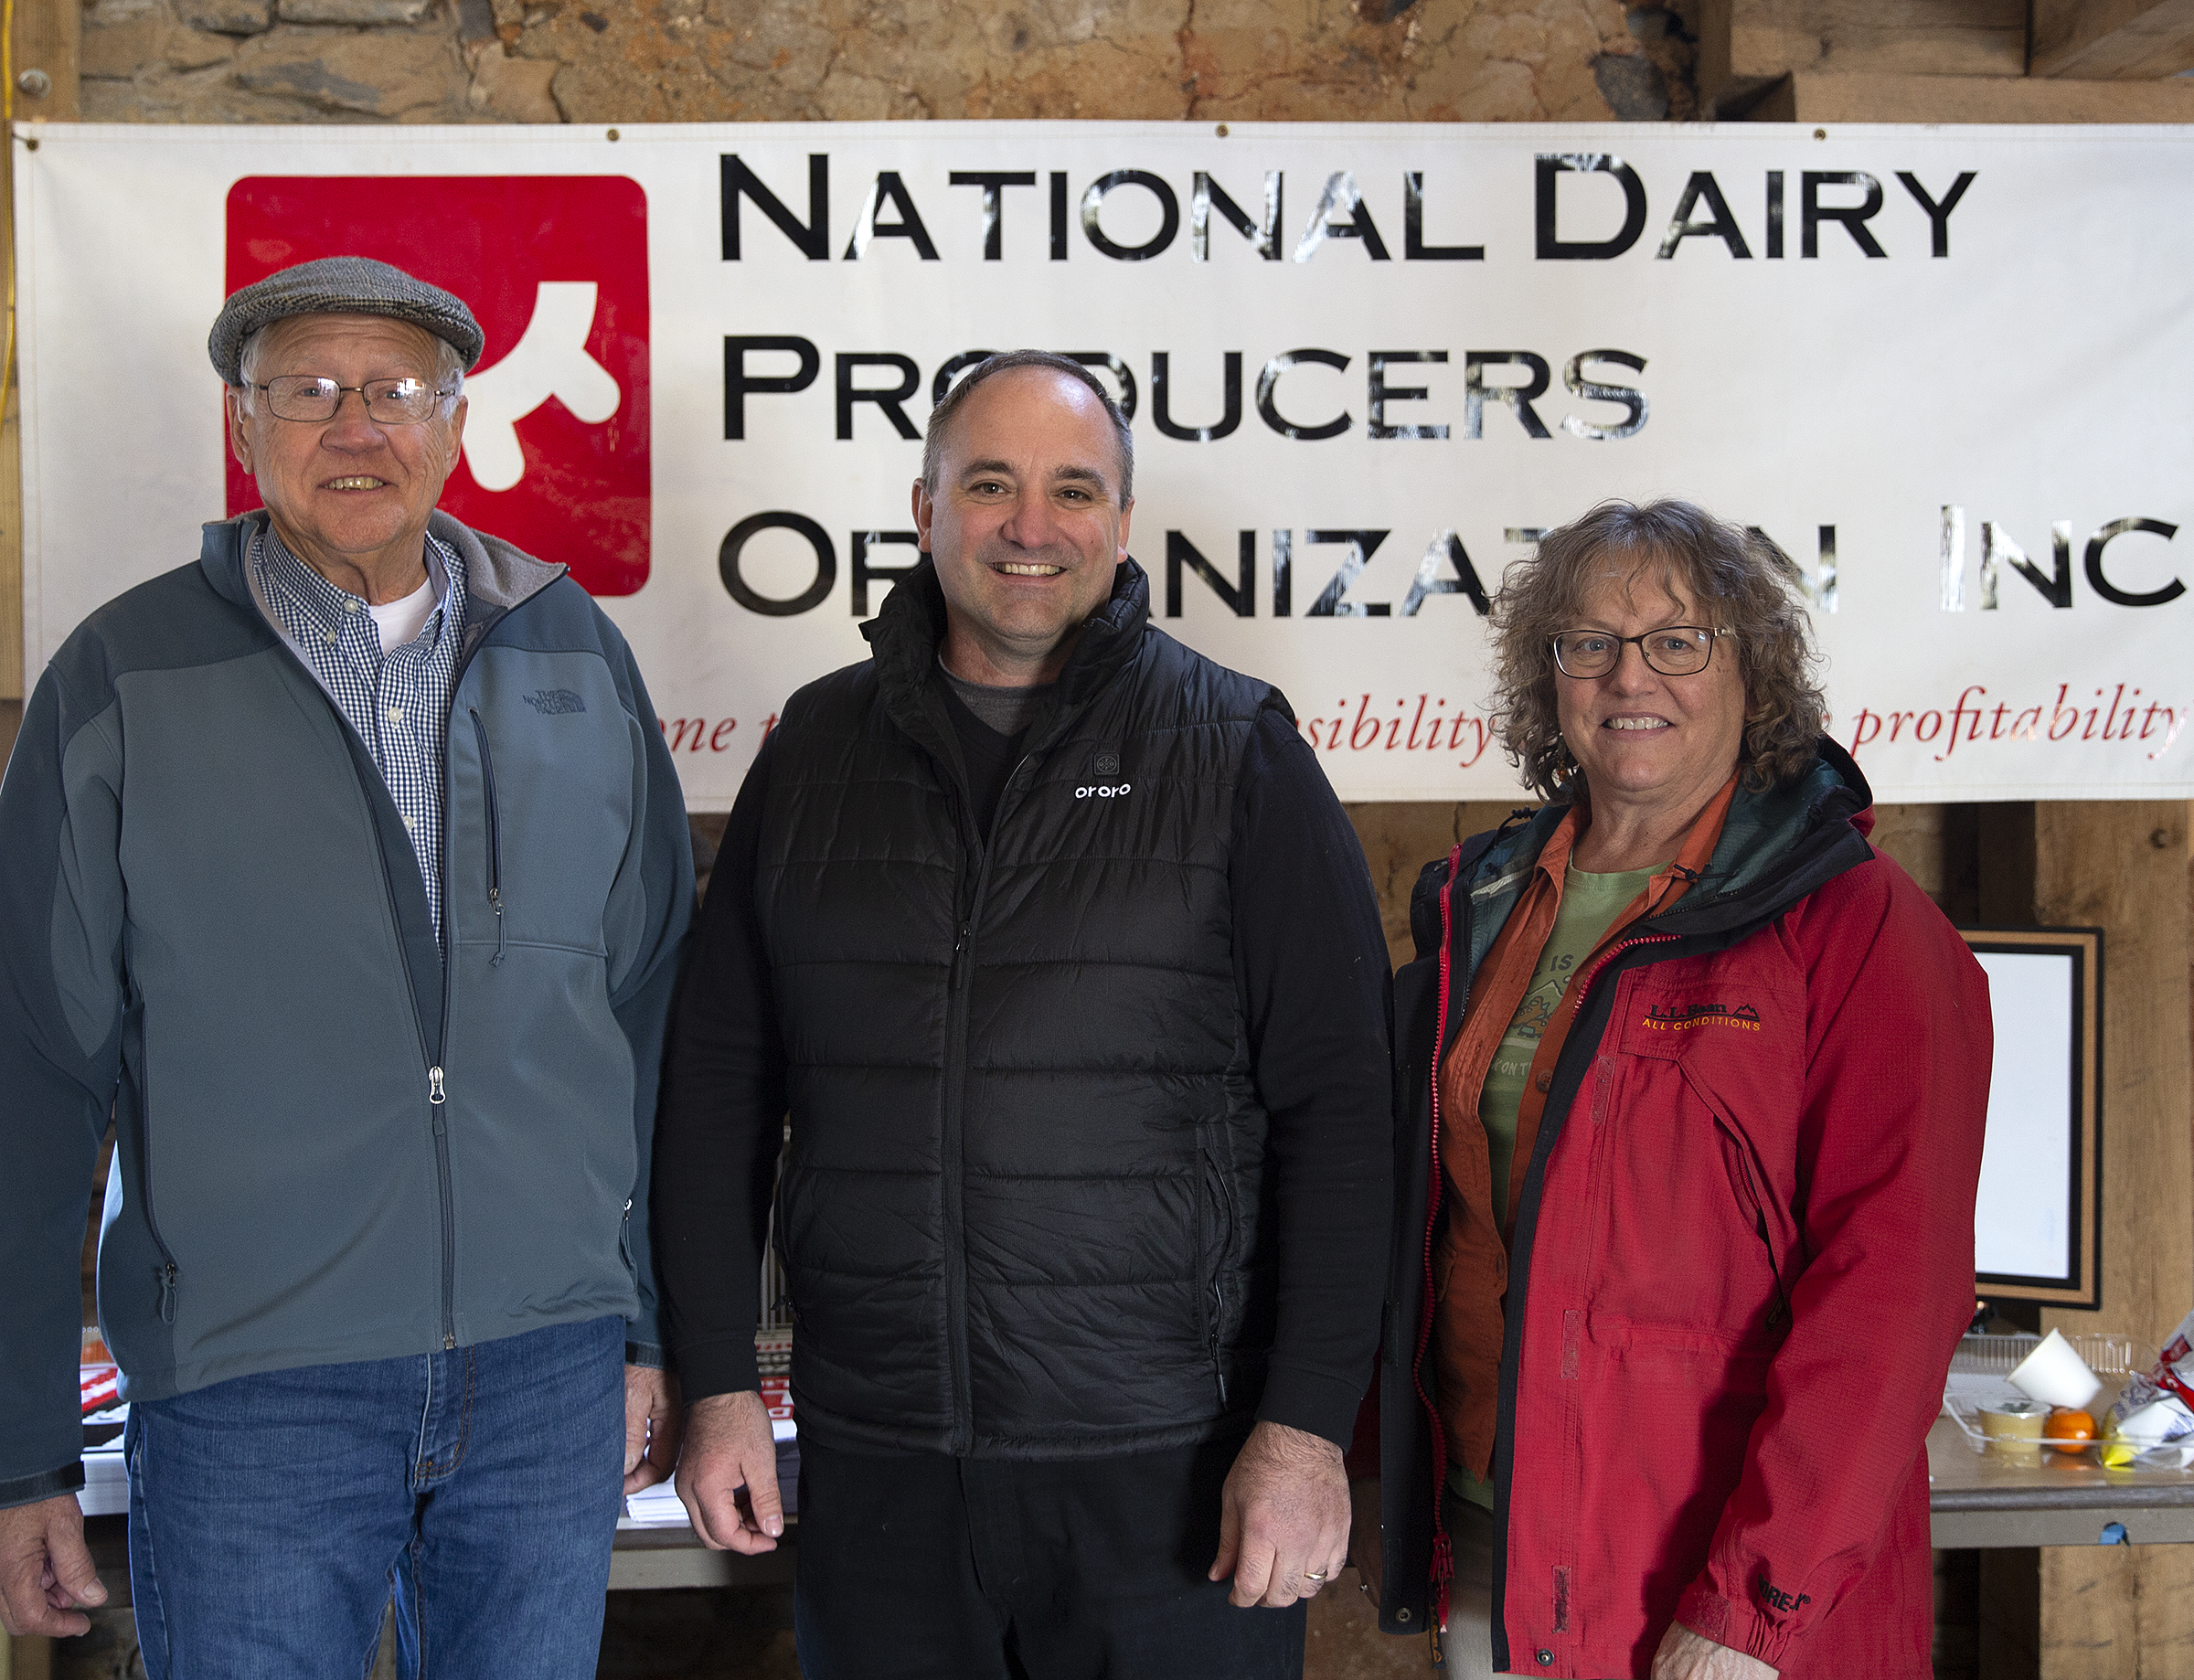
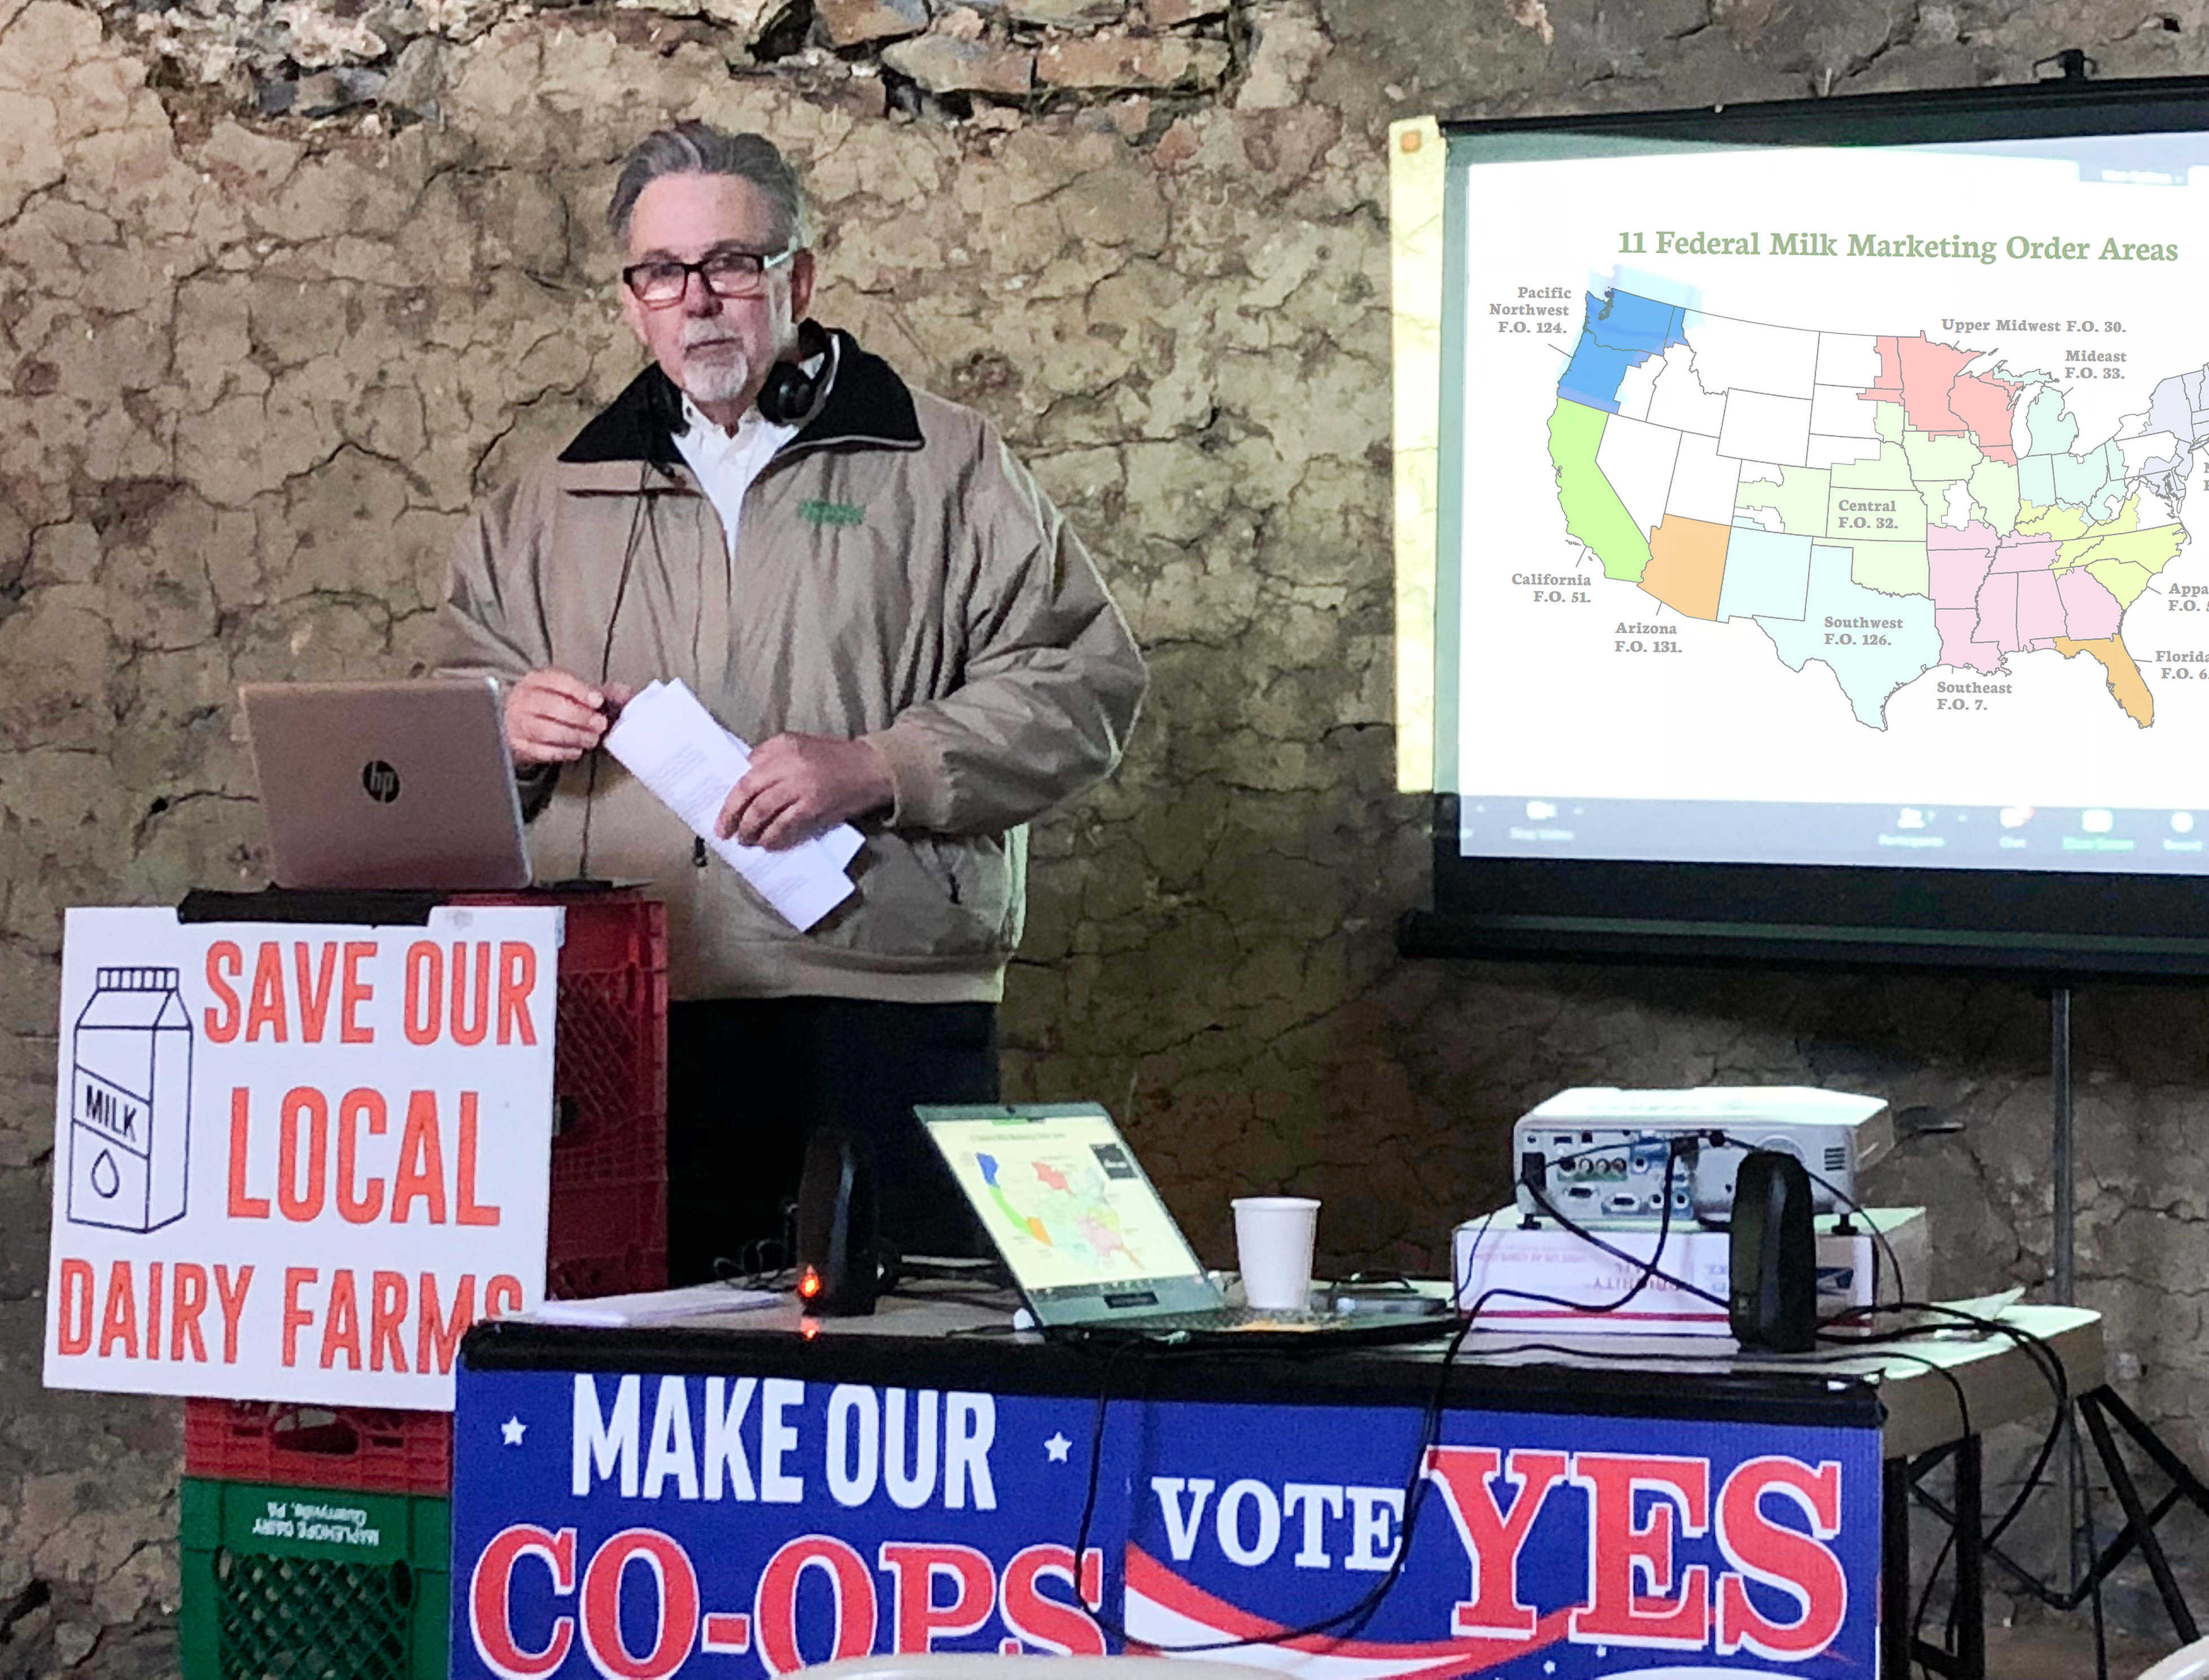
“I got to thinking about introducing this session and thought everyone knows what empowerment means, right? Give power. But then I looked up the opposite of empowerment,” said Kristine Ranger, a consultant in Michigan working with farms and writing and evaluates grants. She traveled to Gordonville, Pennsylvania with National Dairy Producers Organization board member Joe Arens to the farm of Mike Eby, NDPO chairman, for the ‘Empowering dairy farmers’ barn meeting Friday, April 23, 2021.
What is the opposite of empowerment?
“Here are the words in the dictionary,” said Ranger. “Disallow, forbid, hinder, inhibit, preclude, prevent and prohibit. Have any of you been experiencing any of that as you try to build a livelihood with your dairy farms?”
Good question.
From there, the daylong barn meeting moved headlong into weighty topics, but stayed focus on the positive concept of encouraging producer involvement in seeking accountability and transparency in the systems that govern dairy.
Although the sunshine and spring planting kept in-person attendance low, the event was livestreamed on visual and audio with producers listening in from all over.
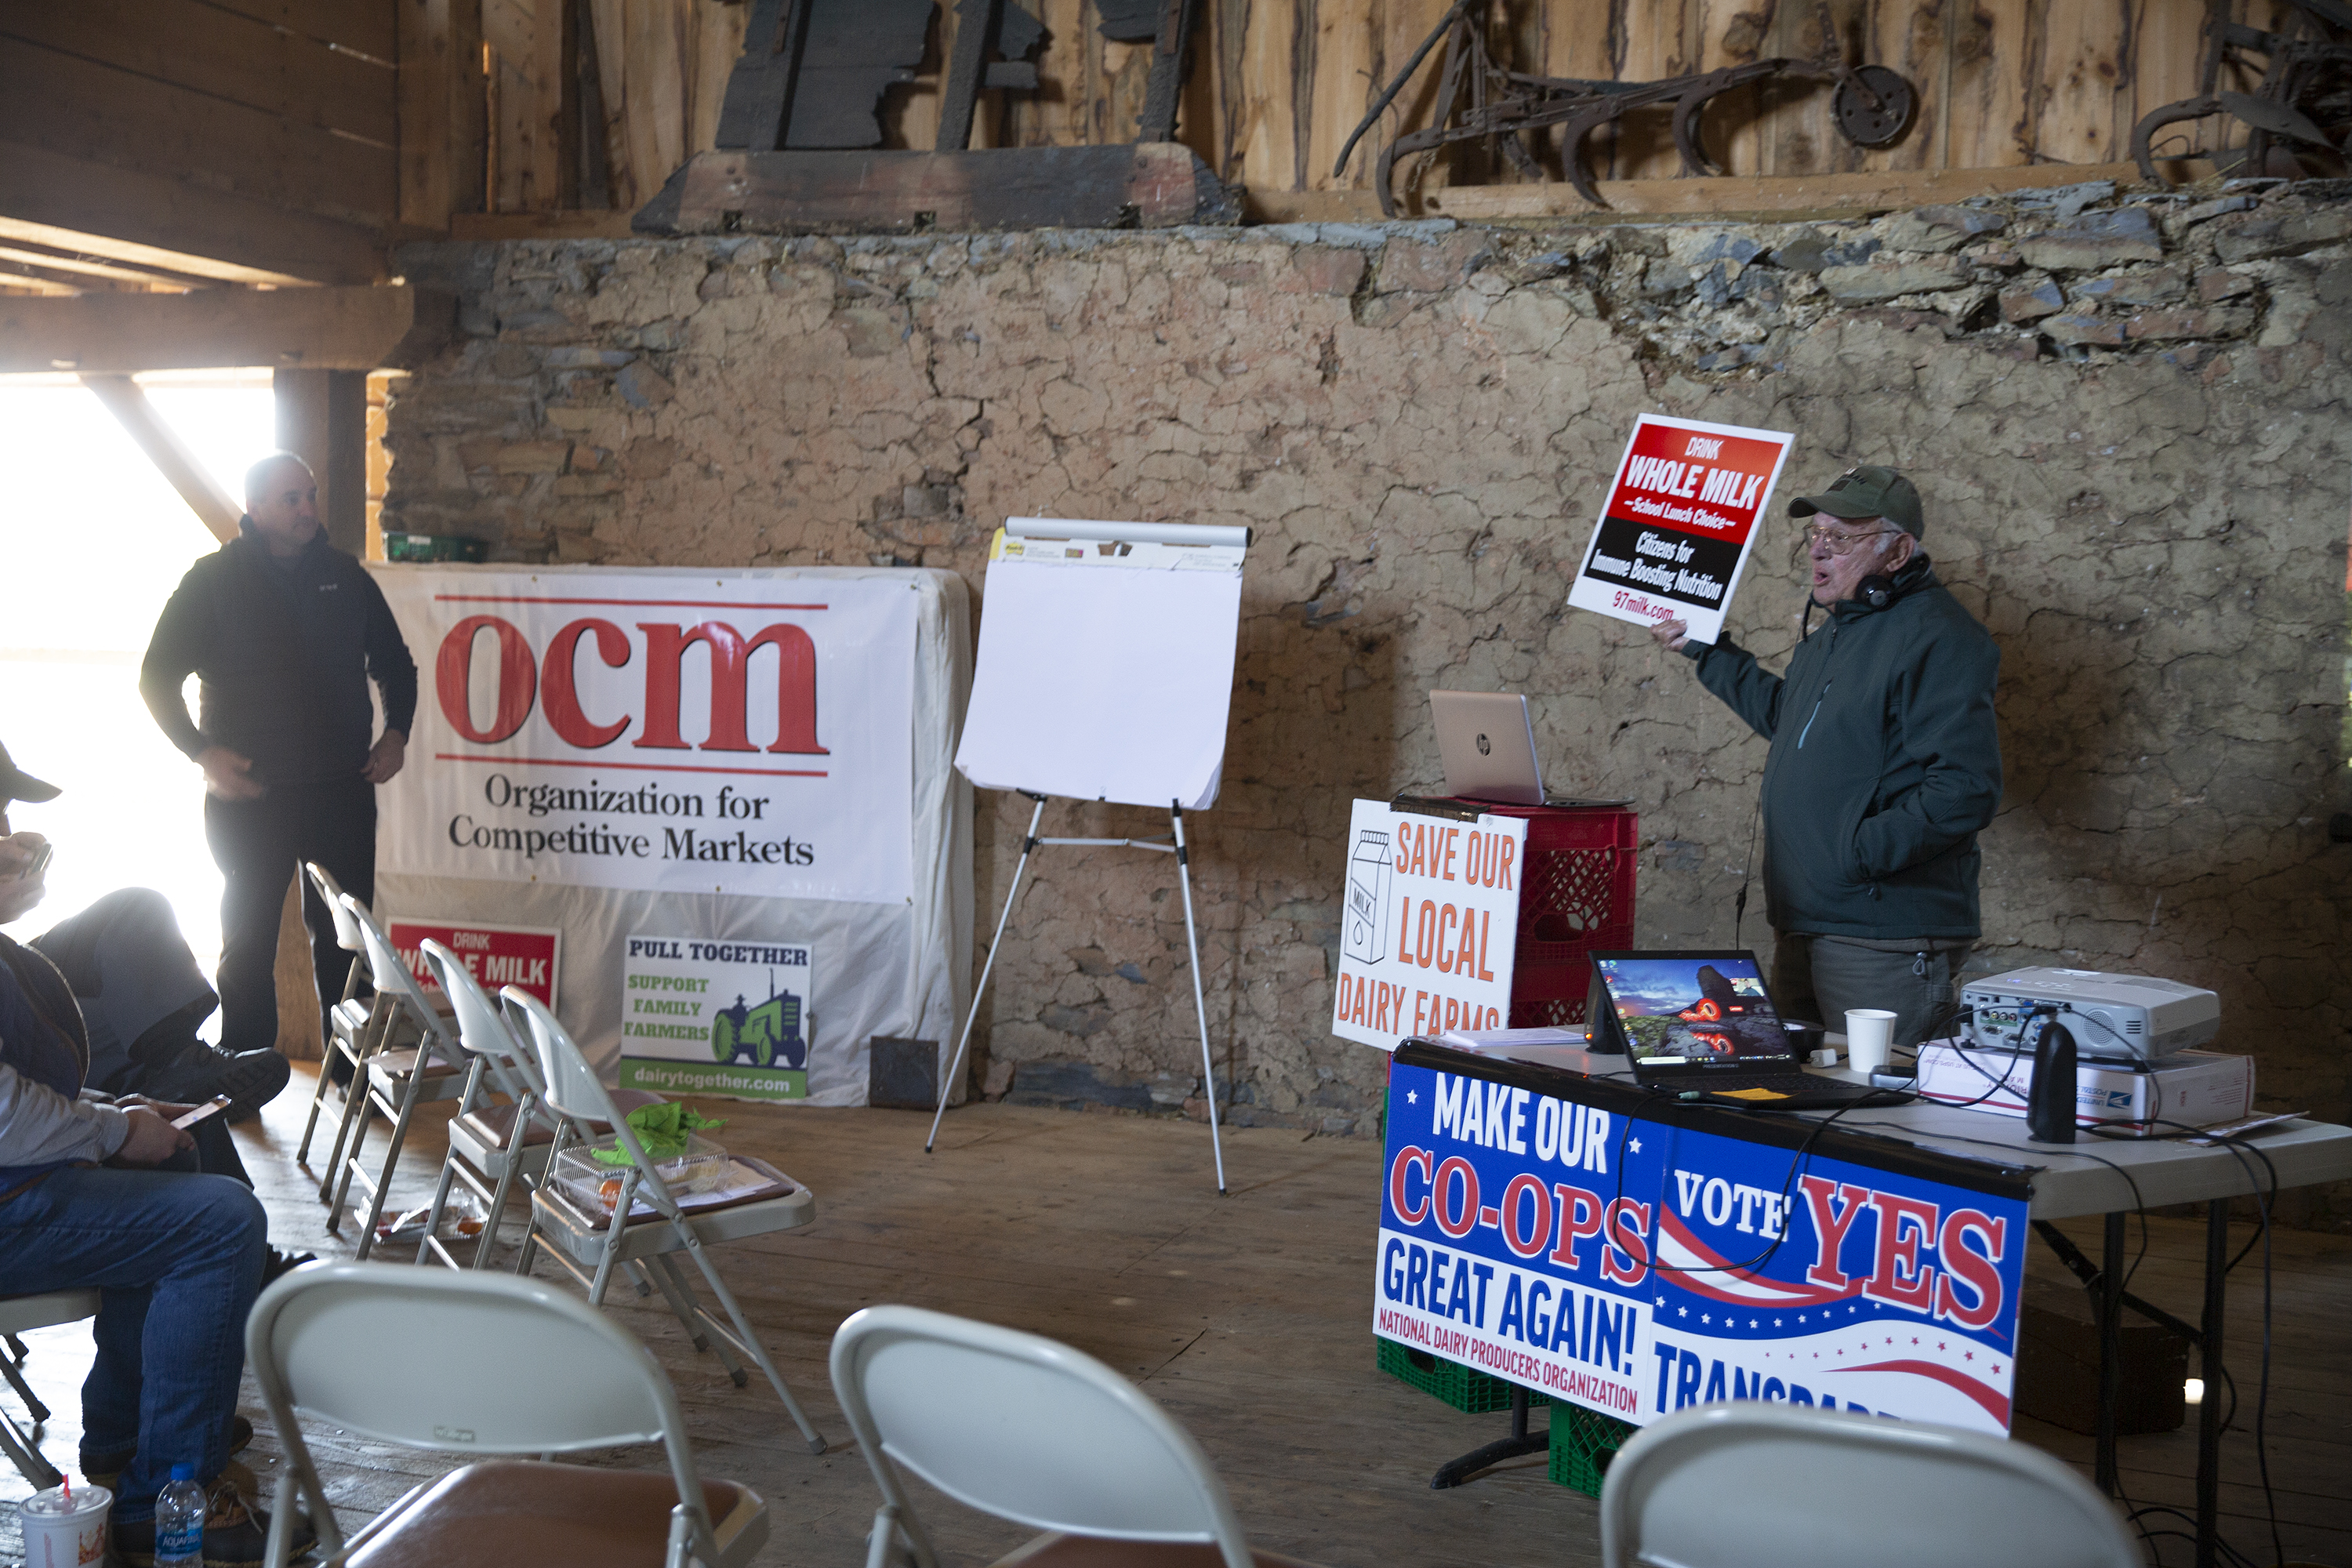
Traveling from Michigan to the Lancaster County, Pennsylvania farm of Mike Eby (center) for an ’empowering’ farmers meeting were Joe Arens (left), NDPO board member and Kristine Ranger, a knowledge consultant working with farms. Ranger worked with Eby to secure a grant for the in-person meeting and multi-media production. In addition to serving as NDPO (National Dairy Producers Organization) chairman, Eby is executive director of Organization for Competitive Markets (OCM), represents the south district on the PA Farmers Union board and is a member of the Grassroots PA Dairy Advisory Committee collaborating with 97 Milk education efforts.
A thought that kept surfacing in this reporter’s mind listening to the panel of speakers was this: The longer something goes uninterrupted, the more vulnerable it is to become corrupted.
In fact, it tied in directly with Arens’ personal account following Gary Genske on the program. Arens urged producers to look at annual reports and ask questions. “That’s what NDPO is all about, to support your efforts to get to the cooperative boards of directors about what they should be doing at the co-op level,” said Arens, a member of the NDPO board for two years.
“Members own the milk. Members have the power, but the whole thing has been tipped upside down,” said Arens.
“We need to do something to change this,” said Arens. “Get in front of your board members… They are talking about expanding plants, not talking about producer price. Their one and only responsibility is that price on the milk check settlement statement.”
“If producers do not hold their co-ops accountable, then silence is your consent,” said Genske, a certified public accountant since 1974 based in California with a dairy in New Mexico.
He kicked things off at the barn meeting, presenting details about the roles and responsibilities of cooperatives, boards and members. He shared his insights into improving dairy farm milk prices.
Genske is a longtime member of the NDPO board. He highlighted the marketing concepts of 100% USA seal for milk and dairy products, returning to the true standards for fat and components in beverage milk that are still used today in California, and moving toward aligning milk production with profitable demand.
Gary Genske was the kickoff panelist, presenting virtually from his office in California.
The Genske Mulder firm does the financial statements for 2500 dairy farms each year and 10,000 farm tax returns annually. He sees the numbers and knows the deal.
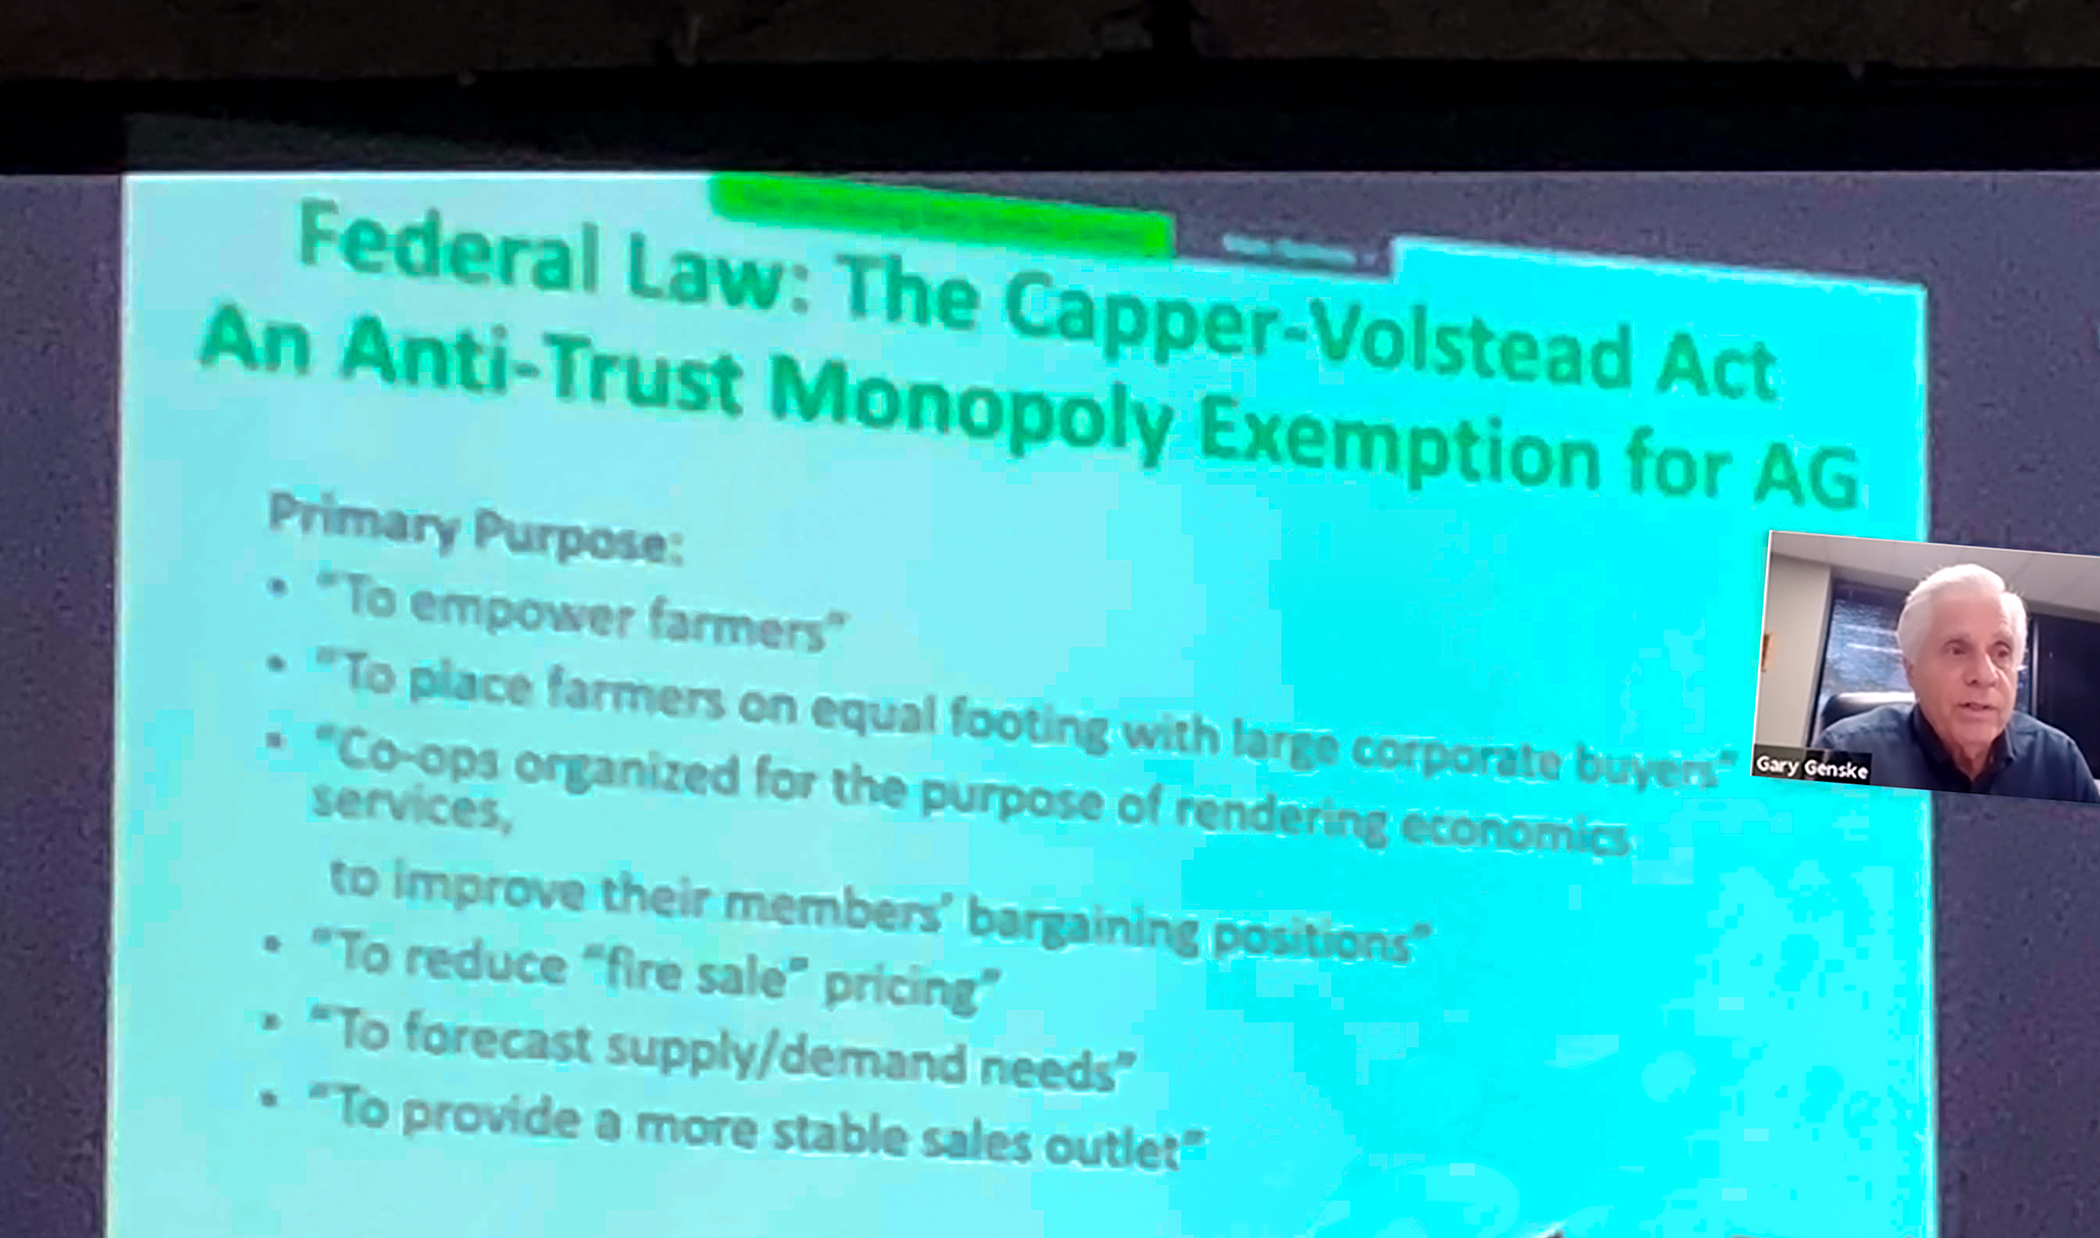
Walking attendees through the various aspects of USDA regulation and the Capper Volstead Act, Genske gave producers the tools and encouragement to accept their responsibilities as cooperative members.
In October, he had a successful lawsuit in Kansas City. After requesting documents from the cooperative in which he is a member, and being denied or provided documents that were mostly redacted, he took the issue to court.
After a two-day hearing, the judge ruled in Genske’s favor on his request for documents, as a cooperative member, with a stated purpose.
In short, Genske said, “We have to put people in the position of taking care of the members… We want to cull cows not dairy farmers.”
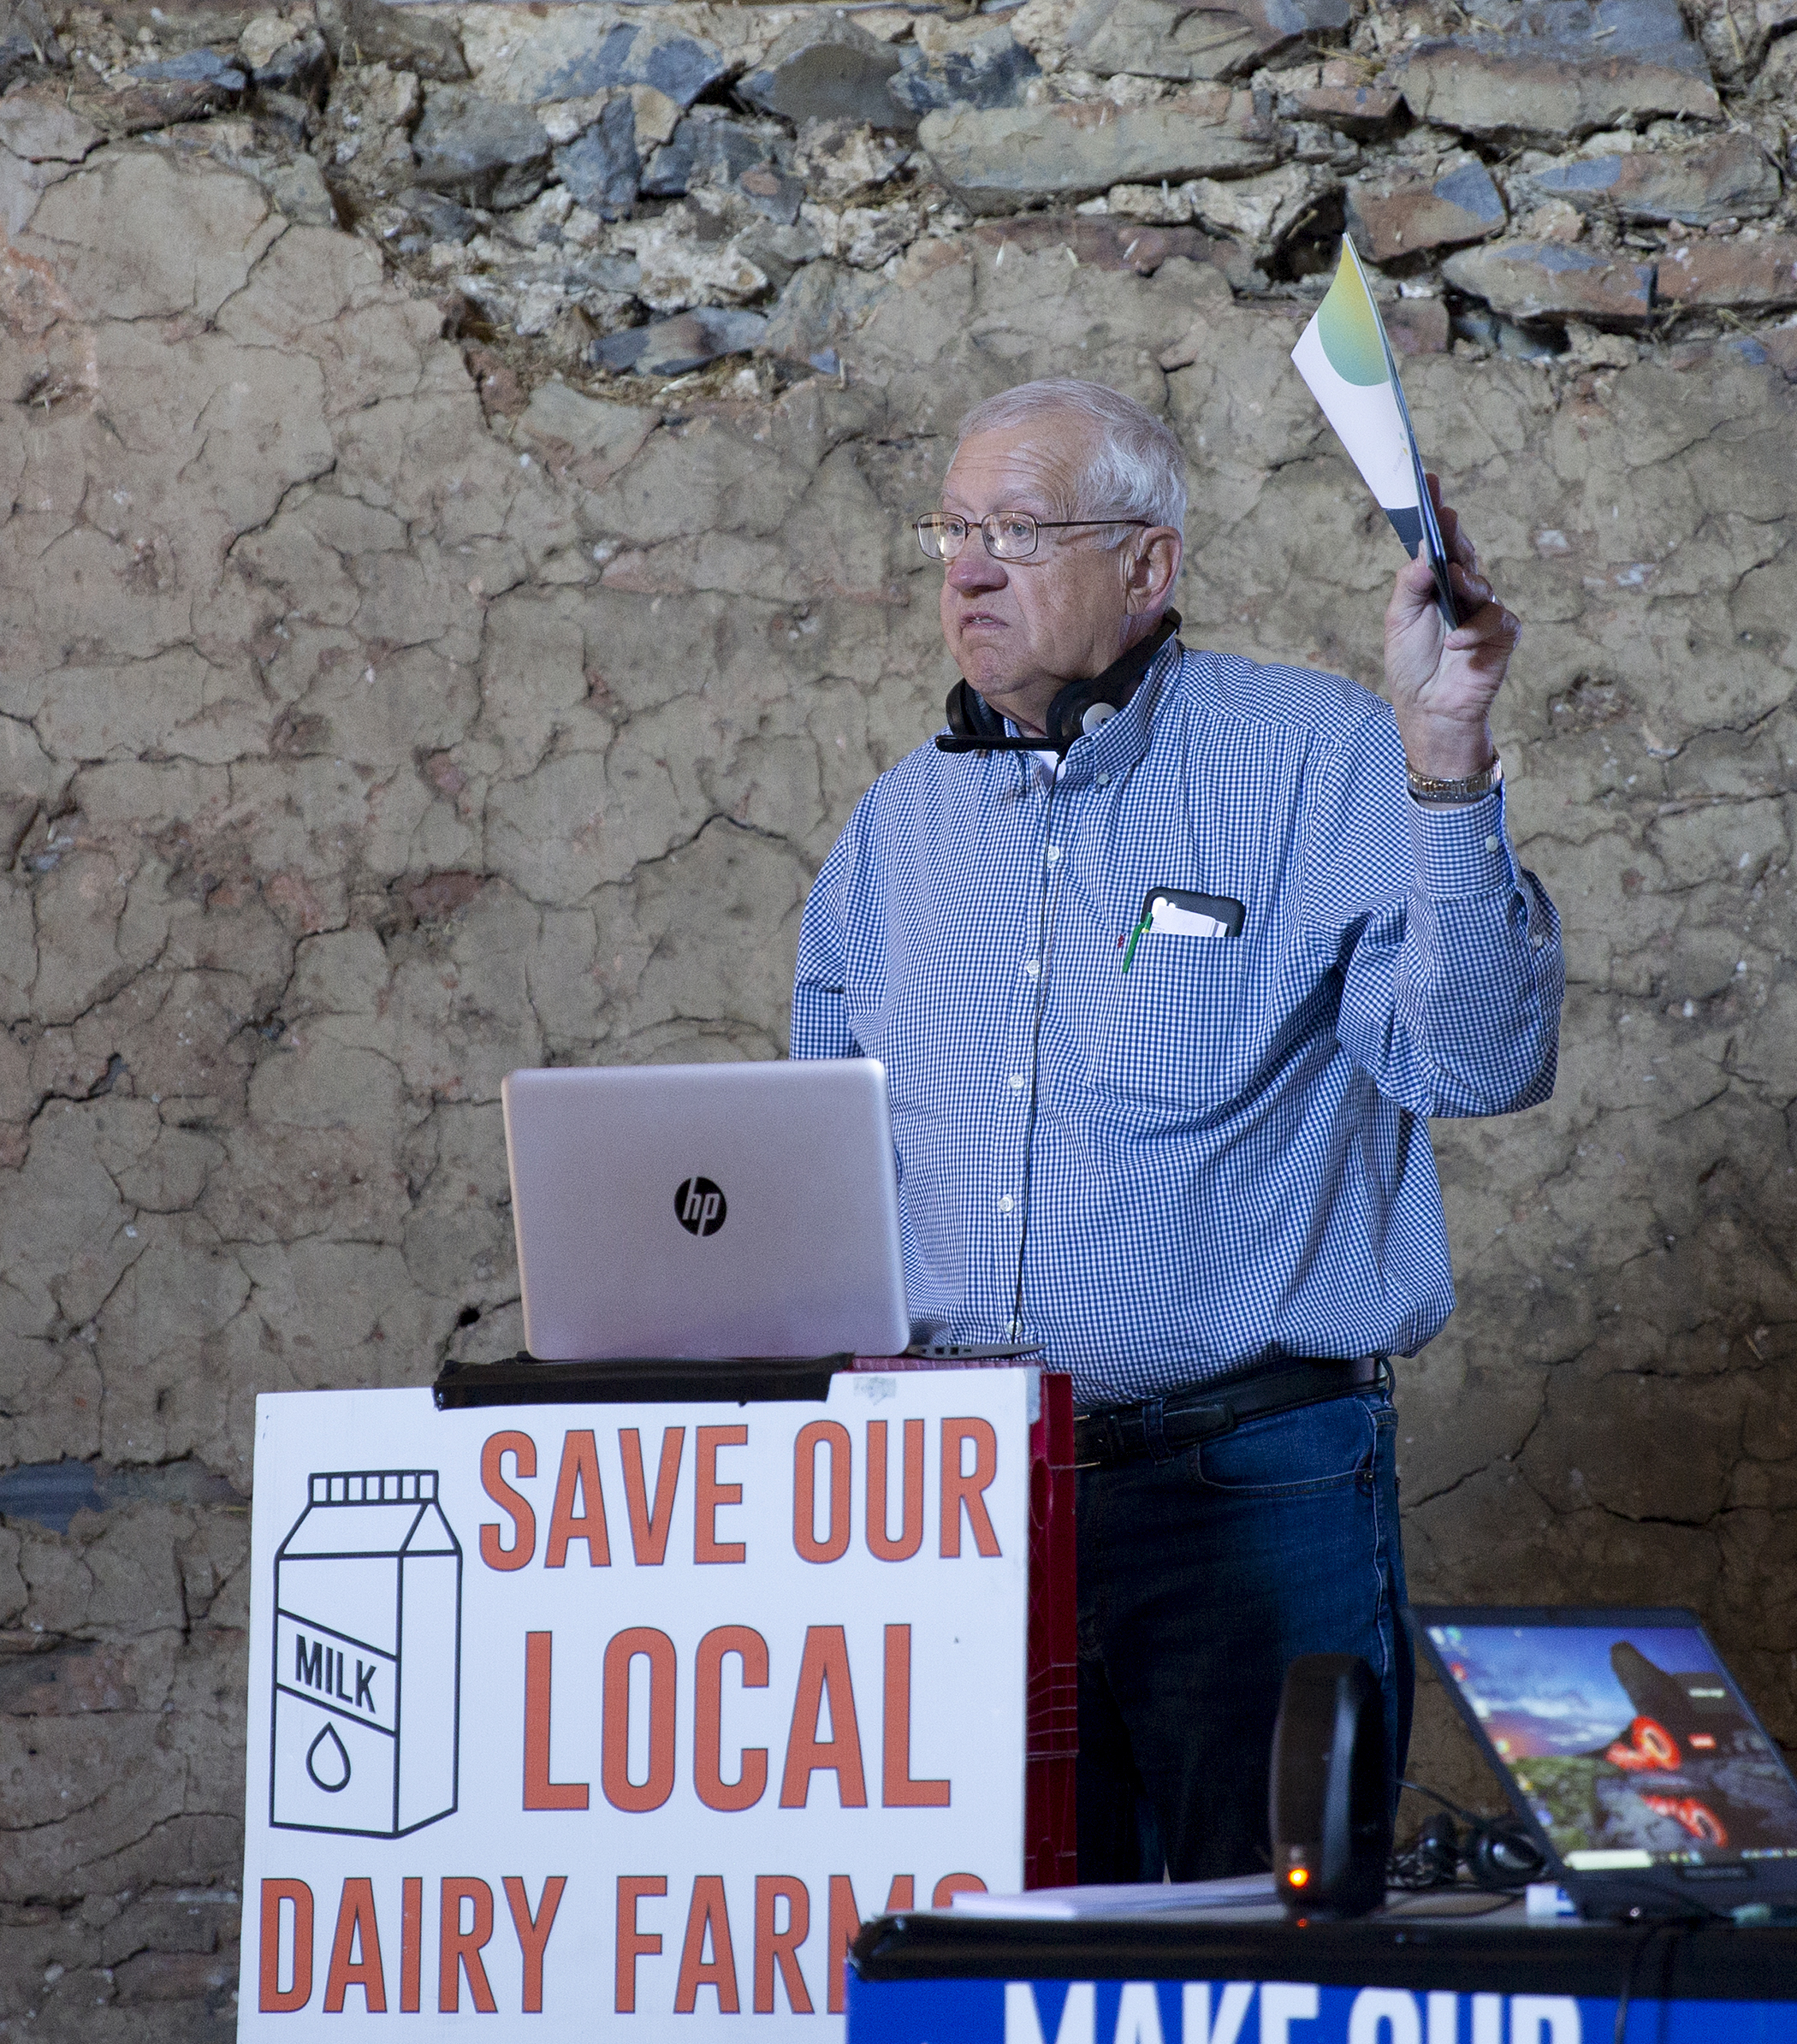
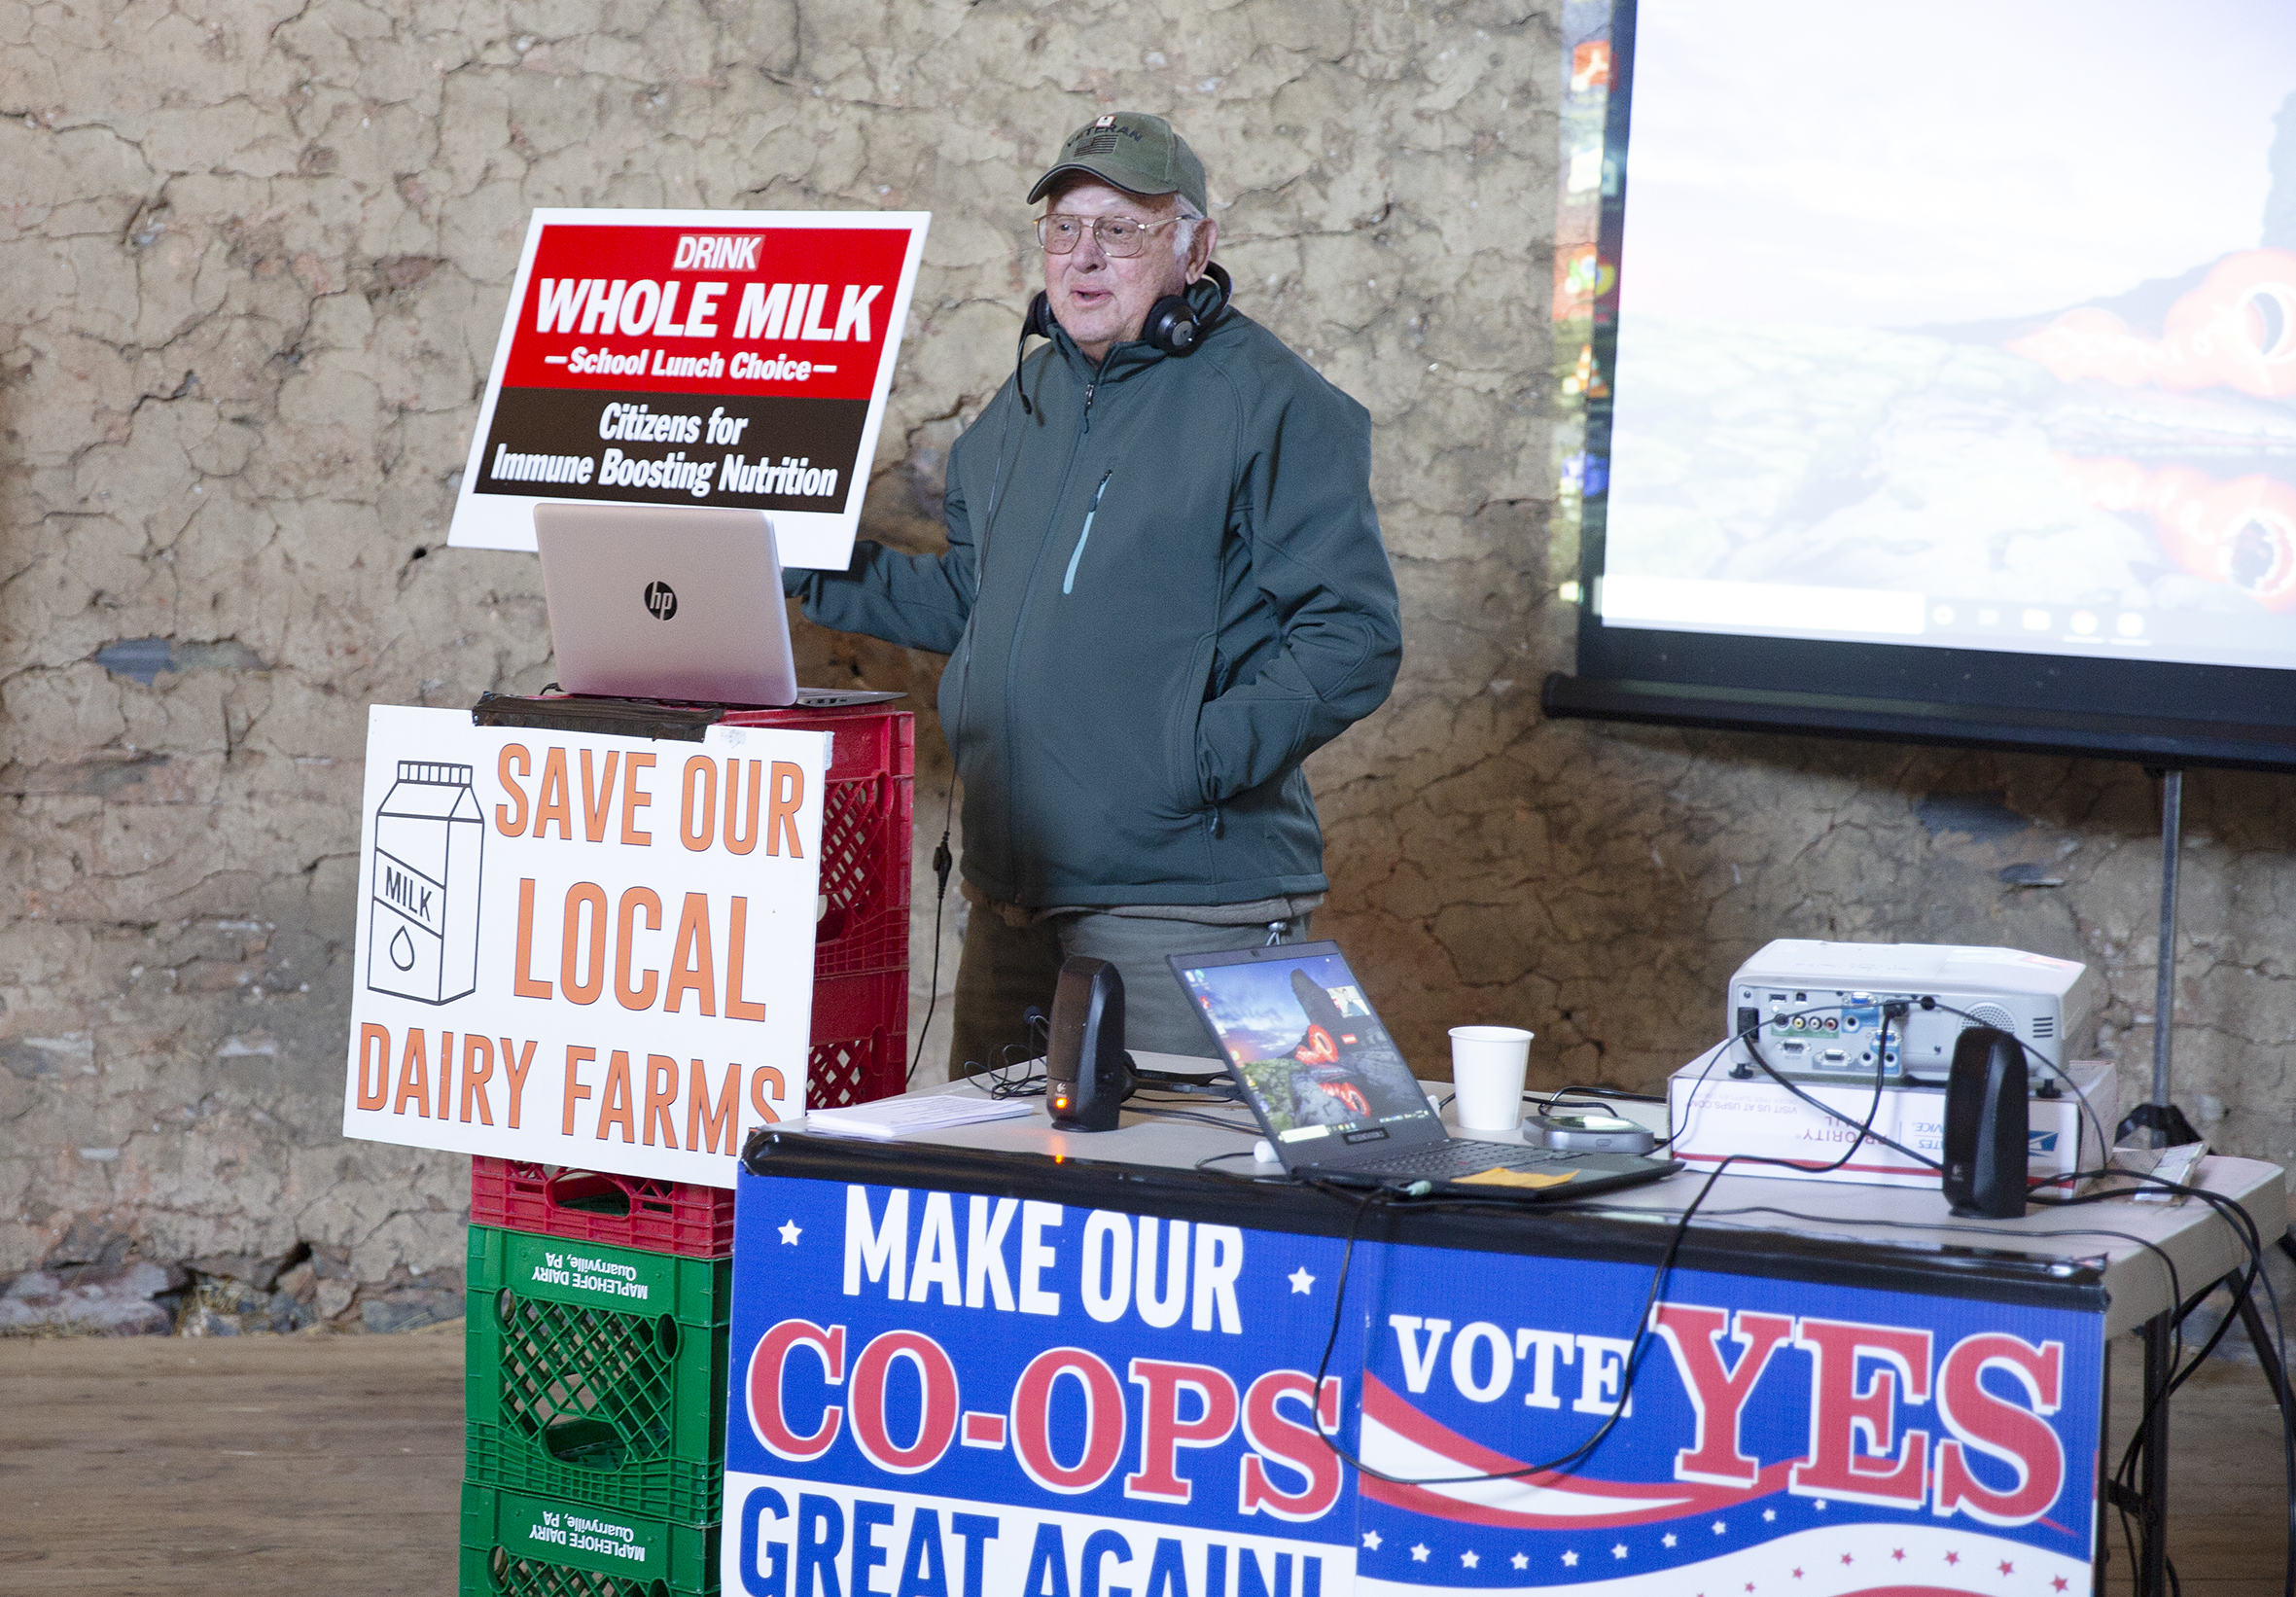
Bernie Morrissey, chairman of the Grassroots PA Dairy Advisory Committee talked after lunch about the 97 Milk effort when farmers empowered themselves to market whole milk, since no one else was; and all kinds of prohibiting, hindering, forbidding, preventing and precluding had been going on regarding whole milk availability and promotion.
“This is it,” said Bernie Morrissey. “The dairy farmers made me successful, so this is me giving back.” He talked about the whole milk education effort and the push to legalize whole milk choice in schools. If ever there was an example of the opposite of ’empower’, it would be the treatment of whole milk by industry and government, especially since 2008. The steep decline in fluid milk sales from 2010-2018 is starting to stabilize as consumers and policymakers are getting the message. Each step is hard work.
“It started with Nelson Troutman who painted the first round bale, just like that sign: Drink Whole Milk 97% Fat Free,” said Morrissey pointing to the large banners and holding up the Drink Whole Milk School Lunch Choice Citizens for Immune Boosting Nutrition yard signs.
With a joint effort underway now for a little over two years – working to educate lawmakers and consumers about whole milk, and pushing efforts to legalize whole milk choice in schools — Morrissey said “It’s working. Things are happening.”
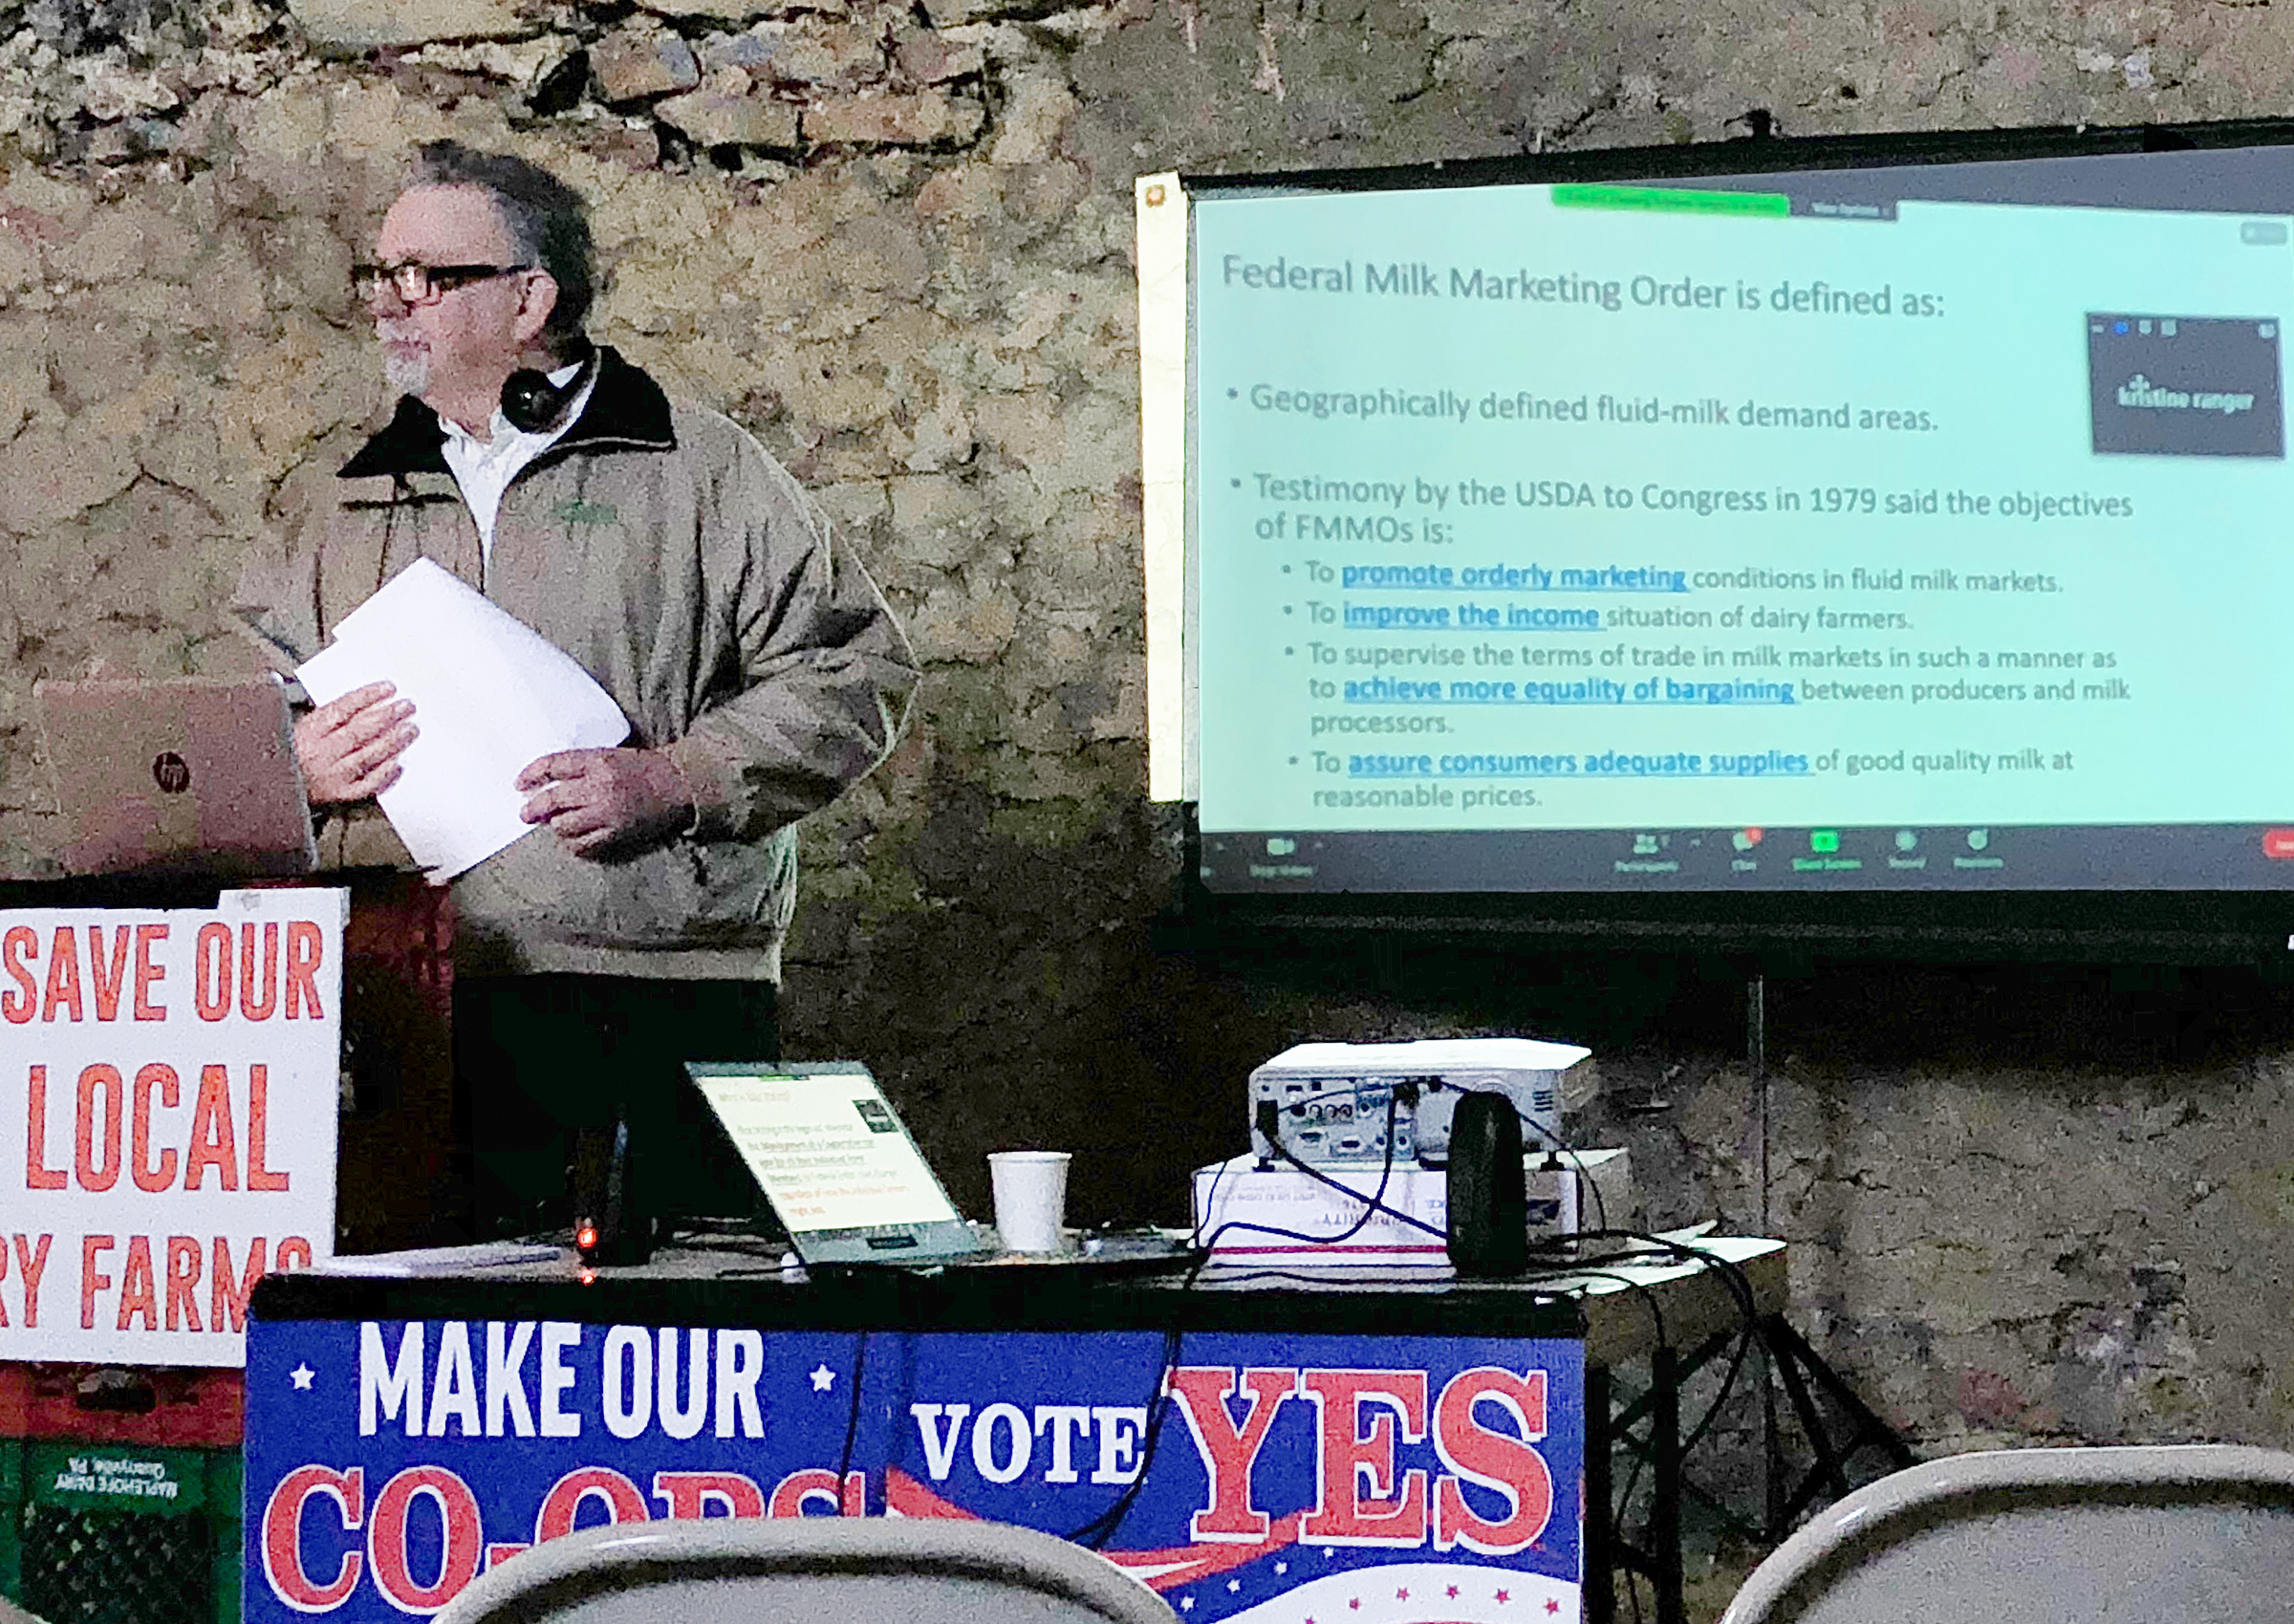
With the FMMO map on the screen behind him, Dick Bylsma of NFO talked about the history, purpose and hot FMMO topics of the day. He said the most empowering tool a dairy producer can have is the right to vote on milk order changes, instead of being bloc-voted by the cooperative.
Dick Bylsma of National Farmers Organization (NFO) traveled from Indiana to brief producers on joint efforts between NFO, Farmers Union and Farm Bureau to empower dairy farmers by getting their individual votes back in Federal Order hearings. He traced the history of Federal Milk Marketing Orders, and the genesis of bloc voting at a time in history when there were hundreds of thousands of farmers and communication was slow.
“It’s time to end bloc voting,” said Bylsma, and he laid out some of the efforts underway around that proposition, also highlighting the purpose of the Federal Orders.
These are just some fast highlights from a day of deep learning. More from these speakers and additional speakers on co-op involvement, systems accountability, checkoff reforms and referendums, and other empowering topics — including more from Genske about ending the silence and exercising rights and responsibilities with communication tools that work for cooperative members — will be published in a future edition.
Similar in-person meetings recently encouraged producers in Michigan and northern Indiana, said Ranger.
For dairy producers who are interested in knowing more, want to get involved, but aren’t sure how, NDPO chairman Mike Eby suggests joining in on the NDPO weekly national Tuesday night call at 8:00 p.m. eastern time at 712-775-7035 Pin 330090#. Every dairy producer in America has a standing invitation.
While the buck is being passed, dairy producers are talking with lawmakers about the unintended consequences from the Class I mover change Congress enacted in the 2018 Farm Bill.
This illustrates the Class I mover formula since May 2019. Prior to that, the ‘higher of’ Class III or Class IV advance skim pricing factors was plugged into the first item under step 1 without the +74-cent adjuster to automatically be used as the Base Class I Skim Milk Price in the rest of the formula. Image Source: USDA
By Sherry Bunting, Farmshine, May 2021
WASHINGTON, D.C. — The Class I ‘mover’ is the subject of much discussion — two years after the averaging method plus 74 cents replaced the ‘higher of’ method to determine the base producer price of Class I beverage milk in May 2019.
A letter drafted by Senator Kirsten Gillibrand of New York is gathering signatures from Senators and will be sent to Ag Secretary Tom Vilsack regarding financial assistance to cover direct and indirect losses borne by dairy farmers due to the formula change exacerbated by the pandemic.
“By allocating more direct payments through CFAP, USDA could take action to reduce the strain that dairy farmers are facing. Specifically, the agency should continue issuing payments to dairy farmers under CFAP, or through any further assistance programs that USDA conceives, including the Pandemic Assistance for Producers initiative, for the first six months of 2021 and make these payments retroactive to January 1st,” the Senator’s letter states.
The American Dairy Coalition is urging producers to contact their Senators about signing onto the letter by end of day Monday, May 17. Senators should contact Dominic Sanchez at Senator Gillibrand’s office by email at Dominic_Sanchez@gillibrand.senate.gov
A transparent USDA hearing process was used 20 years ago to originally set the ‘higher of’ as the method when USDA rejected proposals for averaging Class III and IV due to depooling and negative differentials. However, in the 2018 Farm Bill, the Class I mover was changed from ‘higher of’ to an averaging method legislatively without hearings, without comment, without the producer referendum — without vetting.
Dairy groups are working to raise awareness among key lawmakers and USDA about the 24-month net loss of over $750 million in the Class I mover price from May 2019 through April 2021. In addition, these losses impacted orderly marketing and other factors, contributing to net losses exceeding $3 billion nationwide from inverted class price relationships that produced negative PPDs and led to depooling. In addition, dairy farmers had risk management losses when their milk was devalued, but they paid for risk management that failed because it was aligned with a “market value” they did not receive.
Sen. Gillibrand’s letter highlights the concern about the unintended consequences of the Class I formula change to averaging and away from ‘higher of’.
In the Northeast FMMO 1, for example, the Class I change, alone, accounted for a net loss of over $160 million in Class I devaluation over 24 months, and there were broader impacts of basis losses from reduced and negative producer price differentials (PPD) and depooling.
Northeast producer blend price losses are estimated to be $1.10/cwt, net, from May 2019 through April 2021. (Calculations are being done for other FMMO regions so stay tuned.)
Similar loss estimations can be made for broader impacts across the U.S., depending upon how cheese plants determined pay prices for farmers when the FMMO uniform blend prices were suppressed by $1 to $10 across 7 of the 11 FMMOs that report producer price differentials. These PPDs were severely negative from October through December 2019 and from June 2020 through April 2021.
These formula-related losses are expected to continue through most of 2021 due to current market factors affecting how the class pricing formulas, with the change to Class I, relate to each other and how this impacts depooling.
Producers from the Southeast U.S. also began circulating a letter to Secretary Vilsack this week highlighting the steep losses in the three Southeast FMMOs and seeking direct payments through Coronavirus stimulus funds.
The Southeast letter asserts that milk producers in FMMO 5, 6, and 7 (Appalachian, Florida and Southeast) disproportionately bore 21% ($155 million) of the lost revenue directly attributable to the Class I mover change, because the 21% of Class I value loss fell on dairy farmers shipping just 5.5% of total milk pooled across all orders in the U.S.
Southeast producer blend price losses are pegged at $1.25/cwt.
The Southeast letter states that the loss was not shared equitably among all dairy farmers, due to depooling, which the letter indicates made it possible for dairy farmers marketing milk to cheese plants (Class III) to receive the shortfall.
However, many producers whose milk was depooled from FMMOs did not receive that shortfall from milk buyers, unless they had milk contracts based directly on cheese prices. Many manufacturing class handlers use the FMMO blend price as the benchmark for paying producers outside of pooling.
Several industry sources observe that this change turned out to be a big benefit to processors at great expense to producers. The problem surfaced under market conditions before the pandemic and was made worse by market conditions since the pandemic.
Even National Milk Producers Federation (NMPF) has admitted as much, stating that the International Dairy Foods Association (IDFA) wanted this change in the first place. NMPF indicates they went along with it after studying some historical trends thinking the 74-cent adjuster to the average would produce a result that was “revenue-neutral” for dairy farmers.
It was anything but ‘revenue-neutral’ for dairy farmers, even before the pandemic. The pandemic impact simply magnified the severity of loss.
Minnesota Milk Producers, Wisconsin Dairy Business Association, Edge Cooperative and the Nebraska State Dairy Association joined together with a concept to change the Class I mover to a Class III-Plus that would be based on Class III announced prices instead of advance prices.
FarmFirst Cooperative based in Madison, Wisconsin, announced it would put forward a proposal to return to the ‘higher of’ calculation — if USDA holds a hearing. However, to-date, no official FMMO hearing requests have been received by USDA.
The first few months of the new Class I mover formula in 2019 were net-positive to the Class I price, but this dissolved by July, almost a year before the pandemic, when the gap between the rising Class III price and the averaging method for the Class I mover narrowed because the spread between Class III and IV widened.
Government food box dairy purchases through the pandemic included more Class III products (cheese) than Class IV (butter/powder) or Class II (soft products that are priced by Class IV).
But food boxes included plenty of Class I (fluid milk). Trouble is, fluid milk is not ‘market valued’ except for the value of its components in manufacturing. Fluid milk is discounted as a ‘loss-leader’ by large supermarkets, especially those that process milk.
Another factor that contributed to the wide spread between Class III and IV pricing has been the difference in product inventory as a factor of production, exports and imports.
In 2020, butter inventory reached a 20-year high, while cheese inventory declined. Butter production increased, especially in the first half of 2020, to exceed the record-breaking production of 2018, making less cream available for cheese production. Meanwhile, cheese exports rose 16% while butter exports declined 5%.
On the flip side, cheese imports declined 10% while butter imports were the second largest on record, up 15% over the previous year for the first 7 months of 2020. The U.S. ended 2020 with butter imports 6% above 2019.
The Class I formula change made FMMOs even more vulnerable to massive depooling against this volatile and divergent backdrop of Class III vs. IV. As averaging reduced Class I pricing, and the Class III milk was depooled, the net result was blend prices that reflected a larger portion of the much lower Class IV (and II). Dairy farmers have been educated to produce milk with higher component levels of fat and protein as a method to improve profitability, but negative PPDs snub this value at the farm level.
Looking through USDA Federal Milk Marketing Order statistical bulletins, this reporter calculates over 70 billion pounds of milk were depooled across all FMMOs from July 2019 through March 2021 due to inverted class pricing.
PPDs reflect the difference between the Class III market value of components minus the blend price of all classes in the pool. When PPDs are negative, it reflects insufficient pool funds to pay that value).
The depooling of Class III milk and the negative PPDs (above) began on the West Coast in July 2019. By September through December 2019, all multiple component FMMOs had negative PPDs, that became more negative as volumes of depooled milk were noted in the central part of the country, moving east.
The four skim/fat pricing FMMOs in the Southeast and Arizona were quite negatively affected by lower Class I minimums in the fall of 2019 and for many of the months thereafter. Topsy-turvy All-Milk and Mailbox Milk prices reported by USDA are further proof of shrinking basis in producer milk checks affecting the performance of purchased risk management tools. Even those USDA-reported All-Milk and Mailbox prices do not tell the whole story because USDA states that “the value is in the marketplace” even if it is not equitably shared with producers.
In essence, the Class I mover change was made to give large global companies buying large volumes of milk a means of ‘hedging’ their risk through forward-contracting on the futures markets. But this ‘benefit’ has resulted in taking real money out of dairy farm milk checks and has made it difficult, in some cases impossible, for producers to manage their risk with tools they purchase in the marketplace and through USDA.
Interestingly, the nation’s largest Class I fluid milk company — Dean Foods — filed for bankruptcy sale and reorganization in November 2019 in the midst of the first appearance of negative PPDs and depooling pre-pandemic.
By January 2020, PPDs turned positive but narrow in comparison to prior history, so that’s still a loss. Then, in February, a month before the Coronavirus shutdown, negative PPDs and depooling again showed up in the Central, Pacific and California FMMOs.
By June 2020 — in the midst of the Covid-19 pandemic and one month after the bankruptcy sale of most of the Dean Foods Class I fluid milk plants to DFA — severely negative PPDs of -$1 to -$10, exacerbated by depooling, were prevalent across all FMMOs, most every month from June 2020 through the present.
Even in the Northeast FMMO, where statistics show positive PPDs in some months when other FMMOs were negative, the basis loss to Northeast producers is real because even the positive PPDs in FMMO 1 over the past 24 months are $1 or more below where they were just two years earlier.
As reported in Farmshine last week, Secretary Vilsack says it’s “complicated” and the industry is “divided” so no “significant” changes can be made “quickly.”
NMPF says it intends to request an FMMO hearing of its proposal to adjust the adjuster to improve equitable treatment of producers.
IDFA is publicly silent.
Other groups are floating a proposal that, if officially proposed in an emergency hearing, would turn the deal into a full and lengthy FMMO hearing.
During a Hoards Dairy Livestream session May 5 with Erin Taylor from USDA AMS Dairy Division, a little more was learned about how USDA handles ‘emergency’ FMMO hearings. Taylor said proposals can be put forward with arguments as part of the package, explaining the emergency to make a case for why the USDA should move quickly. USDA then typically responds and gives the industry a 30 day notice if a hearing is granted, but the statute only requires 15 days, and 3 days at a minimum — depending on the emergency conditions.
Like other FMMO hearings, testimony is taken, and if USDA agrees with the proposal based on the evidence, the department could do a recommended decision, receive public comment and then publish a final decision and conduct the producer vote. Or, the Secretary can do a tentative final decision for immediate producer vote while taking testimony concurrently. In such a scenario, USDA would come back and consider that testimony, and if a change to the tentative final decision is made — based on testimony and comment — then a second producer vote would be conducted.
Generally speaking, according to Taylor, a move to use a tentative final decision cuts about 4 to 5 months out of the hearing process, but this is not done without proponents showing good cause and when there is no opposition to the proposal.
And the Congress? They made the change from ‘higher of’ to ‘average-plus’ at the request of IDFA with agreement by NMPF in the last Farm Bill.
Many members of Congress don’t know what they did. Others are “blowing it off” as “pandemic-related,” when in reality the issues began in 2019.
Lawmakers are also being told the 2018 ‘average-plus’ deal was an historic agreement between “producers” (NMPF) and “processors” (IDFA), when in reality the grassroots in either of those categories had no opportunity to be heard, to testify, to comment, and producers were denied a referendum on the change. In addition, there was little industrywide discussion.
National and state dairy organizations have been collaborating on weekly calls facilitated by American Dairy Coalition to thoughtfully approach a solution from both the short- and long-term perspectives.
While most would agree hearings on long-term FMMO reforms are needed, the short-term fix for the unvetted Class I formula change by Congress could be undone with legislation reverting to the previous formula, or through an expedited FMMO hearing as the flaws of the new formula have been revealed in both the pre- and post-pandemic markets by this average-plus change that was not vetted.
Grassroots efforts seek to raise awareness in Congress to move something forward legislatively.
While the Congress has always said it does not want to set precedent for making milk price formula changes outside of the vetting process of an FMMO hearing, and while the Congress rebuffed numerous requests for a national FMMO hearing in every Farm Bill since 2008, the Congress did go ahead and set that formula-changing precedent in 2018 by passing language in the Farm Bill to change the method for determining the Class I mover from the ‘higher of’ Class III or IV to ‘average-plus’… and here we are.
Producers can point this out when talking with lawmakers, to let them know that the current situation is unsustainable. Producers can explain to their legislators how this impacted them, to help them understand there is more to this story than “it’s the pandemic and you’ll be fine.”
If nothing is done, several industry observers see dairy farm exits rising at a faster rate in the coming year.
In short, the Class I mover change in the 2018 Farm Bill:
— was not vetted through a transparent hearing process,
— disrupted orderly marketing,
— undermined Federal Order purpose,
— created NET losses for producers of $751 million in Class I value (May 2019 through April 2021), and contributed to a net loss of over $3 billion in negative PPDs and depooling,
— created additional losses for producers in the failure of risk management tools not designed for inverted pricing, and
— undermined performance of the DMC safety net due to basis loss.
While the American Dairy Coalition continues to facilitate grassroots producer discussion and seeks a seat at the table for producers with NMPF and IDFA, ADC has also sent an email to dairy producers and organizations with a letter they can provide to lawmakers.
The most important thing is for lawmakers to understand how the pricing change, and the domino effect of negative PPDs and depooling have affected their already struggling dairy farm constituents over the past two years.
WASHINGTON, D.C. — National Milk Producers Federation (NMPF) announced Friday, Apr. 23 a Class I mover reform proposal and intention to request a USDA Federal Milk Marketing Order (FMMO) hearing that would be limited to proposed changes to the Class I mover, after which USDA would have 30 days to issue an action plan that would determine whether the department would act on an emergency basis.
According to NMPF, their proposal would “modify the current Class I mover, which adds $0.74/cwt to the monthly average of Classes III and IV, by adjusting this amount every two years based on conditions over the prior 24 months, with the current mover remaining the floor.”
This adjuster change, if done today for the next two years, would pencil out above the current 74 cents (estimated $1.63).
The NMPF action comes after eight weeks of discussion by grassroots dairy producers and state and national dairy organizations seeking a seat at the table to address lost income and risk management disruptions influenced in part by the Class I mover change that was passed by Congress in the 2018 Farm Bill and implemented by USDA in May 2019.
While NMPF and IDFA have reportedly had conversations on the issue, IDFA has not yet publicly-announced a position.
On Tuesday (April 27), another proposal — called Class III Plus – was announced by a collaboration of state dairy groups in the Midwest. This proposal would also end Class I advance pricing factors.
Seasoned dairy policy analysts and economists suggest more proposals may be forthcoming.
USDA “will do the things it knows it can do to impact the (milk income) concern by providing better market opportunities, new market opportunities,” said U.S. Agriculture Secretary Tom Vilsack answer questions from North American Ag Journalists Monday, calling FMMO reform a “tough issue.”
On the specifics, though, the Secretary said simply that USDA would look to the industry “to work with them on the changes that need to take place.
“It’s a very very complicated issue, and not one that should be easily characterized. Anyone that tries to do that doesn’t understand the complexity of that particular topic. It’s very complex,” Vilsack explained.
He acknowledged that conversations are occurring within the dairy industry, but said: “Those conversations need to mature a bit more before anybody makes a decision that there’s going to be a significant change.”
However, in contrast to the Secretary’s observations, a “significant change” has already been made across all FMMO’s, legislatively, and it was done without hearings, without comment, without a producer referendum, without much conversation and without the knowledge of many dairy producers.
So here we are. The buck is being passed as the ball is being volleyed between industry, legislative and administrative. The volley started when NMPF and IDFA proposed the mover change in 2017-18. Congress then passed it, thereby replacing the mover that had been set by administrative hearing process 20 years ago, when USDA chose the higher of instead of an averaging method and documented disorderly marketing, negative differentials and depooling, back then.
Now, the volley is open again for what looks to be a toss from legislative to industry to administrative hearing requests.
For its part, NMPF states that the current mover was “intended to be revenue neutral while facilitating increased price risk management by fluid milk bottlers. The new Class I mover contributed to disorderly marketing conditions last year during the height of the pandemic and cost dairy farmers over $725 million in lost income.”
Analysis by various industry experts, including Farm Bureau’s Market Intel, peg the broader net farm losses at $3 billion when the change influenced a domino-effect of negative producer price differentials (PPDs) and massive depooling.
In the three fat/skim pricing FMMOs of the Southeast U.S. where PPDs are not shown, Calvin Covington calculates dairy farmers in FMMO 5, 6 and 7 collectively had net loss of $1/cwt off the blend price for 23 months due to the mover change from higher of to average-plus.
NMPF’s proposal is described as helping “recoup the lost revenue and ensure that neither farmers nor processors are disproportionately harmed by future significant price disruptions.”
A Penn State Ag Law Center webinar already planned on FMMOs this week, turned into a hot topic. Brook Duer, staff attorney for the center and moderator asked webinar guest Dr. Andrew Novakovic, Cornell professor emeritus about the specifics of the NMPF proposal.
“This proposal would recalculate the adjuster every two years, except the adjuster can never be less than 74 cents,” Novakovic said. “They are not talking about changing the ‘average of’ back to the ‘higher of.’”
“As the COVID-19 experience has shown, market stresses can shift the mover in ways that affect dairy farmers much more than processors. This was not the intent of the Class I mover formula negotiated within the industry,” noted Randy Mooney, chairman of NMPF’s Board of Directors in a press release. “The current mover was explicitly developed to be a revenue-neutral solution to the concerns of fluid milk processors about hedging their price risk.
“Dairy farmers were pleased with the previous method of determining Class I prices and had no need to change it, but we tried to accommodate the concerns of fluid processors for better risk management,” Mooney stated further.
“Unfortunately, the severe imbalances we’ve seen in the past year plainly show that a modified approach is necessary. We will urge USDA to adopt our plan to restore equity and create more orderly marketing conditions.”
Modifying the adjuster every two years is backward-looking for forward-adjustments.
The current mover is already challenged by timing between Class I advance-pricing and Class II, III, IV announced prices as well as the higher protein production on farms in a system that prices protein in manufacturing classes but prices fat and skim solids in the fluid class.
In the Class III Plus proposal jointly announced by Wisconsin Dairy Business Association, Edge Dairy Farmer Cooperative, Minnesota Milk Producers Association and Nebraska State Dairy Association, advance pricing of Class I would also be ended.
The mover would be linked to the Class III announced skim price, not the advance skim pricing factor. The proposal includes an adjuster that would be revised annually in September by USDA for the forthcoming calendar year. It would equal the average of the monthly differences between the higher of Class III and IV skim milk prices, and the Class III skim milk price during the prior 26 months.
This adjuster would be floored at 36 cents just for the 2021-25 period “to facilitate faster convergence toward revenue-neutrality after COVID-19,” according to the announcement.
For its part, NMPF states that, “The significant gaps between Class III and IV prices that developed during the pandemic exposed dairy farmers to losses that were not experienced by processors, showing the need for a formula that better accounts for disorderly market conditions.”
To be sure, all FMMOs also saw gaps and inversion for three to six months in the pre-pandemic summer and fall of 2019.
When asked about the FMMO purpose and the ‘mover’ being set at the higher of to move milk to Class I use, Novakovic said USDA would have to look at the actual effect of the ‘average of’ on that purpose.
“Do we see any problem getting milk into Class I markets? Are they complaining there is not enough milk going to Class I?” he asks. “Probably the opposite direction is more true.”
Moving milk to Class I may be more of a discussion for the high fluid utilization areas of the Southeast, where producers end up indirectly ‘paying’ to bring milk in during deficient times of the year. This can be costly when there are price gaps and inversions as documented in the fall months of both 2019 and 2020.
When asked what recourse dairy producers may have in this, Novakovic indicated that lobbying the legislature is “theoretically possible” but that a legislative change is not likely apart from the next Farm Bill, which is three years away.
He also speculated that if someone put forward a proposal to return to the higher of for the next two years — and referred to the reasons given by USDA in its 2000 hearing decision – it’s “not inconceivable” that USDA could say they like what they had better than what Congress made them do, and perhaps like it better than changing adjusters or other ‘new’ proposals that would require a more lengthy hearing process if the industry is divided.
Novakovic was also asked how the Class III Plus proposal from the Midwest would affect Pennsylvania, given the state’s mostly Class I and IV utilization.
He responded to say Pennsylvania is part of FMMOs that include Class III (Northeast Order 1 and Mideast Order 33). He did not see any particular effect for the Northeast markets.
“Class IV would still be Class IV and II will be driven by IV values, and III would be unaffected, so the only question is what you would see happening with Class I,” said Novakovic. “The only way I see this proposal being viewed as a surprise is on the occasions when IV is higher than III, and that has occurred with some frequency in the past.”
The Northeast FMMO has seen a decline in Class III percentage relative to increase in Class IV and II over time. Class I sales also declined precipitously over the past decade but stabilized in 2019 and 2020 with rising sales of whole and 2% milk.
Novakovic confirmed that part of the problem in pricing Class I is the lack of beverage milk market indicators to do so.
As mentioned previously in Farmshine, Class I is required to participate in FMMO pooling, other classes are voluntary. Class I also has regulation at some state levels. On the other hand, in most states, beverage milk is used as a loss-leader in supermarkets, especially as large processing retailers dramatically cut the gallon price to compete for shoppers.
Under these factors, there is no way to gauge a ‘market value’ for Class I beverage milk apart from piggy-backing the other classes that value milk’s components in the manufacture of cheddar, butter, nonfat dry milk and dry whey.
The issue at hand is how to do that, now, in hindsight, after a significant surgical change was quietly made, and failed, and in the future within the context of FMMO reform.