Market fundamentals suggest favorable forecast, yet uncertainty jars milk futures markets

Editorial AnalysisTumultuous 2024 spills over into 2025 – Part Two

By Sherry Bunting, Farmshine, January 17, 2025

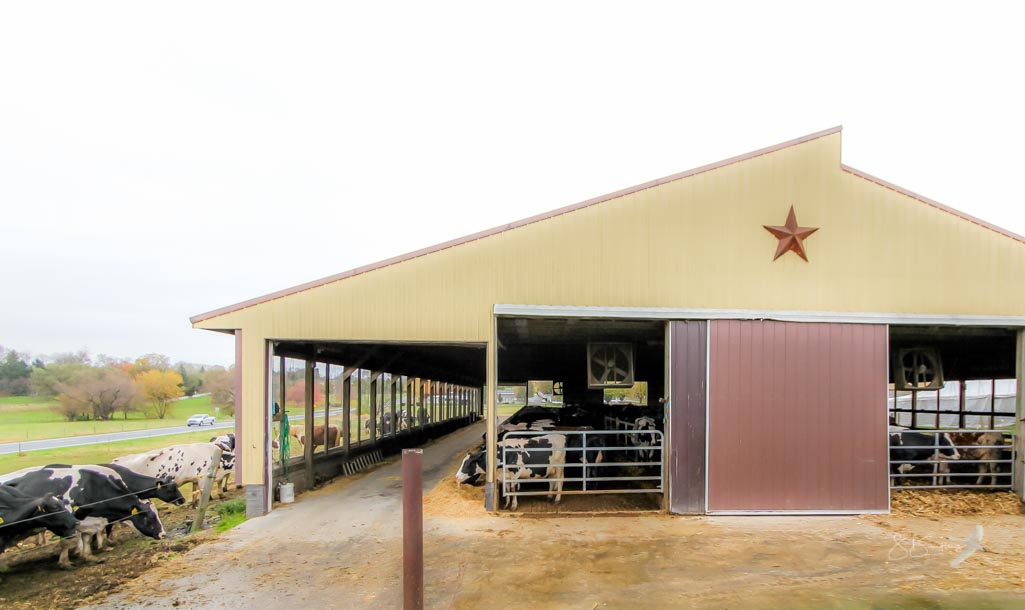
EAST EARL, Pa. – Year 2024 was tumultuous, and 2025 is shaping up to be equally, if not more so. Here’s a look at how supply, demand, and other market factors are shaping up for milk prices and dairy margins heading into 2025. This is part two of a four part series, see part one here and part three here.

We are a few weeks away from a few key yearend reports that will give us a better handle on production and cattle inventories, but the current market fundamentals favor a forecast for higher milk prices into 2025.

Better prices

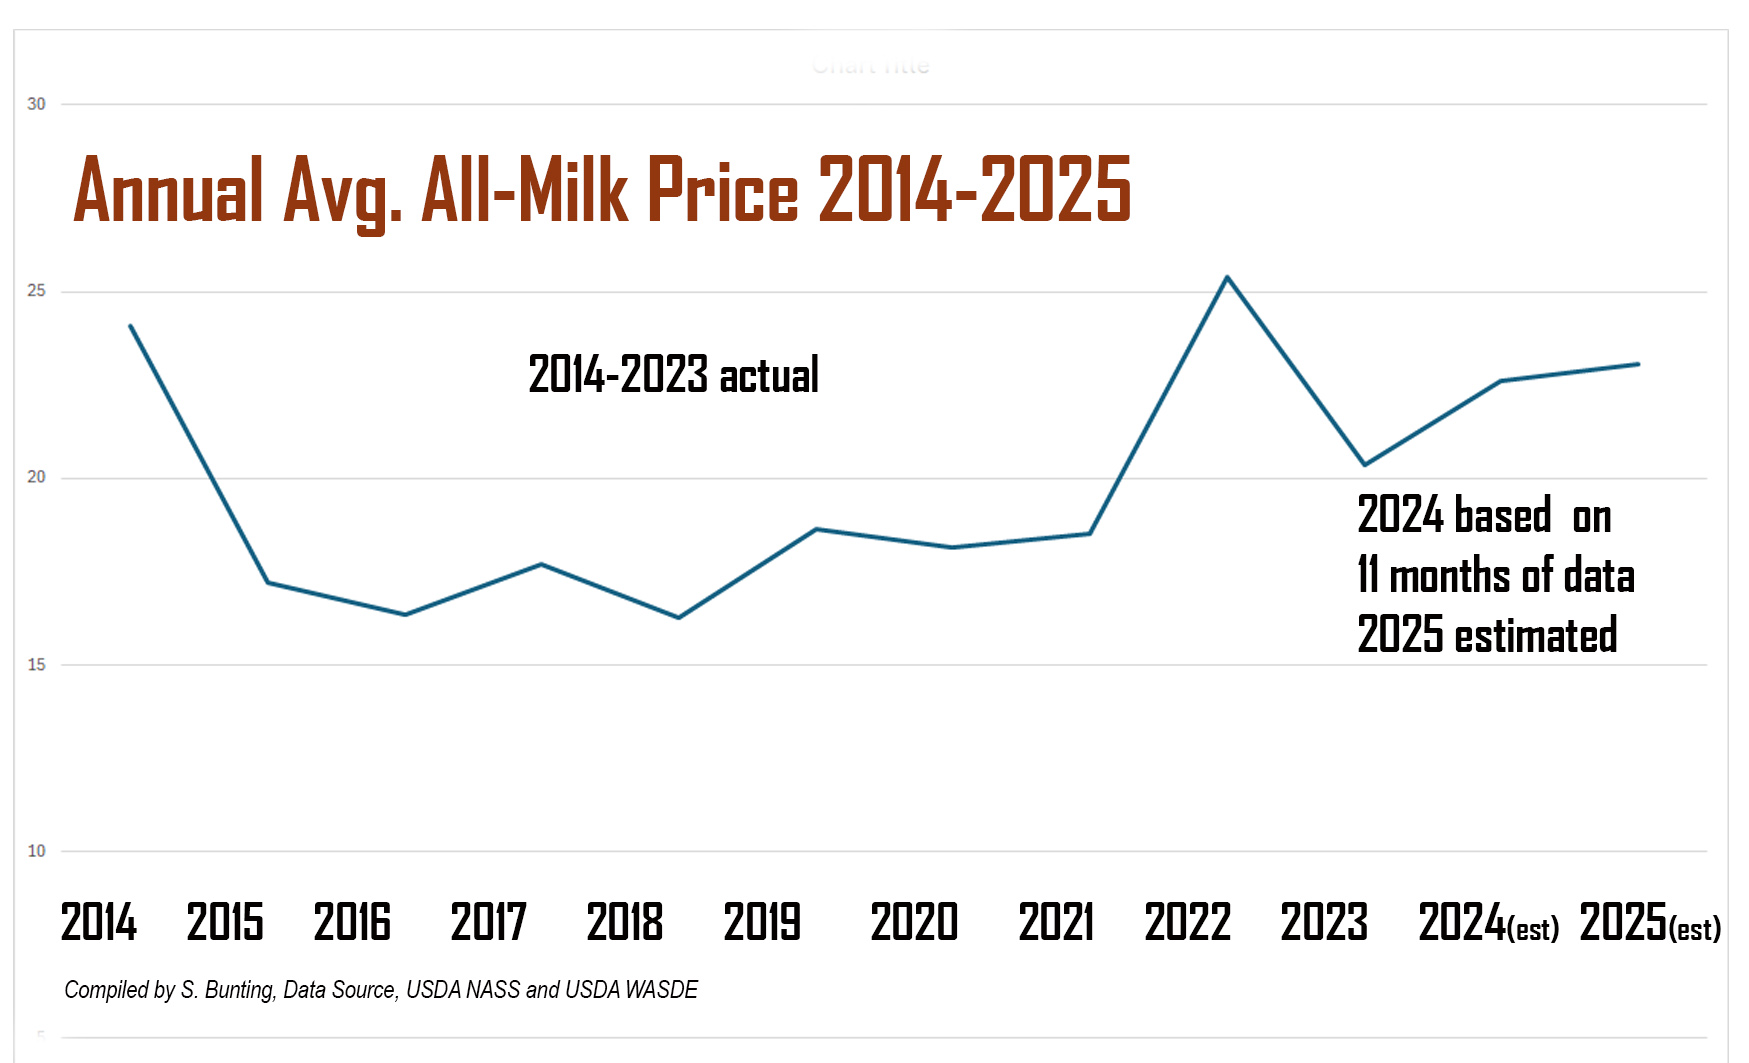
In fact, the Jan. 10th World Agriculture Supply and Demand Estimates (WASDE) just raised by 50 cents per cwt the estimated 2025 All-Milk price average at $23.05 after having lowered it the month before.

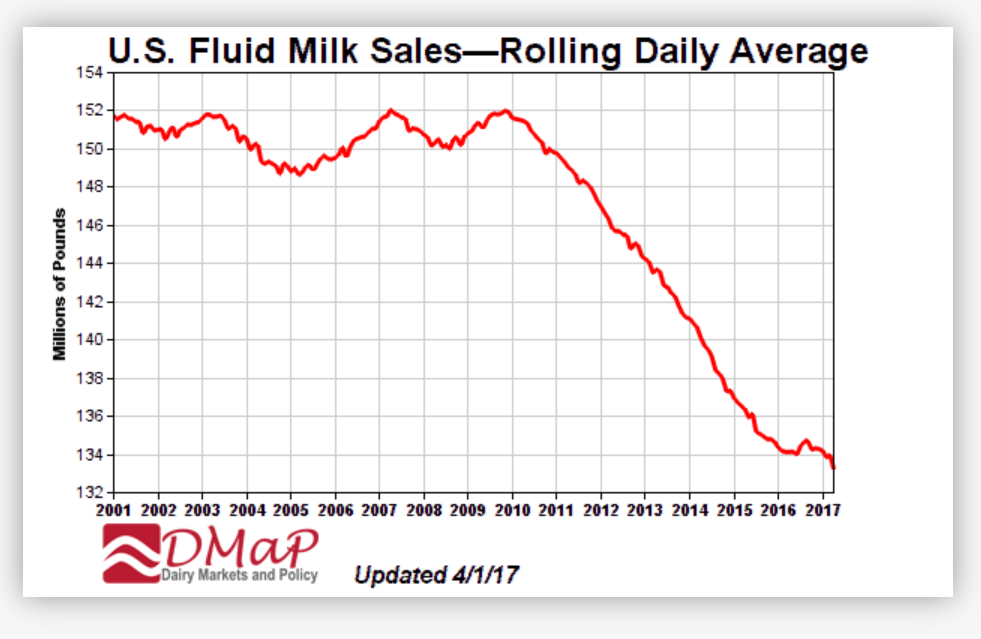
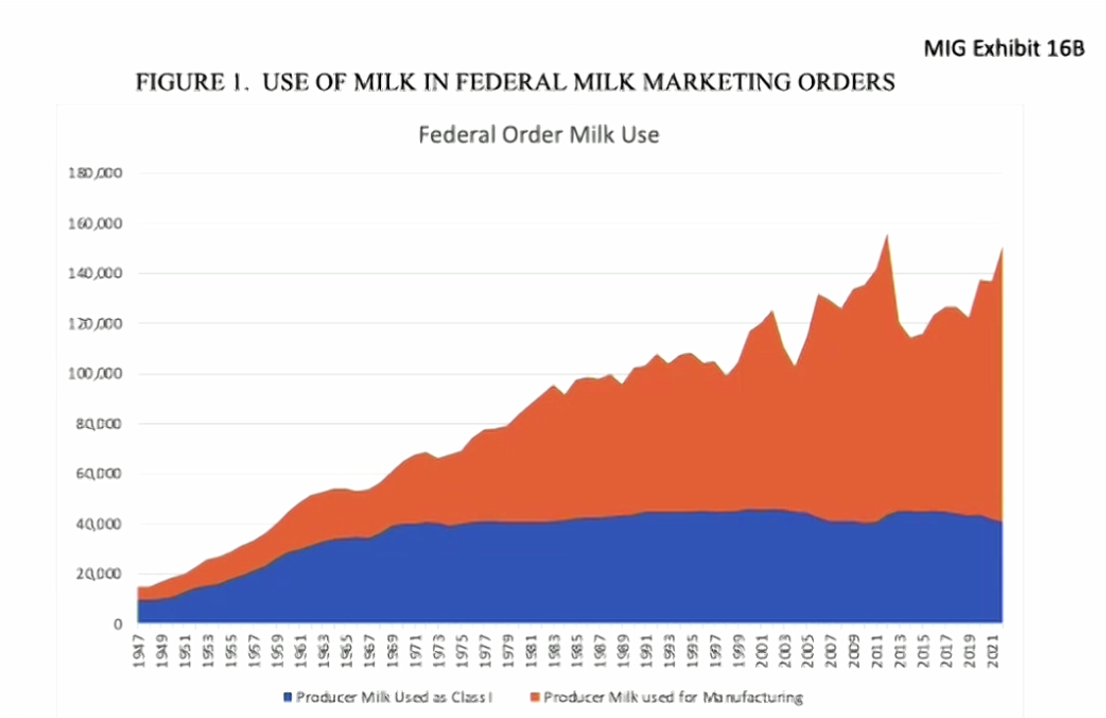
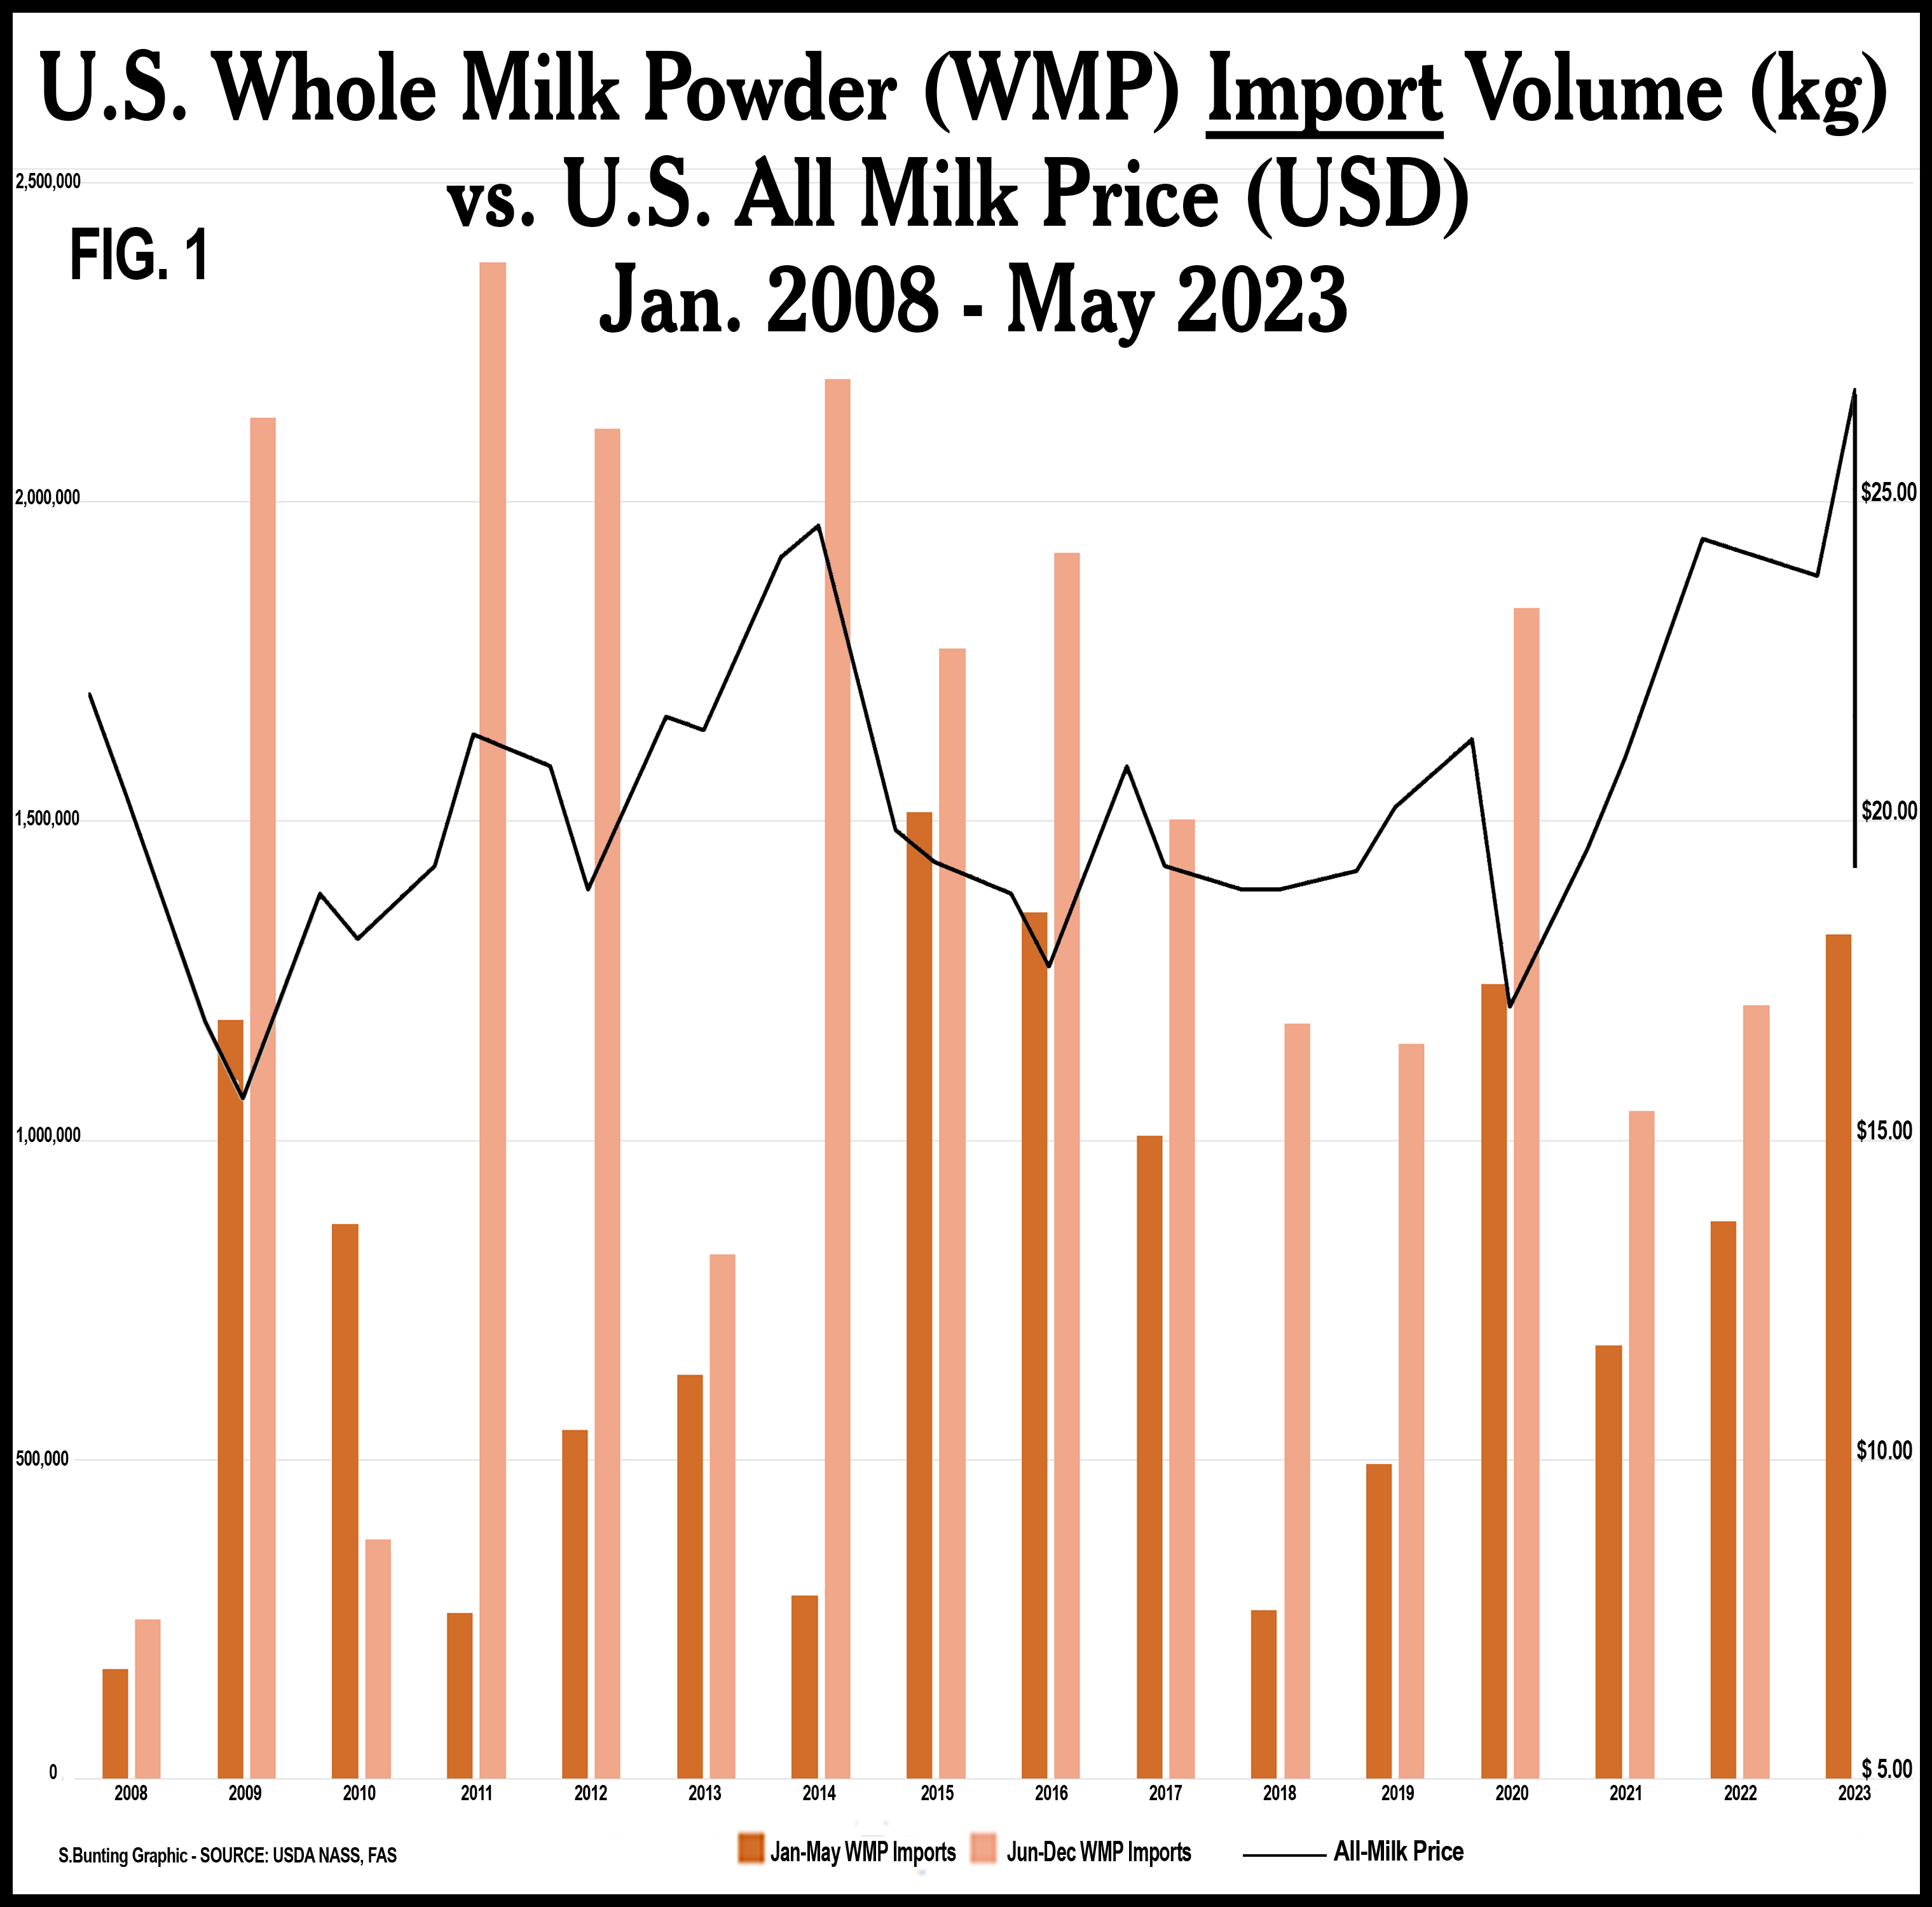
Based on 11 months of official data, however, the January WASDE shaved another nickel off the 2024 average All-Milk price, now estimated at $22.60, which would be $2.20 higher than the average All-Milk price of $20.40 for 2023 but $2.80 lower than the decade’s high point of $25.40 in 2022.

At an estimated $22.60, the average All-Milk price for 2024 would be the fourth time in the past decade and the third consecutive year that the annual average All-Milk price was above the $20 mark. (Fig. 1).

Strong demand

Positive supply and demand fundamentals for 2025 include the reported strong domestic and international demand for cheese and butter; tighter than expected milk supplies; tight to adequate dairy product inventories; growth in year over year (YOY) sales of fluid milk; and strong domestic demand for skim solids in the form of nonfat dry milk, dry whey and whey protein concentrate coupled with reduced production of these products limiting the availability for export.

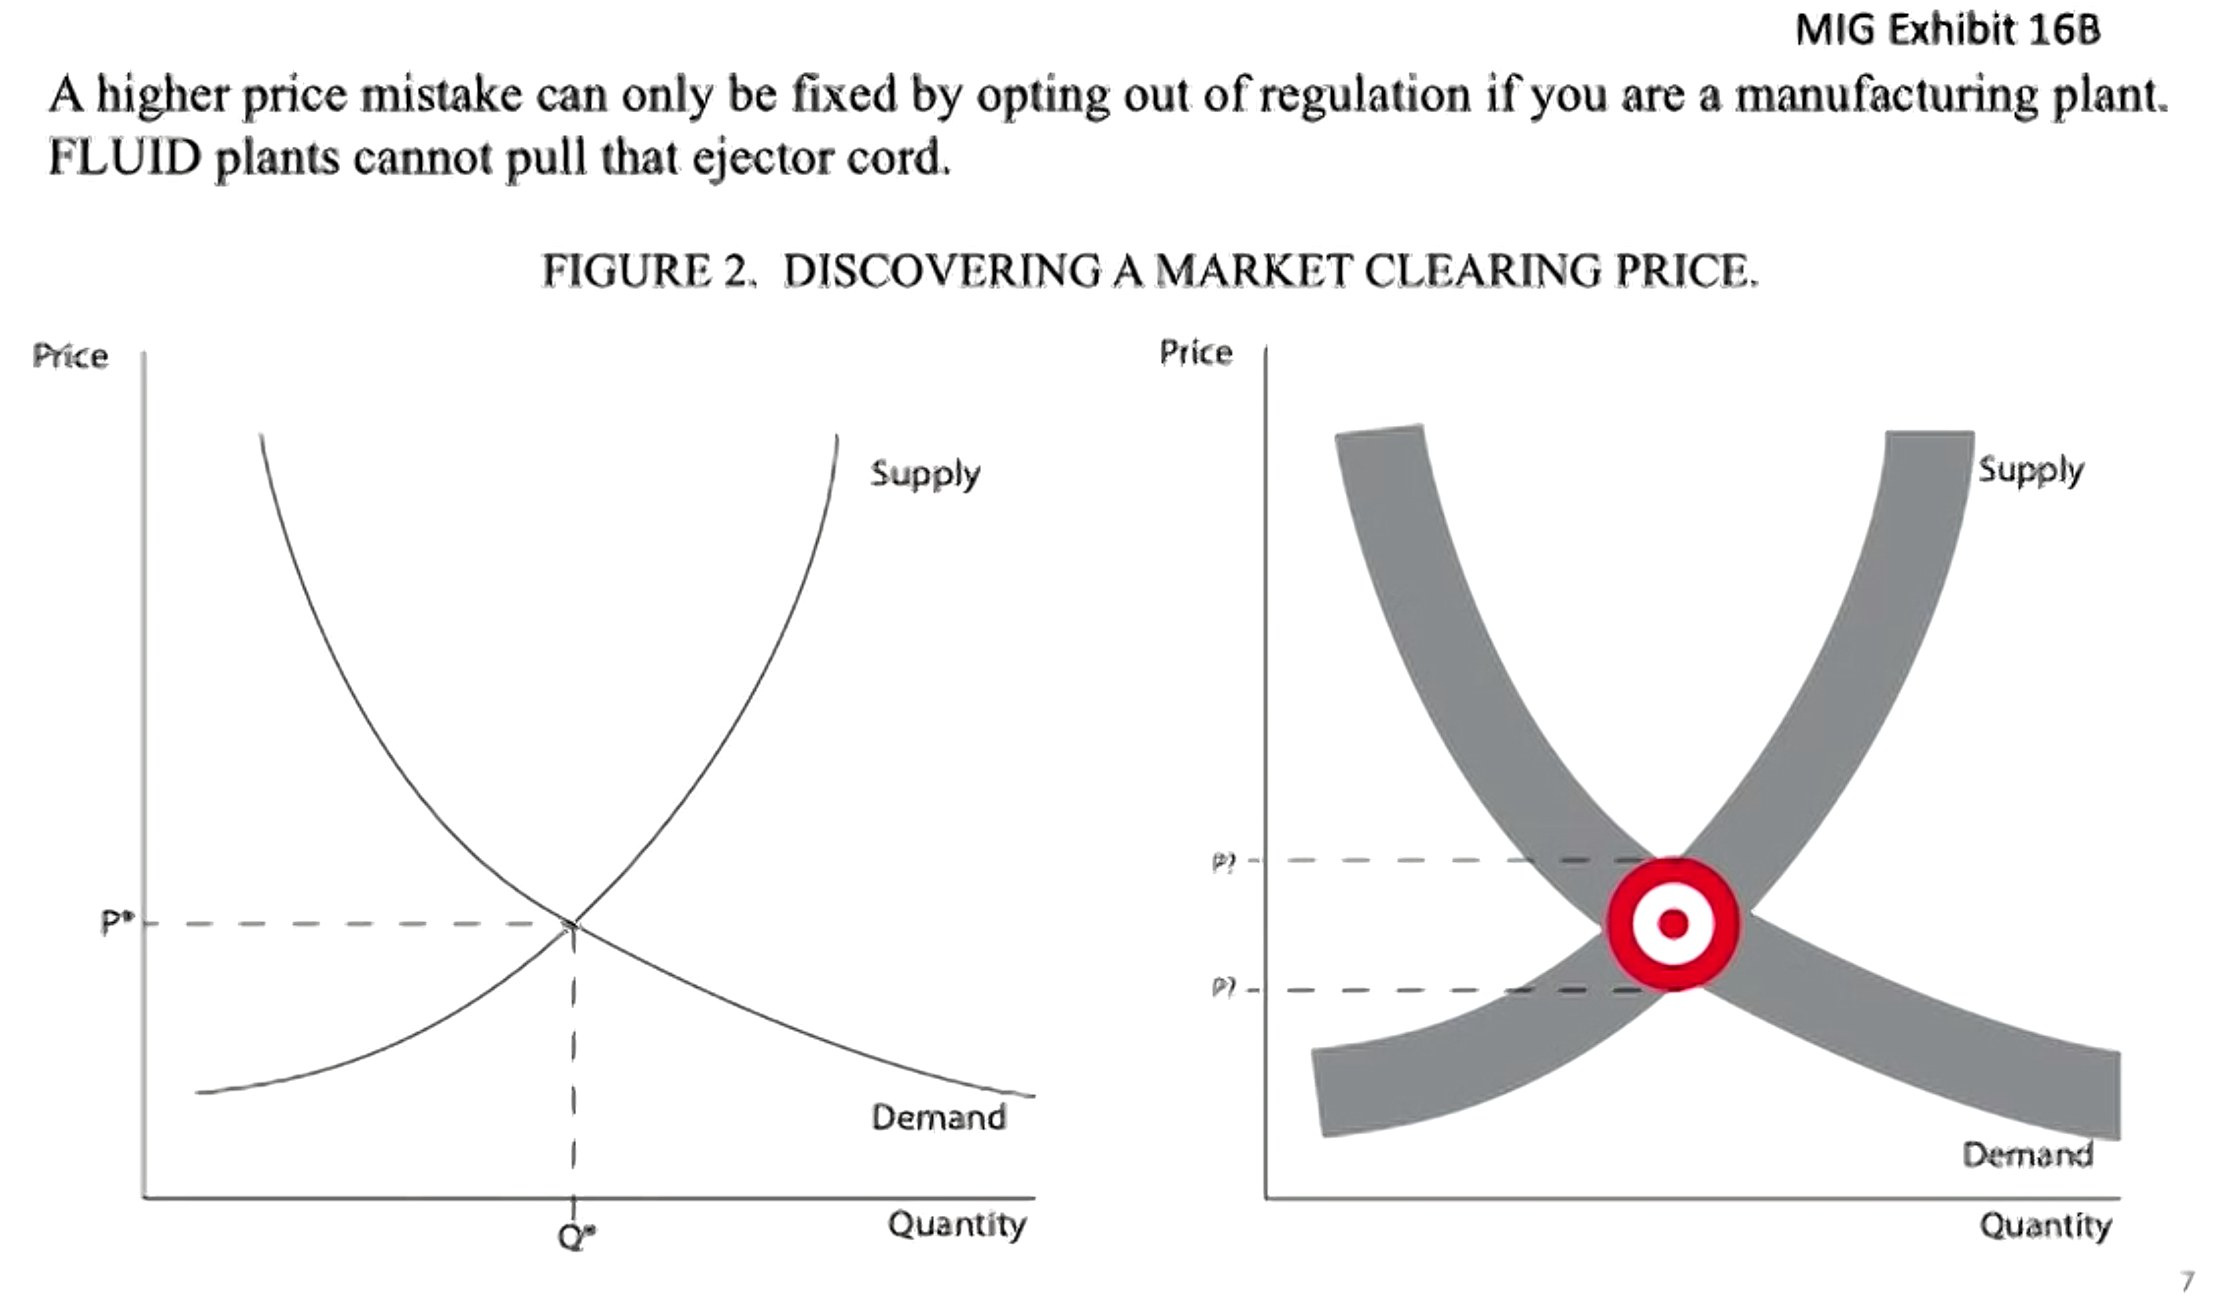
A sustained price rally in the CME spot market-clearing price for the market indicator product dry whey reached a multi-year high of 75 cents per pound by the end of the 2024 and is holding at near 74 cents per pound into mid-January. Trouble is, this market-clearing price has been tardy all year in translating to sales reported on the USDA weekly price survey used in the Federal Milk Marketing Order (FMMO) price formulas.

Despite the positive supply and demand fundamentals, we saw fourth quarter 2024 milk prices decline $1 to $1.50 from the year’s high point at $25.50 in September, and even though dairy products are holding steady on the CME spot cash markets, the CME milk futures markets took a tumble into below-$20 territory across the board this third week of the New Year. 

So what’s the deal? Uncertainty.

Fewer cattle?

Uncertainty prevails about future cattle inventories after Sec. Vilsack canceled the mid-year 2024 Cattle Report last summer. The Jan. 1 Cattle Inventory Report comes out Jan. 31st. It’s unlikely to show any big surprises in the two-year trend toward reduced cattle numbers, including dairy replacement heifers. USDA says this report will give the trade an indication of producers retaining dairy heifers for their milk herds. 

With prices skyrocketing $800 to $1200 per head above year ago levels for fresh cows and springing, bred, and open heifers, a sudden rise in replacement heifer numbers is unlikely. 

Meanwhile, beef-on-dairy calves continue to give dairies an immediate $800 to $1000 check on a 3-day-old bull calf requiring very little input cost. That’s $900 in income per cow for dropping a calf, even before she starts her lactation.

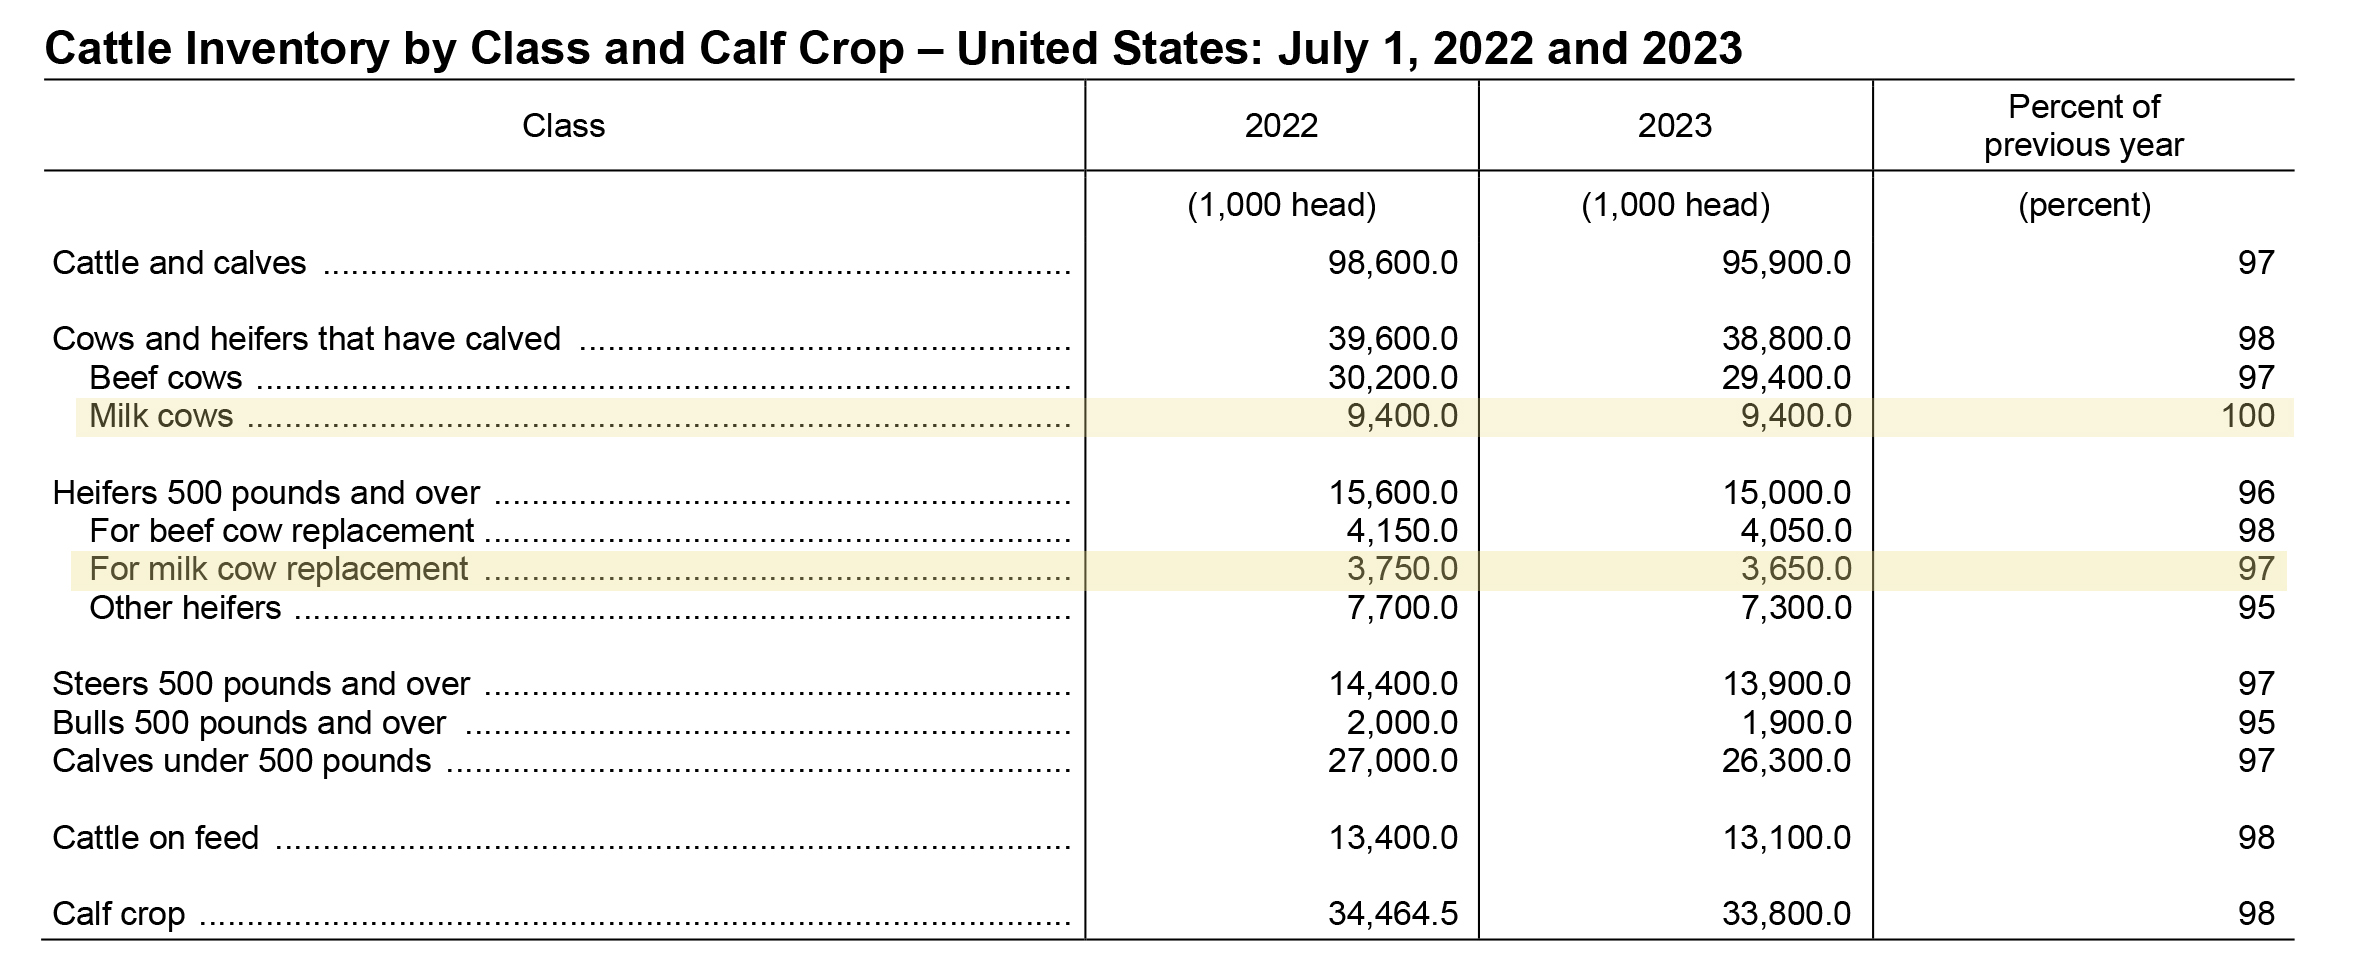
The tug-of-war on breeding decisions for future dairy farm calf crops continues as the total U.S. beef and dairy calf crop, by the way, has already declined 1.6 million head in the two year period from Jan. 1, 2022 to Jan. 1, 2024. On Jan. 31st, we’ll see what the Jan. 1, 2025 numbers say.

Global trade

Uncertainty also exists around global trade amid ‘tariff talk’ against the backdrop of YOY growth in export volume, that is tempered by YOY growth in import volume. The January WASDE expects the trend of export volume growth to continue, but also expects the larger import volumes to continue. While the report specifically mentions cheese and butter, USDA FAS data show growth in the imported volume of skim milk powder, and especially YOY growth in whole milk powder (WMP) imports in each of the past four years.

FMMO changes

Uncertainty about the implementation of USDA Federal Milk Marketing Order (FMMO) price formula changes in the second half of 2025 that will impact risk management. The updated make allowances will trim class and component index prices by 75 cents to $1.00 against a CME milk futures markets that bases contracts on the FMMO formulas. That changeover will have to be dealt with.

Uncertainty about how new, efficient expansions of cheese and ingredient production capacity may be tied into sourcing from multi-site dairy farms that have planned expansions with internal heifer replacement models. What will be the impact on the rest of the industry when they start cranking out tons more cheese on the new and higher make allowance margin.

H5N1 impacts

Uncertainty about milk production trends after the impact of the bird flu outbreak in California dragged down total U.S. milk output well below expectations. The next report for December milk output will be released on Jan. 24th.

The January WASDE reduced its total milk production forecasts for 2024 and 2025, driven by “lower milk cow inventories and lower expected milk output per cow.”

This came on the heels of the November milk production report released in late December, showing California’s 9.3% drop in state-wide milk output, attributed to HPAI H5N1 hitting at that point half of the state’s dairy herds. This drove the total U.S. output down an unexpected 1% YOY.

The WASDE also forecasts “slower growth in output per cow” in its rationale for reducing the milk production estimate for 2025. This means what producers have been reporting is now showing up in the USDA data. Producers in areas hit by H5N1, especially California, report an initial 30 to 40% herd level production loss that only comes back about half-way, six to eight weeks later.

Producers also indicate a 2% increase in herd-level mortality and increased culling. Both veterinarians and producers in previously affected areas are now reporting impacts on dry cows and springing heifers, aborted calves, shaved production peaks, and emerging questions about milking performance in the following lactation.

According to APHIS data, as of Jan. 10, the virus was detected in 708 dairy herds in California since the outbreak was first reported there in September. That’s nearly 75% of the state’s dairies affected to-date. In the past 30 days, 66 California herds have been affected, with the most recent detection on Jan. 10.

Apart from the California outbreak, the only other detections of H5N1 on U.S. dairies in the past 30 days is one herd in Michigan on Dec. 30. This is good news, considering that 13 states have now been fully brought into the National Bulk Milk Testing Program announced on December 6th as a mandatory program for all 48 continental states. 

Those initial states include California, Colorado, Indiana, Maryland, Michigan, Mississippi, Montana, New York, Ohio, Oregon, Pennsylvania, Vermont, and Washington.

Better margins

For 2024, the milk over feed cost margin only fell below the Dairy Margin Coverage (DMC) program’s highest payment trigger level of $9.50/cwt in the first two months of the year. In fact, Sept. 2024 saw the highest DMC margin on record at $15.57 with an All-Milk price of $25.50 and a feed cost at $9.93. Since then, Q4 margins have declined to $14.50 as the All-Milk price fell and feed cost remained fairly constant.

This measure does not account for the higher fuel and energy costs, higher labor costs, rising cost of insurances, higher interest rates on capital, and generally higher costs for other inputs that keep a dairy farm going.

Labeling games

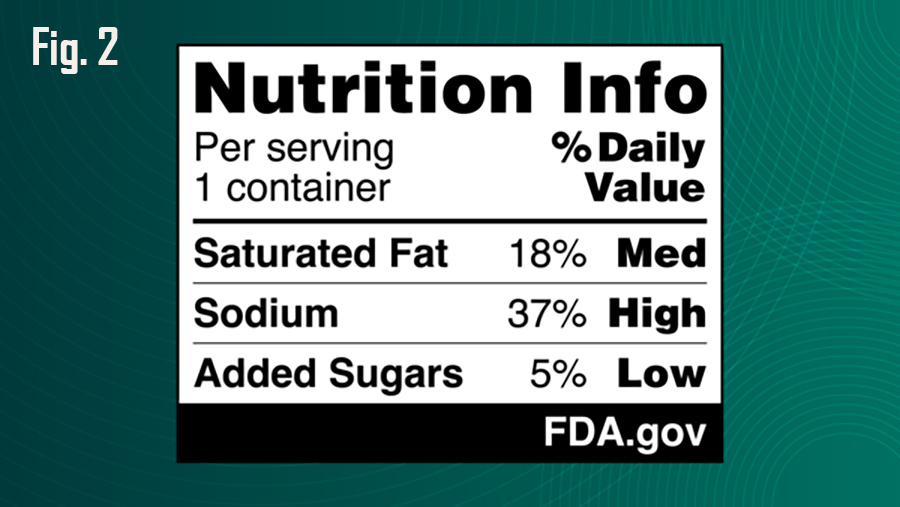
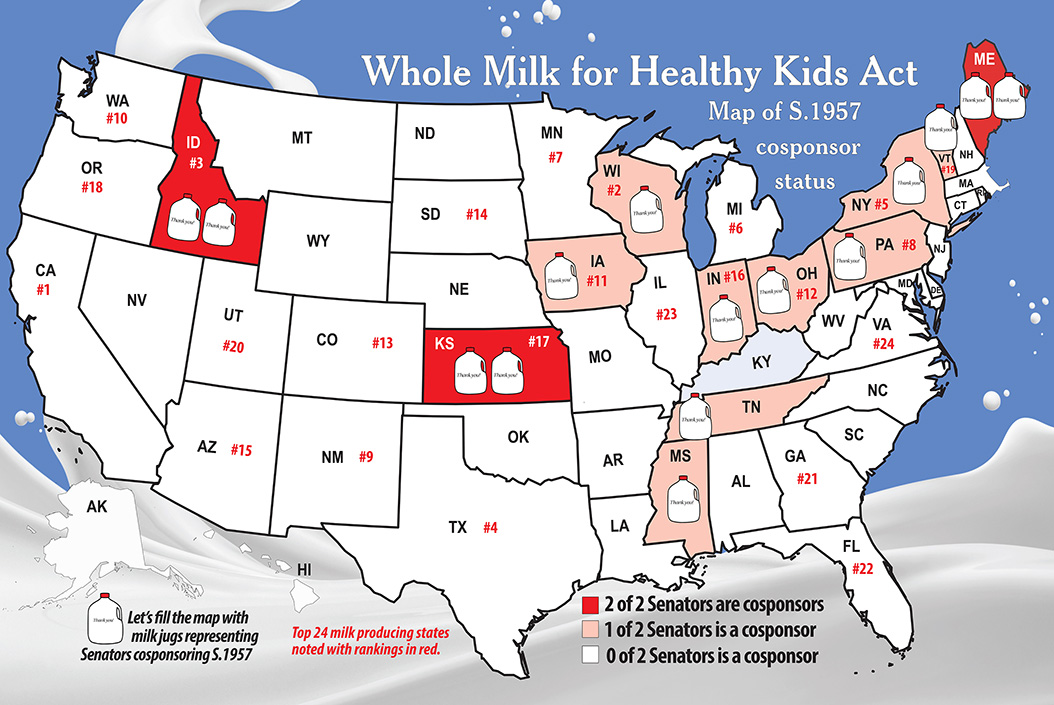
Other market factors may increasingly play a sidebar role. On the demand side, FDA’s new draft rule on Jan. 14 requires front-of-package labeling (Fig. 2 example above), which in addition to listing grams of saturated fat and percent of total recommended daily value, will now use a rating system to mark the saturated fat content of foods and beverages as high, medium, or low as the outgoing Administration attempts to further push consumers into the low-fat Dietary Guidelines regime.

Despite the noise around low-fat and anti-animal, USDA reports strong demand for real beef and dairy, with whole milk the top volume growth category in the fluid milk market.

FDA also issued new draft guidance on Jan. 14 for ‘best practices’ in naming and labeling of fake plant-based foods that are marketed and sold as alternatives for animal-derived foods. This guidance applies to fake meat, eggs, seafood, and dairy products, but does not include the labeling of fake beverage milk. FDA reminded the trade of its 2023 draft rule for plant-based fake milk.

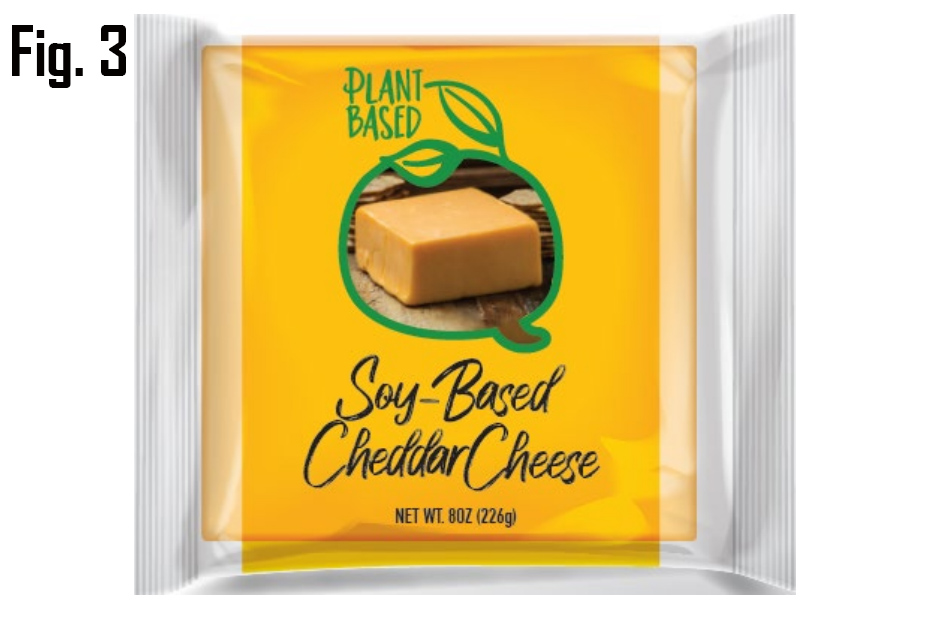
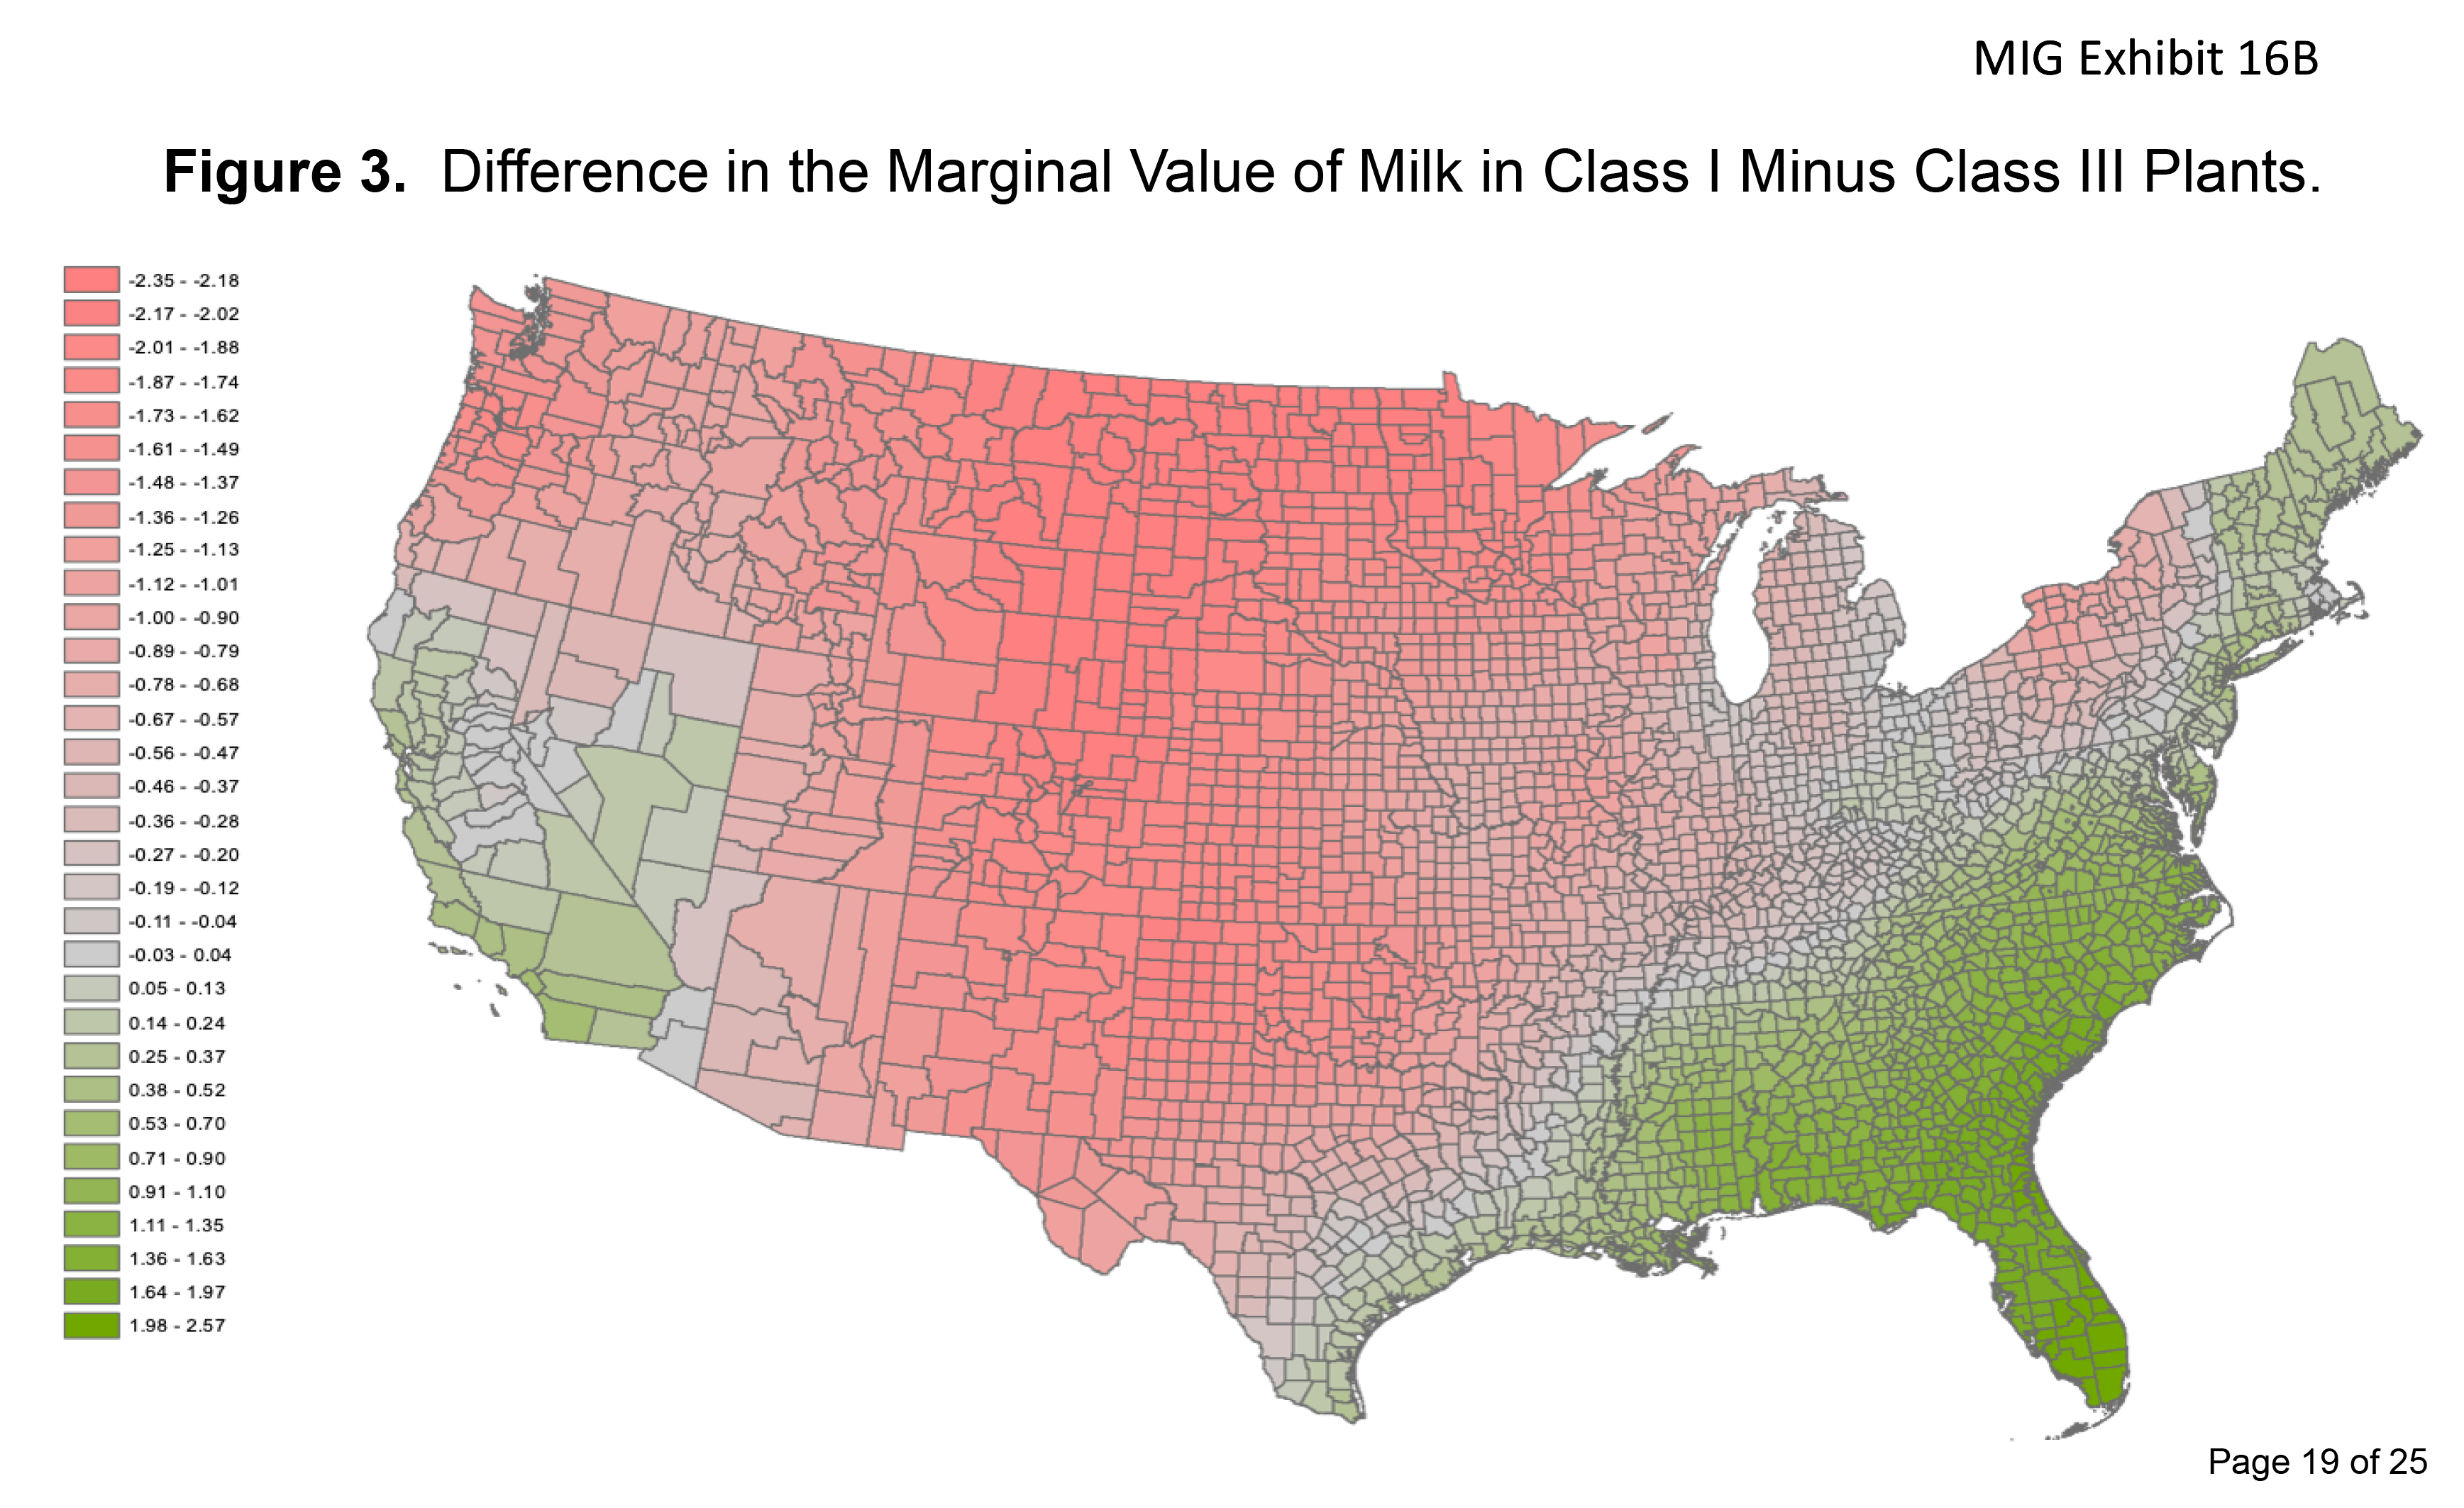
his follows the same pattern as the previous fake milk guidance – recommending that the plant-based food be “qualified by type of plant source” when using the name of a standardized animal product such as cheese or beef. (Fig. 3 above)

This is how FDA has treated fake milk for the past 15 years, by allowing for example, the ‘almond’ qualifier in front of the word ‘milk.’ The FDA’s 2023 guidance on milk, specifically, recommends, but does not require, additional nutrition statements to clarify nutritional differences.

Frankenfoods

Likewise, on the supply side, fake Frankenfood is emerging as FDA continues mulling a draft rule on what to call the products of lab-creation seeking to replace real animal-derived foods.

For dairy, this comes in the form of microbes bioengineered with bovine DNA to excrete fake dairy protein and fat analogs that USDA refers to as “precision fermentation protein products” while lab-created gene-edited cells growing into blobs of fake meat, egg, seafood, even dairy analogs are referred to as “cell-cultured” chicken, seafood, beef, dairy etc.

In late December, the USDA Economic Research Service (ERS) released its first ever report on “The Economics of Cellular Agriculture.” This means the Department has now recognized Frankenfood as part of the Agriculture domain. Yes, we’re talking about fake food from a factory, not a farm.

The 45-page ERS report notes that for 25 years, scientists in the public and private sectors have been “actively researching methods for producing food products that are physically and chemically equivalent to livestock- and poultry-produced foods (i.e., meat, dairy, eggs) but that minimally rely (if at all) on animals.”

By 2023, more than 200 private firms existed worldwide, and cumulative invested capital in the cell-culture and precision fermentation industries exceeded $5 billion. As of 2024, more than 100 patents have been filed. U.S. food agencies (FDA, USDA and FSIS) have been developing regulatory frameworks to accommodate and ensure the safety of these products, according to the report.

To-date cell-cultured fake chicken meat has been commercialized in Singapore and the U.S., largely through unique restaurant chains. This led to states like Florida banning the stuff.

Meanwhile, “precision fermentation-derived fake dairy protein analogs have been commer­cially available more broadly,” according to the ERS report.

These Frankenfoods tout smaller carbon footprints, less land and water usage, but ERS authors observe that, “Open questions remain concerning the design of bioreactors and important elements of the production process, including cell source, growth medium, and energy requirements, as well as the optimal size and configuration of production-processing plants.”

The report states so-called “precision-fermented dairy products are already on the market in the U.S., and, like their plant-based counterparts, sell for a premium over animal-based. For example, the company Perfect Day partners with other companies that sell products like ice cream and milk featuring their precision fermen­tation animal-free whey protein.”

In this way the fake dairy protein analogs are marketed as an ingredient in a business-to-business vs. business-to-consumer model. 

According to the ERS, precision fermented protein products (fake dairy analogs) are increasingly available in U.S. markets, while cell-cultured products (fake meat and seafood analogs) are not.

Short run profitability, according to ERS, will rely on consumer willingness to pay for these products with current consumer attitudes described as “mixed.” But the labeling guidance remains unclear as the fake dairy protein analogs are actually the harvested excrement of the bioengineered microbes, not the DNA-altered microbes themselves. Consumers need to know what they are buying.

The ERS report also states that despite some of these companies and investors releasing bold lifecycle ecosystem claims, the “environmental impacts are largely unknown.”

Part III in a future Farmshine will look at the yearend reports due later this month.

-30-

Seeds of doubt being sown, Part One, Confusion: ‘Will this bill really improve milk prices?”

By Sherry Bunting, Farmshine, Feb. 16, 2024

EAST EARL, Pa. — While decades of scientific debate in terms of childhood health and nutrition is the curtain opponents hide behind, the anti-animal agenda is the top hurdle for the Whole Milk for Healthy Kids Act in the Senate.

Senator Roger Marshall (R-Kan.) is the prime sponsor of the Senate bill, and he is a medical doctor in obstetrics and is taking a beating from billboards sponsored by Physicians Committee for Responsible Medicine (PCRM) in his home state of Kansas. PCRM is a known arm of PETA. This tells us quite a bit, doesn’t it?

Meanwhile, the top 3 C’s facing the bill within the dairy industry, itself, need to be addressed. 

1) Confusion… Will it really improve milk prices? Addressed in this article

2) Consternation (fear)… What will processors do with “all of that skim”? Addressed in Part II here

3) Competition… Will it reduce the butterfat supply and affect the ramp up in cheese manufacturing or other dairy products? Addressed in Part III here

Plus…. the Checkoff Commitments… Will it interfere with checkoff-funded Milk Molecules Initiative for new beverages that identify and separate specific milk molecules for specific benefits (sleep drinks, energy drinks, immune function drinks, specific protein type drinks)? 

All of these questions are quietly floating around and sowing seeds of doubt, leading to analysis-paralysis, while the industry focus is on innovation and exports, not on fresh milk, or a healthy next generation of U.S. milk consumers.

All of these questions will be answered one at a time over the next several weeks, starting with the first “C”: Confusion.

“Will this bill really improve our milk prices?” was the question I was asked by a few farmers at a recent farm show. My response was to ask them if they are concerned about kids having healthy milk options they enjoy and if they are concerned about seeing further erosion of fluid milk sales, and losing another generation of milk drinkers?

I reached out to Calvin Covington, former milk cooperative CEO in the fluid milk markets of the Southeast and a primary architect of pricing milk by component yield even before Order Reform during his years with American Jersey Cattle Breeders.

Covington ran the numbers using 2023 average prices, and calculating pounds of milk, fat, and skim, utilization, and values, which yield a gross value of a hundredweight of milk being used for fluid processing at different fat levels. 

“At a $3.00 Class I differential, a hundredweight of milk going for 3.25 fluid milk (whole milk as standardized), returns an additional 25 cents per hundredweight over skim milk,” Covington writes, noting that the difference will change based on different Class I differentials.

Even in the counties with small or zero location differentials on the map, the base differential of $1.60 per hundredweight is still included, which means at least a 13 cents per hundredweight difference.

Previously, Covington has noted in presentations that milk prices improve as the average fat level of total fluid milk sales increases. The current average of all sales, nationwide, stands at 2%. A few years ago, it was below 2%. A fractional change in either direction influences Federal Milk Marketing Order blend prices.

Fluid milk demand also plays a role in manufacturing class prices, affecting farmers in regions where prices are based almost exclusively on cheese. 

That’s especially true right now as cheese production has been exploding, and the Class III milk price has been imploding, creating a wide spread below Class IV and pushing FMMO blend prices lower as milk is not moving out of Class III to the higher value Class IV. But the Federal Milk Marketing Law gives Class I dibs to attract milk. So Class I demand is relevant for cheese milk pricing too.

As whole milk sales have increased year-over-year, whole milk became the largest category of fluid milk sales in 2021. It is a bright spot in the fluid milk category.

In 2023, gains in whole milk sales and in lactose-free milk sales are credited with boosting the entire fluid milk category for year-over-year gains in back-to-back months of October and November. This helped flatten the year-to-date loss-curve on total fluid milk sales that had been running 2 to 4% lower year-over-year to be just 1.5% lower cumulatively at year end compared with 2022, according to USDA’s December estimated packaged fluid milk sales report, released in mid-February.

Still, there is ground to make up, as fluid milk sales volume in 2023 is 7.8% lower than pre-Covid 2019, when volume totaled 46.24 billion pounds, down 1.8% from 2018. Then, during pandemic lockdowns, milk sales stabilized, putting the total at 46.2 billion pounds for 2020, virtually unchanged from 2019. In 2021, fluid milk sales volume declined 4.1% to 44.3 billion pounds, followed by a 2.4% decrease in 2022 to 43.3 billion pounds, and now a 1.5% decline in 2023 at 42.6 billion pounds.

NMPF chart, Circana Inc. full-year 2023 data

Meanwhile, the big news reported recently is that plant-based fake-milk beverages saw sales decline by 6.6% in 2023, the second straight year of declines and the smallest sales since 2019, according to data from Circana Inc reported recently. 

Real dairy milk sales volume of 42.6 billion pounds in 2023 is not only a much larger category than the lookalikes at 337.7 million pounds, real dairy milk outperformed lookalikes on a trend basis in 2023 — down just 1.5% vs. plant-based being down 6.6%.

By comparison, plant-based beverage sales volume in 2023 was a fraction of 1% (0.8%) the size of real milk sales volume.

Whole milk education and awareness have helped drive this result. Consumers are paying attention to food science, even if the Dietary Guidelines Advisory Committee, USDA (and FDA on labeling) continue to ignore it. Still, more education and freedom for children to enjoy milk is needed. The concern is that even though it is a smaller percentage loss, the 1.5% sales volume loss in the real milk category in 2023 represented 644 million pounds; whereas a 6.6% sales volume loss in plant-based beverages in 2023 represented 24 million pounds.

Speaking with a local milk bottler and ice cream maker recently – a producer handler – I learned he focuses on how his cows are fed to maintain their rolling average 5% butterfat during the summertime to make ice cream and satisfy consumer demand for whole milk. Their whole milk sales have skyrocketed, and this in turn, to the delight of the grocery store they are in, has helped boost sales of all fluid milk as a category in that store.

This has him thinking of doing a 5% butterfat, non-standardized, maybe even cream top, full-fat milk in glass bottles for the store. The store displays a 97 Milk banner at the entrance and 97milk.com website stickers at the dairy case.

Speaking with a manager at a different grocery store chain with stores in Pennsylvania and surrounding states, I learned their sales of whole milk have also increased by leaps and bounds in the past several years, boosting the entire fluid milk category by 14% at their stores throughout the region. They include the 97milk.com website and information in their sales circulars to their shoppers.

As for the schools — If even half of the schools offered a mix of milkfat choices as the Whole Milk for Healthy Kids Act would allow them to do, the amount of butterfat sold as Class I would increase. This would improve the fat side of the fat/skim pricing in the three Southeast Orders and Arizona. It would also help the Federal Order pool dollars reach after actual components are paid first in Multiple Component Pricing Orders everywhere else.

Total Class I fluid milk sales have dropped like a rock since Congress passed the Healthy Hunger Free Kids Act in 2010, which removed whole and 2% milk options from school meals, followed by USDA in 2012 further banning whole and 2% milk as a la carte or vending machine ‘competing beverage’ options in the Department’s Smart Snacks regulations.

Look at the graph above. It was shared as part of Dr. Mark Stephenson’s testimony in the recent USDA FMMO milk pricing hearing.

Improved total sales of school milk hold potential to increase total Class I fluid milk sales. A Pennsylvania school trial in 2019 showed a 52% increase in milk sales when whole and 2% milk options were offered. Students showed a 3 to 1 preference for whole milk over the 1% milk option.

When their options were expanded, more students chose milk instead of refusing it. Students were able to choose, and some of them continued to choose low-fat, and that’s okay! The Whole Milk for Healthy Kids Act is about choice.

A conservative estimate of a 25% increase in school milk sales can be anticipated if Whole Milk for Healthy Kids gets over the finish line in the Senate after its overwhelming passage in December in the House. That is half of the increase seen in the Pennsylvania school trial. If realized, a 25% increase in school milk sales equates to a little over one billion pounds of additional annual milk sales, which could raise the entire Class I fluid milk category by a little more than 2%.

This is based on the fact that kids aren’t just throwing away milk at school. Some are refusing to take the milk they are offered with school meals. This means sales are being lost.

Fluid milk sales declines will only get worse if USDA implements one of two draft proposals the Department announced a year ago. One would eliminate flavored milk from elementary and middle schools altogether. The other would require added sugar levels to be reduced dramatically in flavored milk at school. It’s widely known that when milkfat is retained in making chocolate milk, less added sugar is needed! 

Demand for whole milk is beneficial on both the milk fat and skim sides of the equation because whole milk sales move the nearly-complete product – the skim with the fat — leaving some of the fat through standardization, but not leaving any skim.

The result of these options in schools could be even better depending on how many schools choose to exercise these options.

If the industry doesn’t supply what consumers demand, sales are lost. Schoolchildren are already the dairy industry’s consumers, and they will hold the purse strings in the future.

Just as the Dietary Guidelines Committee and USDA continue to ignore science on milkfat, we are all ignoring our nation’s schoolchildren and what they are telling us about why they are turning away from nutrient-dense milk at a time when the nutrients milk delivers – that we may think they are receiving — have never been more important.

When the Pennsylvania school trial ended after one school year, a 95% reduction in the average daily volume of discarded milk was recorded. The school Student Council did an environmental project to measure this by measuring the volume of milk thrown away in unopened and partly consumed half-pint containers.

Shouldn’t we be listening to what the young people are telling us? They are our future, after all.

In the next part of this series, we’ll address the question: “What are the processors going to do with all of that skim?” Oh my!

In the meantime, consider this: Fresh fluid milk is the most notably locally-produced dairy product maintaining dairy farm relevance in regions and communities across America. What will the dairy industry look like five years from now, even one year from now? Maybe we should be asking the schoolchildren to answer that question.

As of Feb. 14, 2024, the Whole Milk for Healthy Kids Act, S. 1957, has 15 sponsors from 12 states as illustrated on this map. Graphic by Sherry Bunting

USDA FMMO hearing resumes, Dr. Stephenson testifies for MIG proposal to end $1.60 Class I base differential

USDA’s cross examination reveals possible flaw in simulator model result

By Sherry Bunting, Farmshine, Jan. 19, 2024

CARMEL, Ind. — Shadow pricing, demand elasticity, commoditized loss of prior incentives, balancing cost, give-up cost, base differential, uniform differential, market-clearing price…

These terms ruled the day when the USDA National Hearing on Federal Milk Marketing Order (FMMO) proposals resumed in Carmel, Indiana this week after a more than four-week recess.

The hearing began in late August. It did not conclude by Fri., Jan. 19, so it will again recess until Jan. 29. 

American Farm Bureau estimates that another 270 days of post-hearing processes must follow before a USDA decision could be implemented, and even this is subject to proposals that seek a 15-month delay between decision and implementation due to potential impacts on CME futures-based risk management tools, such as Dairy Revenue Protection (DRP).

This is far from over, and hanging in the balance is the Class I price calculation, now based on an averaging method, under which farmers have lost more than $1.02 billion since May 2019 vs. the previous ‘higher of’.

Testimony Tues., Jan. 16 included Dr. Mark Stephenson, retired UW-Madison dairy economist on behalf of Milk Innovation Group (MIG), made up of ‘innovative’ and branded fluid milk processors, including fairlife, HP Hood, Anderson-Erickson, Danone North America, Shamrock, Organic Valley, Aurora Organic, and Pennsylvania’s own Turner Dairy Farms.

Dr. Stephenson delivered his bombshell for MIG that was based on analysis he did using 2016 data in a simulator model, from which he made “certain discoveries.”

First, Stephenson suggested that fluid milk is shifting to become price-elastic vs. the long-held belief that fluid milk sales are price-inelastic. This was followed up by fluid milk processor representatives showing post-Covid fluid milk sales volumes declined as prices rose.

Stephenson cautioned USDA to refrain from setting regulated prices too high, saying this would reduce returns to producers by reducing total fluid milk sales. 

This suggestion was challenged in cross examination. In fact, AFBF chief economist Dr. Roger Cryan noted the FMMO focus on fluid milk was originally partly predicated on its “public good” as a food staple, almost akin to a “public utility.”

In cross examination on Jan. 17, Stephenson also revealed he was paid by MIG to analyze the $1.60 base differential, and his work began before MIG finalized its proposal to remove the $1.60 per cwt. base differential all the way down to zero for all Class I milk, nationwide.

Currently, the $1.60 base differential is built uniformly into the Class I price for every regulated county across all FMMOs. The varied location differentials are added to the base differential and spread across the revenue-sharing pools.

Stephenson used the U.S. Dairy Sector Simulator Model (USDSS) to develop a map as though a “milk-dictator” could efficiently “move milk to its highest global use” through various constraints. 

In the marginal value map result, Stephenson said the U.S. average value of the differences was minus-38 cents, indicating on a national average, it is more valuable (cost saving) to the model to have milk in a cheese plant than in a fluid plant in most counties. The range goes from somewhat more than $2 per cwt more favorable to a cheese plant (in red) to somewhat more than $2 per cwt more favorable to a fluid plant (in green) in the Southeast. From this “potent revelation,” Dr. Stephenson concludes that, “The model result bolsters the argument to not dilute the value of the $1.60 into the pool if that value represents a balancing cost for fluid and an opportunity cost (give-up) for manufacturing plants. Rather, require the fluid plants to pay the $1.60, but let the fluid plants pay that directly to the farms, cooperatives or manufacturing plants who supply the milk” to the fluid plant.

The map showed the incremental differences in ‘Class I minus Class III “shadow pricing,” across the country.

These marginal value differences, said Stephenson, reflect the opportunity costs of getting manufacturing plants to give up milk to fluid plants in the Central U.S., where milk production exceeds population vs. the cost to balance fluid milk markets in the East, particularly the Southeast, as well as in California and southern Nevada, where population exceeds milk production.

It was the questioning from USDA AMS administrator Erin Taylor on the ‘shadow pricing’ figures in various anchor cities that prompted Stephenson to concede: “You may have caught a major flaw in what I have done here, so I would want to look at this more carefully.”

Yes, he will be back to address such questions when the ever-lengthening hearing resumes on January 29.

Notwithstanding exposure of a possible flaw in the simulator analysis, Stephenson said the ‘market-clearing’ price is the target to aim at, and the system of setting regulated minimum prices “should err on the side of being too-low instead of too-high.”

He said processors will pay premiums in the breach of a ‘too-low’ minimum price, but there are few options for processors to deal with a ‘too-high’ minimum price — other than to opt out of regulation for manufacturing plants (de-pool), but that fluid milk plants have no ability to opt out. They are required to remain regulated by FMMOs.

“Manufacturing is by far the largest use of milk in our dairy industry,” he said, noting that Class I fluid use at 18% of total U.S. milk production (regulated and unregulated). Therefore, he said, manufacturing use should no longer be treated in the FMMO system as “the trailing spouse in the marriage.”

On MIG’s behalf, he introduced a new way of looking at the marginal value between Class III and Class I, and a mechanical change that could be made in how the $1.60 base differential is paid as needed directly to producers, cooperatives and plants that actually supply milk to Class I plants, instead of being paid to the FMMO pools.

The $1.60 became a uniform part of the Class I price in the 1999 Order Reform. About 40 cents of this $1.60 was included to represent the cost of farmers transitioning from Grade B to Grade A. The rest represents ‘give up’ costs from manufacturing to Class I and balancing costs to serve the fluid market.

Stephenson backed up MIG’s assertion that farmers don’t need any of this $1.60 base differential because virtually all milk produced today is now Grade A. During cross examination, NMPF attorneys brought up the cost farmers have to maintain Grade A status. Don’t their costs count here?

Undeterred, Stephenson suggested that these costs are accounted for in the classified pricing since all milk for all uses is Grade A, today. He said that USDA uses ‘minimum pricing’ as a tool so that the regulated price leaves space for voluntary premiums that processors can pay to “incentivize something else.”

“Being chronically above the market-clearing price creates a surplus product, which the market can’t clear,” said Stephenson. “Our dairy markets have always walked on a knife’s edge. Being plus or minus 1% on milk supplies can cause some pretty big swings in prices as the markets do attempt to clear that.”

As for removing the $1.60 uniform price differential either from the price or the pool, Stephenson said it is like “other premiums” that have become “commoditized.” 

He likened it to the rbST premium and milk quality premiums, saying those premiums have also become “commoditized.” 

For example, when farmers were first asked to give up rbST and sign pledges, a premium was offered. Now, that premium is not paid, he said, because the practice of abandoning rbST is now “commoditized.” 

Likewise, said Stephenson: “Milk quality (low SCC) has improved so much that those premiums are not there anymore. They have also become commoditized.”

So, the better dairy farmers get, the more their incentive premiums — and even big chunks of their regulated minimum price — are at risk to be cannibalized by milk buyers because the farmers have now done what they’ve been incentivized to do, so they don’t need to be paid to do it.

MIG also seeks to stop NMPF’s proposal to tweak and raise location differentials across the Class I surface map, putting on the stand some of their members to show how unfair competition arises between independent bottlers and cooperatively owned fluid milk plants in the same region.

For his part, Stephenson noted the concept of pulling the $1.60 base differential out of the pool may discourage non-productive distant pooling.

This week was certainly eye-opening as MIG is all about the processor costs with zero regard for producer costs. They even put an HP Hood representative on the stand who included the $120 million recently announced for expanding the Extended Shelf Life (ESL) plant in Batavia, NY as a “balancing cost,” that somehow justifies giving back the base differential to processors even though processors can pass their costs on to consumers, whereas farmers cannot. 

Under cross examination, Hood’s representative admitted that plant-based beverages are also bottled in those so-called ESL ‘milk balancing’ facilities, along with premium products like Lactaid.

Meanwhile farmers continue to incur costs associated with a whole host of improvements that were at one time incentivized. It appears the processors expect farmers to forgo being paid for those costs simply “because everyone’s doing it” and incentives are no longer needed.

The idea here is to deflate regulated minimum prices as much as possible in search of the elusive and not-well-defined Holy Grail: the market-clearing price. 

Processors want cheaper milk, and they’ve got multiple proposals to accomplish that. They want to deflate the regulated minimum milk price to free up their ability to pay premiums for “something else.”

In fact, in his testimony, Stephenson admitted that as these costs and premiums are “commoditized,” space is freed up to “pay premiums for something else.”

What is the “something else” that processors will pay to incentivize after they potentially succeed in reducing the regulated minimum price in multiple ways through multiple proposals?

Are climate premiums the next thing coming once the milk price is deflated far enough? Will USDA buy what MIG and IDFA are selling?

Stay tuned.

-30-

Editorial: What was really behind ‘rockier road’ this summer? USDA revisions show fewer cows, less milk June-August

By Sherry Bunting, Farmshine, October 27, 2023

EAST EARL, Pa. — In the June 30 and July 7 editions of Farmshine, we covered the milk market conditions behind the drama that sent farm-level milk prices spiraling lower. The two-part “rockier road for milk prices” series explored factors and asked questions about a situation that was not making sense.

Farmshine readers will recall that we questioned dubious math on the huge milk price losses in farm milk checks – far beyond the predictions for modest declines – in the April through August period. 

We questioned the accuracy of government milk production reports and the USDA’s World Ag Supply and Demand Estimates that kept telling us there would be more milk cows on farms and that milk production would continue higher for the year because of… more cows.

We doubted this was possible given the semiannual cattle inventory reports over the past year showing static to shrinking milk cow numbers and major shrinkage in the number of dairy heifer replacements (down 2% in Jan. 1 inventory, down 3% in mid-year inventory, a drop of over 100,000 head!). We have reported the escalating dairy replacement cattle prices setting multi-year record highs that are bearing these inventory numbers out.

We asked: Where are all these cattle coming from?

The June and July two-part series also indicated the 51% increase in the volume of Whole Milk Powder (WMP) imports coming into the U.S. compared with a year earlier in the January through May period — the highest volume for that 5-month period since 2016. (WMP is basically dehydrated milk for use in making any product or reconstitution.)

We also consulted Calvin Covington for his read of the situation. He reported to us that his calculations showed a 15% cumulative increase in total milk solids imported January through April, and that this extra volume was equal to 63% of the year over year increase in ending stocks on a total solids basis.

Well, what do you know! On Thursday, October 19, USDA issued its monthly milk production report for September. The report also went back and revised downward the previously reported totals for milk production and cow numbers for April through August.

Lo, and behold, in June and July while markets crashed, U.S. farms milked 13,000 and 34,000, respectively, fewer cows than a year ago. The September Milk Production report has now gone back to shave around 0.1% off of several months of previously reported milk production, and it has revised milk cow numbers lower than previously reported as follows: The May revision added 1000 head vs. prior report, the June revision shaved 4000 head off the prior report, July’s revision shaved 11,000 head, and August 14,000 head.

How convenient that while the Milwaukee Sentinel and area news stations were reporting five weeks of milk dumping in the sewers during June and July, and USDA Dairy Market News was reporting six to eight weeks of spot milk loads selling at $10 to $11 under the abysmal Class III price as it hit multi-year lows, the USDA reports had been telling us we were milking more cows than a year earlier, and those cows were making more milk.

Prices had plunged by more than 37%, and no one was talking about the scale-back of mozzarella cheese production and the ramp up of whole milk powder imports.

Sure, they were talking about the softening of dairy exports, and maybe that’s the point. The industry had to get the U.S. price levels below global levels in a hurry to honor the global goals set by the national dairy checkoff under previous USDEC president Tom Vilsack to keep growing exports on a Net-Zero pathway to get to 20% of milk production on a solids basis.

We wrote with concern in June and July about how even those prior numbers did not make sense at those previously incorrect levels, how a tiny change such as milking 7000 more cows in May vs. year ago and a little more milk per cow through the period could result in prices falling this hard in June and July. We have even more questions as even those small supply-margin factors have now been edited by USDA to be lower than previously reported for the April through August period.

Cow numbers have always been a driver for milk prices. Now we know there was an average of 21,000 fewer cows milked in the June-July period. And, by July, there were actually 34,000 fewer cows on U.S. farms vs. year ago.

For the Q-3 July through September period, the revisions show an average of 33,000 fewer cows nationwide compared with the third-quarter of 2022. Maybe this will also be revised lower in the future — as it includes the number of milk cows on U.S. farms in September that is now said to be 9.37 million as a preliminary figure.

In the space of six months, U.S. total milk production has gone from running 1% above year ago in Q-1 to nearly 1% (0.7%) below year ago in Q-3. But within that difference lies a revision that begs big questions about what was really going on while prices were plunging.

According to the tables in the September milk production report, the reality of the situation in June and July — while milk prices hit rock bottom and milk was being dumped and sold for $10 to $11 under class — we were already milking 13,000 fewer cows in June compared with a year ago and a whopping 34,000 fewer cows in July vs. year ago, according to these revised numbers. Now, in September, we’re milking 36,000 fewer cows in the U.S. vs. year ago.

In fact, these revised reports show that milk cow numbers have fallen by 74,000 head from the March 2023 high-tide – an unrevised and supposed 9.444 million head — to the August revised number of 9.376 million head and the September preliminary 9.37 million.

Think about this for a moment. We had unprecedented sets of proposals for milk pricing formula changes flowing into USDA in April and May with USDA announcing in June that a hearing of 21 proposals in five categories of formula changes would begin August 23rd.

While this was staging, we saw milk pricing drama unfold.

How useful this drama was for processors during the first eight weeks of the USDA Federal Milk Marketing Order hearing that has now been postponed due to “scheduling conflicts” to pick up where it left off on Nov. 27. 

How convenient it was for processor representatives to be able to point to dumped milk, below-class spot milk prices and negative premiums as justification for their proposals to increase make allowances while attempting to block farm-friendly formula changes — all in the name of investments needed in capacity to handle “so much more milk!”

(A year earlier, Leprino CEO Mike Durkin warned Congress in a June 2022 Farm Bill hearing that, “The costs in the formula dramatically understate today’s cost of manufacturing and have resulted in distortions to the dairy manufacturing sector, which have constrained capacity to process producer milk,” he said, calling the situation “extremely urgent” and warning that immediate steps needed to be taken to “ensure adequate processing capacity remains.”)

Fast forward to the first eight weeks of the USDA FMMO hearing in Carmel, Indiana in August, September and October. We listened as large global processing representatives (especially Leprino) pontificated about how the make allowances are set too low, saying USDA is setting the milk prices too high. They pointed to all of the drama this summer as proof that farmers are suffering because processors can’t afford to invest or retain capacity to handle “all this extra milk.”

Now here we are, September milk production nationwide is down 0.2% from a year ago, product inventories are tight to adequate, prices have improved… but along the way the industry managed to shake out hundreds of dairy farms — large and small — that have liquidated during the steep downhill slide this summer that so few were prepared for, as no one had a clue it would be this bad given the tight number of milk cows and replacements steadily reported in inventory.

What was really behind the dairy cliff we just experienced, where even USDA Dairy Market News recently reported a significant number of herds milking 200 cows or less have recently liquidated in the Upper Midwest?

With record WMP imports, a pull-back in fresh Italian cheese production, and other elements behind the scenes… was the fall-out of a so-called milk surplus manufactured to prove a point? (Remember, Leprino’s Durkin warned that if make allowances aren’t raised, sufficient processing capacity may not remain. And take note that other Leprino representatives warned during the USDA FMMO hearing last month that they may not invest in U.S. processing capacity in the future, if make allowances are not raised and FMMO minimum prices lowered.)

Or was the fall-out this summer manufactured to fulfill the dairy checkoff’s goals for exports? You see, we are told there was excess product in Europe and New Zealand, and our overseas sales were softening, but still well above 2020 and about even with 2021. The industry is driven to get the deals to secure more global market each and every year, even if the means to those ends are detrimental to how we serve our domestic market in the future.

Given the pullback in mozzarella production during this “rockier road for milk prices”, we have to wonder about the testimony of Leprino representatives in the FMMO hearings. They have been doing the loudest complaining.

Leprino is also a major strategic partner with DMI and the organizations under that umbrella: USDEC, Innovation Center for U.S. Dairy, Net Zero Initiative, and on and on.

They want FMMO milk prices lowered, they said, so they can pay premiums again (?), and they believe you, the farmers, should help pay for their sustainability pledges within the make allowance formulas as a cost of doing business.

They likely want to free up capital out of the FMMO pricing levels to pay for Scope 3 emissions insets from RNG-project dairies to compete with other industries that can buy those renewable clean fuel credits as offsets.

They likely want to use your milk money to pay for concentrated manure-driven expansion in the Net Zero wheel-of-fortune pathway that has been constructed with your checkoff money.

They want FMMO make allowances high enough to cash flow plant capacity investments based on byproduct whey, while they make mozzarella cheese that is not surveyed, is not price-reported, and is not included in the end product pricing formulas for dairy farm milk checks.

-30-

Part Two: What drove rockier road for 2023 milk prices? Manure. Imports. Concentration.

— Along with more imports and shifts in cheese production, major manure-driven expansion in cheese-heavy Central U.S. put pressure on region’s ‘disrupted’ processing capacity

By Sherry Bunting, Farmshine, Updated in reflection from original publication in July 7, 2023 Farmshine

EAST EARL, Pa. — What has driven the rockier road for 2023 milk prices? Many things, and manure may be top on the list.

In fact, we’ll cover the ‘manure effect’ in a future article. But are we beginning to see the methane wheel-of-fortune behave with the ‘cobra effect’? (The British government, concerned about the number of venomous cobras in Delhi, offered a bounty for every dead cobra. Eventually, however, enterprising locals bred cobras for the income.)

This happened with greenhouse gases in the past. It happened with a byproduct gas of making refrigeration coolant. In 2005, when the UN Intergovernmental Panel on Climate Change began an incentive scheme. Companies disposing of gases were rewarded with carbon credits, which could eventually get converted into cash. The program set prices according to how serious the environmental damage was of the pollutant. (Like making cow methane seem like new methane when it’s not). As a result, companies began to produce more of the coolant in order to destroy more of the byproduct gas, and collect millions of dollars in credits. This increased production also caused the price of the refrigerant to decrease significantly.

With this prelude, let’s look back in retrospect on what I reported in the July 7, 2023 Farmshine when milk markets were in a tailspin hitting their low for the year — just 10 days before the gradual turnaround began.

As losses in the CME spot cheese markets and Class III milk futures markets continued through July 6, the Federal Order benchmark Class III price for June was pushed down to $14.91 per cwt. and protein down to $1.51/lb, July and August futures went well below the $15 mark, with Class III below $14.

Let’s look at the supply side of the January through June 2023 supply and demand equation.

Looking at the May Milk Production Report that was released in June, it’s hard to believe the bearish response we saw in milk futures and spot cheese markets that occurred based on a mere 13,000 more cows nationwide that month. It was a paltry 0.1% increase over a flat 2022, along with 11 more pounds of milk output per cow for the month (up 0.5% over flat 2022).

This flipped the switch from a gradually lower-than-2022 market to one that plunged sharply and suddently into the dumps – and all the analysts said: ‘We’ve got too much milk for demand.’ (In fact, two months later, processors are pointing to June and July milk dumping and $10 under class spot milk price as proof that USDA is setting Federal Milk Marketing Order minimum prices too high! — I digress).

As noted in Part One of this series that was published in the june 30 edition of Farmshine, other converging supply-and-demand factors plagued cheese markets that month until July 17 — despite basic fundamentals of these milk production reports not being all that bad. 

USDA Dairy Market News said spot loads of milk were being discounted in June by as much as $11 below the already abysmal FMMO Class III price in the Midwest. The milk dumping that reportedly began in May in Minnesota moved into Wisconsin through June and into July. The July 5th Milwaukee Journal Sentinel reported “Truckloads of fresh farm milk have been flushed down the drain into Milwaukee’s sewer system recently as dairy plants, filled to the brim, couldn’t accept more.” The story notes this had gone on for weeks, and the amount has declined to 5 trailer loads per week by the time The Milwaukee Journal Sentinel published its report.

For the price and milk dumping fallout, economists and analysts blamed the higher milk production (though it was modest on a national basis but huge in the Central U.S.). They blamed the higher cheddar cheese production (not accompanied by higher inventory), and they blamed the lower volume of exports (modestly below year ago on a year-to-date solids basis). 

Globally, milk production was up (it is declining this fall), they said, suggesting U.S. prices needed to get below the falling global prices in order to recover more export volume (instead of dumping in the sewer). Well, they got what they wanted as the U.S. prices dropped like a rock through June until the turnaround on July 17.

Of course, no one (but Farmshine) mentioned the rising imports that were reported in Part One of this series.

Looking for context on the imports, we reached out to retired cooperative executive Calvin Covington, who follows these things on a total solids basis and has been watching the whey market as a leading milk market indicator. We learned that his calculations on a total solids basis, pegged January through April 2023 imports of dairy products into the U.S. at levels 15% higher than a year ago!

“The 15% equals 39.3 million lbs. more solids,” Covington wrote in an email response to a Farmshine question. “Most of the imports are coming from Europe. Dairy demand is very weak in Europe, consumers have less money to spend. Those milk solids are moving out of Europe.”

Noted Covington in June: “On a total solids basis, ending dairy stocks as of April 30th are 3% higher than last April. The 3% equals 61.5 million lbs. more solids.”

This means the 15% increase in January through April dairy product imports — on a total solids basis — were equal to more than half (63%) of the 3% increase that was reported in April domestic ending stocks of all dairy product inventories on a total solids basis.

Think about that for a minute. Product came in and was inventoried while domestic milk was dumped, and producer prices were crushed so that the domestic price could fall below the global price so then the U.S. dairy exports could increase? It makes the head spin.

Class I sales were down during this time, especially in the Midwest where some fluid plants have closed. Fresh Italian cheese production was down, and that’s a big one for Wisconsin. Together these factors pushed more milk to make more American cheese at that time, some of it delivered to consumers in smaller packages (rationing). 

A wrinkle in the market-fabric comes from the dairy foods complex importing higher volumes, and there are the fake bioengineered microorganisms from which excrement is harvested and described as ‘dairy casein or whey protein without the cow.’ These analogs are being heavily marketed to large food manufacturers making dairy and bakery products as carbon-footprint-lowering dairy protein ‘extenders.’

So much so, that National Milk Producers Federation recently sent a letter to FDA asking the agency not to make the same mistake with these fake products as has been made with plant-based frauds.

However, as we look at the modest milk production increase for the first half of 2023, overall, and compare it to 2022, the total comparison was flattish then and it is declining now as we move toward Q3.

But there’s another major twist to this supply-demand equation:

The location and purpose of dairy expansion is undergoing accelerated transformation on a geographic and structural basis. This transformation is part of the “U.S. Dairy transformation” that the national dairy checkoff has promoted in its Pathways to Net Zero Initiative… and it is affecting the milk pricing for all U.S. dairy farmers, everywhere.

Here’s the problem: Milk production in the Central U.S. has expanded by much more than the national average. 

Even University of Wisconsin economics professor emeritus Bob Cropp noted in his writing after the May report that growth in the Midwest — where cheese rules the milk check — was outpacing processing capacity, and the existing capacity to process all this milk was being reduced by labor and transportation challenges.

The concentrated expansion of milk production in the Central U.S. has been accelerating since 2018, but a new paradigm is now in effect: New concrete is being poured in the targeted growth areas driven more by manure, than by milk, and new dairy processing plant construction that is completed and in the works is targeting the same areas.

This is creating a production bubble that is a flood within calmer seas.

Some are calling it the California RNG gold-rush as developers construct Renewable Natural Gas (RNG) projects — especially on new large dairies — for the California RNG market and to collect the low-carbon-fuel credits for the California exchange and other exchanges that are and will be emerging, thanks to the USDA Climate Smart wheel-of-fortune.

We’ve heard the national dairy checkoff managers from DMI talk about profitable sustainability, markets for manure, promotion of other revenue streams for dairy farms as part of the mantra the checkoff has assumed for itself as speaker for all-things-dairy for all-dairy-farmers on what is “sustainable” for the industry.

When the Net-Zero Initiative was launched — along with DMI’s industry transformation plan — it was something that had been in the works since 2008 and emerged more prominently in the 2017-21 period when the former and current U.S. Ag Secretary Tom Vilsack did his stint as top-paid DMI executive, presiding over the U.S. Dairy Export Center (USDEC) under DMI’s umbrella and as a top-talker on the Innovation Center for U.S. Dairy, also under DMI’s umbrella. 

All three: DMI, USDEC, and Innovation Center for U.S. Dairy are 501c6 non-profit organizations contracted to spend checkoff dollars. A 501c6 is essentially a non-profit that can lobby policymakers, whereas the 501c3 National Dairy Board cannot.

In 2020 and 2021, the Innovation Center — filing tax returns under the name Dairy Center for Strategic Innovation and Collaboration Inc. — doubled its revenue from around $100 to $150 million annually to $300 to $350 million.

We all heard it, read it, thought about it – maybe – that the checkoff was morphing into a facilitator for the transformation of the dairy industry led by manure-promotion, not necessarily milk promotion, with the mantra of feeding the world, being top-dog internationally, and meeting international climate targets with a Net Zero greenhouse gas pledge. (That pledge and the methane calculation are another story Farmshine readers are aware of, but we’ll leave that big driver off the table for this discussion.)

Here we are, now seeing an industry being created from within the broader dairy industry with new production driven by manure, in regions where new or expanding cheese, whey and ingredient plants are being located and potentially displacing production from plants and farms elsewhere that are not tied-into this manure-to-methane wheel-of-fortune using dubious science and math to overpeg a cow’s global warming impact.

While that production bubble is building in targeted growth regions with cheese-heavy milk checks, driven in part by manure-focused expansion, it bursted at the seams this summer due to a processing capacity bottleneck, compounded by supply chain disruptions and a sudden decrease in the production of fresh cheese at other plants and a sudden 18% decline in the amount of milk processed for Class I fluid use in the Upper Midwest.

Here’s the sticky wicket. A review of the 2022 end-of-year milk production report along with reports issued in the first half of 2023, revealed that, indeed, the Central U.S. was “awash in milk.” 

Zooming in on the milk production reports, we see South Dakota continuing its fast and uninterrupted growth — up 15.5% for 2022 vs. 2021, and up 7.4% Jan-May 2023 vs. 2022 — having leapfrogged Vermont, Oregon and Kansas and closing in on Indiana in the state rankings. 

Neighboring Iowa leapfrogged Ohio in 2022 with a 4.7% gain in milk production Jan-May 2023 vs. 2022. Number 7 Minnesota grew again after taking a breather with a 0.6% decline in 2022, then increasing 2% in production Jan-May 2023. 

The tristate I-29 corridor, where cheese processing capacity has been expanding, was up 3.3% in milk production collectively with 19,000 more cows Jan-May 2023. Add to this the 1.3% increase in number 2 Wisconsin’s May milk production, and we saw the quad-state’s collective increase was 203 million pounds of additional milk in the region vs. year ago in May, although Wisconsin’s contribution came from 3000 fewer cows, according to USDA.

Just west in number 3 Idaho, production jumped 3.1% with 7,000 more cows Jan-May 2023.

To the east in the Michigan-Indiana-Ohio tri-state region — where the large new cheese plant in St. John’s, Michigan is fully operational — collective milk output was up 2% over year ago with 11,000 more cows. In 2022, this tri-state region was down 2 to 3% for the year compared with 2021.

Number 5 New York made 2.1% more milk with 7,000 more cows in May vs. year ago, with most of this expansion in the western lake region. 

Number 1 California shrank milk production by 0.7% in May with 2000 fewer cows, and number 4 Texas flattened out its multi-year accelerated growth curve to make just 0.8% more milk in May than a year ago with just 1000 more cows, largely affected by the devastating Texas barn April fire resulting in the loss of around 20,000 cows. 

Neighboring New Mexico continued its multi-year downward slide, ranked number 9 behind a flat-to-slightly-lower milk output in number 8, Pennsylvania. 

Milk production in New Mexico fell 3.8% in May vs. year ago with 10,000 fewer cows. This followed an 8.4% decline in milk production and a 30,000-head cut in cow numbers for the year in 2022. Producers there cite well-access limitations, severe drought, high feed costs with reduced feed availability, as well as receiving the rock-bottom milk price as the reasons dairies in New Mexico are closing or relocating. 

With all of these factors in play, the production reports show a clear paradigm shift in how the dairy industry expands via transformation. It is being driven to where feed is available and milk output per cow is higher, and it’s now being driven by a non-milk-related factor: MANURE for the RNG ‘goldrush’

A saving grace is cattle are in short supply, with replacements bringing high prices. This fact is slowing the bubble, production is declining now, and prices are recovering from those unanticipated lows.

-30-

Part One: What’s driving rocky road for milk prices?

The stunner in the USDA FAS data is the U.S. imported 51% more Whole Milk Powder (WMP) in the January through May 2023 period vs. year ago. Looking at import volumes vs. All Milk prices, Fig. 1 shows the pattern: From 2008 to today, whenever there is a period of high farm milk prices, WMP imports increase, and farm milk prices fall. While cheese imports are down 3% YTD, non-cheese dairy exports are up 80% for a 9.2% total increase based on straight volume. Retired co-op executive Calvin Covington recently figured the January through April imports up 15% on a total solids basis. Graphic by Sherry Bunting compiled from USDA FAS and NASS data

— WMP and other imports accelerate, cow-less lab-protein analogs become ‘extenders,’

— Class I sales keep declining, fresh Italian cheese production down, inflation drives CPGs to reduce unit-sizes,

— RNG-driven dairy construction accelerates concentrated growth in cheese-heavy Central U.S.

By Sherry Bunting, Farmshine June 30, 2023

EAST EARL, Pa. — Current milk futures and dairy commodity markets have turned sharply lower and signal a rocky road ahead for farm level milk prices. Because of the lag times built into federal milk pricing, the most recent steep losses in spot cheese markets will hit the Class III price and create more Class I mover losses via the ‘average of’ method to hit milk checks in July, August and September. 

Factors driving this include: declining Class I sales and fresh Italian cheese production, inflation-driven unit-size shrinkage, two months of reduced dairy exports and five months of increased dairy imports, and the advertising of cow-less lab-protein analogs as ‘extenders’ for food processing.

The May Milk Production Report confirmed that the Central U.S. is, indeed, “awash in milk.” Part two of this series will zoom into the geographic shifts in the concentration of milk growth, driven largely by Renewable Natural Gas digester projects for the California RNG gold rush. Much of the new dairy construction in the cheese-heavy Central U.S. is focused on manure to energy, not necessarily on milk and cheese to consumers.

The Production Report was released after the futures closed on June 21. In the next four trading sessions from June 22 through 27, Class III contracts for July through September lost $1.50 per cwt, on top of previous losses of more than $2. 

By June 28, the expiring June Class III milk futures contract was at $14.92, and at $14.91 in the June USDA announced.

The ‘market’ has simply ignored USDA’s May 30 announcement that the government will bring in a ‘game changer’ to purchase 47 million pounds of cheese for food banks and schools as block and barrel cheese plunged to $1.31 and $1.39 per pound, respectively, by Tues., June 27.

USDA confirmed last week that the first round of its bid solicitations for the first phase of the 47 million pound cheese purchase won’t open until October. Bids and deliveries will come in stages from fourth quarter 2023 through mid-2024. 

This means cheap milk will make cheap cheese, which could get even cheaper if inventories build in anticipation of selling that cheese at a tidy profit into the seasonal demand increases that begin in October, along with these announced government cheese purchases. (Who needs a make-allowance raise with this game in town?)

For the past several weeks, USDA Dairy Market News has been reporting spot loads of milk in the Central U.S. selling as much as $11 per cwt below the Class III price. DMN also reports milk from the Central U.S. growth region is moving farther to find a home. We are also hearing from readers about substantial milk being dumped in the Midwest, while a few independent dairies in Minnesota, one milking over 1000 cows, have been told by their creamery that their milk is not needed after schools close.

May milk production, nationwide, was up only 0.6% from a year ago. The 24 major monthly states were up by 0.8%. Milk cow numbers did not grow from April to May and are running just 13,000 head above year ago. This modest increase comes on the heels of no net gain in milk production for 2022.

All year, the monthly USDA World Ag Supply and Demand Estimates (WASDE) kept increasing the 2023 U.S. milk production forecasts, based on what it said are ‘more milk cows and less output per cow.’ The most recent WASDE walked that production forecast back a bit, but still expects U.S. dairies will milk an average of 9.415 million cows in 2023. 

Then, somehow, the May Production Report pegged the number of milk cows on farms at 9.424 million head, even after the loss of 18,000 milk cows in a fire in west Texas in April. This is how tight the figuring has become on what we are told today is a surplus of milk and a lackluster demand.

The idea of a milk surplus that is big enough to drive these current price losses does not line up with USDA’s Jan. 1 cattle inventory report. So, in May, the WASDE began to walk it back, noting higher feed costs, reduced milk margins and higher beef cattle prices will slow the flow of milk.

Where are the cattle coming from? The Jan. 2023 inventory showed milk cow numbers were virtually unchanged from Jan. 2022 at 9.4 million head. The number of dairy heifers over 500 pounds was down 2% at 4.337 million head — the lowest number since 2006. Within that heifer number, expected calvings from Jan. 1, 2023 to Jan. 1, 2024 were also 2% lower than for Jan. 2022 to Jan. 2023. The next semi-annual cattle inventory report will be released in three weeks on July 21.

The Report’s smaller dairy replacement inventory is believable given the fact that offerings have been selling $300 to $500 per head above year ago levels, and the few weekly dairy cattle auctions throughout the U.S. have seen offerings down 30% below year ago… until June, when prices came under pressure on a suddenly increased offering at auctions over the past two weeks. 

Meanwhile, dairy cow slaughter rates are also increasing, according to USDA, especially in the Midwest and Southwest, up 31 and 47% above year ago, respectively.

While the WASDE has forecast per-cow output to fall by 55 pounds per cow per month in 2023, the May Production Report pegged an 11-pound per-cow per month increase.

This means, it took just 13,000 more cows nationwide, and just 11 more pounds of milk output per cow per month to flip the switch to sharply lower milk prices based on – suddenly — too much milk? (Geographic concentration of milk growth plays into this equation, and we’ll discuss that in Part Two.)

In Part One, we look at the other supply and demand factors that are having a direct impact on where farm level milk prices are headed. These factors fill in the gaps left by the perplexing and contradictory sets of USDA dairy data.

I.               Fresh fluid milk sales and fresh Italian cheese production both declined, pushing more available spring-flush milk into storable products.

Fluid milk sales January through April were down 2.8% from a year ago, and as bottlers slowed school packaging ahead of summer recess, the June 5th Dairy Products Report showed April production of fresh (made to order) Italian cheeses also declined 2.6% vs. year ago.

Meanwhile, butter production was down 4.9% while nonfat dry milk production increased just 1.9%, and skim milk powder production was down 22.4%. This put more of the available ‘spring flush’ milk into production of American cheese, up 2.3% vs. year ago in April, and the accompanying dry whey and whey protein concentrate production up 1.7 and 7.2%, respectively. 

Record volumes of dry whey and cheese have been coming to the daily CME spot auction, driving down the spot prices that drive the National Dairy Product Sales Report prices that are then used in federal class and component pricing formulas.

II.            Inflation pressures consumer demand, but inventories are not burdensome.

The May Cold Storage Report released on June 23 was a head-scratcher. Despite the ramped up American cheese production in the Dairy Products Report, the Cold Storage Report showed both the total amount of cheese in inventory, and the amount of American cheese in inventory, are both actually down 1% from a year ago at the end of May, while butter inventory was up 14% against last year’s higher-price-driving short supply.

Meanwhile, producers in the Midwest are being told that milk co-ops and buyers are facing cheese sales declines and that there’s not enough capacity to process all the milk now being produced in the region, with the existing capacity also experiencing labor and transport disruptions.

Dairy demand has stagnated, the analysts say, after months of high inflation. The May dairy consumer price index (CPI) was more bearish than the overall CPI. Dairy CPI was up 4.6%, with cheese up 3.6%, ice cream up 8% and other dairy products up 9.3% while whole milk decreased 3.4% and other non-whole milk increased 0.6%.

Inflationary pressure is driving some consumer packaged goods companies (CPGs) to trim unit-sizes for an appearance of stable consumer pricing. For example, we see unit-size shrinkage in cheese packages and slices. Not all American cheese slices today are 8 ounces, some are 6. Such moves effectively ration demand. 

III.            The stunner is dairy imports, up 9.2% with Whole Milk Powder imports up 51% year-to-date.

Looking at import volumes vs. All Milk prices, the pattern is clear (Fig.1). From 2008 to today, whenever there is a period of high farm milk prices, Whole Milk Powder (WMP) imports increase, and farm milk prices fall. 

WMP is basically farm milk from another country, in bulk dried form, not a specialized product. It can be used in processing virtually any dairy product, containing all of the milk components — both fat and skim solids.

From December 2022 through April 2023, the U.S. imported the highest percentage of dairy production equivalent since 2016. And there is more milk equivalent comparison today than in 2016. The National Milk Producers Federation’s monthly market report confirmed this. 

Then May imports worsened this trend. 

Digging into the June 12 USDA Foreign Ag Service (FAS) Import Circular, the U.S. imported 80% more non-cheese dairy products from January through May vs. year ago. At the same time, cheese imports were down 3.3%. Combined, the total cheese and non-cheese imports were up 9.2% vs. year ago.

But the stunner in the data is the U.S. imported 51% more WMP in the January through May 2023 period vs. year ago. 

It’s no wonder that the USDA Dairy Market News reported on June 15 that, “Dry whole milk processing (in the U.S.) is limited, despite hearty milk volumes.” 

The report went on to say that even as seasonal milk output recedes “market contacts suggest dry WMP market tones may remain steady (at the current lower price levels) due to lighter demand.”

Not surprising, given the U.S. imported more WMP in May (550,000 kg) than for any month since April of 2020. WMP was imported at a record-setting pace during the pandemic while milk was being dumped in the U.S. and production-base-programs were tightened on U.S. dairy farms by milk cooperatives and buyers. 

As the cumulative 2023 WMP imports accelerated in May, milk prices are set to take the sharp turn lower.

The year-to-date imports of butter, butterfat and butter oil are also well above year ago as part of that 80% increase in non-cheese imports January through May 2023 vs. year ago.

The June WASDE raised dairy import forecasts, yet again, especially on a fat basis, and it again lowered dairy export forecasts. The Report sees butter and nonfat dry milk (Class IV) continuing to sell stronger on better demand, while demand and prices for cheese and whey (Class III) are further reduced. 

This combination reduced the WASDE forecast for the 2023 All Milk price to $19.95, down 55 cents from the May forecast. Part of this is the Class IV over III divergence that is substantially lowering the Class I fluid milk price under the ‘average of’ method, which took more than $1.00 off the advance Class I price mover for July, announced last week at $17.32. It would have been $18.34 using the previous ‘higher of’ method.

IV.          Lab-created dairy protein analogs are advertised to processors as ‘extenders.’

Another emerging factor is the lab-created dairy protein analogs, which are the excrement of microorganisms that have been bioengineered with bovine DNA. These proteins are advertised in dairy food and manufacturing magazines as carbon-footprint-lowering, interchangeable ‘extenders’ for production of cheese, ice cream and other dairy foods.

The companies that are ramping up this fermentation-vat-lab-protein are doing limited consumer marketing. Mainly, they pursue a B2B model (business to business, not business to consumer) and try to capitalize on ESG scoring benefits based on who-knows-what-calculations that large processors are seeking as they navigate the investment, credit, and retail shelf-space ESG decisions up and down the supply chain.

No one knows how much lab-dairy-protein is being used at this time — or in what brands of dairy products — because these proteins do not have to be labeled, and they are not part of any dairy market or production report.

The Bioengineered Food Disclosure Law was passed by Congress in July 2016, and USDA established the national mandatory standard for disclosing foods that are, or may be, bioengineered in December of 2018. This Standard was implemented on Jan. 1, 2020 with mandatory compliance for all food manufacturers by Jan. 1, 2022.

According to USDA, the Standard defines bioengineered foods as “those that contain detectable genetic material that has been modified through certain lab techniques and cannot be created through conventional breeding or found in nature.”

The lab-dairy-protein-analogs are the harvested excrement of fermentation-vat-grown bioengineered yeast, fungi and bacteria, so BE labeling is not required due to the ‘detectable genetic material’ loophole. The modified genetic material is in the microorganisms, not their excrement.

-30-

MILK MARKET MOOS: Jan. 2022 milk down 1.6%, licensed herd average falls below 30,000 in 2021, futures higher, spot commodities lower

Milk Market Moos, by Sherry Bunting, is a weekly feature in Farmshine. Portions are republished below with the prices updated to Fri., Feb. 25 after the print edition went to press Wed. evening, Feb. 23.

Milk production in all U.S. states collectively during January fell by 1.6% vs. year ago. In the 24 major reporting states, the decline was 1.4%. December’s production was also revised lower than the estimate last month.

January’s production decline came from a combination of reduced output per cow and 63,000 fewer cows compared with a year ago. Cow numbers in January are 5000 fewer than December.

This trend could go on for some time, as we noted recently in this column, that the Jan. 1 semi-annual All Cattle and Calf Inventory Report recently showed a 1% decline in milk cow numbers compared with Jan. 1 2021 and a whopping 3% decline in replacement dairy heifer numbers vs. year ago.

The 2021 production total for the U.S. was also released in the Feb. 23 USDA Milk Production Report showing last year’s U.S. milk production total was 1.3% above 2020.

At the same time, the average number of licensed herds in the U.S. during 2021 (not an end-of-year number) was reported at 29,858 — down 1,794 compared with the average number of licensed herds in 2020 and the first time the number fell below 30,000. This is a 5.7% decline in the average number of licensed dairy herds nationwide. In 2020, there was a 7.5% decline as the nation lost 2550 dairy herds that year.

In the Northeast and Midatlantic milkshed, among the major reporting states, Pennsylvania’s production was 2.9% below year ago in January with 6000 fewer milk cows on farms; 2021 production in the Keystone state was 1.6% below 2020 and the average number of cows on PA farms last year was 8000 fewer than in 2020.

January’s production in New York was down 0.6% with 5000 fewer cows; 2021 production in the Empire State was up 1.6% with the average number of cows on NY farms in 2021 numbering 1000 more than in 2020.

Vermont’s cow numbers fell by 1000 head in January 2022 vs. Jan. 2021 and milk production was off by 1.8%; 2021 production in the Green Mountain State was down 1.4% vs. 2020 with 2000 fewer cows as an average for the year.

The average number of licensed herds in Pennsylvania in 2021 was 5200, down 230 from 2020 (4.3% drop); New York 3430, down 220 (6% drop); and Vermont 580, down 60 (a 9.4% drop); Virginia 421, down 54 (11% drop).

In the Southeast milkshed among major milk producing states, Florida’s average number of herds was 75 in 2021, down 10 from 2020 (11.8% drop); Georgia 110, down 20 (15.4% drop). Production and cow numbers were mixed with Georgia growing output by 1.4% in 2021 vs. 2020 with 1000 additional cows; Florida’s production declined 5.1% with 5000 fewer cows, and Virginia’s production was down 3.4% with 2000 fewer cows.

Georgia’s production last month was up a whopping 5.1% as one of only 5 states to show a year over year production increase in January 2022 with 3000 more cows than a year ago even though the number of farms fell by over 15%.

By contrast, January’s production totals in Florida and Virginia were down 3.5% and 3.8% with 4000 and 3000 fewer milk cows, respectively.

Four other states gained production in January vs. year ago, (in addition to Georgia). They were: Iowa, up 1.7% with 3000 more cows vs. year ago; Idaho up 0.6% with 4000 more cows, Texas up 3.5% with 12,000 more cows, and South Dakota up a whopping 18.3% with 28,000 more cows.

The two largest milk production states saw a pullback in January: Wisconsin’s production was off fractionally while California, the largest producing state, saw a 1.9% decline in year over year production in January.

New Mexico’s trend deepened. 2021 production was 4.5% lower than 2020 with 12,000 fewer cows. In January 2022, production was below previous year by 12.1% with 42,000 fewer milk cows. New Mexico’s average number of licensed herds in 2021 came in at 120, down 20 (down 14.3%).

Texas also saw 20 fewer licensed herds last year, at 340 (down 5.6%). However cow numbers grew 27,000 in in the Lone Star State during 2021 with production beating 2020 by 5%.

Texas officially surpassed New York as the 4th largest milk producing state with 15.6 billion pounds of milk vs. New York’s 15.5 billion pounds in 2021. The January 2022 figures show 12,000 more cows and 3.5% more production vs. year ago in Texas.

South Dakota lost 15 herds at an average 165 for 2021 (down 8.4%). However, South Dakota gained 21,000 cows and 15.5% in milk production for 2021 vs. 2020. Neighboring Minnesota, the 7th largest milk producing state gained 13,000 cows and 3.7% in production in 2021 at 10.5 billion pounds — putting more daylight ahead of Pennsylvania, the 8th highest producing state at 10.1 billion pounds in 2021.

Look for more analysis of the yearend report in the next print edition of Farmshine and here at agmoos this week.

Cl. III and IV milk futures mixed,12-mo. Cl. III avg. $21.51, IV $23.25

Class III and IV milk futures were mixed when Farmshine went to press at midweek, Feb. 23 — before global reports showed a shrinking milk supply and before the Russian invasion of Ukraine commenced. Figures in the Farmshine print edition of Milk Market Moos have been updated using milk futures quotes at the close of Friday, Feb. 25 trade below.

Class IV split the trend with first half 2022 steady to lower, second half firm to higher, while Class III was mostly higher, except March and April contracts under downward pressure. In the Class III trading, new contract highs were set for August through December 2022.

The bullish USDA milk production report came out at the close of CME trade on Feb. 23 — prompting after hours trade to tick higher Feb. through Aug. by 25 to 65 cents on Class III, strengthening further at the end of the week on news of global supply deficits tempered by the uncertain impacts of war in Eastern Europe.

Class III milk futures recouped twice as much as was lost last week, averaging $21.63 for the next 12 months on the close of trade Wed., Feb. 25. This is 29 cents higher than the average a week ago,

Class IV futures averaged $23.46 for the next 12 months, generally steady at midweek compared with the previous week’s average, but gaining 22 cents Thursday and Friday on the average.

The average spread between the Class III and IV milk futures contracts for the next 12 months Feb. 2022 through Jan. 2023 stood at $1.83/cwt on Feb. 25 — 10 cents narrower than a week ago with Feb. through August contracts $1.80 to $2 apart and narrowing to right around the $1.48 threshold by September.

CME spot dairy commodities lose ground

CME spot dairy prices moved higher on Class III products (cheese and whey) before turning lower at the end of the week. For Class IV products (butter/NFDM) the trend started lower and continued lower through week’s end.

By Fri., Feb. 25, butter lost two-thirds of last week’s huge gain, pegged at $2.5785/lb with 2 loads trading. This was 20 cents lower than the previous Wednesday, with 8 cents of the loss occurring in a single session Friday.

Grade A nonfat dry milk (NFDM) lost 5 pennies this week then gained one back on Wed., Feb. 23 when the spot price was pegged at $1.86/lb — down 4 cents from a week ago with 12 loads trading. Thursday’s trade saw a penny and a half increase, which was lost Friday, to end the week at $1.86/lb.

On the Class III side of the ledger Wed., Feb. 23, 40-lb Cheddar blocks were firm at $1.99/lb, gained 3 cents Thursday, but lost 7 cents Friday, Feb. 25, when 40-lb blocks were pegged at $1.9450/lb, down 4 1/2 cents from a week ago with a single load changing hands; 500-lb barrels at $1.90/lb were 1 1/2 cents lower than a week ago with 2 loads trading Friday.

The spot market for dry whey gained a penny, at 81-cents on Wed., Feb. 23, with no loads trading, but then lost 3 cents in end of week trading, pegged Fri., Feb. 25 at 78 cents, no loads traded.

Grain market rallied

Corn rallied 10 to mostly 30 cents per bushel higher last Wed., Feb. 23 on the eve of the Russian invasion of Ukraine, most strength near term; soybean meal $10 to $30/ton higher with far off contracts $5 to $10/T higher than a week ago. Those levels followed wheat higher on the news in the wee hours of Thursday morning of the Russian invasion of Ukraine, a global exporter of wheat, corn and other grains and oilseeds, number one crop being sunflowers.

By Friday, Feb. 25, the run-up had tamped down, but with near-term contracts still much higher than a week ago — May corn closed at $6.55 down from highs over $7 the previous day; May soybean meal closed at $442.70 Friday.

Auction prices for market cows, calves, dairy fats backoff a bit after big gains two weeks ago

Market cows, fat dairy steers, and return to farm Holstein bull calves, especially beef crosses, jumped significantly higher two weeks ago and edged off a bit in the Feb. 17 to 22 auction market trade in Lancaster County. Choice and Prime Dairy steers averaged $115.00, Breaking Utility cows $81.10, Boning Utility $74.50, Lean cows $65.75. Holstein bulls 90 to 125 lbs averaged $143.00 with beef crosses bringing more than double, averaging $340.00; 80-100 lb $130.00, beef crosses $280.00.

Your milk check and fairness in contracts: Dr. Bozic urges transparency

Dr. Marin Bozic of Bozic LLC talked about his Milk Check Transparency Report at Pennsylvania Dairy Summit in Lancaster on Feb. 2. S.Bunting photo

By Sherry Bunting, published in Farmshine, Feb. 18, 2022

LANCASTER, Pa. — Aside from Federal Milk Marketing Order modifications, Dr. Marin Bozic talked about two other key pillars of reform during his keynote presentation at the Pennsylvania Dairy Summit February 2: Milk check transparency and fairness in milk contracts.

“Everyone prices milk differently depending on what they want you to do,” he said, showing a scattergram of milk check data from various coops and buyers. 

“It’s impossible to compare it,” Bozic declared, noting that in Australia, all milk pricing data are public so anyone can see how everyone compares in payment by region. In Ireland something similar is also done, where each buyer’s protein and butterfat price is published as well as a price for the liquid portion.

“They see what different processors pay. They don’t have Federal Orders. This transparency keeps everyone honest,” said Bozic. 

He knows about pricing around the world because — in addition to being an associate professor of applied economics at the University of Minnesota — Bozic is founder and CEO of Bozic LLC, a global provider of technology for commodity markets analytics and risk management, with around 100 clients on four continents. He is also an advisor to several dairy trade associations.

“While it’s not easy to switch (milk markets) today, milk check transparency would allow producers to hold boards accountable and hold management accountable,” said Bozic. “Having this information, seeing the patterns, a producer can ask the question: Are you doing everything you can to make sure I am successful?”

Bozic announced his new Milk Check Transparency Report, which he said will be a monthly report generated from producers submitting their milk checks to him. The purpose is to make milk checks easier to understand and to benchmark across processors to improve price discovery.

He has been working on this project with 12 processors, mainly in Wisconsin, so far. The first report is due out in the next few weeks, and the goal is to gain more input covering more buyers in more regions.

He said he hopes to have 90 to 95% of the processors included within the next six months to be able to generate a national Milk Check Transparency Report every month.

Specifically, all data is collected from producers’ milk check statements. The collaboration is confidential and a non-disclosure agreement is signed protecting the producer. Bozic and an assistant input the data. No one else sees the individual milk check submissions.

Once enough data are collected to have a high degree of confidence in the estimates, processors are contacted to offer them the opportunity to validate or comment before publishing.

Bozic has a multi-step process for standardizing the information at national average component levels (4.0F and 3.3P). He appreciates having a document describing how premiums are set by the milk buyer. Representative hauling is also incorporated and other formulas so price discovery comparisons can be made.

“Then we can work with any milk check,” said Bozic.

He said a large number of farms from Washington to Florida and from California to New York are or will be participating in this project, and he urged producers to get involved by writing to him at marin@bozic.io

Bozic was quick to point out there are other considerations and benefits a cooperative or private milk market may provide that go outside the scope of the report. He said the Milk Check Transparency Report is not meant for ranking. Instead, it is a way to look comparatively, so producers can have better market price discovery, input and accountability.

Another goal of the report is to eventually have a calculator option, where a producer can slide the pounds of volume or components, even milk quality, and see how it changes the pricing outcome.

“We are then better able to design risk management,” said Bozic, whose proprietary company owns the intellectual property he developed as the infrastructure behind risk management programs like Dairy Revenue Protection (DRP).

He believes with better information, even the Dairy Margin Coverage can be improved, and the calculators and sliders could allow producers to see how they are paid against a national index allowing them to make changes that would improve profitability and better inform how to manage the price risk they have.

Negative PPDs (producer price differentials) made headlines the past two years, Bozic acknowledged. 

“There’s an impression that all this milk was de-pooled and a feeling that processors could have their cake and eat it too,” he said. “The Milk Check Transparency Report puts everyone on notice that whether differentials are positive or negative, they are in there.”

In this way, he said, the report can “promote good behavior in an unregulated way.”

On the variation in how producers are paid, Bozic said a big problem is lack of clarity on how farmers can achieve a better price.

“It’s astonishing to me that processors do not have brochures detailing how their incentives are based so farmers know how to meet them,” said Bozic.

The Milk Check Transparency Report is something Bozic is doing, for free, on his own time. He is not relying on the University of Minnesota. He said he knows he’ll get some ‘hate mail’ but believes it is important. 

When asked why he is doing this, Bozic brought his reply to a personal level. He mentioned his mother, who is ailing, saying that she inspired him all his life to help people. He said it is hard for anyone to do this, but that he is fortunate to have built a technology company over the years and believes he is in a position to do something good.

On contract fairness, Bozic noted that Australia has required structures in their milk contracts, but they do not have regulated pricing.

“It’s their contracts that put them on an even keel,” he said. 

For example, no cooperative or milk buyer should be able to prohibit their producers from doing third-party milk weight and test samples. Contracts should protect farmers from being ‘failed’ in inspections simply because they are ‘prickly’ or ‘vocal’ producers.

He also noted that in countries, like Australia, milk buyers or cooperatives are not allowed to require exclusivity while also doing two-tiered pricing for base and over-base milk at the same time. 

“It’s one or the other,” said Bozic. “When those two lanes cross at the same time, we have a traffic accident.”

“Organizations like ADC and Edge are fighting for some of these interests of farmers, but they need more voices,” said Bozic.

He pointed out that the combination of exclusivity and base programs in the East may be insulating against production growth and surplus.

“That ‘insulation’ may be fine right now,” said Bozic. “But what about 10 years from now?”

What happens to dairy in the Northeast, for example, when processing has been built up everywhere else where production is being allowed, even encouraged, to grow?

 -30-

Markets on the mooove as next 12 months of Class III futures average above $19.50, Class IV over $20.

By Sherry Bunting, Farmshine Milk Market Moos

“The next six months will be better than the last six months with a better milk price,” said Dr. Normand St-Pierre of Perdue Agribusiness speaking at a meeting of dairy farmers this week. Global milk production is down 1% year-to-date, global skim milk powder stocks are low, and the world in general is short on butterfat, he said.

In fact, milk and dairy products are experiencing spot shortages in U.S. retail and foodservice channels. Kraft-Heinz, for example, is reporting sustained demand for cream cheese with sales up 35%. Reduced butter production vs. year ago has met increased drawdowns to bring cold storage stocks well below year ago.

On the CME spot market on Dec. 14, butter was pegged at $2.06, with high sales on two loads at $2.10. Nonfat dry milk crossed the $1.60 mark and stood at $1.64/lb, pushing Class IV milk futures solidly into the $20’s with a 12-month average of $20.21 as of Mon., Dec. 13.

Class III milk futures moved well into the $19s across the 12-month board with December and January topping the $20 mark Monday (Dec 13) fueled by the strength of a rising block-Cheddar price, pegged at $1.94/lb Tuesday, Dec. 14 and steadily rising whey prices pegged at 71 cents/lb. The caveat is the 500-pound barrel cheese price is moving more slowly, pegged at $1.67/lb Tuesday — 27 cents behind the 40-lb block price.

St-Pierre sees the milk check butterfat price averaging $2.30 over the next six months, and he thinks it could actually go higher, while protein should average $2.80. Mid-December milk checks will price November butterfat at $2.15 and protein at $2.75. Nonfat solids are also higher, and other solids are almost double the historical average, driven by the robust whey sales.

A more conservative USDA World Supply and Demand Estimates (WASDE) report on Dec. 9 forecast higher prices for butter, cheese and whey with NFDM unchanged in 2022, but current trends suggest this report could revise upward in January, although much hinges on consumer responses to inflationary pressure in their buying habits. The report did nudge the 2021 All Milk price average to $18.60, buoyed by yearend strength. The WASDE report forecasts a 2022 All-Milk price of $20.75, which some analysts believe to be a low-end projection given current market indicators.

If current futures market levels are realized, these higher trending milk prices should help dairies keep pace with rising input costs. In addition, risk management tools and margin coverage options will help sync both sides of the milk price / feed cost equation in this inflationary environment.

Overall, domestic demand is strong but challenged by spot shortages and higher retail prices. As global prices are also rising, U.S. exports have continued strong even in light of overseas transportation disruptions.

Risk management will be important, despite uptrending dairy product and milk prices because costs for feed and other inputs are also rising, and the effect on demand down the road from inflationary pressures and global uncertainties is difficult to forecast. One caveat that is mentioned by market analysts is China’s large purchases of whole and skim milk powder on global markets over the past six months have accumulated a stockpile that could reduce China’s purchases in the coming year.

Still, the Global Dairy Trade (GDT) biweekly internet auction on Tues., Dec. 7 moved higher on all products with the GDT index up 1.4% from November 30 to its highest level since January 2014. The GDT butter price jumped 4.6% over the two week period to the highest levels since February, and most of that increase was in the nearest term delivery months. Skim milk powder (SMP) was up 1.3% to levels not seen in more than five years, with the strongest increase (+3%) seen on global SMP for delivery six months ahead in May 2022.

Dairy Margin Coverage Note: USDA announced last week that the Dairy Margin Coverage signups for 2022 enrollments began Dec. 13, 2021 through Feb. 18, 2022. Dairy producers wanting to update production history (up to 5 million annual pounds) by verifying 2019 milk marketings will receive supplemental coverage retroactive to January 2021 and ahead through 2023. This updated production history must be done first the local FSA office before enrolling 2022 DMC coverages. The new feed cost calculation using higher quality alfalfa prices is estimated to add 15 to 22 cents per hundredweight to previous DMC payments retroactive all the way back to Jan. 2020. FSA offices confirm receiving funds this week to finally do these retroactive feed-cost-adjusted DMC payments — automatically — very soon for all producers who were enrolled in the program for 2020 and/or 2021.

‘It’s getting real, and we’re not alone’

Unsure of future, Nissley family’s faith, community fill gap as dairy chapter closes with sale of 400 cows

By Sherry Bunting, Farmshine, November 16, 2018

Nissley0051.jpg
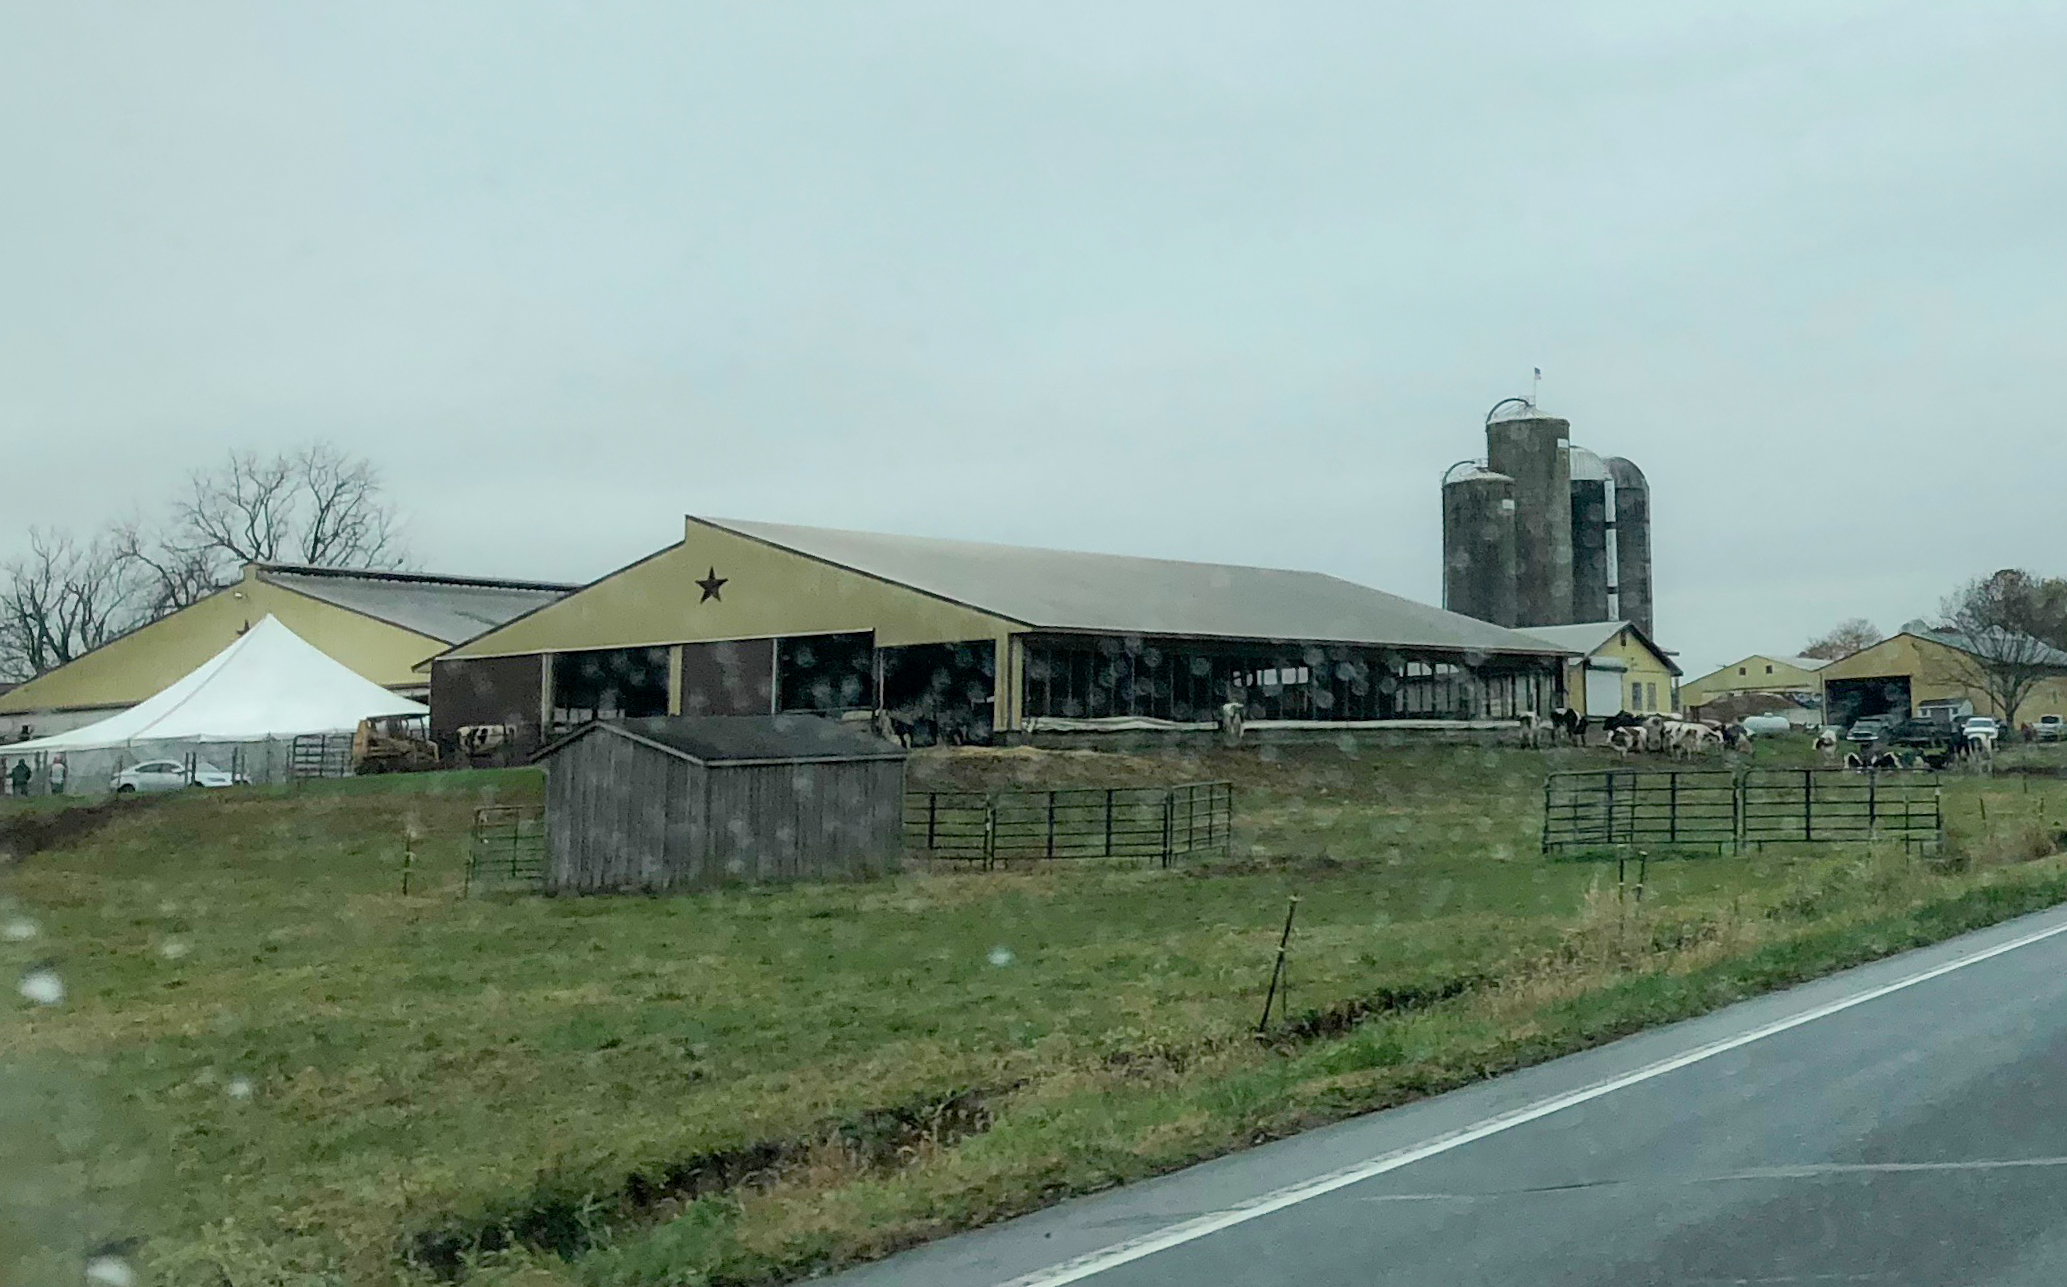
MOUNT JOY, Pa. — Another rainy day. Another family selling their dairy herd. Sale day unfolded November 9, 2018 for the Nissley family here in Lancaster County — not unlike hundreds of other families this year, a trend not expected to end any time soon.

After 25 years of building from nothing to 850 dairy animals — and with the next generation involved in the dairy — the Nissleys wrestled with and made their tough decisions, saying there’s no looking back, although the timetable was not as they planned because the milk price fell again, and some options for transitioning into poultry came off the table.

Nissley2005

The Cattle Exchange put up the tent, and the community came out in-force to support the Nissley family and their sale Friday. Throughout the weekend, they heard from people who bought their cows, telling them they’ll take good care of them. While many went to new dairy homes, a third of the cows at dispersals like this one have been going straight to beef, despite culling a good 10% of the herd in the weeks before the sale.

They began culling hard the past few weeks and on Friday, Nov. 9 offered 330 remaining milk cows and over 80 springing heifers. The Cattle Exchange put up the tent, and the community came out at 10 a.m. to support the family and — as Mike Nissley put it — “watch a life’s work sell for peanuts.”

Breeding age heifers are being offered for sale privately and the young calves, for now, are still being raised on another farm as they would sell for very little in these trying times.

Nissley-Edits-18

As we talk outside the sale tent in the cold November rain, the cell phones in the pockets of Mike, Nancy (left) and Audrey are sounding off with outpourings of support. Know that the smiles through brushed back tears are because of the loving care of others, the family’s faith in a loving God, and the knowledge that they took great care of their cows.

Mike and his wife Nancy aren’t sure what the future looks like, but they are surely feeling the prayers, calls and texts of their friends, family, and community getting them through it.

Both Mike and his daughter Audrey Breneman have loved working with the cows, saying the sale felt like a funeral — “the death of a dream” — standing in the light rain outside the sale tent while the auctioneer chanted prices dipping into the $500s and $600s, even struggling shy of $1000 on a cow making 90 pounds of milk with a 54,000 SCC.

Later, a smile crossed his face, hearing the auctioneer stretch for $1700. “That one’s good to hear,” he says, as they headed back into the tent to watch springing and bred heifers sell.

While Daniel Brandt announced their number-one heifers, bids of $1600 and $1700 could be heard on some.

Nissley2011
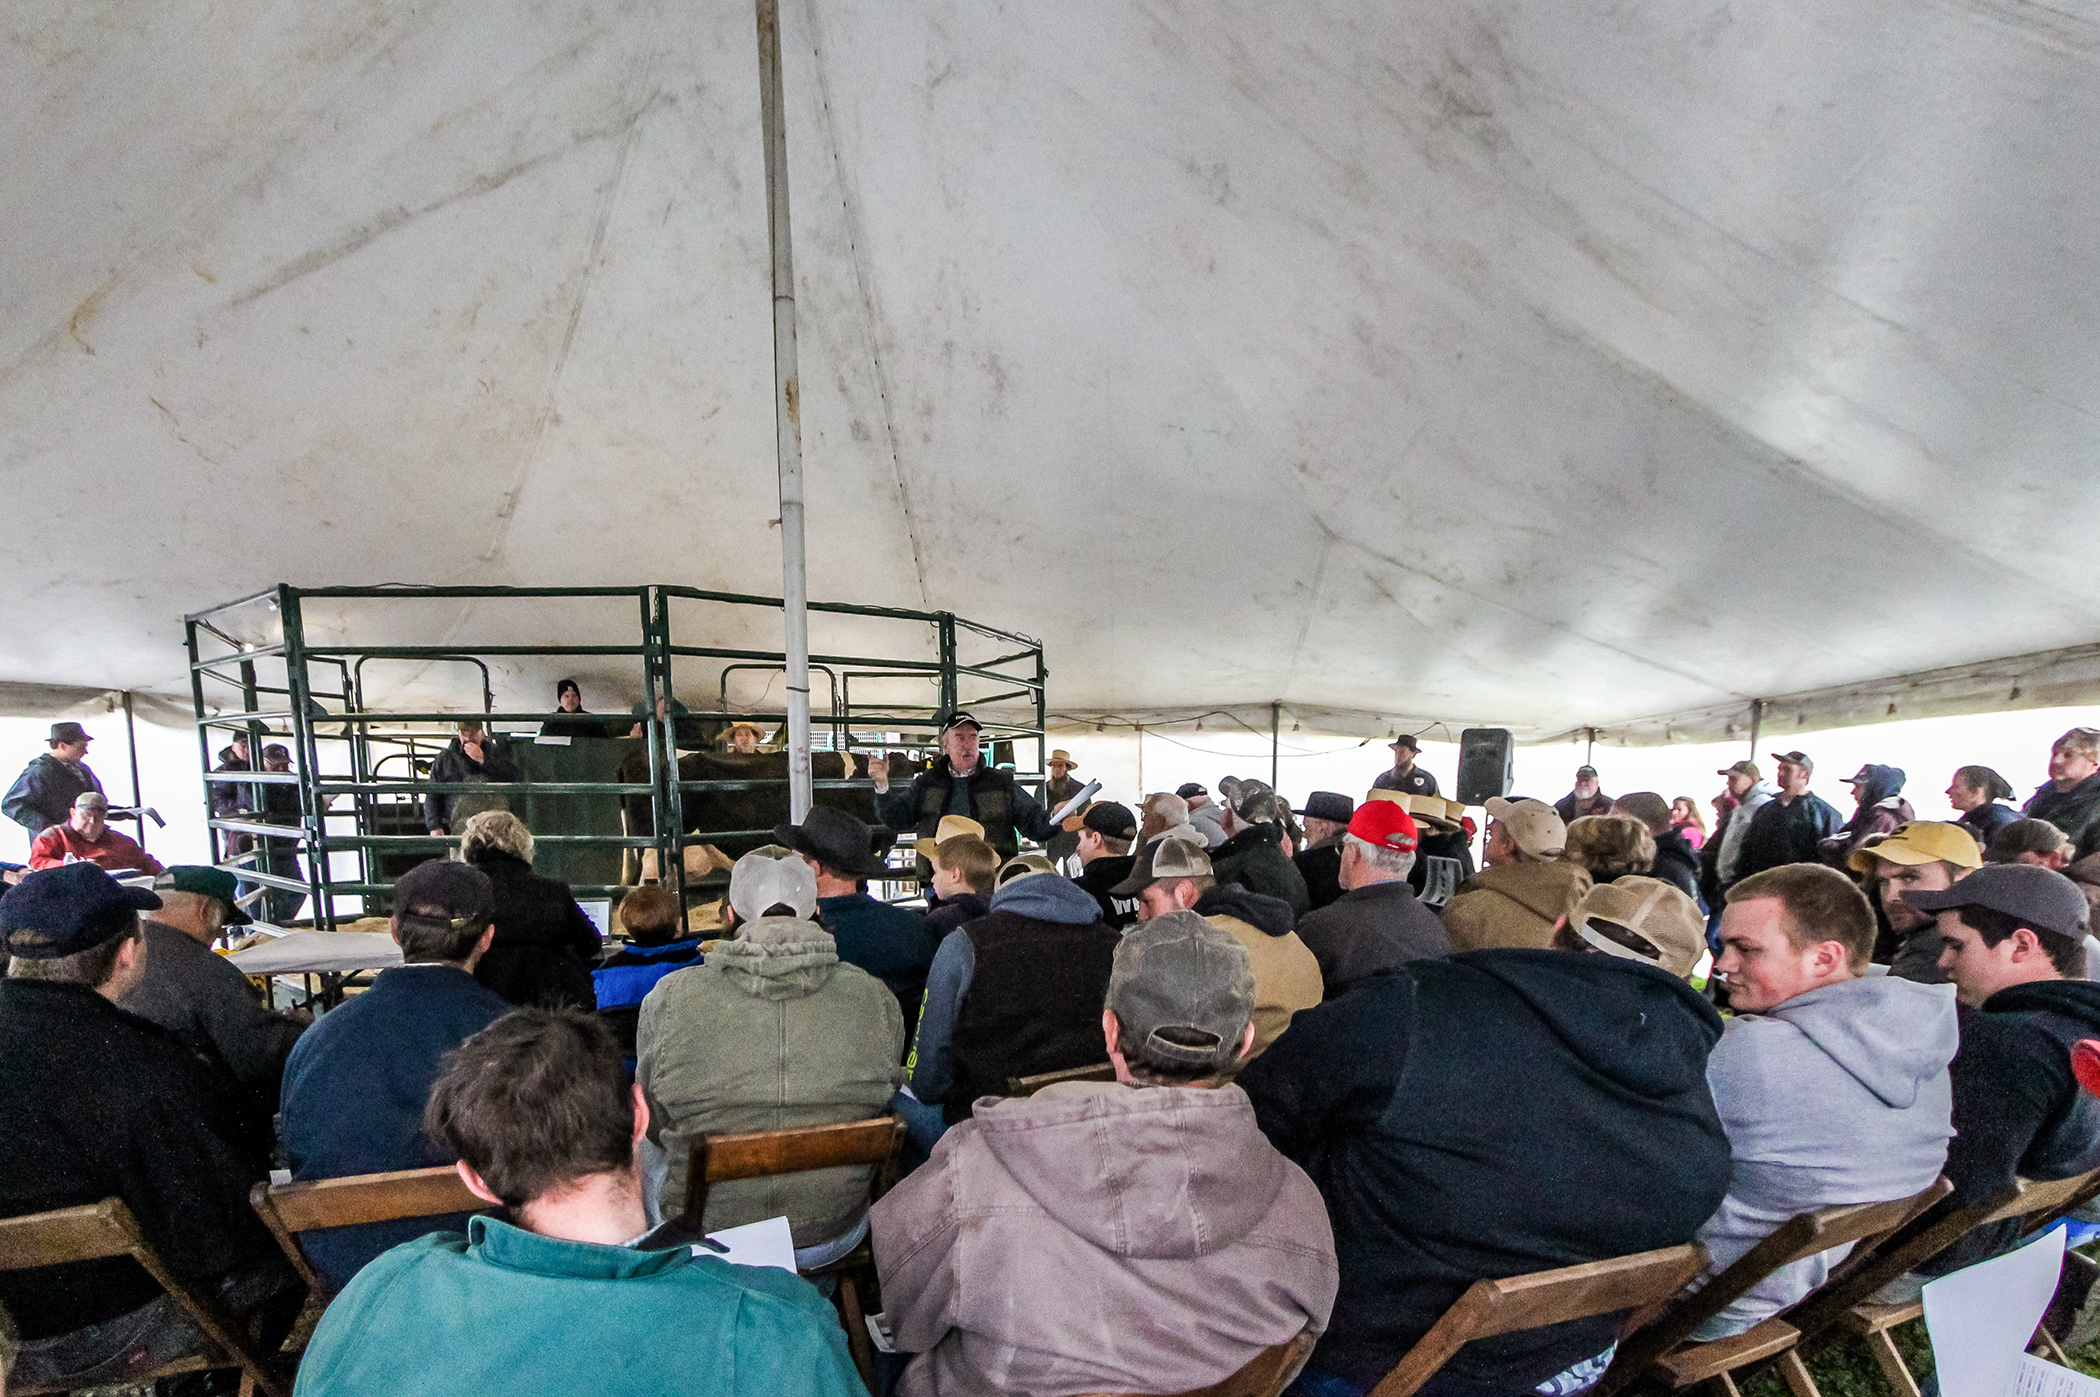
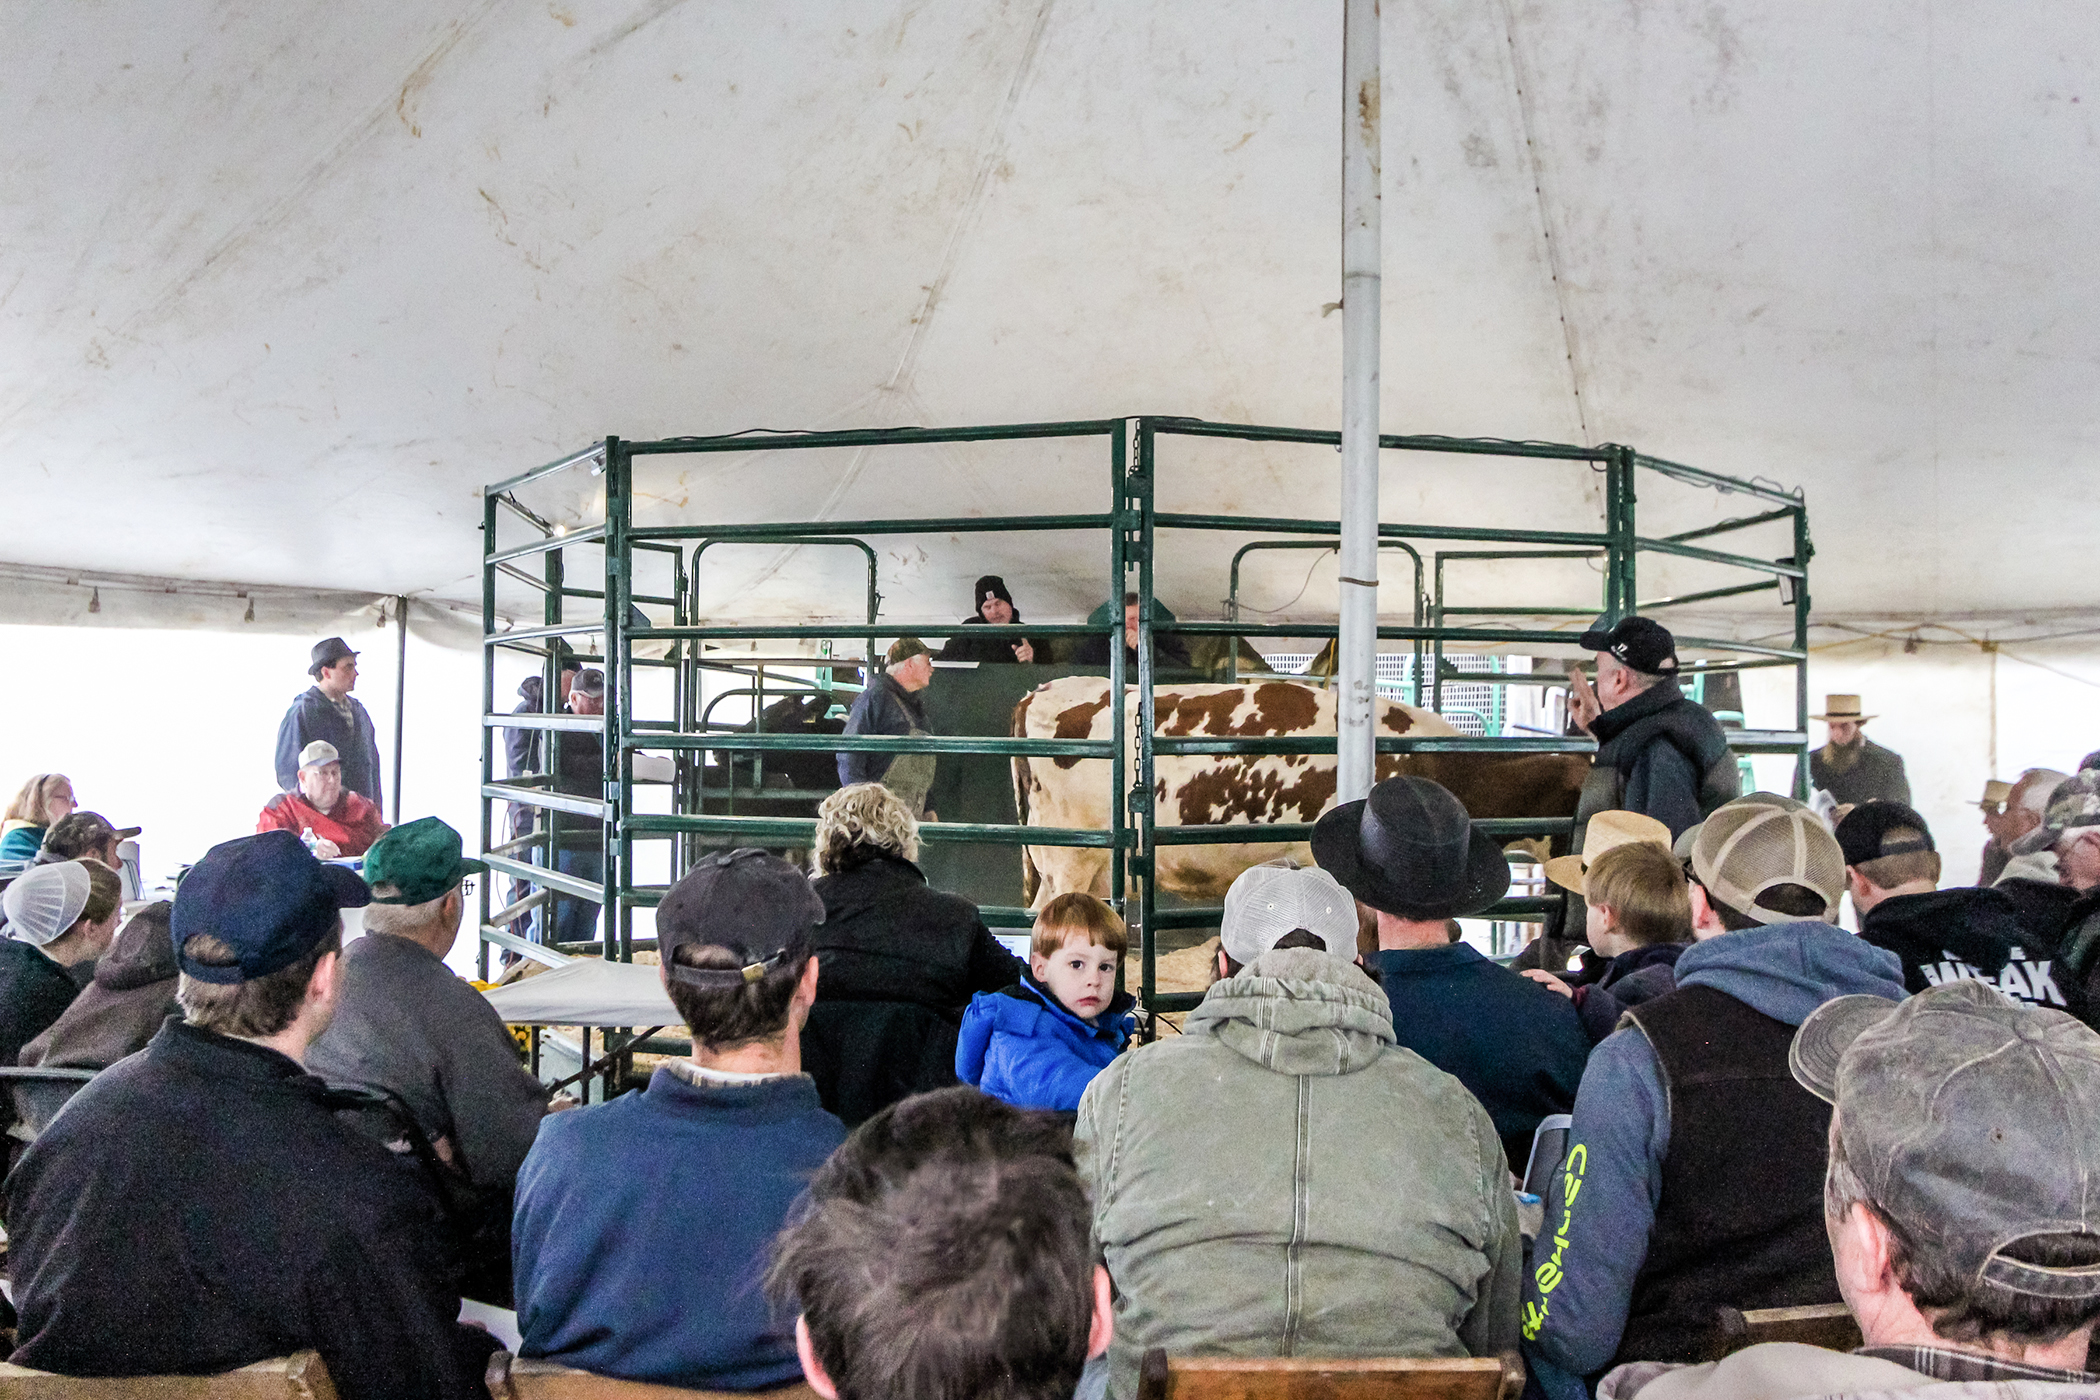
“It was a privilege to make the announcements on those 425 head, and I was impressed with the turnout of buyers, friends and neighbors as the tent was packed,” said Brandt after the sale. “The cows were in great condition and you could tell management was excellent.”

Mike gave Audrey the credit.

Before the rattle of cattle gates and the pitch of the auctioneer began, Audrey addressed the crowd with words that make the current dairy situation real for all who were there to hear them:

“We would like to welcome you to the Riverview Farms herd dispersal and thank you each for coming. Today feels a bit like attending my own funeral where we bury a piece of me, a piece of my family, and a piece of history, where we say goodbye to a lifestyle, to a way of life, to a lot of good times and many hardships as well. But I stand before you today proud to present to you a herd of cows that will do well no matter where they go.

 “This isn’t the end for these ladies, nor is it the end for us. I’ve had the privilege of managing the herd for the last 15 years and though we may not have done everything perfectly, we’ve done a pretty darn good job of developing and managing a set of cows that can be an asset to your herd. Everything being sold here today is up to date on vaccines. Any cows called pregnant has been rechecked in the last 10 days, Feet have been regularly maintained and udder health was always top priority. We culled hard over the last few weeks and have only the cream puffs left as the auctioneer Dave Rama says.

 “Though it feels like the end, it’s only the beginning of the next chapter, and we’re excited to see where God leads us next. Our milk inspector said once: it’s not a right to milk cows, it’s a privilege, and that’s exactly what this herd of cows was, a privilege.”

Her sister Ashlie’s husband Ryan Cobb offered a poignant prayer. The youngest grandchildren not in school, watched until lunchtime as the selling went through the afternoon, and the cattle were loaded onto trucks in the deepening rain at dusk.

As the sale progressed, a solemn reflection could be seen in the eyes of neighbors and peers. To see a local family sell a sizeable herd leaves everyone wondering ‘who’s next’ if prices don’t soon recover.

Nissley-Edits-21.jpg
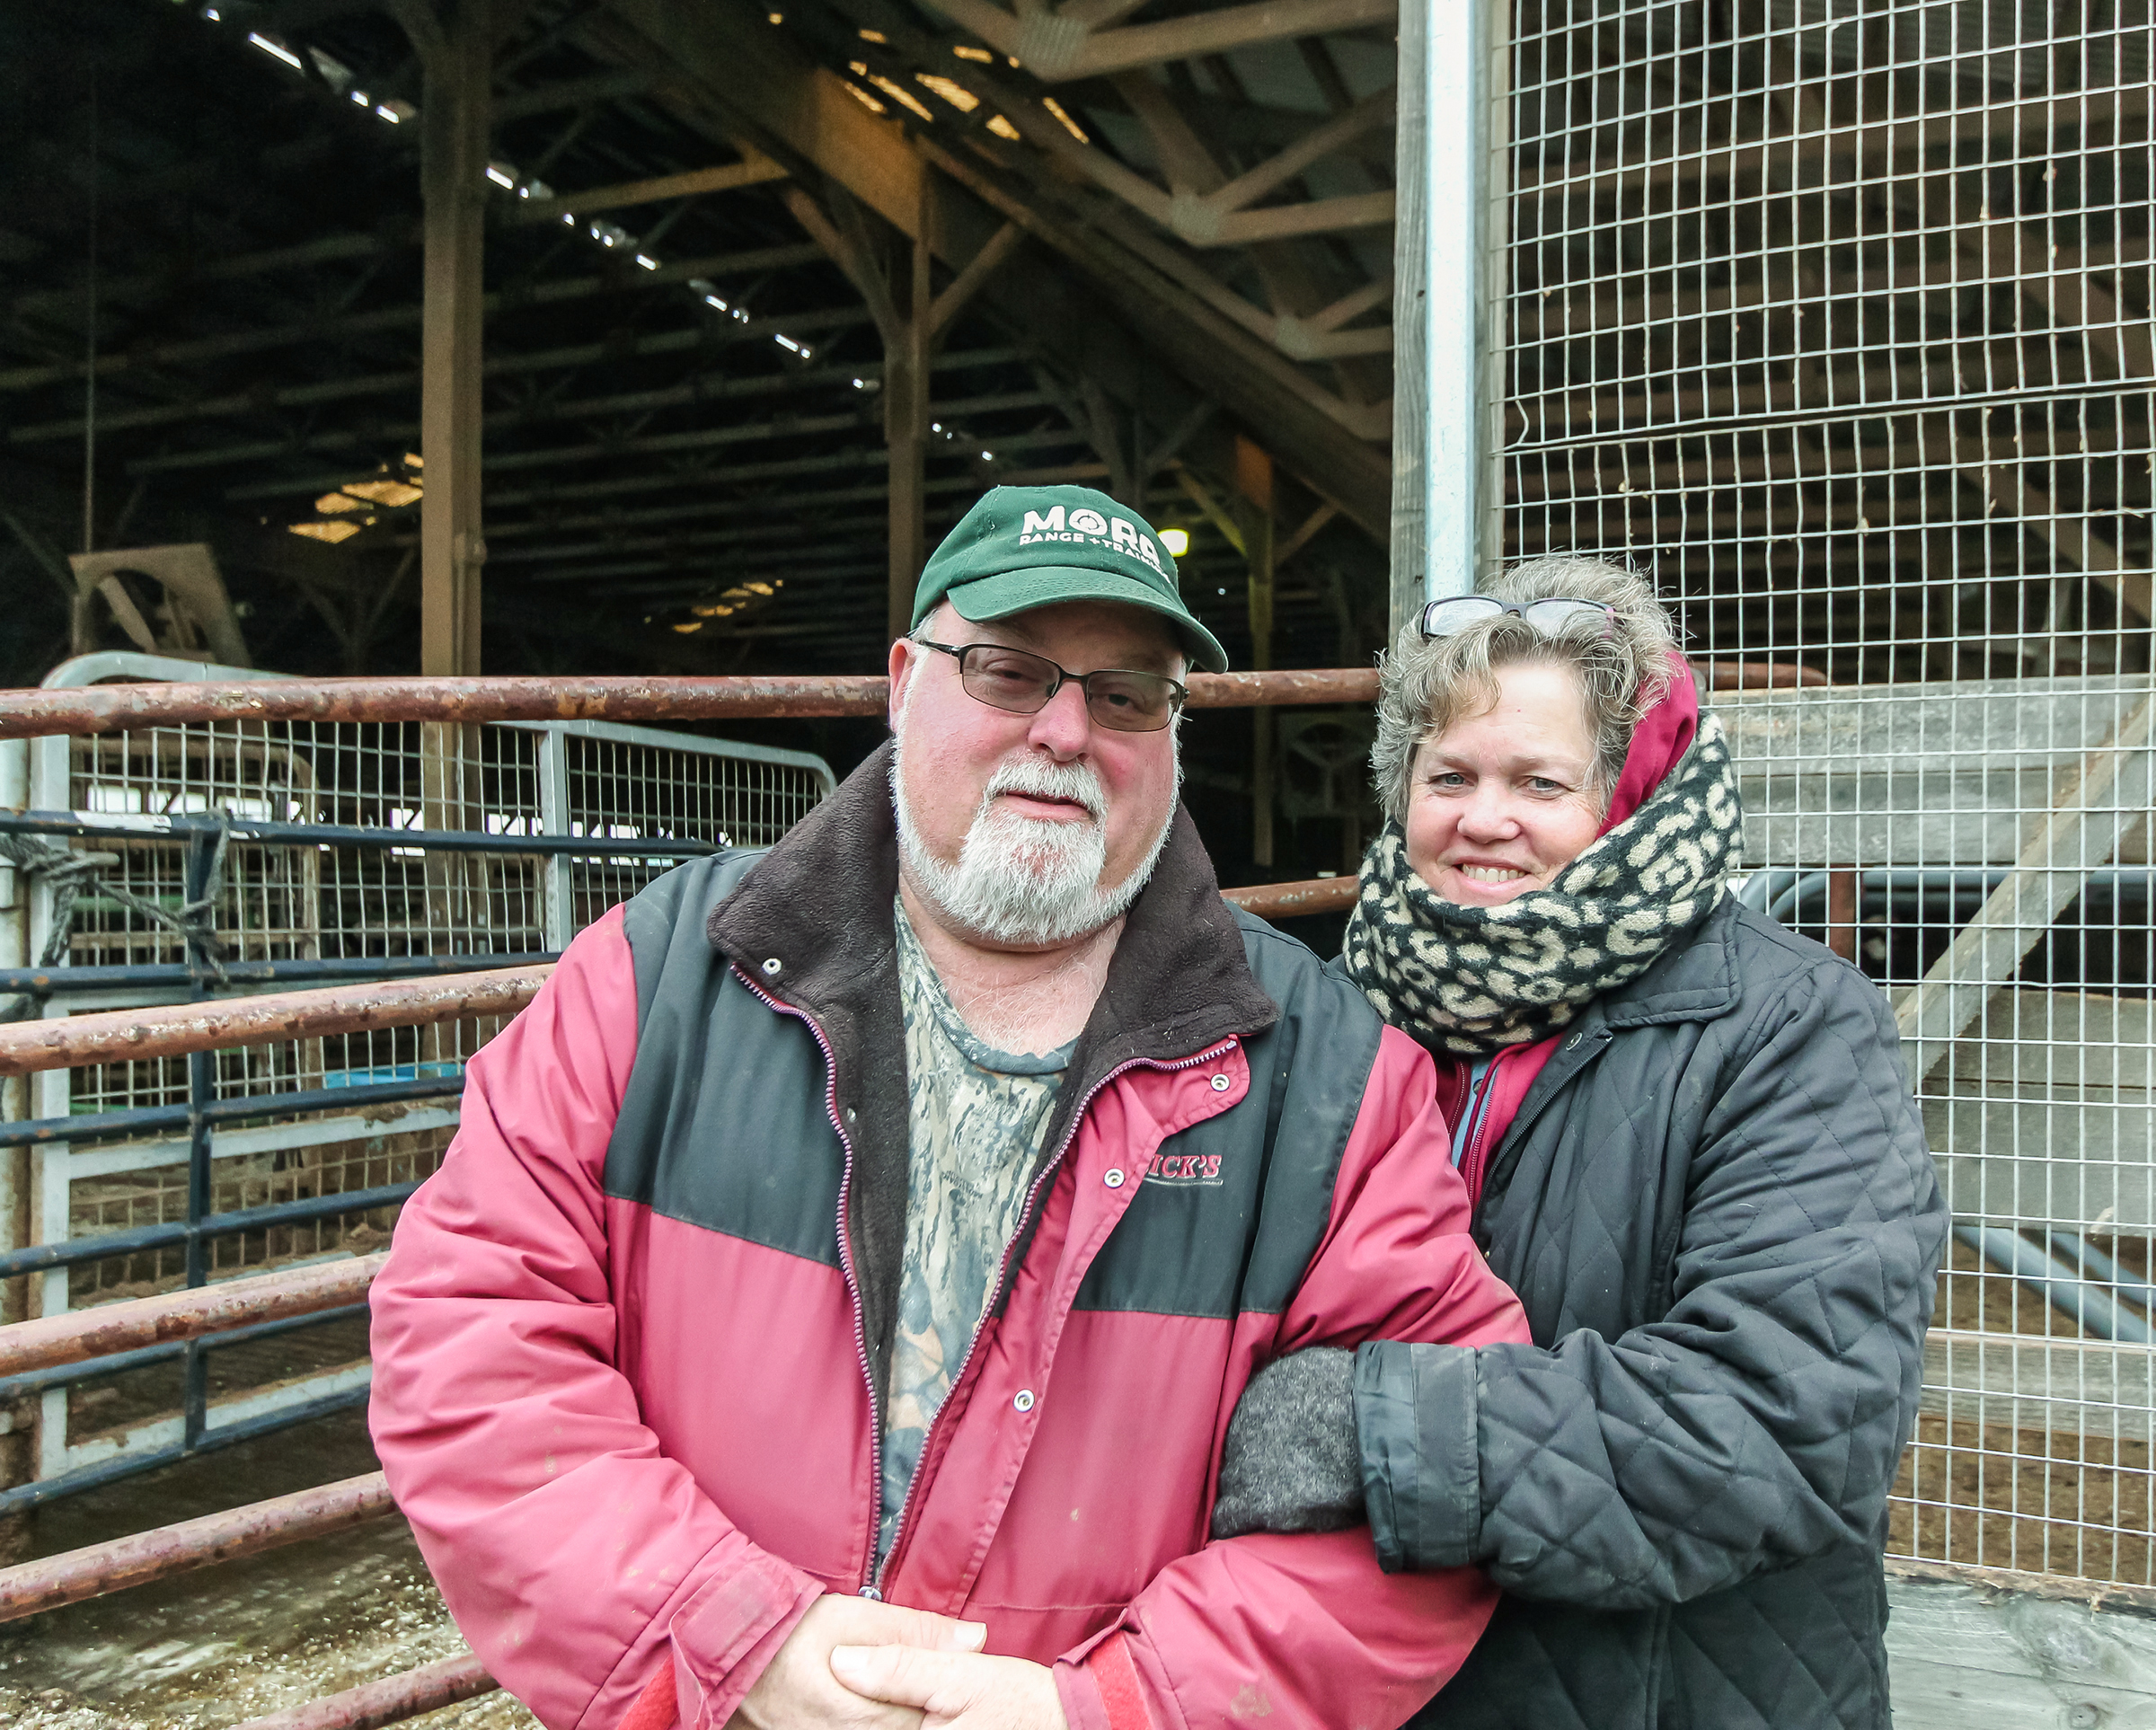
“It’s getting real,” says Mike. “Everyone is focused on survival, but we can see others are shook, not just for us, but because they are living it too.”

He has spent the last two years fighting to protect everything, including his family, “but now I surrender,” he says. “It feels like failure.”

There’s where he’s wrong. There are no failures here, except that the system is failing our farmers — and has been for quite some time — leaving good farmers, good dairymen and women, to believe it is they who have failed, when, in fact, they have almost without exception succeeded in every aspect of what they do.

Nancy is quick to point out that without Mike’s efforts and the family’s faith, “we wouldn’t have gotten this far, but now it’s time to see where God leads us next.”

Nissley2075.jpg

The dairy chapter closed last Friday for the Nissley family in Mount Joy, Pennsylvania, but they are looking forward to where God leads them next. Mike and Nancy Nissley are flanked by daughter and herdswoman Audrey (left) and son-in-law and feed manager Matt Breneman and son Mason and daughter Ashlie (right) and son-in-law Ryan Cobb.

“Never have we felt the love and support like we have now from our community,” Audrey relates.

Nancy tells of a group of 20 who met at the farm for a meal the night before: “They prayed with us and rallied around us and supported us.”

Mike feels especially blessed. “We’ve had people just come over and sit in our kitchen with us,” he says. “People say ‘we’re here for you.’ People I never met are reaching out to tell me ‘you’re not alone, you’ll get through it, and there’s life after cows.’”

His bigger concern is that, “The public doesn’t fathom what the real struggles are out here. They have no idea where their food comes from and what it takes to produce it, the hours of work, of being tied to it 24/7/365. As farmers, we don’t have the resources or the time to correct all the misinformation when everyone believes what they see on social media.

“They go in a store and see milk still sold at $4.75/gal. The ice cream mix we buy for our ice cream machine costs the same as it did in 2014, when farm milk prices were much higher. DFA and Land O’Lakes report big annual profits. Where does the money go? Where did our basis go? It used to be $3.00 and now it’s barely 50 cents. There’s not one area to fix if the system is broken,” Mike says further.

“When you really look at this,” he says, “it’s amazing how little farms get for the service they provide, but if the public doesn’t know or understand that service, then they won’t expect the farmers to receive more and will actually make it harder for the farms to do with less.”

Nissley-Edits-25.jpg
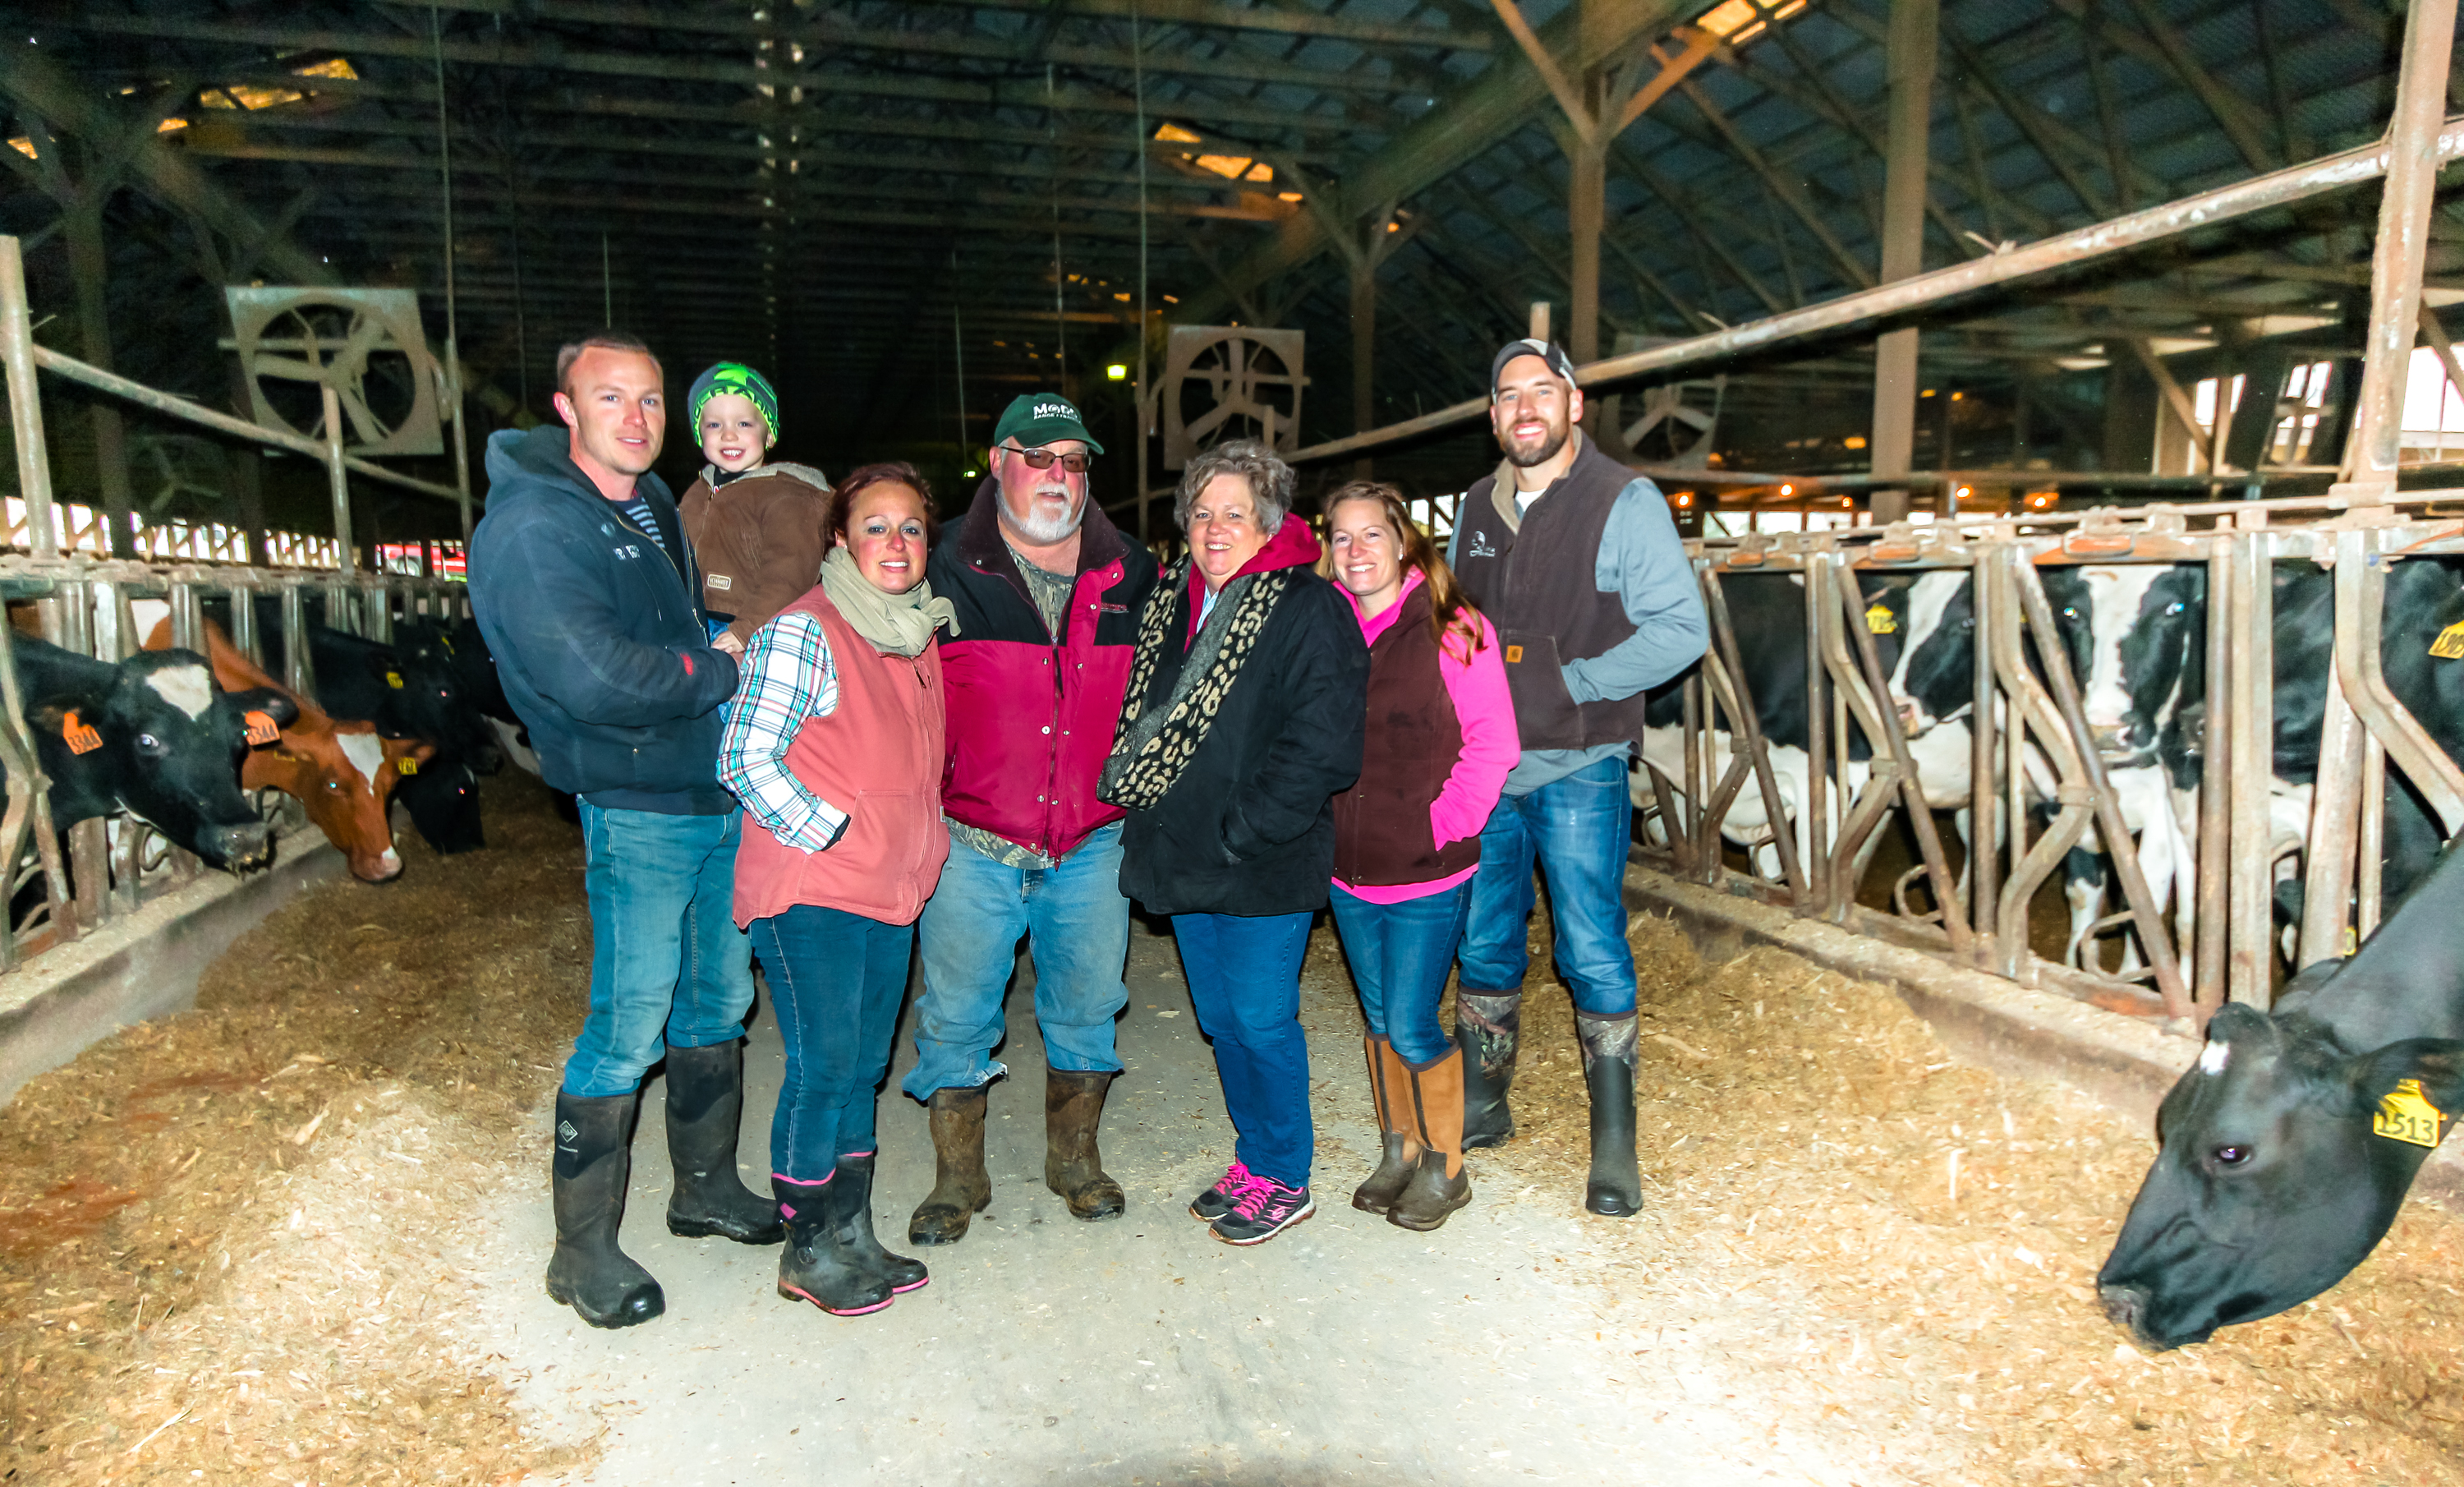
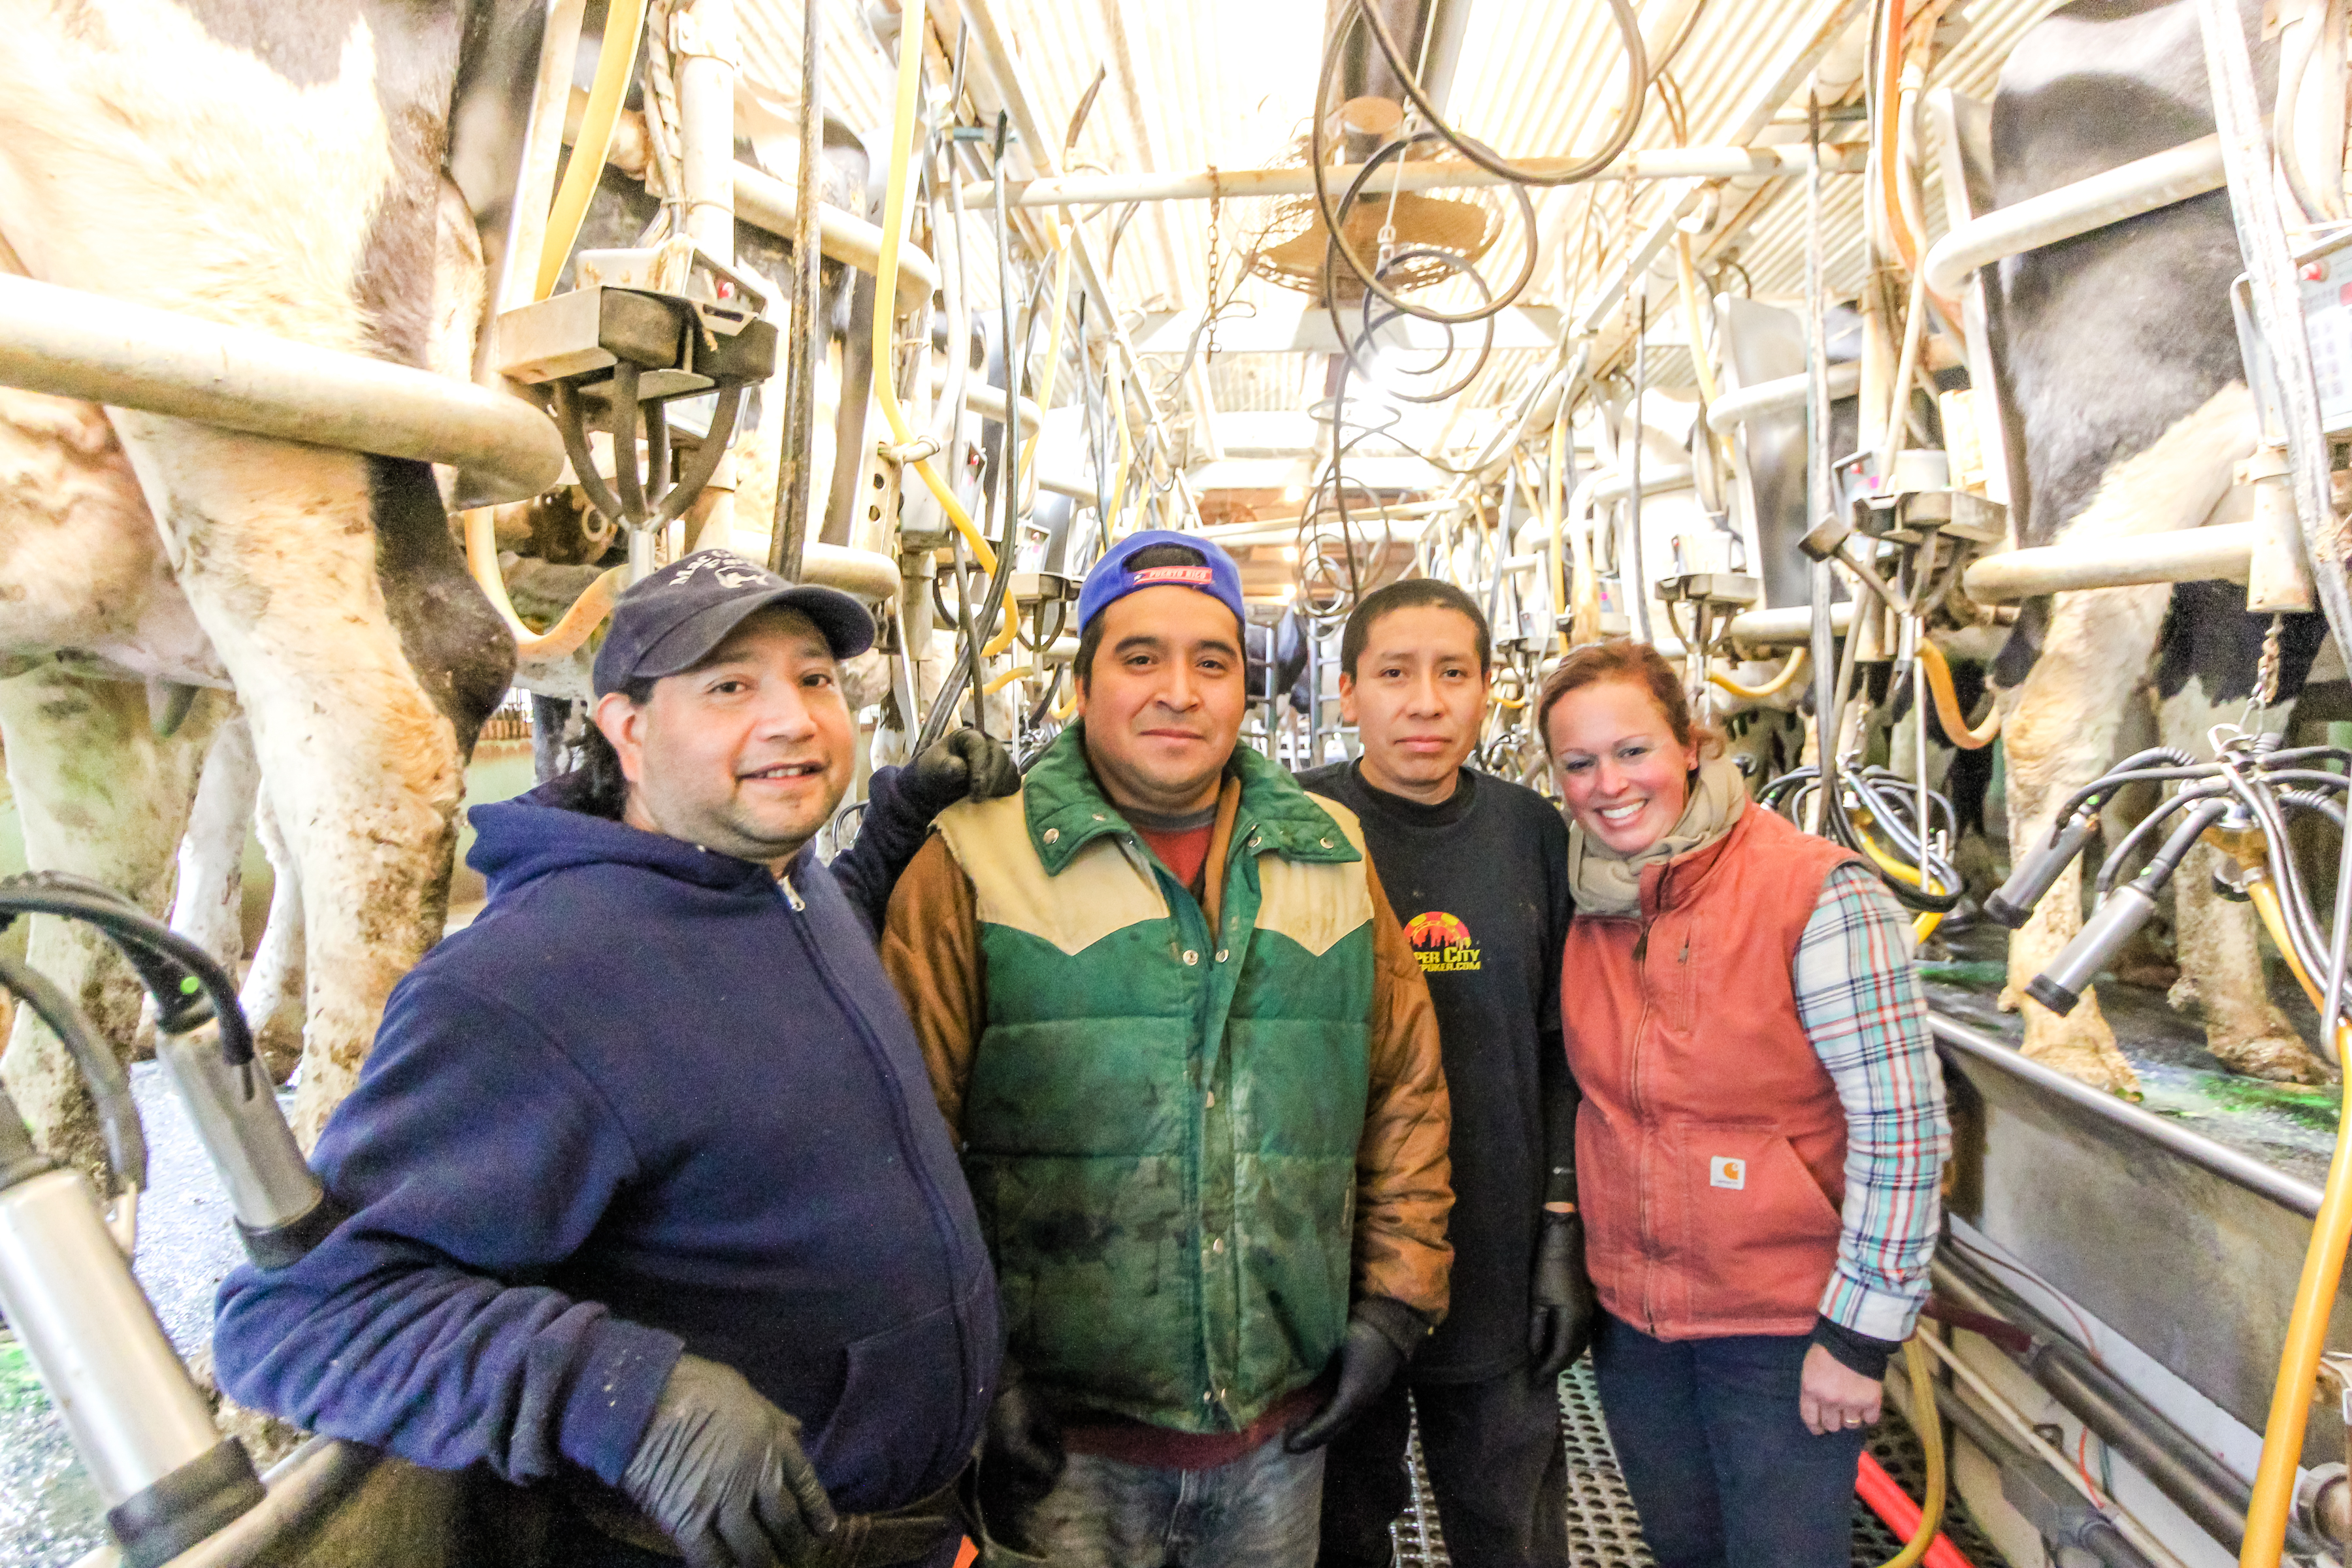
The Riverview herd had good production and exceptional milk quality. Making around 25,000 pounds with SCC averaging below 80,000, Mike is “so proud of the great job Audrey has done. Without that quality, and what was left of the bonus, we would have had no basis at all,” he says, explaining that Audrey’s strict protocols and commitment to cow care, frequent bedding, and other cow comfort management — as well as a great team of employees — paid off in performance.

But at the same time, with all the extra hauling costs and marketing fees being deducted from the milk check, the quality bonus would add, but the subtractions would erode it.

He notes further that a milk surplus doesn’t seem to make sense when the bottom third — or more — of every herd that sells out is going straight to beef.

The Nissleys are emerging from the deepening uncertainty that all dairy farm families are living right now in a country where we have Federal Orders for milk marketing, and yet we are seeing an expedited disorderly death of dreams at kitchen tables where difficult decisions are being made.

Nissley2097Trying to stay afloat — and jockeying things around to make them work — “has been horrible,” said Nancy. She does the books for the farm and has a catering business.
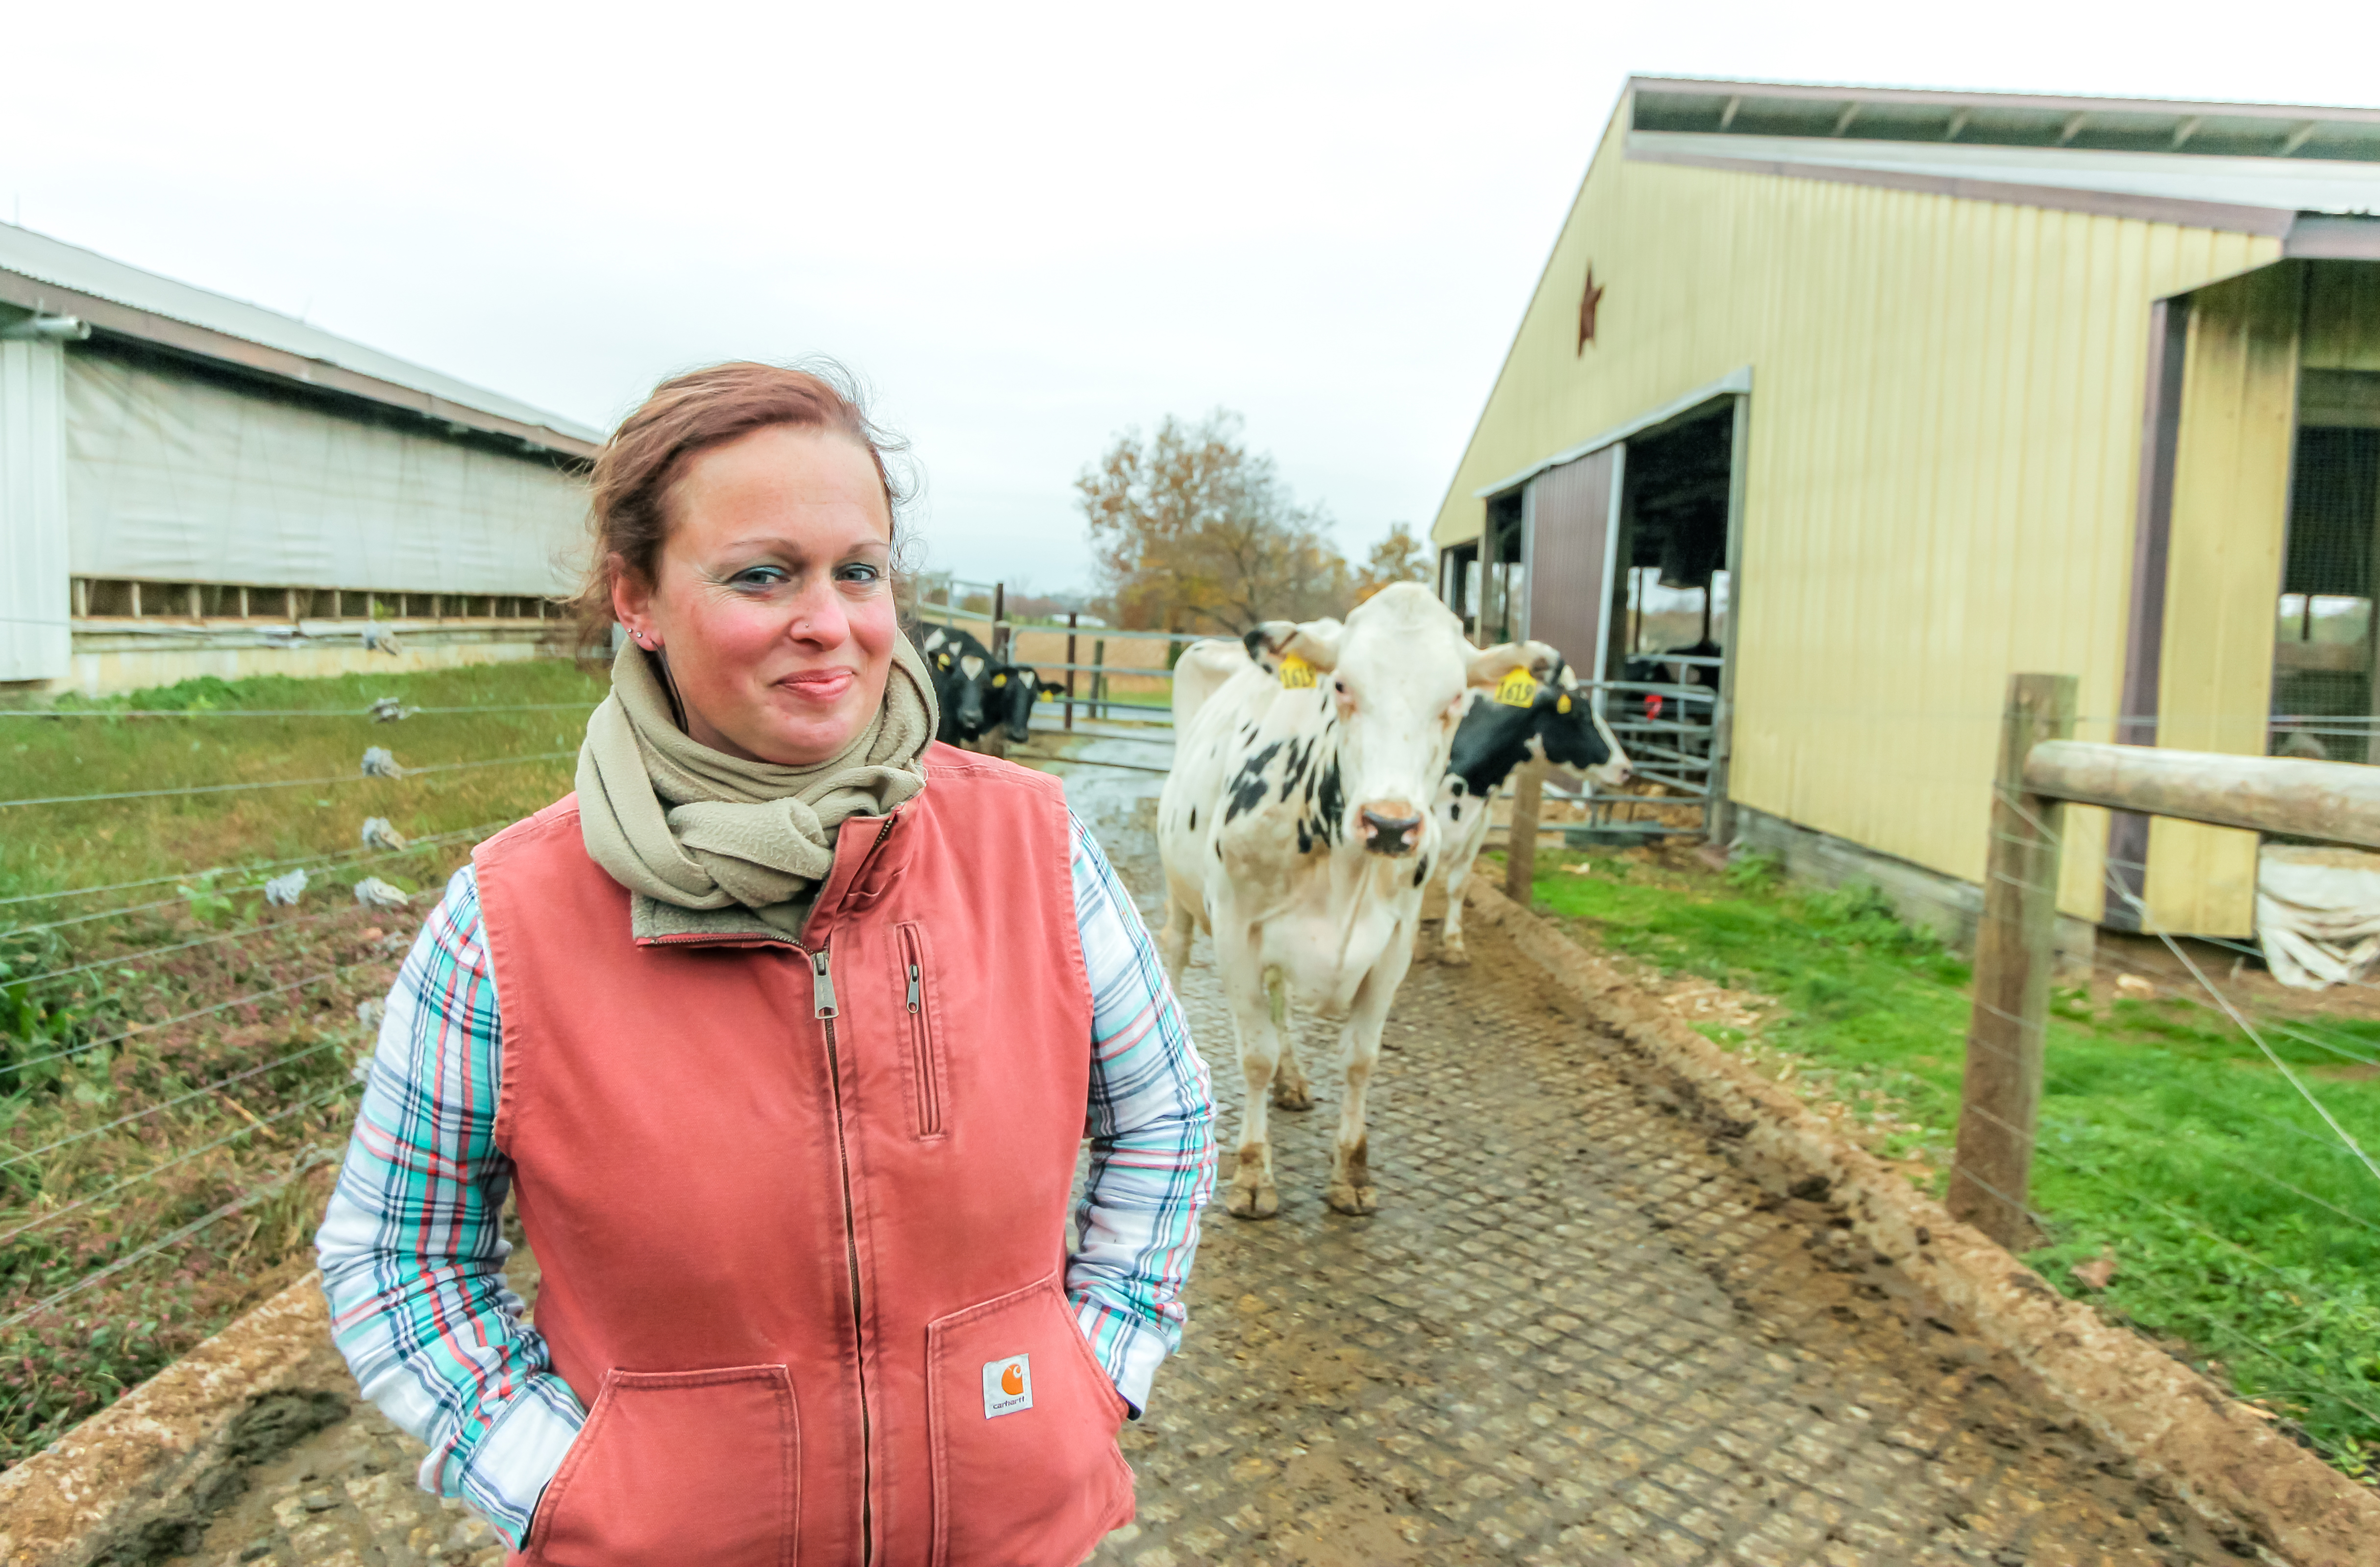
Financial and accounting consultants advised holding off the sale for the bit of recovery that was expected by now. But it never materialized, and in fact, prices went backward.

“The question for us became ‘how much longer do we keep losing money hoping that things will get better?” Audrey suggests. “We had to start figuring our timeline.”

She has been the full-time herd manager here for 15 years since graduating from Delaware Valley University with a dairy science degree. Husband Matt has been the full-time feed and equipment maintenance manager.

Nissley2062

Cows have been part of Audrey Breneman’s life as long as she can remember. “They are part of who I am,” she says. Graduating from Del Val with a dairy science degree in 2003 and working full-time for 15 years as herdswoman at then 400-cow dairy farm started from scratch by her parents Mike and Nancy Nissley, have given her options as she moves forward after the sale of the family’s dairy herd.

She loved the cows. Their care was her passion, and the herd record and condition reflected this. But even the strongest dairy passion has limits when tested in a four-to-five-year-fire of downcycled prices.

“It’s too much work to be doing this for nothing,” she says.

With two young children of her own, Audrey could not envision doing the physical work, the long hours, with no sign of a future return that would allow her and her husband to invest in facilities, equipment and labor. How many years into the future could they keep up this pace, continually improving the herd and their milk quality, but feeling as though they are backpeddling financially?

These are the tough questions that the next generation is asking even as their parents wonder how to retain something for retirement, especially for those like Mike and Nancy who are still a way off from that.

We hear the experts say that the dairy exits are those who are older and deemed this to be “time,” or that the farms selling cows are doing so because their facilities have not been updated, or because they don’t have a next generation interested.

These oversimplified answers seek to appease. The truth is that in many cases — like this one — there is a next generation with a passion and skills for dairy farming.

The problem is the math. It doesn’t add up.

How are next generation dairy skills and passions to take hold when the market has become a flat-line non-volatile price? There are no peaks to go with the valleys because the valley has now become the price that corresponds directly with the lowest cost of production touted by industry sources and policymakers when talking about the nation’s largest consolidation herds in the west — and how they are dropping the bar on breakevens.

How are the next generation’s dairy passions to take hold when mailbox milk checks fall short of even Class III levels in much of the Northeast where farms sit within an afternoon’s drive of the major population centers

In Audrey’s 15 years as herd manager, there have been other downcycles, but they were cycles that included an upside to replenish bank accounts and hope. The prolonged length of the current downcycle brings serious doubt in the minds of young dairy producers about a sustainable future, but are the industry’s influencers, power centers and policymakers paying attention?

wNissley-Edits-39

Cows congregate in the two freestall barns and in the meadow by the road as a holding area during the Nissley family’s sale of the dairy herd Friday while the milking team milks for the last time in the nearby parlor.

Like many of her peers transitioning into family dairy businesses, the past four years have been draining. Much depends upon how far into a transition a next generation is, what resources they have through other diversified income streams in order to have the capital to invest in modernizing dairy facilities and equipment.

Without those capital investments, these challenging dairy markets combine with frustrating daily tasks when there is insufficient return to reinvest and finding and securing sufficient good labor also becomes an issue.

Nissley-Edits-28.jpg

As difficult as it is for the Nissley family, they are also concerned for their family of employees. The herd’s production and excellent milk quality are very much a team effort, they say, and the team of milkers pictured with Audrey (l-r) Manuel, Willie and Anselmo were busy Friday with the last milking at Riverview as cows came through the parlor all day ahead of their sale and transport.

The Nissleys are quick to point out that as hard as this has been for their family, it is also hard on their family of employees. They, too, are hurting.

“This is what I wanted to do all my life. It was our dream when we were married. I had a love for it and Nancy had a love for it,” says Mike, whose dairy dream was ignited by visits to his grandfather’s farm. Nancy grew up on a farm too, but the cows were sold in the 1970s.

The couple worked on dairy farms in the early years and saved their money. In 1994 they started dairying on their own farm with 60 cows. In September 2007, they moved to the Mount Joy location and began renovating the facilities for their growing herd.

Cows have been part of Audrey’s life as long as she can remember. “They are part of who I am,” she says, adding that she is glad to have her dairy science degree, along with the dairy work ethic and experience. “Here we are selling the cows, and I have opportunities to consider that I may not otherwise have. That degree is a piece of paper no one can take away from me.”

As the Nissleys closed this chapter Friday, they turn to what’s next. Nancy says she looks forward to being able to do things together they couldn’t do before while being tied to the dairy farm. As to what they will do on the farm, she says “God has not steered us wrong yet. Yes, it’s scary, but we also have faith that He is in this.”

Nissley2016

Mike and Nancy Nissley aren’t sure what the future looks like, but they say they are feeling the prayers, calls, texts and support of friends, family and community. That’s what is getting them through these days.

Mike has also gained new perspective. He observes that for any dairy family that has a future generation with a long-term goal, it makes sense to stay in and try to ride this out. “But if you have any question about that long-term goal, have the tough conversations about your options.

“It’s easy to lose perspective. For the last two years, I lost my perspective because I was so focused on survival. That’s what I take away from this, the importance of getting perspective. We are first generation farmers. We started with no cows 25 years ago and have 850 animals today. It’s hard to see it all dismantled and be worth nothing. But we’re not second-guessing our decision.”

Talking and praying with friends and acquaintances, Mike believes that, “We go through things, and we can’t let it drag us down but use it for God’s glory.”

Under the milky white November sky spilling rain like tears, he says that while the sale “feels like the death of a dream, I know I’ve been blessed to have shared this dream with my wife and to work alongside our daughter and to see the great things she was able to do with this herd, for as long as we could. I’m thankful for that.”

The sale started at 10 a.m. Over 400 cattle were loaded in the deepening rain at dusk as the dairy chapter closed at Riverview Farm, Mount Joy, Pennsylvania, and two generations of the Nissley family said there’s no looking back, only forward to where God leads them next.