Covering Ag since 1981. The faces, places, markets and issues of dairy and livestock production. Hard-hitting topics, market updates and inspirational stories from the notebook of a veteran ag journalist. Contributing reporter for Farmshine since 1987; Editor of former Livestock Reporter 1981-1998; Before that I milked cows. @Agmoos on Twitter, @AgmoosInsight on FB #MilkMarketMoos
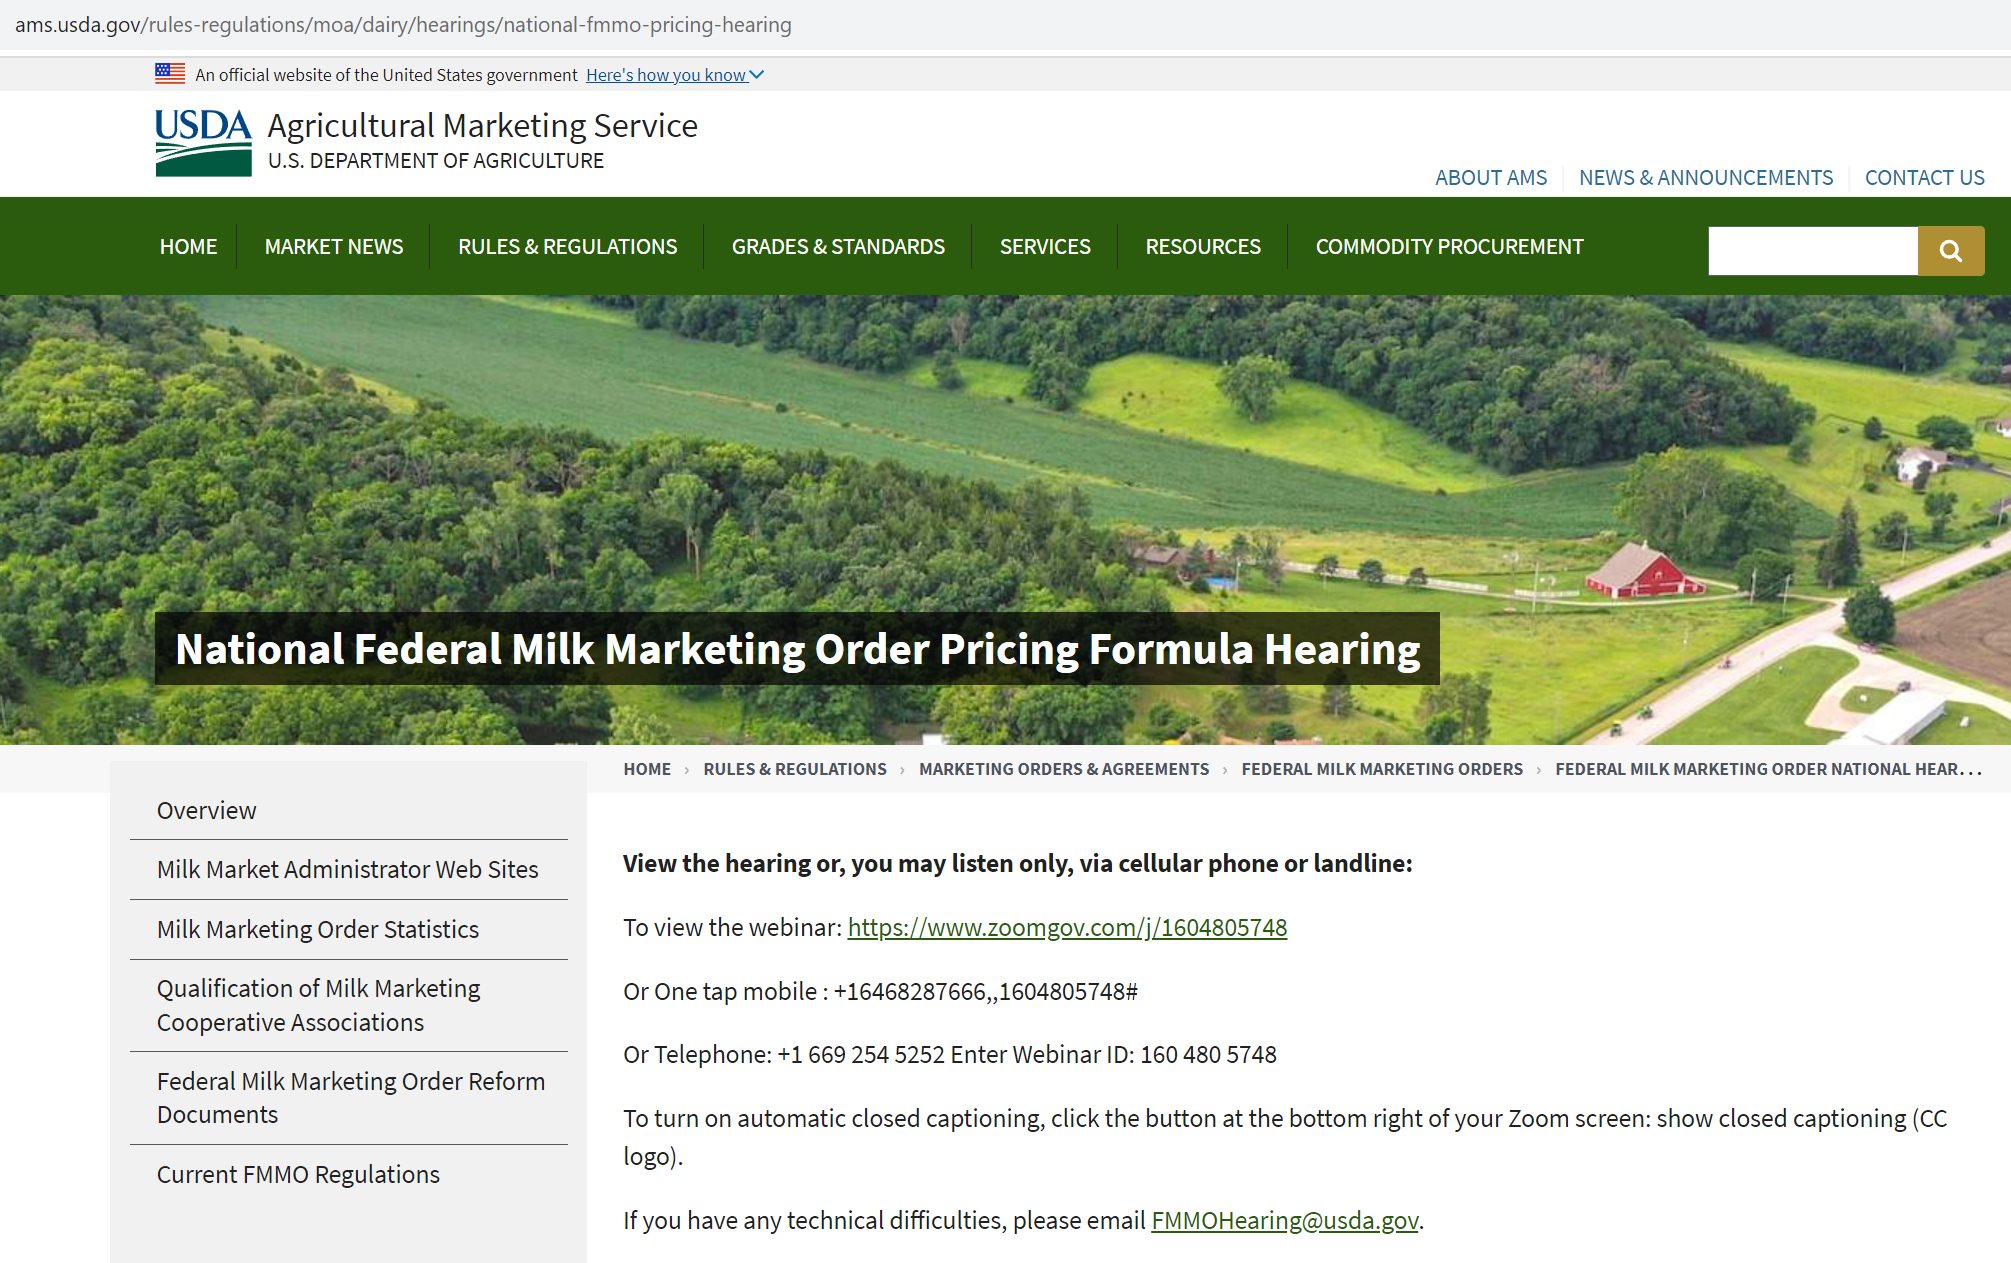
CARMEL, Ind. — USDA’s much anticipated national public hearing of 21 proposals on amendments to uniform pricing formulas for all 11 Federal Milk Marketing Orders (FMMO) had a rocky start on Wednesday, Aug. 23 in Carmel, Indiana. The first day kicked off amid objections to the hearing scope as fluid milk processors were seeking to get their excluded Class I proposals onto the docket.
The presiding administrative law judge set the stage for what he said will be an estimated 7-week hearing, held 8 to 5 ET every weekday with virtual farmer testimony on Fridays. (It is being livestreamed for watching by zoom or listening by phone. Look for that information in the graphic above, or find the links and numbers at the end of this article or at the hearing webpage).
The judge stated his authority to interrupt for comments or testimony outside of the hearing scope. “I will not issue a decision,” he said. “USDA will take the information to render a decision.”
Once a recommended decision is put forward by USDA, expected in February or March 2024, a comment period follows before the final decision is issued in June or July and made fully effective in the fall of 2024. Some proposals call for a 12-month delay in implementation, so the full effect of potential decisions could be delayed until fall of 2025.
Given the rocky start to the hearing, even this timetable could be prolonged, but USDA is under a Congressional mandate to render decisions within 18 months of a petition it agrees to hear.
Immediately following the setting of the stage, Chip English, attorney for the Milk Innovation Group (MIG) put forward an objection and a motion seeking reversal of USDA’s decision that excluded two of its Class I pricing proposals from the hearing announcement. One of the excluded proposals would exempt organic milk from FMMO pools and the other deals with ‘shrink’ in the extended shelf life category.
Attorney Chip English for the Milk Innovation Group (MIG) kicks off federal milk pricing hearing with objections to scope, saying two of their Class I pricing proposals were improperly excluded. Screen capture from livestream of first day of 7-week national public hearing on federal milk pricing formulas
“It’s all coming in whether you like it or not,” said English, “because at the end of the hearing, we’re going to be talking about raising Class I, and these are issues that have to be part of that.”
Attorney John Vetne for National All Jersey joined in the objection on procedural grounds because NAJ also had its proposal to make all 11 FMMOs use multiple component pricing was rejected from the hearing. Currently, the 3 southern marketing areas and Arizona are fat/skim priced, whereas the other 7 marketing areas use multiple component pricing (MCP). USDA excluded this proposal since the 4 fat/skim priced marketing areas must regionally call for the change to MCP pricing.
Within the first hour and a half of the first day, the hearing went “off record” into private discussion about handling the objections and handling the exhibits.
In addition to the hearing scope objections, there was extensive cross-examination of USDA AMS Dairy Program staff on its fulfillment of data requests and various exhibits provided by USDA — in some cases calling into question the comparability or reliability of some of the data.
For example, much was made of the differences between the USDA mailbox milk price report as compared to the Federal Order price announcement. Mr. English probed USDA staff on how these reports are audited, how the data is collected, what is included and what it is based on. He did what he has done in Pennsylvania Milk Marketing Board (PMMB) hearings in the past to discredit the comparability of the mailbox price report to state or federal “announced price” reports — because of the differences in the “auditing”.
As each exhibit on pooling figures and other data was put under the cross-examination microscope, the issue of “restricted” data came up due to “confidentiality,” which USDA staff explained is necessary when 2 or fewer companies are in a marketing area — be they plants or farms. In the rapidly consolidating dairy industry, what does this foretell of future market transparency if data are not available for price discovery and market transparency because of too few operators in a region?
There were attempts to keep some exhibits from being included in the hearing record. Most of these discussions were put on hold to be explored through further cross-examination at a later time with future witnesses.
In many ways the sense of this round of cross-examination on exhibits felt a bit like cutting the legs out from under future presentation of proposal testimony even before they get to the floor. Basically, much legal maneuvering on data before the first proposal is even heard and testified to.
If the first day is any indication of what is in store, expect to see many attempts to push the scope boundaries, and expect the judge to err on the side of making sure USDA has all of the information it needs to render decisions, so some latitude will likely be given for these boundary explorations by attorneys.
Attorney English, is well known to any Pennsylvania dairy farmer who has ever sat in on a PMMB hearing in Harrisburg. He has represented Dean Foods and the Pennsylvania Milk Dealers in past years on the price-setting hearings conducted by the PMMB. In fact, the esteemed milk accountants of Herbein and Co. in Pennsylvania are providing material for some of the MIG opposition arguments to come. Cheap Class I milk is the name of the current game.
The MIG will be working overtime through Mr. English to make sure Class I prices are not raised, and in fact are lowered at the farm level since one of their proposals that WAS accepted by USDA is to remove the base Class I price differential of $1.60/cwt from every FMMO — across the board.
Who is the MIG? The Milk Innovation Group members include Anderson Erickson Dairy Co., Inc.; Aurora Organic Dairy; Crystal Creamery; Danone North America; Fairlife; HP Hood LLC; Organic Valley/CROPP Cooperative; Shamrock Foods Company; Shehadey Family Foods, LLC (Producers Dairy Foods, Inc.; Model Dairy, LLC; Umpqua Dairy Products Co.); and Turner Dairy Farms.
After lunch, some high points of the first day included Dr. Roger Cryan for American Farm Bureau Federation requesting volume data on all of the salted and unsalted butter that is graded by USDA AMS for retail. This, he said, is four numbers and should be readily available. It is germane to AFBF’s proposal to include unsalted butter in the product price survey used in the Class IV pricing formula.
Testimony began late in the afternoon on the first proposal from NMPF to raise component levels in the uniform pricing formulas to more accurately reflect today’s protein and other solids levels.
Peter Vitaliano, NMPF’s vice president for economic policy and market research, laid out the proposal and was subjected to intense cross-examination with the promise of hours more of cross examination on the second day by Mr. English before even getting to the first expert fact witness — Calvin Covington, for Southeast Milk and NMPF.
While NMPF witnesses will show the outdated component levels are giving a ‘deal’ to Class I processors paying less for skim that is more valuable today in terms of components, IDFA’s attorney Steven Rosenbaum grilled Vitaliano on this. He tried on seven attempts to establish that the fat/skim orders in the Southeast don’t have component levels as high as the national average by asking for this breakout in seven differently-phrased questions, all the while discreetly suggesting that this change would “overpay” producers in fat/skim orders.
He also questioned how fluid milk processors are supposed to recoup that value if it doesn’t “fill more jugs of milk”. Vitaliano responded to say that protein beverages are a big deal to consumers, and some milk marketing is being done on a protein basis. Rosenbaum asked for a study showing how many fluid processors are doing that, and then basically said, in lawyer speak, the equivalent of ‘never mind,’ as Vitaliano interjected that it’s more valuable to consumers.
In this reporter’s mind, the thought that kept popping up during that exchange was this: If IDFA and MIG are so intent on suppressing the Class I price to avoid paying for the improved value of milk, then maybe they should then start forking over their cost data in audited surveys to the USDA to justify the $3.60 per hundredweight they are getting subtracted from the base Class I price in the form of Class III and IV make allowances that do not even apply to them, but they get that deal anyway.
These are just a few thoughts from an intense first day of the national FMMO hearing that NMPF is calling the “first in a generation opportunity” to make key adjustments to the milk pricing formulas to reflect a changing dairy industry. It appears that many of their proposals will help farmers… We’ll see over the next 6 to 8 weeks where it’s all going.
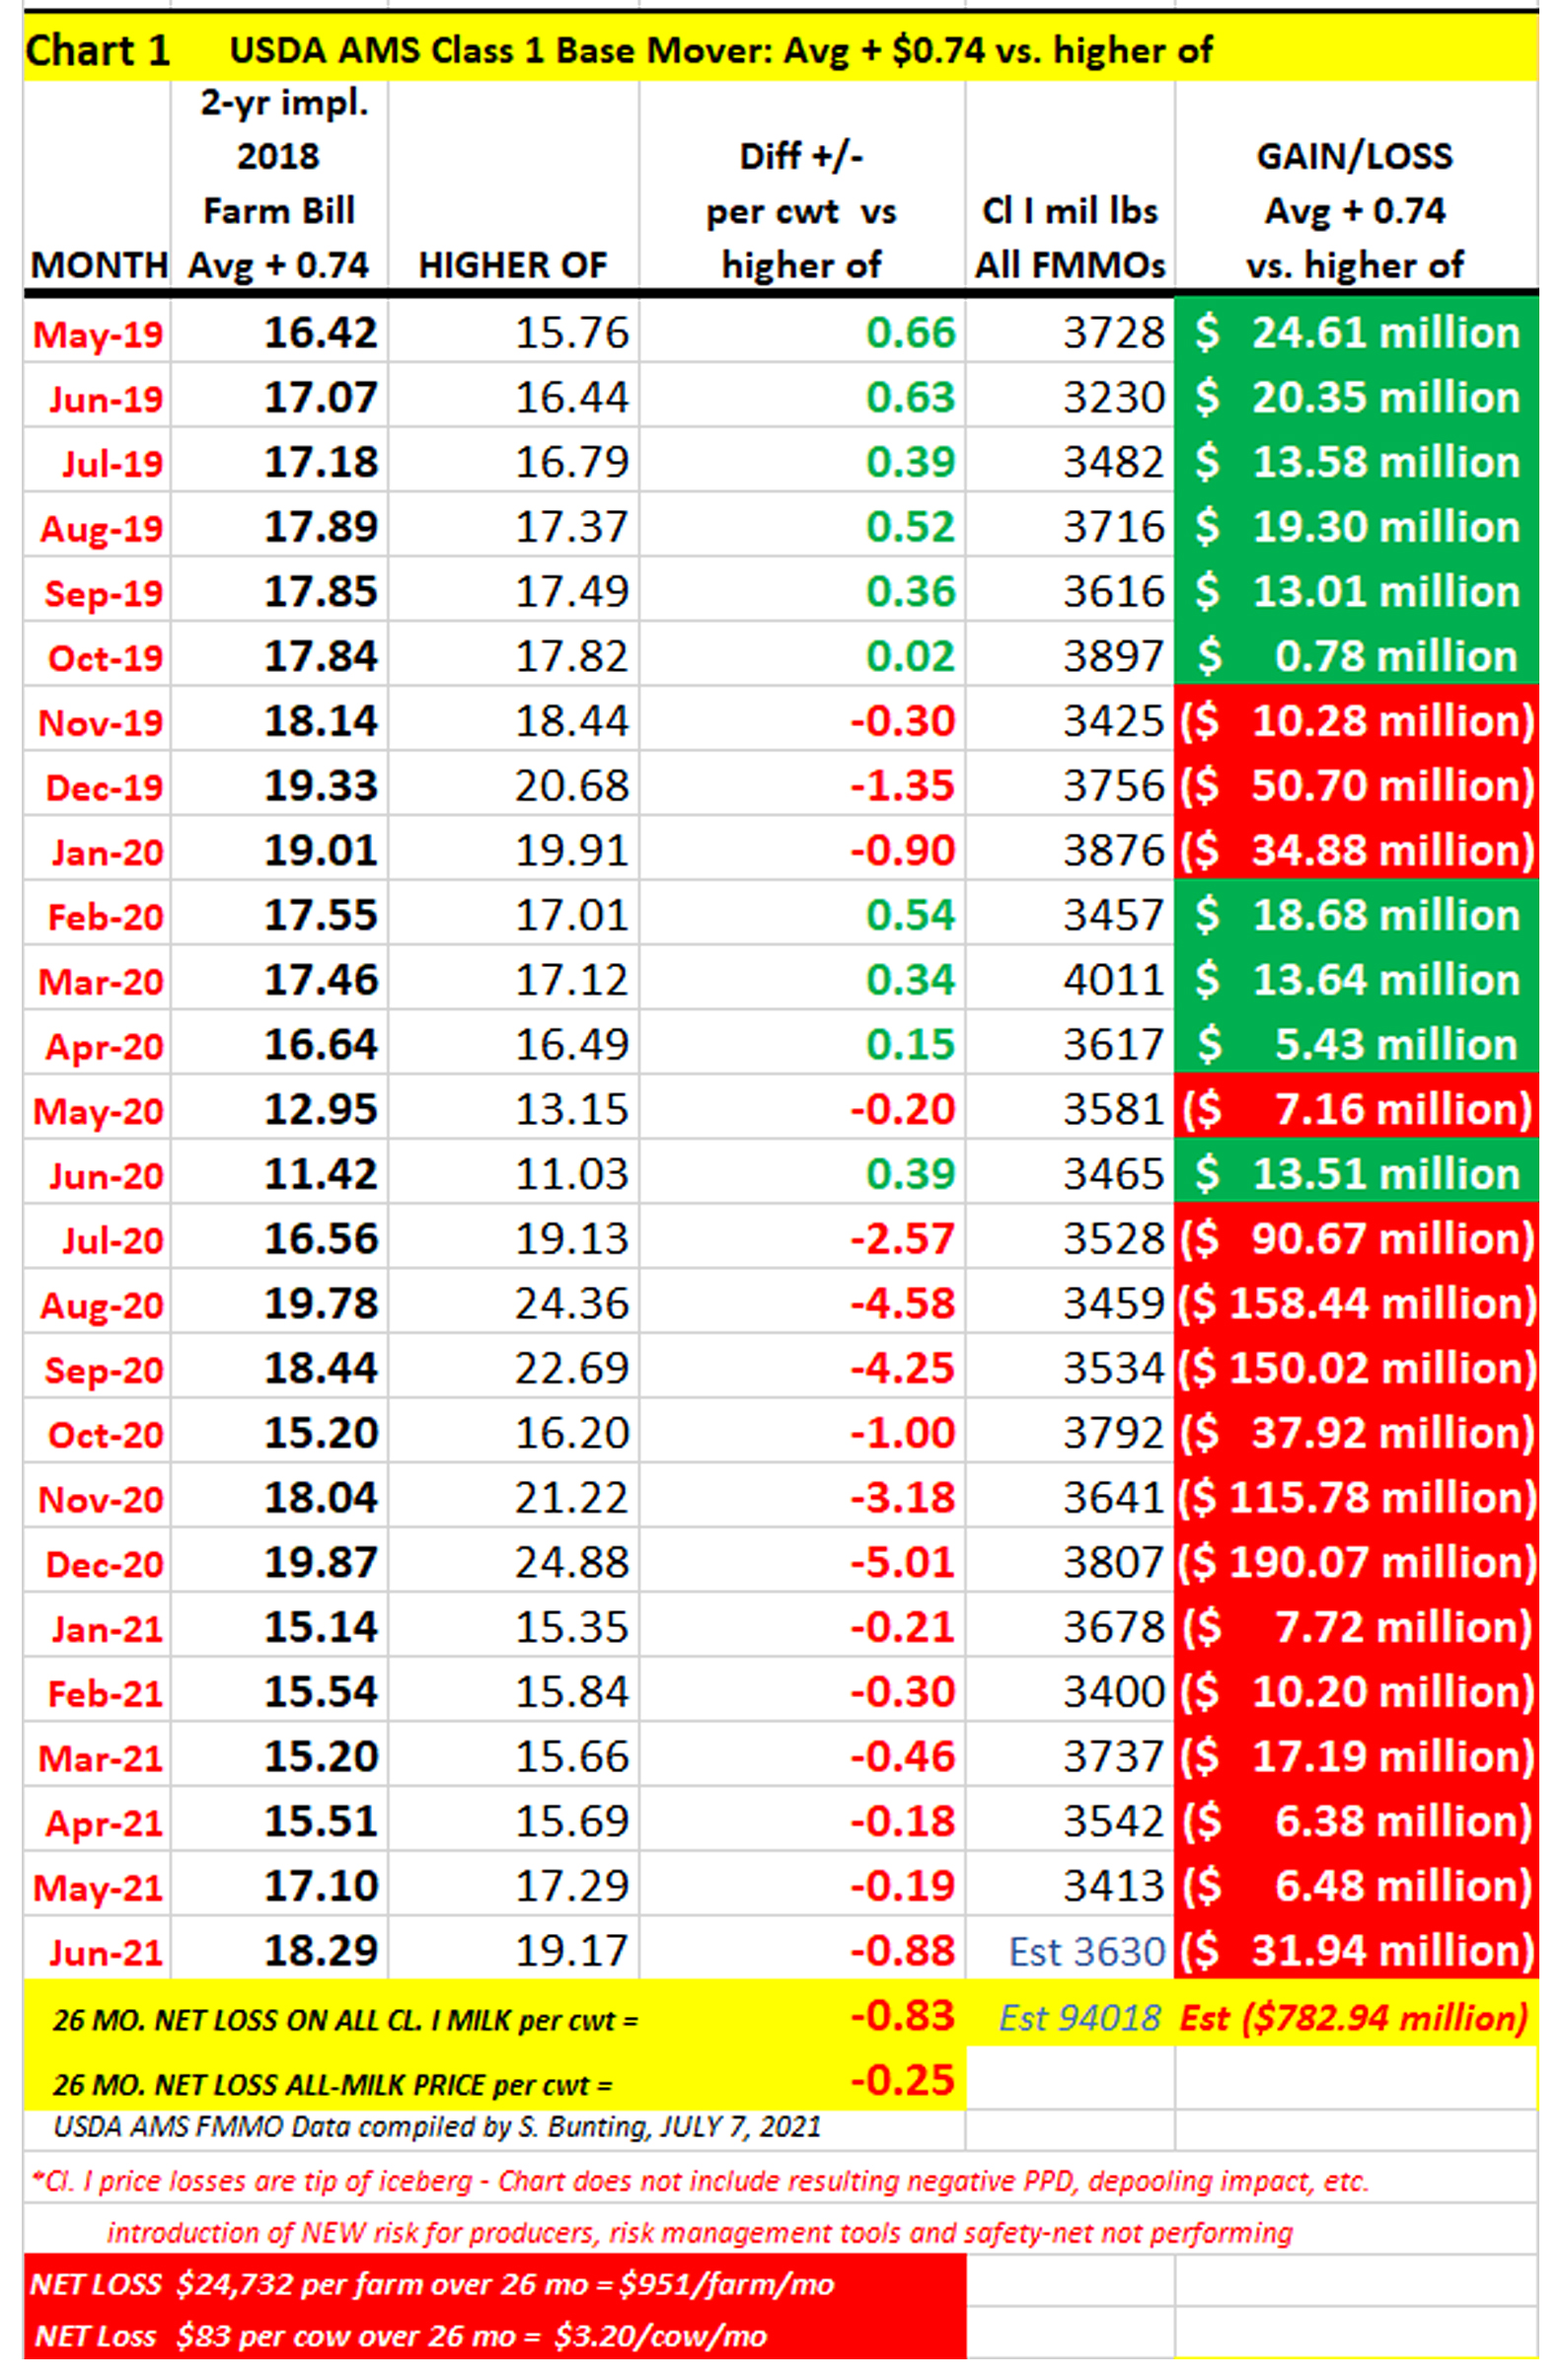
In the meantime, Congress may want to think about fixing the Class I mistake it made in the 2018 farm bill by changing four simple words from ‘average plus 74 cents’ to ‘higher of’ and at least get that done timely.
This hearing could leave that objective in the dust if the first day is an indication of what is to come.
Information to tune in by livestream through zoom or to dial-in and listen from a cell phone or landline has just been announced.
Or listen via one tap mobile: +1.646.828.7666, using ID 1604805748#
Or listen via landline telephone: +1.669.254.5252 and enter ID 160 480 5748
The hearing schedule will proceed in this order to consider accepted proposals under these categories, according to USDA:
1. Milk Composition (component yield) proposals.
2. Surveyed Commodity Prices (removing or adding commodities to the weekly price surveys used in the class and component pricing formulas).
3. Class III and IV Formula Factors, which includes various ‘make allowance’ proposals as well as butterfat recovery factors, and farm-to-plant shrink.
4. The Base Class I Skim Price (Mover) Formula (6 proposals, 3 favoring return to ‘higher of’, including 2 that also favor eliminating ‘advanced pricing’ of Class I. )
By Sherry Bunting, both parts of a two-part series in Farmshine, July 2021
The dairy industry continues to wait for USDA to provide details on three areas of dairy assistance already approved by Congress or mentioned as “on the way” by Ag Secretary Tom Vilsack.
The fly in the ointment, however, is the record-high 2021 milk production (Table 1) and accelerated growth in cow numbers (Table 2) at a pace the recent USDA World Agriculture Supply and Demand Estimates (WASDE) expect to continue into 2022.
USDA is reportedly looking at production reports — up vs. year ago by 1.9% in March, 3.5% in April, 4.6% in May — to determine how to assist without adding fuel to expansion that could threaten late 2021 milk prices in the face of rising feed costs and a worsening western drought. (The latter two challenges could temper those forecasts in future WASDEs.)
May milk production a stunner
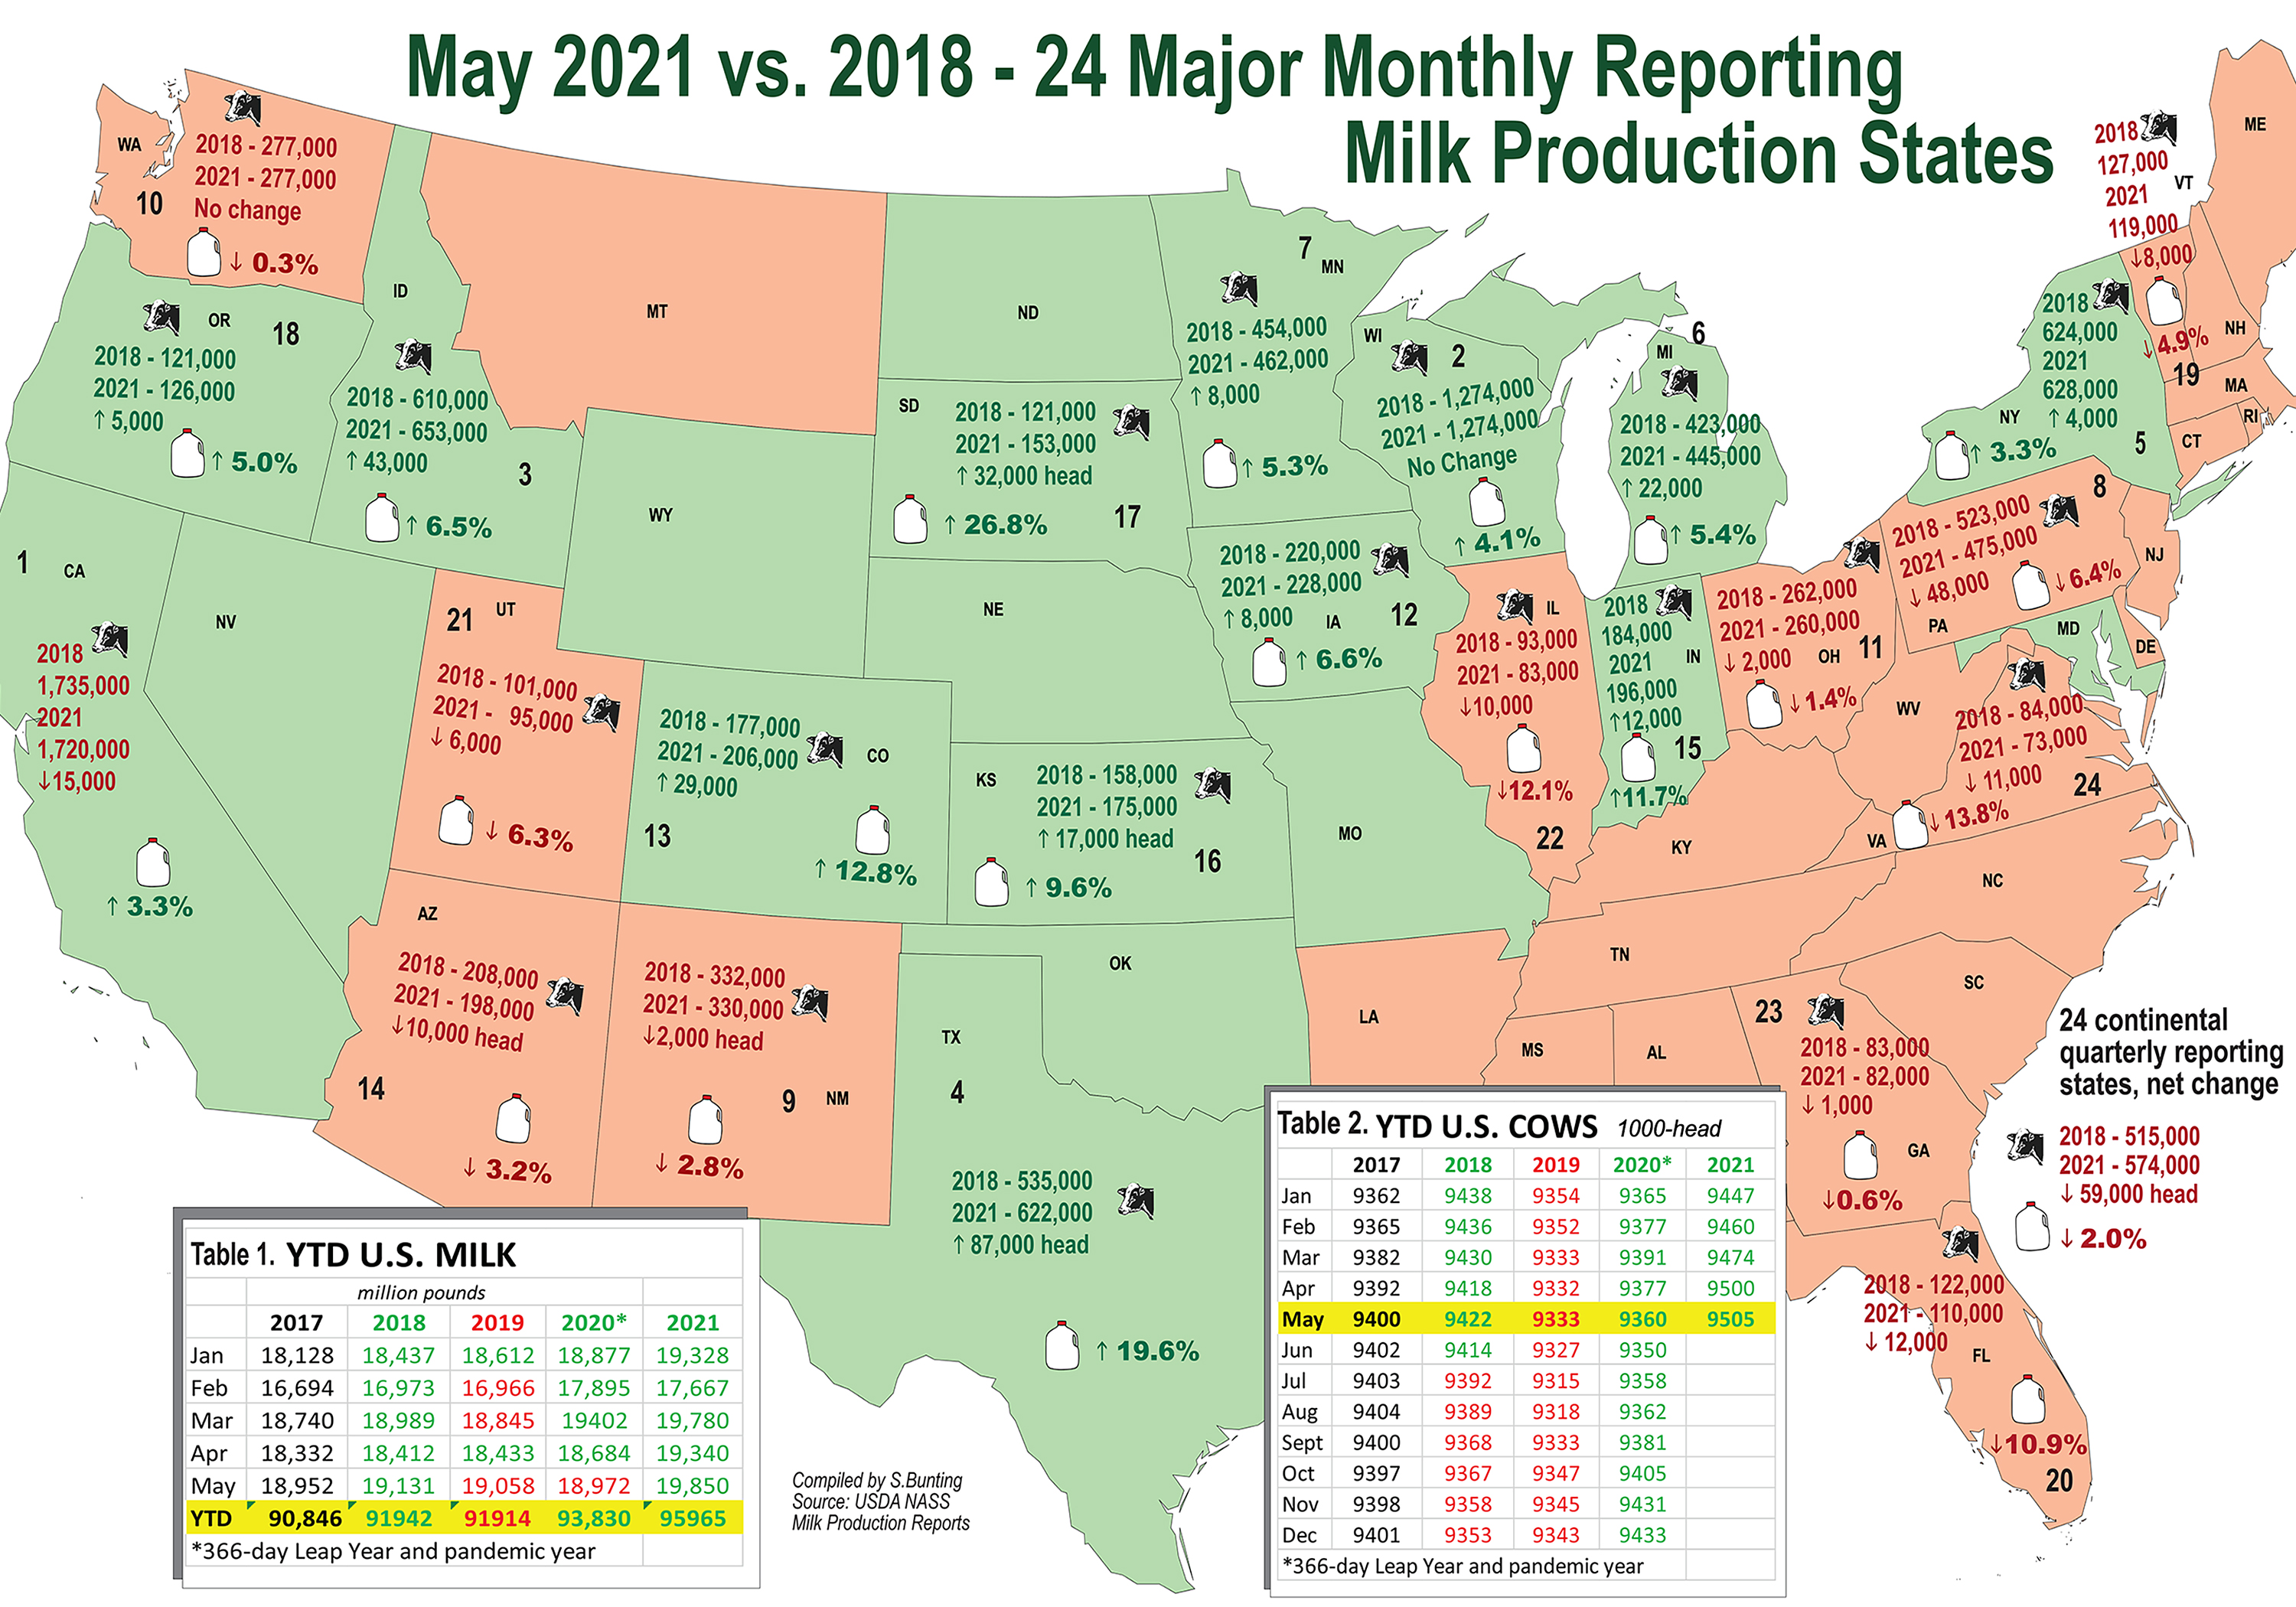
U.S. milk production totaled 19.9 billion pounds in May. This is a whopping 4.6% increase above 2020 and 2018 and a 4.1% increase over May 2019.
Let’s look at year-to-date. For the first five months of 2021, milk totaled 96 billion pounds, up 2.3% vs. the 93.8 billion pounds for Jan-May of 2020, and it is 4.4% greater than the 91.9 billion pounds of Jan-May milk produced in pre-pandemic 2018 and 2019. Of the four years, only 2020 had the extra production day as a Leap Year.
Milk per cow was up 3% over year ago in May. Compared with 2019, output per cow is up 2.2%, according to USDA.
Cow numbers vs. 2018 tell the story
Milk cows on U.S. dairies in May 2021 totaled 9.5 million head, up 145,000 from May 2020’s 9.36 million, up 172,000 from 2019’s 9.33 million, and up 83,000 head from 2018’s 9.42 million.
Counter to the national trend, Pennsylvania had 48,000 fewer milk cows than May 2018 — dropping 30,000 into 2019; 10,000 into 2020, and 8,000 into 2021.
Elsewhere in the Northeast and Southeast milksheds, among the 24 major monthly-reported states, New York had 4000 more milk cows in May 2021 than 2018, Vermont 8000 fewer. Georgia dropped 1000, Florida 12,000, and Virginia 11,000. In the Central states, Illinois was down 10,000 head.
The total decline in cow numbers for the 24 lesser quarterly-reported states, the collective loss in cow numbers is 59,000 head from May 2018 to May 2021
Accelerated growth is coming from three key areas where major new processing assets have been built or expanded.
In the Mideast, where the new Glanbia-DFA-Select plant became fully operational in Michigan this spring, there is a net gain of 32,000 cows for 2021 vs. 2018, Ohio’s cow numbers that had been declining 2018-19, began recovering in 2020-21. Indiana had 18 months of substantial growth, and Michigan returned to its growth pattern in 2020. Taken together, the Indiana-Ohio-Michigan region had a loss of 8,000 cows heading into 2020, but gained a whopping 40,000 cows over the past year.
In the Central Plains, where new plant capacity is starting up this spring and summer — Minnesota, South Dakota and Iowa, combined, added 40,000 cows May 2018 to May 2021.
In the Southern Plains, where joint-venture processing capacity continues to grow, Texas has continued full-steam-ahead, gaining 87,000 cows from 2018 to 2021, along with 29,000 added in Colorado and 17,000 in Kansas. New Mexico regained earlier losses to be 2000-head shy of 2018.
The growth patterns in these regions somewhat mirrored dairy exits from other areas — until Jan. 2020 (Table 2). The past 17 consecutive months of year-over-year increases in cow numbers leave the U.S. herd at its largest number in 26 years (1995).
However, the assumption that ‘dairy producers are okay because the industry is expanding’ ignores several essential factors. The playing field has become more complicated and inequitable. There are four main factors at play. We’ll look at them one at a time.
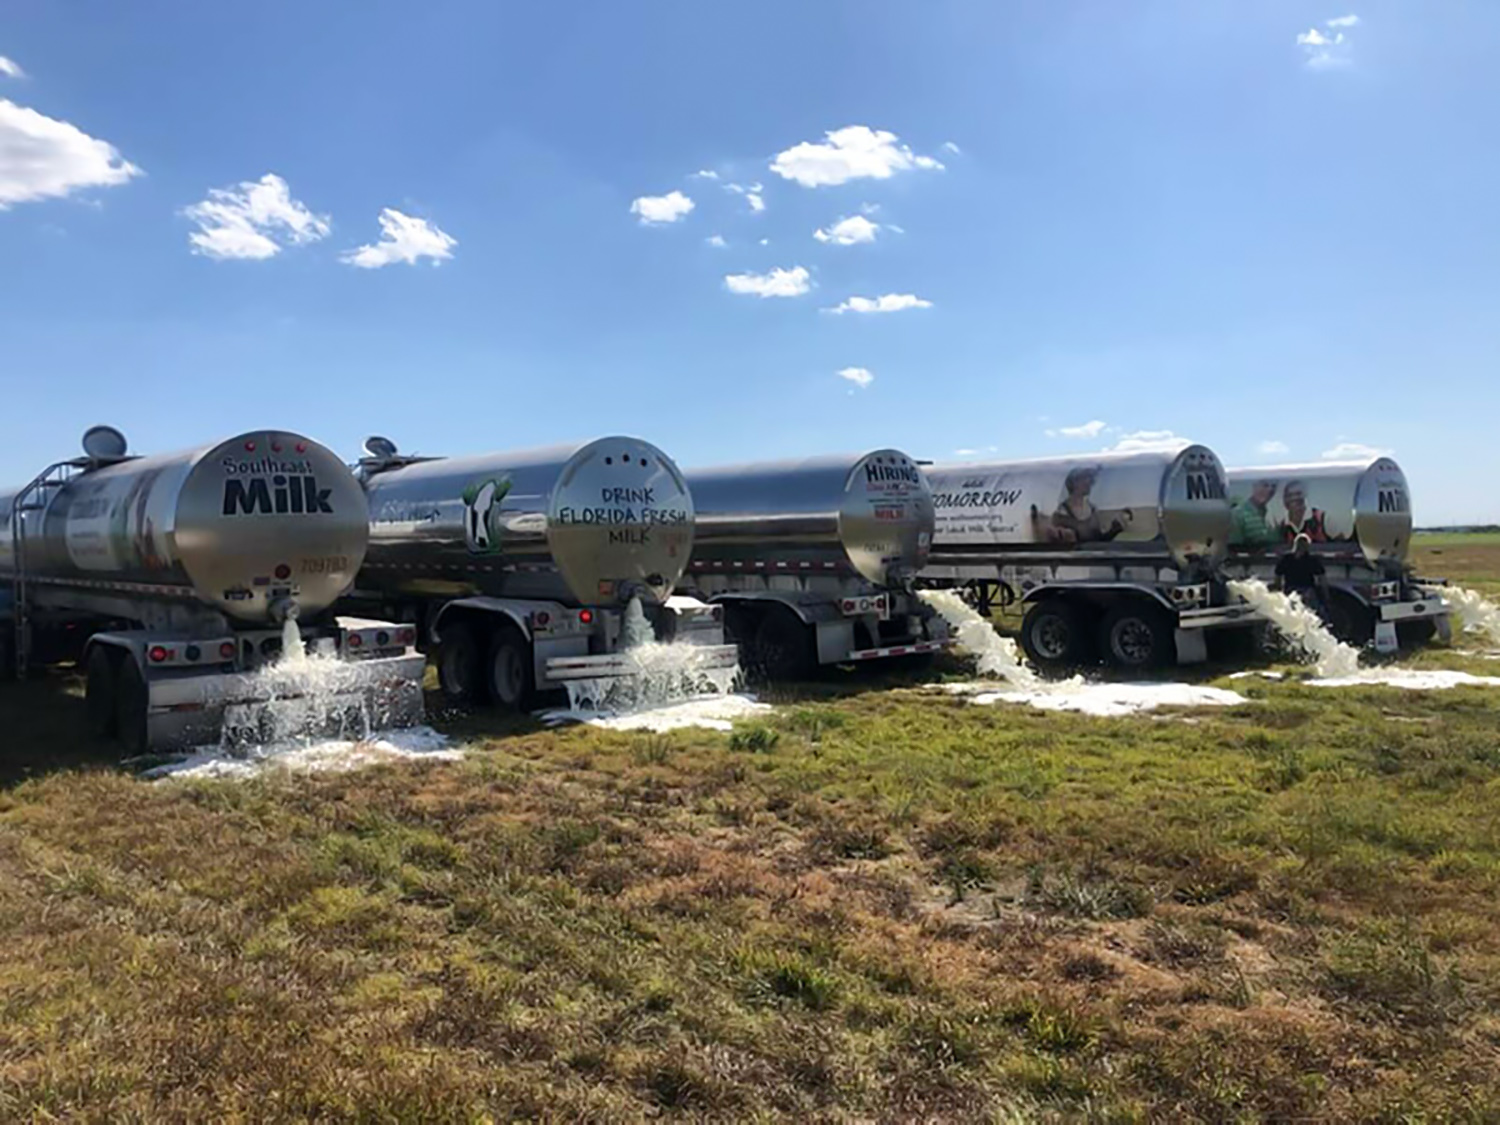
Ben Butler of South Florida posted this photo that went viral on Twitter April 2, 2020 of milk being dumped in Florida because there was no home for it. A few days later, he tweeted photos of milk gallons also being donated to Palm Beach County families in need. Challenges abound in the dairy supply chain. The unofficial tally of milk dumped in the Northeast and Mid-Atlantic region the first week of April 2020 was north of 200 loads, with additional reports of 130 loads dumped in the Southeast. Meanwhile, stores were not well stocked, most were limiting purchases and foodbanks were getting more requests as over 10 million people were newly out of work.
Factor #1 — Milk dumping and base programs
A year ago in April and May 2020 — at the height of the Coronavirus pandemic disruptions — the dairy industry saw dumping of milk, stricter base programs and bigger milk check deductions. Producers culled cows, dried cows off early, changed their feeding programs, even fed milk in dairy rations.
But milk production still grew, according to the USDA data.
Some cooperatives and milk buyers, like Land O’Lakes, had base programs already in place and triggered them. Others made changes to prior programs or implemented new ones.
Dairy Farmers of America — the nation’s largest milk cooperative, largest North American dairy processor and third-ranked globally by Rabobank — quickly implemented a new base program in May 2020, seeking 10 to 15% in production cuts from members, varying by region, with overage priced on ‘market conditions.’
It is difficult to assess the ‘equity’ in these base programs and the cross-layers among producers between and within regions, or to know how these ‘bases’ are being handled presently. When questioned, spokespersons say base decisions are set by regional boards.
Meanwhile, product inventory and pricing schemes affect all regions, and milk rides between FMMOs in tankers and packages — with ease.
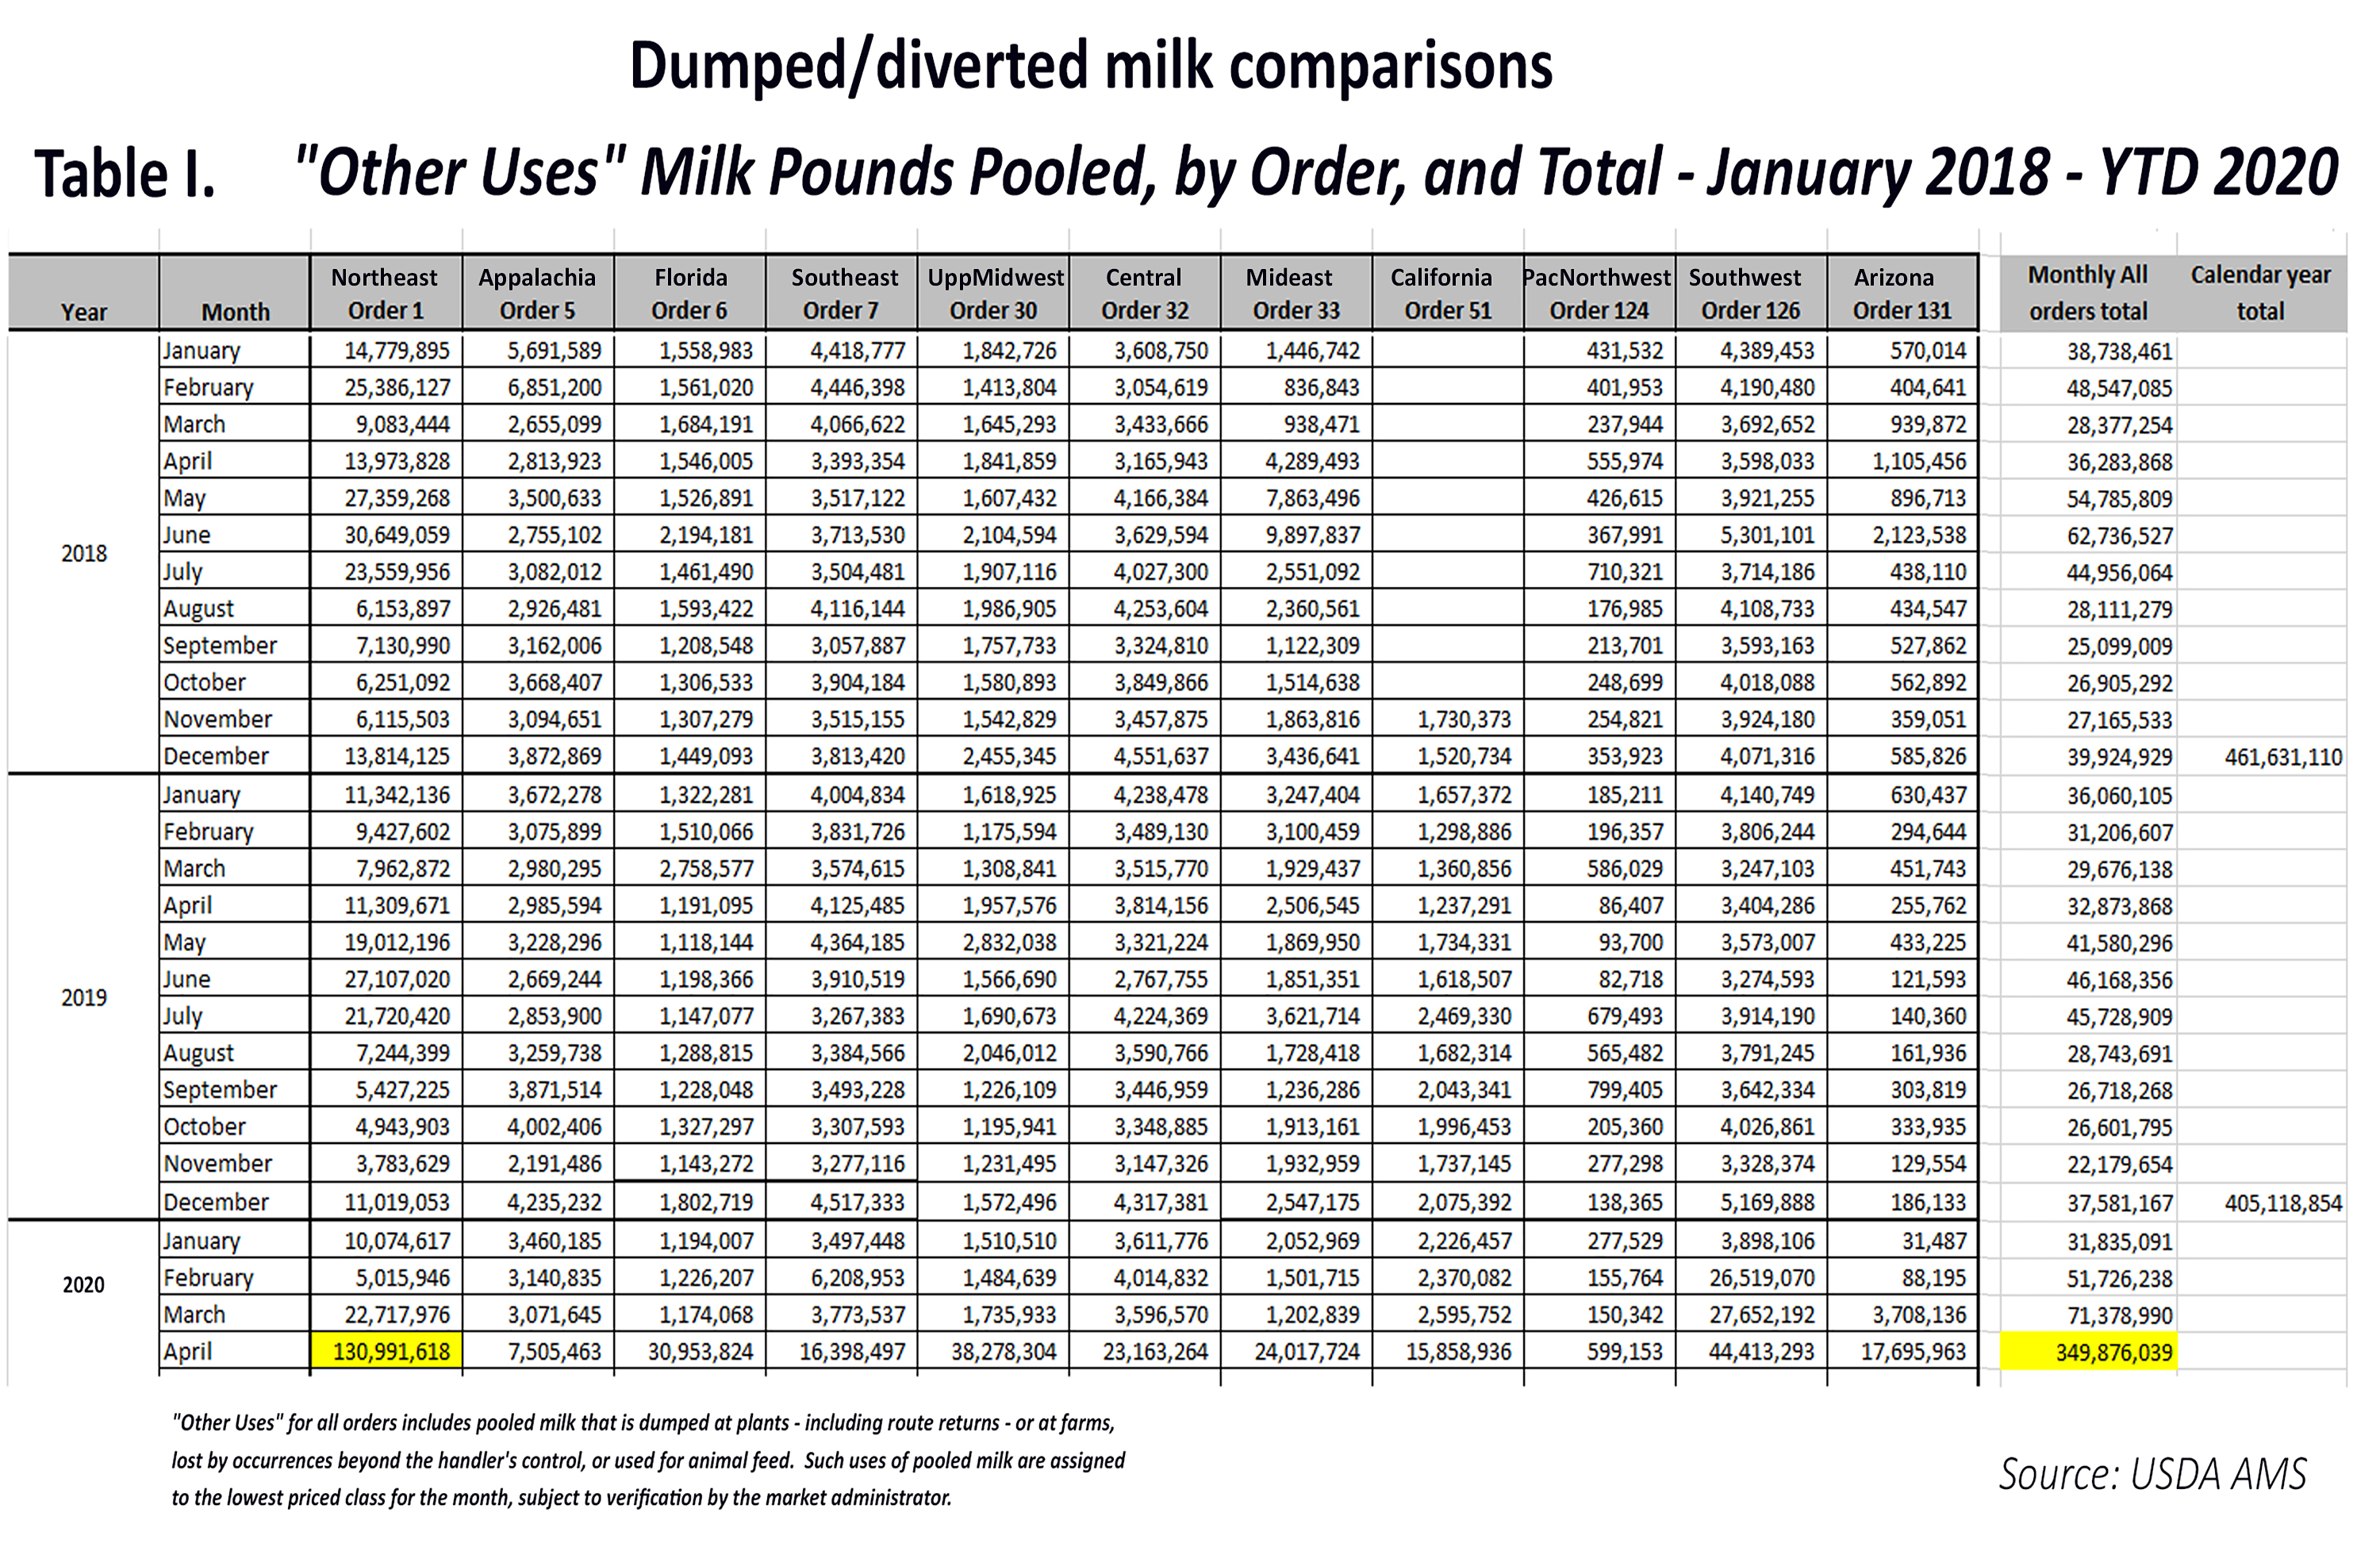
According to USDA, the 11 FMMOs dumped and diverted 541 million pounds of milk pooled as ‘other use’, priced at Class IV, during the first five months of 2020, of which 350 million pounds were in April alone. This is more than three times the ‘other use’ milk reported by FMMOs during the first five months of pre-pandemic 2019 (171.4 million pounds). By June, the amounts were double previous years.
Of this, the largest amount, by far, was the 181 million pounds of ‘other use’ milk in the Northeast FMMO 1 during Jan-May 2020, comprising one-third of all the dumped and diverted milk pooled across all 11 FMMOs in that 5-month period.
In the Southeast milkshed, the Appalachian, Florida and Southeast FMMOs 5, 6 and 7, together pooled 88 million pounds of ‘other use’ milk in the first five months of 2020. The Southwest FMMO 126 had 106.2 million pounds of ‘other use’ milk; Upper Midwest FMMO 30 had 46.1 million pounds; Central FMMO 32 had 36.7 million pounds; Mideast FMMO 33 had 30.7 million pounds; California FMMO 51 had 28.9 million pounds; Arizona FMMO 131 had 21.7 million pounds; and Pacific Northwest FMMO 124 had 1.3 million pounds.
The dumping had begun the last week of March 2020 and was heaviest in the month of April. Producers also saw deductions as high as $2/cwt. for balancing costs, lost quality premiums, and increased milk hauling costs. Unaccounted for, were the pounds of milk that had reportedly been dumped on farms without being pooled on FMMOs.
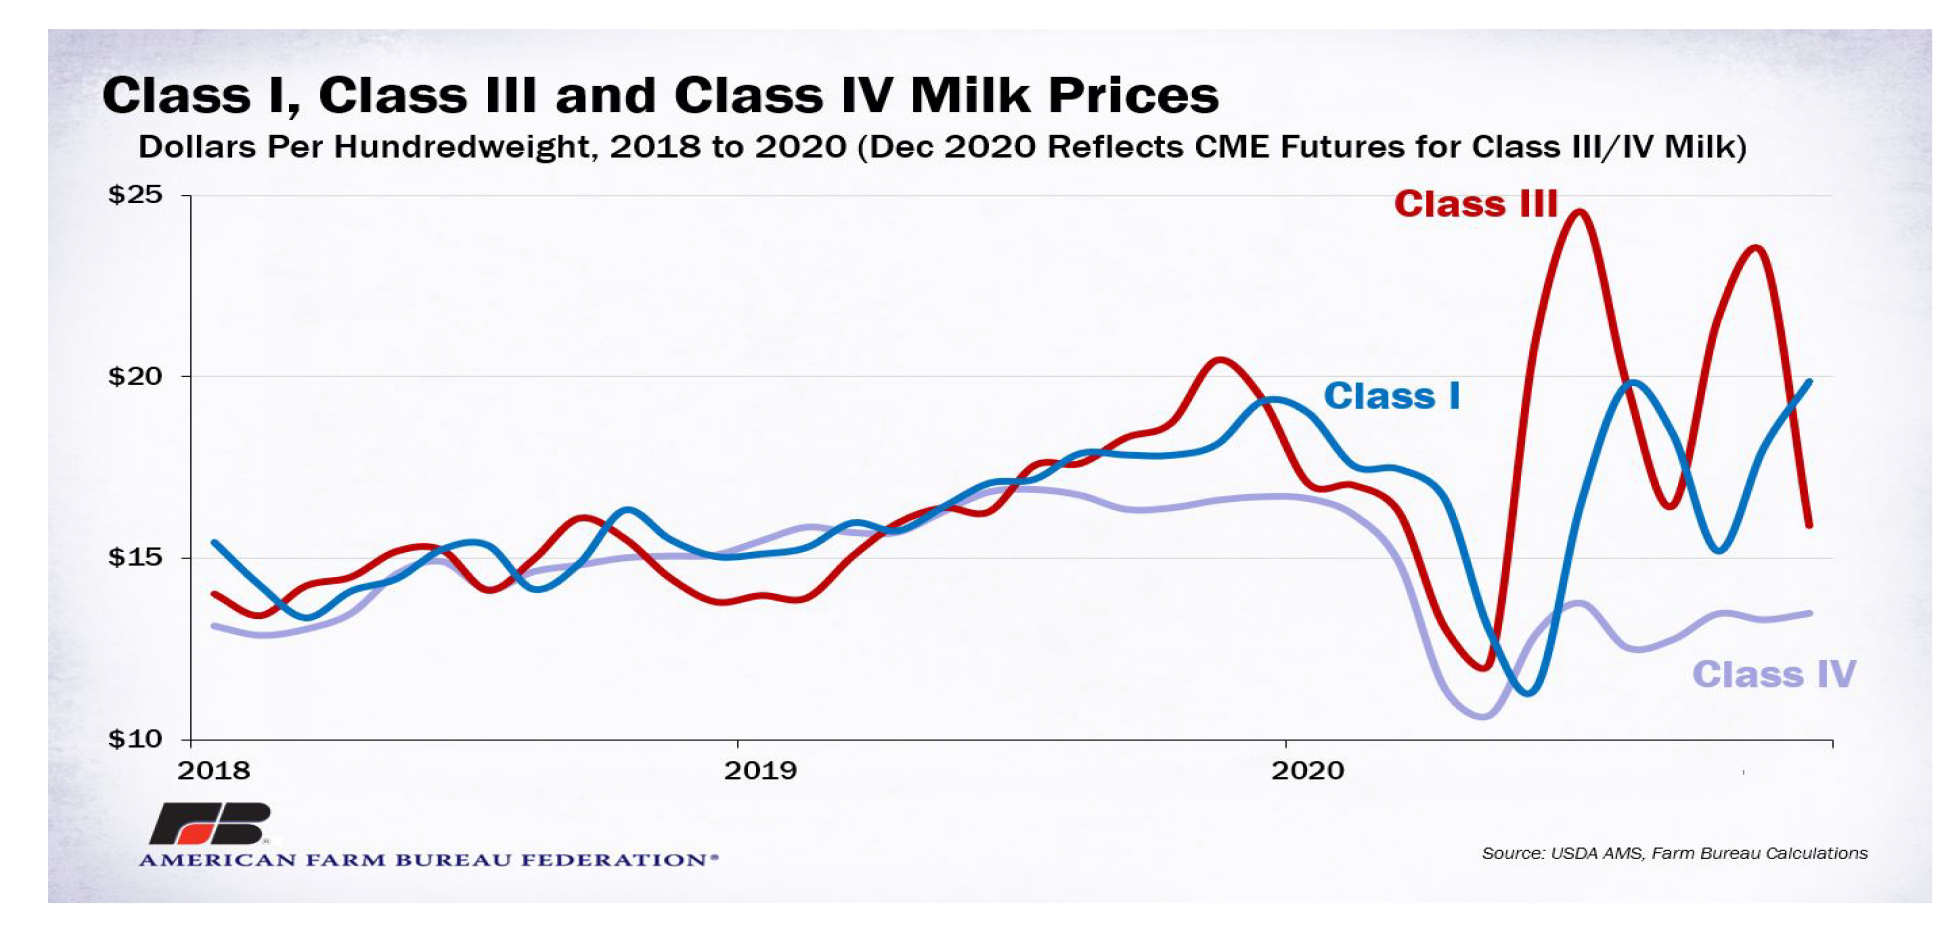
All of this against a backdrop of pandemic bottlenecks and record-high March-through-August imports of butter, butteroil, milkfat powder, and blends — adding to record-high U.S. butter inventories and contributing to the plunging Class IV, II and I prices vs. Class III (PPD).
Meanwhile, not only did production growth in key areas move ahead, so did strategic global partnerships. Just one puzzling example in October 2020, after eight months of deflated producer milk checks, depressed butterfat value, burdensome butter inventory, record butterfat imports, and a plunging Class IV milk price that contributed to negative producer price differential (PPD) losses, Land O’Lakes inked a deal to market and distribute cooking creams and cream cheeses — Class II and IV products that use butterfat — from New Zealand’s Fonterra into United States foodservice accounts.
The New Zealand press reports were gleeful, citing this as a big breakthrough that could be followed by other of their cheeses entering the “huge” U.S. foodservice market through the Land O’Lakes distribution.
Factor #2 — Class price wars and de-pooling
As reported in Farmshine last summer, dairy farmers found themselves in uncharted waters. As Class IV prices tumbled from the get-go with all of the ‘other use’ dumping and diverting, butter inventory building as butter/powder plants tried to keep up with diverted loads at a disruptive time, the USDA Food Box program started drawing products in the second half of May, and really got going by July 2020.
Cheese, a Class III product, was a big Food Box winner. The cheese-driven Class III milk price rallied $7 to $10 above Class IV, and massive volumes of milk were de-pooled by Class III handlers, which has continued through May 2021.
Reviewing the class utilization reports, an estimated 80 billion pounds of Class III milk normally associated with FMMOs has been de-pooled over the past 26 months.
At the start of this ‘inequitable’ situation, academic webinars sought to explain it.
“We’re seeing milk class wars,” said economist Dan Basse of AgResource Company, a domestic and international ag research firm in Chicago, during a PDPW Dairy Signal webinar a year ago.
He noted that under the current four-class pricing system, and the new way of calculating the Class I Mover, dairy farmers found themselves “living on the edge, not knowing what the PPD (Producer Price Differential) will be” (and wondering where that market revenue goes).
“A $7.00 per hundredweight discount is a lot of capital, a lot of income and a lot of margin to lose with no way to hedge for it, no way to protect it, when the losses are not being made up at home as reflected in the PPD,” Basse said in that summer 2020 webinar.
What does this have to do with year-over-year milk production comparisons?
Two words: Winners. Losers.
Some handlers, and producers won, others lost — between and within regions.
Here’s why all of this matters from a production comparison standpoint: Dairy economists — Dr. Mark Stephenson, University of Wisconsin, and Dr. Marin Bozic, University of Minnesota — are both on record acknowledging that USDA NASS uses FMMO settlement data, along with producer surveys, to benchmark monthly milk production.
So, on the one hand: How accurate are these data for comparison over the past 26 months, given the inconsistent FMMO data from dumping, diverting and de-pooling?
On the other hand: Did the negative PPDs and de-pooling, resulting in part from the 2018 Farm Bill change in the Class I Mover, allow Class III handlers to capture all of that additional market value and use it to fuel the 2020-21 accelerated milk growth for regions and entities connected to the new Class III processing assets?
Factor #3 — New dual-processing concentrates growth
Accelerated growth in cow numbers is fueling record production in 2021. It is patterned around ‘waves’ of major new processing investments in some areas, while other areas — largely fluid milk regions — are withering on the vine or growing by smaller margins with fewer cows.
In the 24 major milk states, production growth was even greater than the All-U.S. total — up 4.9% vs. year ago. In part one, the breakdown was shown vs. 2018.
Here’s the breakdown for just the 12 months from May 2020 to May 2021 — a time in which the industry dealt divergences that created steep losses for some and big gains for others, while FMMOs became dysfunctional.
In just one year, over 40,000 cows were added in Indiana, Ohio, and Michigan, combined, and milk production was up in May 2021 by 12.6, 3.2 and 5.1%, respectively. The draw is the massive new Glanbia-DFA-Select joint-venture cheese and ingredient plant that began operations late last year in St. Johns, Michigan. Sources indicate it reached full capacity this spring. Add to this the 2018 Walmart fluid milk plant in Fort Wayne, Indiana and other expansions in Ohio and Michigan.
Ditto for the Central Plains, where new cheese and ingredient line capacity became operational this spring and summer. Supplying these investments, Minnesota grew production 6%, South Dakota 14.6%, and Iowa 6.2% over year ago.
Number two Wisconsin grew by 5.6% in May 2021 vs. year ago.
Milk production was up 5% in number one California, even though cow numbers were down by 1000 head, and dairy farmers in a referendum voted recently by a slim margin to keep their quota system. They are also dealing with a devastating drought that news reports indicate is now impacting both the dairies and the almond growers.
Then there’s Texas, where growth continues to be a double-digit steamroller, up 10.8% in May 2021 vs. 2020 — pushing New York (up 4.2%) to fifth rank.
The Southern Plains has had several strategic investments, starting in Texas and New Mexico (up 6% vs. year ago).
In Colorado, where production was up 5.3% in May, DFA’s joint ventures and strategic partnerships with Leprino, Kroger and others have fueled growth.
Kansas grew milk production 7.3% vs. year ago. In 2018, a state-of-the-art whole milk powder and ingredient plant became fully operational in Garden City, Kansas. The plant was to be a joint-venture between DFA and the Chinese company Yili but ended up as a joint-venture between DFA and 12 of its member farms that are among the 21 Kansas dairies shipping milk to it.
DFA’s Ed Gallagher gave some insights on this during a May 2021 Hoards webinar. He said, “We went through a period of investing in powder plants in the U.S. It seems like there is a follow-the-leader approach when deciding on investments, and it goes in waves. The industry just completed a wave of a lot of investment in Class IV manufacturing plants, and now… it’s flipping to Class III.”
Looking back on the Class IV ‘wave’ 2013 through 2018, there were several times in those years that Class IV beat Class III, leading to FMMO de-pooling, but not to the extreme extent seen in the past 12 months as Class III now beats all other classes, including Class I, leading to negative producer price differentials (PPDs).
Gallagher sees Class III and IV prices “coming together” in the “next period of years” because the ‘wave’ of capacity investment has flipped from Class IV to III. He predicted more Class III capacity will be added.
Are these past 26 months of PPD net losses for producers the industry’s answer to, in effect, increasing processor ‘make allowances’ without a hearing?
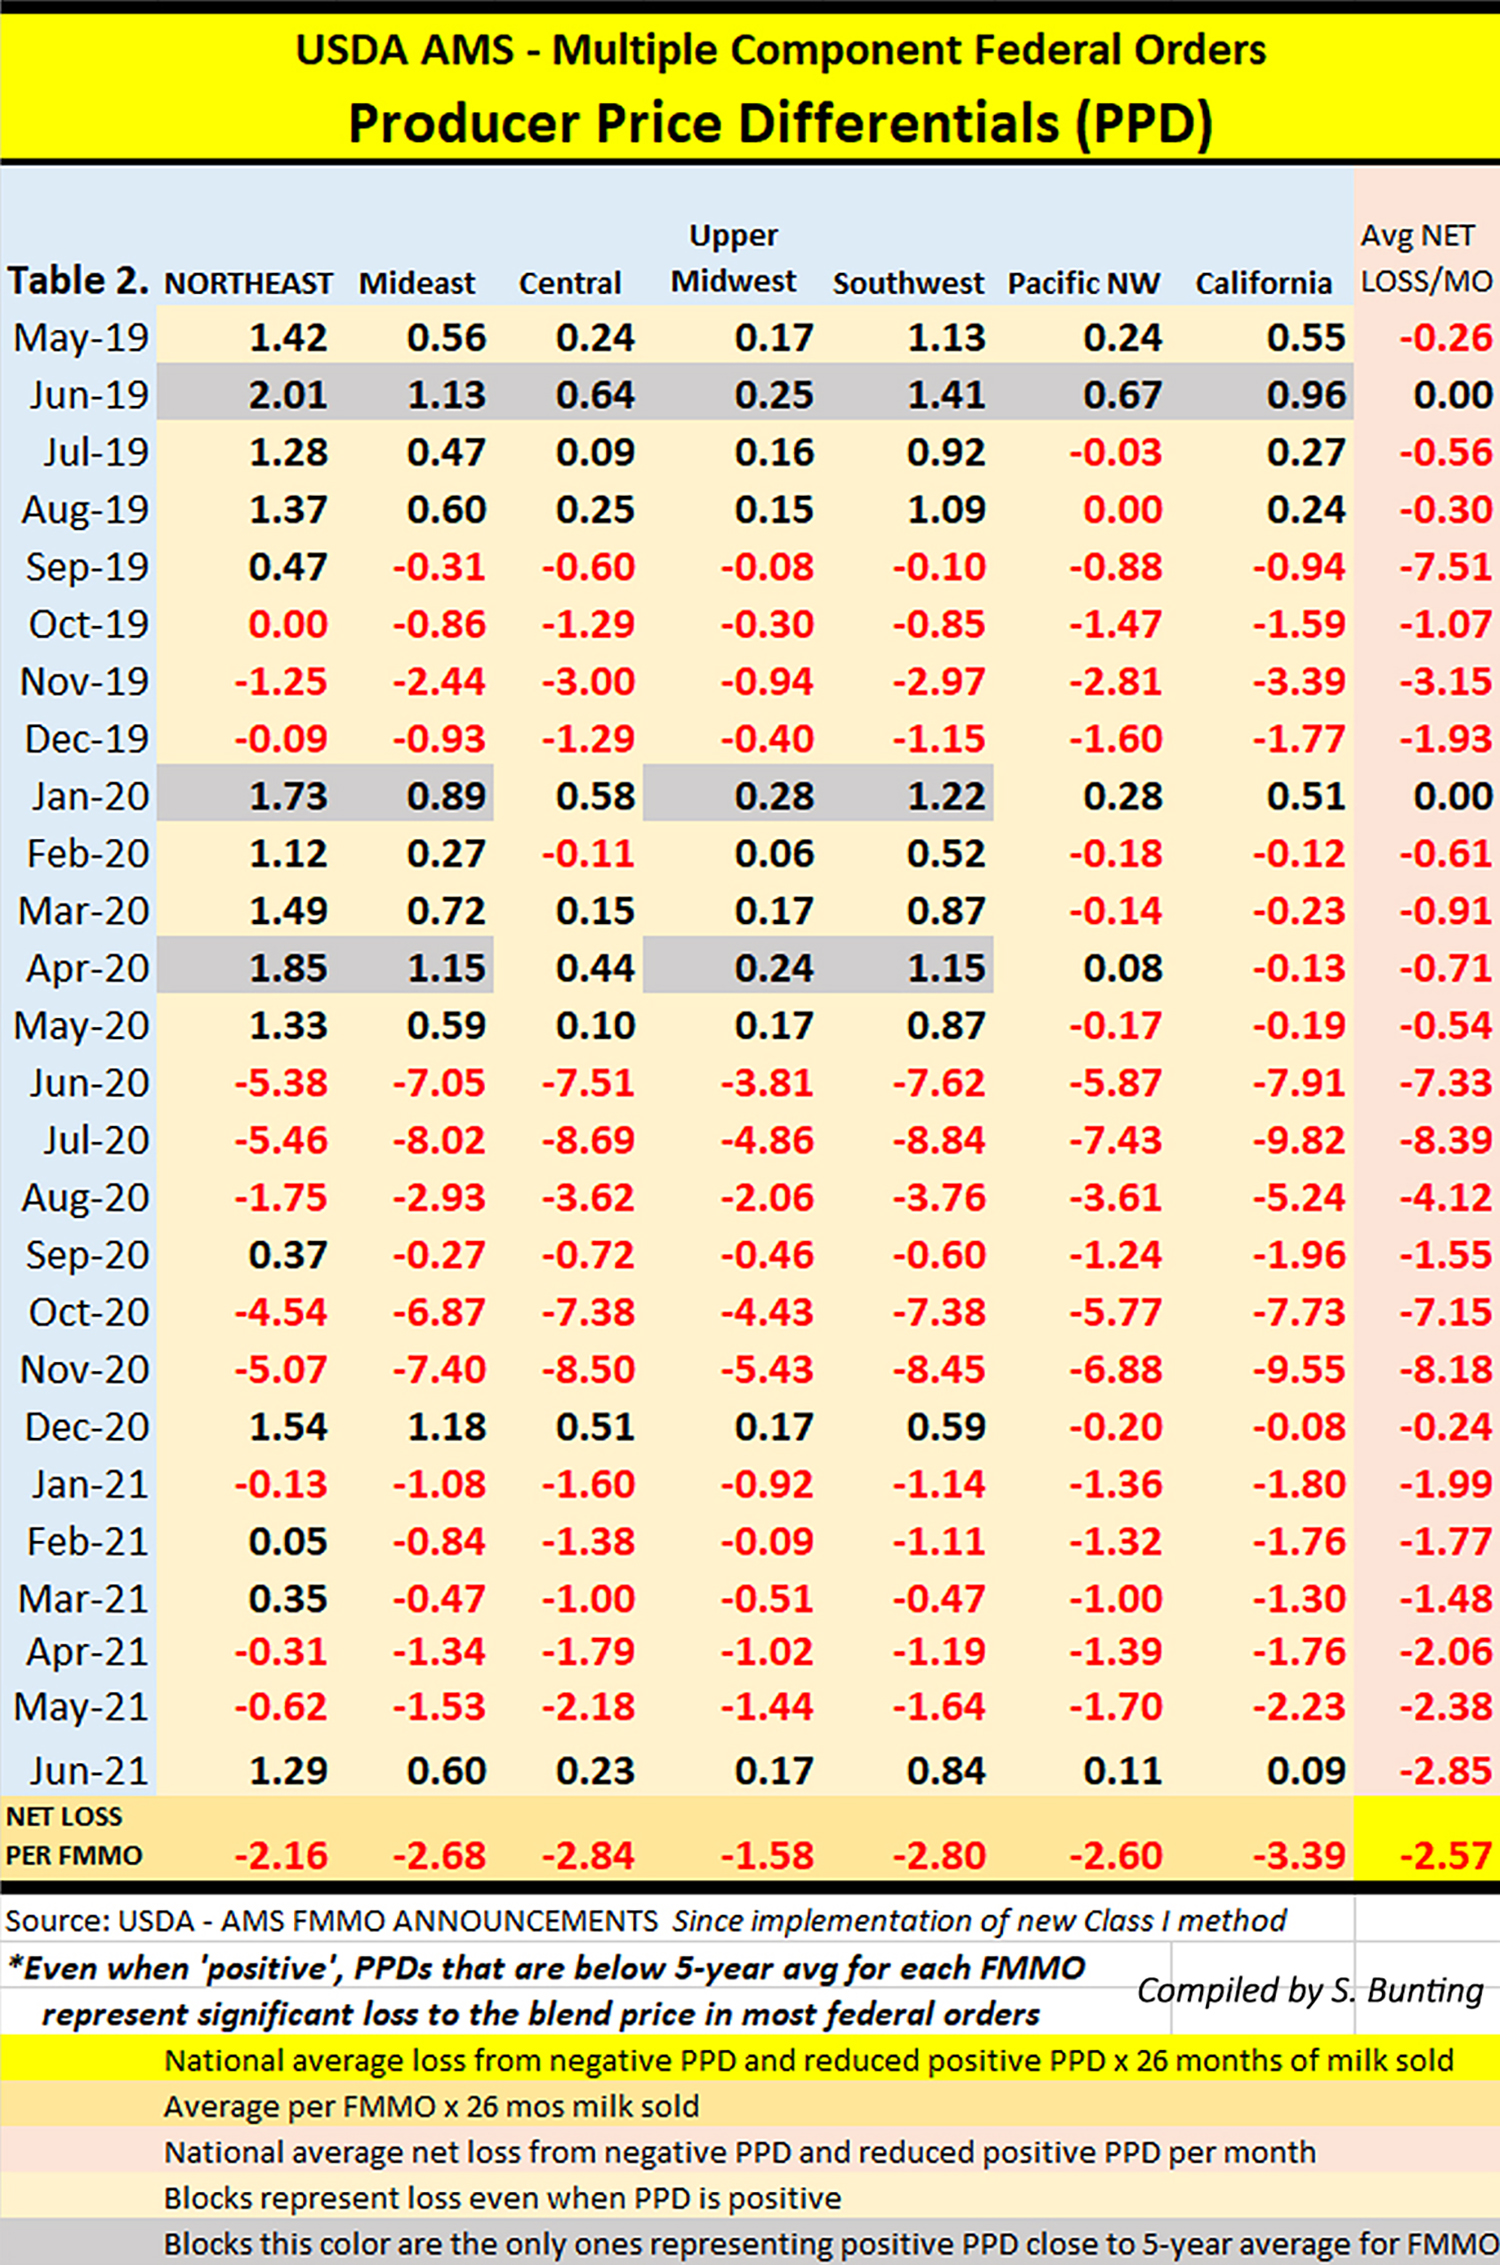
The average PPD value loss (see chart) across the seven multiple component pricing FMMOs was $2.57 per hundredweight for 26 months, which began with implementation of the new Class I pricing method May 2019 through the most recent uniform price announcements for June 2021 milk.
Applying a conservative 5-year average PPD (prior to Class I change) for each FMMO, only the few gray blocks on the chart represent ‘normal.’
This means even positive-PPDs show margin loss for farm milk pooled on FMMOs. In fact, the CME futures markets as of July 14 show August through December divergence between Class III and IV above the $1.48 mark, indicating Class I value loss and negative PPDs or smaller positive PPDs could return after barely a two-month reprieve.
Many handlers that don’t pool on FMMOs also use the uniform prices as a benchmark.
This $2.57 net loss for seven MCP FMMOs across 26 months represents almost a doubling of the current make allowance levels.
Current USDA make allowances and yield factors add up to a processor credit of $3.17 per hundredweight on Class III and $2.17 on Class IV. This already represents 11 to 25% of farm milk value, according to 2018 analysis by John Newton, when he was Farm Bureau’s chief economist.
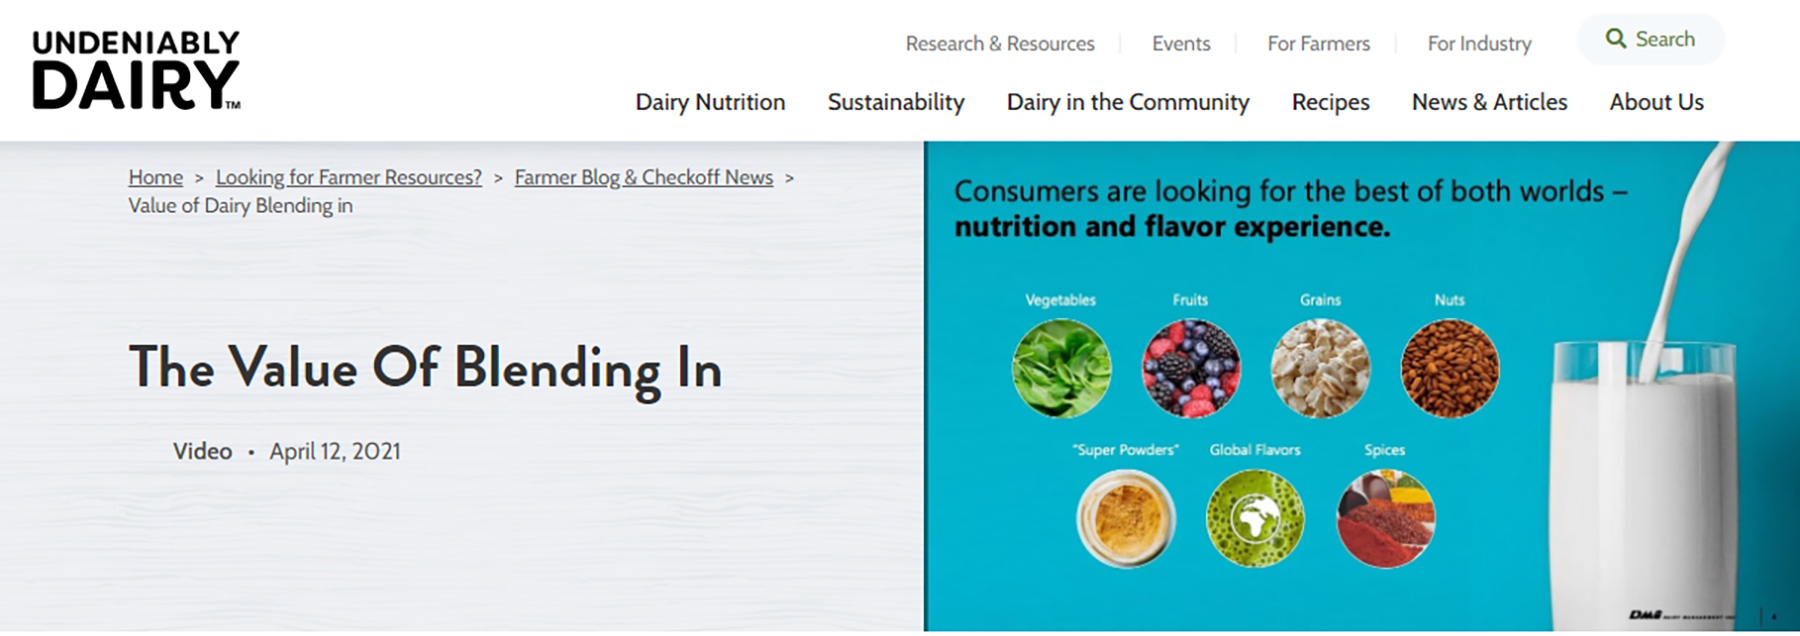
Why is this important? Because we are already seeing additional margin transfer from Class I to Class IV as the industry moves to blended beverages that mostly use ultrafiltered (UF) milk solids. Blends using whey would fall under Class III.
Looking ahead, DFA now owns most of the former Dean Foods’ Class I fluid milk plants since May 2020. New manufacturing synergies are undeniable, considering the direction of dairy checkoff’s fluid milk revitalization plan emphasizing these dairy-based-and-blended beverages and ‘dual-purpose’ processing facilities.
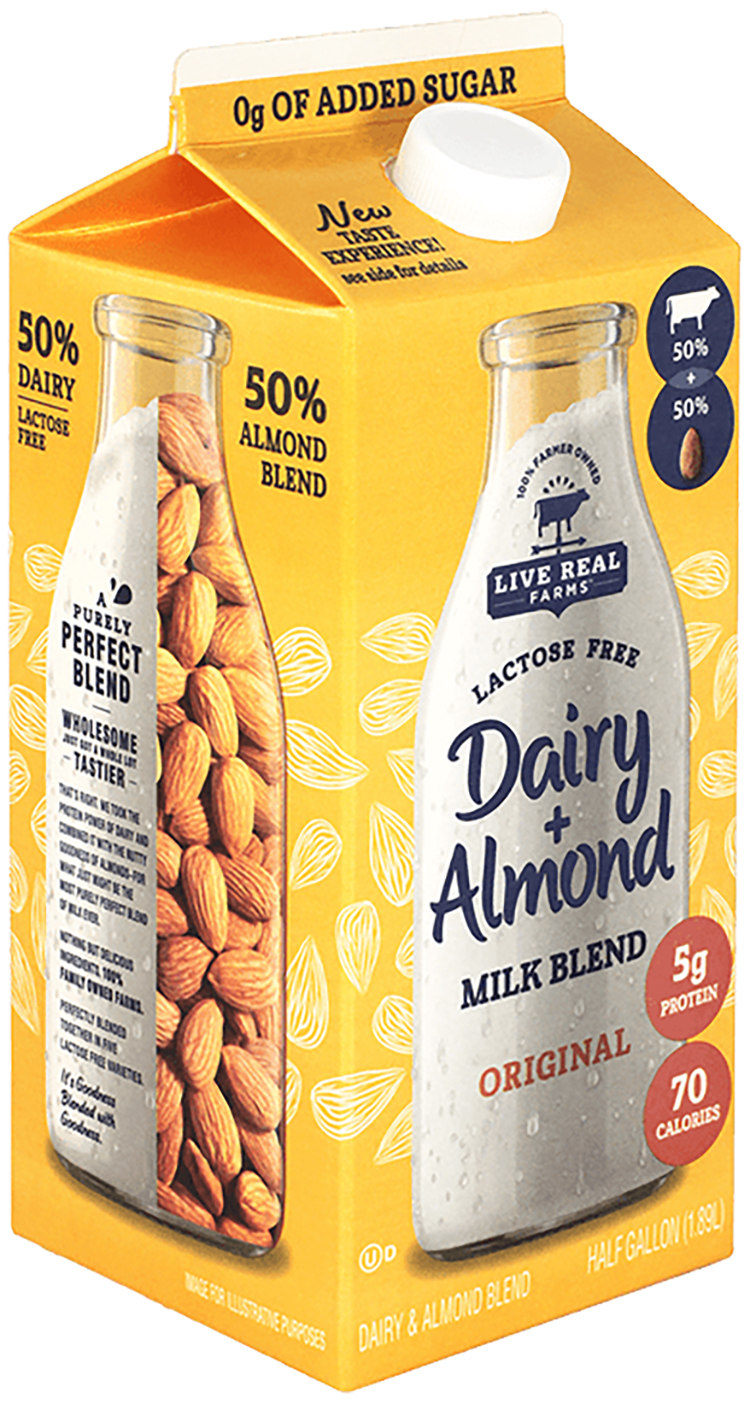
Dairy + Almond is a Live Real Farms beverage made by DFA and was launched through DMI’s Innovation Center with checkoff funds paid by all dairy farmers. The milk in this beverage is not priced as Class I, though it competes in the dairy case and is being promoted as a “Purely Perfect Blend.”
As low-fat UF milk solids are blended with other ingredients in a manufacturing process to make new combined beverages, the result is a competing beverage, and the milk in the beverage drops from Class I to Class IV.
Meanwhile, these beverages cost more at the grocery store, and the ingredients are not part of the USDA end-product pricing ‘circle’. Therefore, no new make allowances should be requested because processors are already getting a reduced class value, and a higher margin.
DMI’ vice president of global innovation partnerships, Paul Ziemnisky, gave some insights into this “future of dairy beverages” — and how it ties into new processing plants investments during the virtual Pennsylvania Dairy Summit in February.
Ziemnisky went so far as to say new processing facilities will “need to be built as beverage plants able to handle all kinds of ingredients” for the blended products of the future. In essence, he said, the future of fluid milk is “dual purpose” processing plants.
DMI’s usdairy.com website touts the checkoff launches of ‘blended’ dairy-‘based’ beverages — key to DMI’s fluid milk revitalization plan. Not flavorings, these blends dilute milk out of Class I, the highest farm-level pricing, and mainly into Class IV, the lowest. The resulting beverages compete in the dairy cooler with Class I fluid milk. Screen view
While 11 of the top 24 states had milk production increases of 5% or more in May, the 13 states with increases below 5%, or negative, are mainly located within traditional Class I fluid milk marketing areas: Florida, up 0.5%, Georgia up 2%, Virginia down 2.3%, Illinois up 1.9%, Arizona, down 0.5%, Washington, down 0.9%, Pennsylvania and Vermont both up 1.8%, and New York up 4.2%.
Idaho and Utah, up 2% and unchanged, are outliers and largely unregulated by FMMOs. Some beverage assets are coming to that region in the form of ultra-filtration and aseptic packaging, including a plant renovation to make Darigold’s FIT beverage. Additionally, a new Fairlife filtration membrane plant was opened near Phoenix, Arizona in March, and Kroger is doing filtration and aseptic packaging in Colorado.
Meanwhile, Pennsylvania is often described as a ‘fluid milk state’ with a Milk Marketing Board setting minimum prices for fluid milk, and a string of independent milk bottlers that figure prominently in their communities.
Ranked fourth in milk production in 2006, Pennsylvania was passed by Idaho in 2007. By 2016, Michigan had pushed Pennsylvania to sixth. The very next year, in 2017, Texas leapfrogged both Pennsylvania and Michigan. Now, Minnesota has pushed the Keystone State to eighth.
How does the future of dairy affect traditionally ‘fluid milk’ states like Pennsylvania, or the Southeast for that matter?
New dairy-‘based’ beverage innovations can be made anywhere and delivered anywhere, often as shelf-stable products. Most are not Class I products unless they meet the strict FMMO definition which was last spelled out in the USDA AMS 2010 final rule.
For now, this also includes the Pa. Milk Marketing Board. Executive secretary Carol Hardbarger confirms that the 50/50 drinks are not regulated under PMMB, which generally uses federal classification, but that a legal interpretation of the Milk Marketing Law with regard to blends may be in order.
The 50/50 blends are already in some Pennsylvania stores and elsewhere in the Northeast, which is the second phase of the ‘undeniably, purely perfect’ marketing plan for fluid milk revitalization.
Factor #4 — USDA, industry coalesce around climate
Ag Secretary Tom Vilsack has been outspoken from the outset about using and aiming every available USDA program dollar in a way that also addresses the Biden administration’s strategies for equity, supply chain resiliency, and climate action.
Speculating a bit as to why USDA is taking so long to announce details about already funded dairy assistance, it could be that Sec. Vilsack is looking at the fit for ‘climate impact.’
Paid around a million a year in dairy checkoff funds to serve 4 four years as CEO of the U.S. Dairy Export Council — between prior and current Ag Secretary posts — Vilsack understands the future plans of the dairy industry’s checkoff-funded proprietary precompetitive alliances on a global scale.
Vilsack has been privy to the DMI Innovation Center’s discussions of fluid milk revitalization through ‘dual purpose’ plants and blended beverages. He is no doubt looking at the accelerating growth in milk production that is occurring right now for ways to tie dairy assistance to measured climate impacts in the net-zero file.
Producers on the coasts and fringes of identified growth areas have a target — fresh fluid milk and other dairy products produced in regional food systems for consumers who have a renewed zeal for ‘local.’ Fresh fluid milk will have to find a path outside of the consolidating system and cut through the global climate-marketing to directly communicate fresh, local, sustainable messages about a region’s farms, animals, environments, businesses, economies, jobs and community fabric.
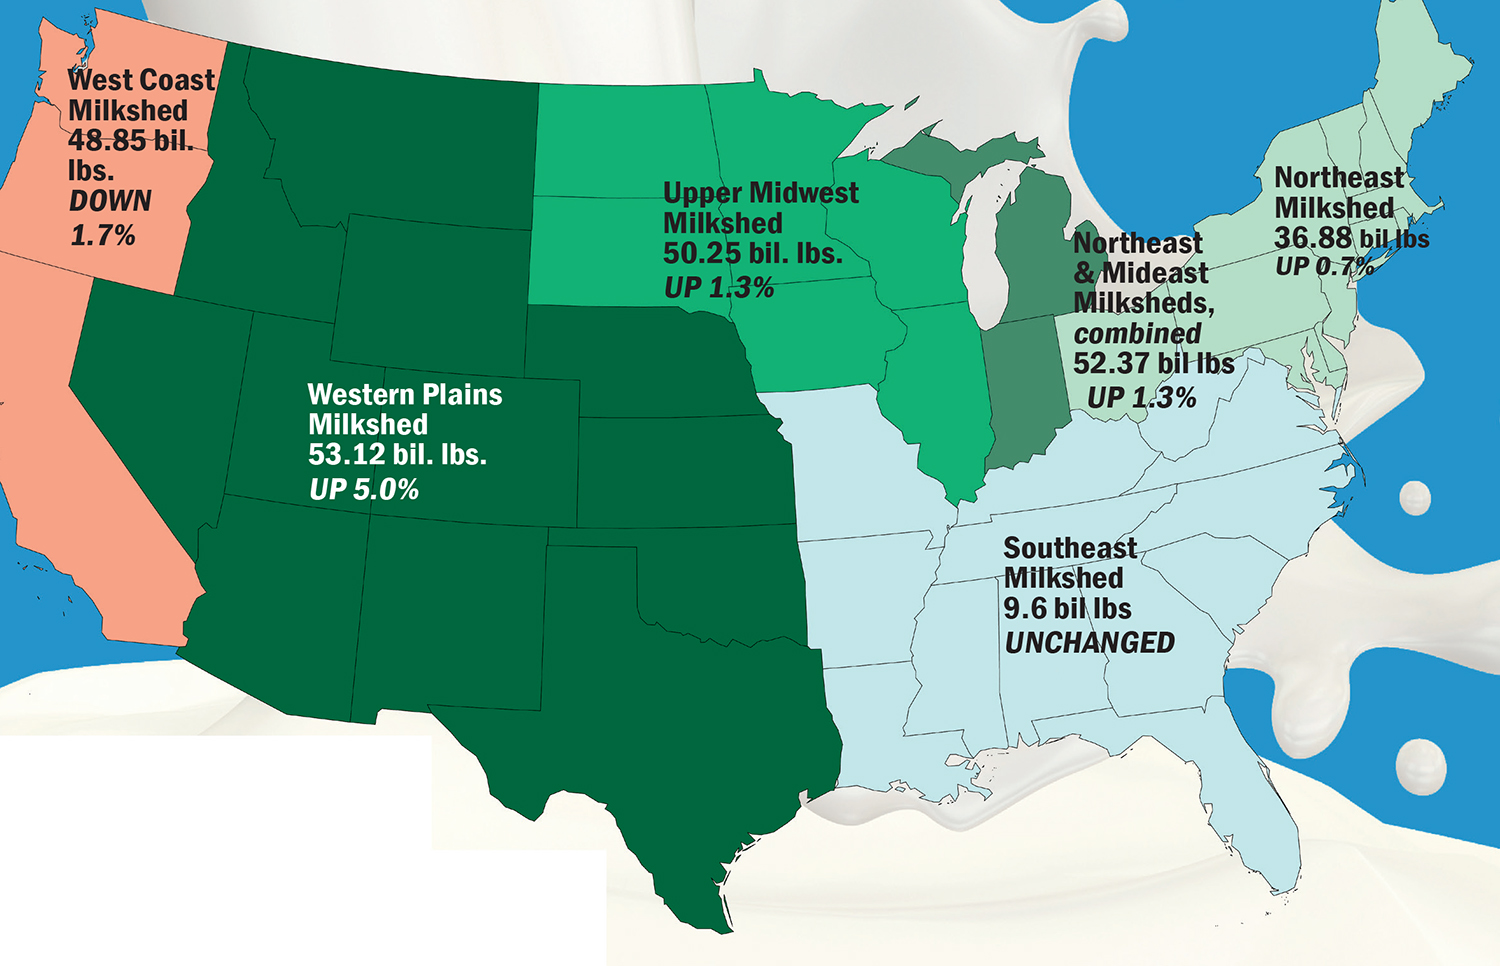
Author’s note: Since Milk Map Math was published April 6, I came across another interesting piece in April 11 Tank Transport Trader, where Dr. Mark Stephenson talks of the surpluses in the Midwest and West and states the 8 bil. lbs. Northeast milk deficit and 41 bil. lbs. Southeast deficit, and how the challenge is getting milk from the surplus areas to deficient areas. Read on, for Milk Map Math – 2017 data.
By Sherry Bunting, Farmshine, April 6, 2018
BROWNSTOWN, Pa. – Dairy consolidation away from the eastern U.S. continued in 2017, aided by further losses in basis revealed in the average net mailbox milk prices.
As the state and regional variations in mailbox milk prices move closer to a national price, the losers on the map are the states encompassed by the Federal Orders with highest Class I utilization: Northeast, Mideast, Appalachian, Southeast and Florida.
Not only is fluid milk the shrinking piece of the expanding pie, it is also the segment of the market with a legacy tied to local farms, family farms, farms that are getting dropped by bottlers as the milk bottling industry is also consolidating into wider spheres of milk sourcing.
The only way to slow this trend is to work directly with consumers and retailers because they have already told the dairy industry they want: local milk. Trouble is, the industry, and the checkoff dollars paid by these significant farms in the diminishing eastern region, are not listening to consumers. They’ve got eyes set across the seas on exports hitting 20% by 2025, while leaving the domestic market for nature’s most perfect food — milk — vulnerable and neglected.
Meanwhile, the milksheds on both the East and West Coasts had production levels in 2017 that were lower or unchanged, while big gains in production in the Western Plains milkshed overtook all milkshed production for the first time.
While U.S. production was 215 bil. lbs., up 1.4% over 2016, the traditional Northeast milkshed, at 36.88 bil. lbs. added just 0.6%. Anchored by New York (up 0.9%), Pennsylvania (up 1.1%), Ohio (up 0.8%) and Vermont (unchanged), this milkshed includes other New England states that lost 3 to 5% and Maryland down 0.4%.
National-footprint cooperatives, like DFA and Land O’Lakes talk of the flood of milk in the Northeast.
Land O’Lakes is shrinking the Eastern base from 9 mil. lbs. per day to triggering penalties above 8.6 mil. lbs. per day, according to letters received by members. At the same time, different rules are applied in the Upper Midwest where demand will be affected by expansion of the Agropur plant driving expansion in the I-29 corridor.
DFA has placed a base program on members in parts of the Southeast, despite the Southeast deficit and virtually unchanged milk production in the milkshed, while different rules are applied elsewhere on the map, even in states that ship milk to the eastern states throughout the year and have a new powder facility in Kansas to balance that.
When the industry refers to the eastern markets being oversupplied, they are really talking about the ability of expansion areas of the U.S. to serve the markets and consumers of the East.
In particular, they are including in the description of a Northeast supply, the Mideast states of Michigan (up 3.3%) and Indiana (up 2.7%). Even when we figure in these states, the combined Northeast and Mideast milksheds produced 52.37 bil lbs in 2017, up 1.3%.
The Midwest milkshed — from Wisconsin and Illinois to the Dakotas, including the rapidly growing I-29 corridor of Iowa, Minn. and South Dakota — made 50.25 bil. lbs, up 1.3%.
The sea of green in milk production, however, can be found in the Western Plains milkshed from Texas, New Mexico, Arizona in the south to Nevada, Utah, Idaho to the north, including rapidly growing Colorado, Kansas, Nebraska and Oklahoma. This milkshed grew by 5% to 53.12 bil. lbs.
Texas, alone, produced over 12 bil. lbs., up virtually 12% on the strength of output per cow and 7% more cows — leapfrogging both Pennsylvania and Michigan for the No. 5 spot — pushing Pennsylvania to 7th.
New Mexico grew 6.5% to 8.21 bil. lbs. with 4.3% more cows. Every state in this milkshed grew by more than 5% except for Nevada’s growth of 3.6% and number 4 Idaho’s small loss of 0.3%. The West Coast made 48.85 bil lbs, down 1.7% in 2017 with No. 1 California off by 1.7% and Pacific Northwest off by more.
Shifts in state and regional Mailbox Milk Prices tell the story. Losing the most ground relative to the U.S. average were Pennsylvania and the Southeast states. Both were averaged by USDA at $17.55 for 2017. In fact, the eastern Pennsylvania portion of that price was even lower, at $17.39.
Interestingly, the West Coast gained the most ground on net mailbox prices with California’s mailbox at $16.19, up 9.3% over 2016 and the Northwest at $17.59 up 10.2%.
Florida regained the number one position with a mailbox price of $18.96, up 9%, while the Southeast milkshed was tie for 10th with Pennsylvania at $17.55. This value represented a 7.2% gain over 2016 for Pennsylvania but just a 5.8% gain over 2016 for the Southeast.
New England was second at $18.65 and the Appalachian region regained third with a 2017 mailbox price of $18.09, up 8% over year ago. New York was $17.46.
Wisconsin had the fourth highest mailbox price in the nation at $17.95, up 7.6% while Minnesota was 9th at $17.56, up 6.4%. Iowa and Illinois were up 8 and 9% with mailbox prices of $17.69 and $17.96, respectively.
Ohio was up 9% with a mailbox average of $17.61, while Indiana was up 7.4% at $17.02.
Michigan, up 8.3% at $15.59, and New Mexico, up 5.4% at $15.24, were the states with the lowest mailbox prices. West Texas garnered a mailbox average at $16.77, up 8.6%.
Wisconsin and Pennsylvania remained the top two for the number of licensed dairy farms. Pennsylvania lost 80, down 1.3% at 6570. Wisconsin lost 430 at 9090, down 4.6%.
Overall, the U.S. milk production increase of 1.4% came from 67,000 more cow on 1600 fewer licensed dairy farms. Across the 50 states, the number of licensed dairy farms fell 4% to 40,219 and the number of dairy cows grew 0.7% to 9.3 million head.
Keep in mind, USDA milk production statistics are compiled, in part, using Market Admin. pooling reports for marketings relative to cow numbers. With milk moving in ways it never has before, there could be some gray areas in some of these state and regional tallies.
By Sherry Bunting, Milk Market Moos, Farmshine, February 2, 2018
Picking up from the previous dairy export ‘Jeckyll and Hyde’ discussion… Let’s look at what has happened to the fluid milk market in the U.S.
There is a difference between Class I utilization declining and actual packaged milk sales declines. For example, the 2017 year figures are not yet in, but for the last reported month of November, USDA reports that packaged conventional fluid milk sales for January through November 2017 are down 2.1% from year ago and organic fluid milk sales are off by 0.2%.
While consumers are drinking less dairy milk on a per capita basis, Class I — as a percentage of all milk sold — is declining faster because the processing of milk into other growing dairy product sectors is increasing.
Some of the increase in these product sales reflects domestic growth, but the kicker is that as exports increase as a percentage of total milk production, Class I utilization as a percentage of total raw milk sales is pushed lower — even if consumers drink more milk.
Let’s identify how the markets are changing and how to value them back to the raw milk producer rather than laying blame for over production that leaves the farmers in the position of “deserving the price they get.”
Supply management is not the answer, nor is it at this point really possible. It is a distraction. We need to be looking at the dairy trade in a way that both prepares farmers for the future and prepares the industry for dealing fairly with producers.
Case in point. How concerned has the National Dairy Council and the dairy industry been about the fraudulent use of the word ‘milk’ on plant juice labels? NMPF’s efforts to right this wrong came only within the past two years — and 15 years after these sales of fake milk started eating into the fluid dairy milk sales.
How serious have they been about the milk that our children drink in school? It is interesting that GENYOUth was “founded in 2010 as a partnership between the National Football League and National Dairy Council, convening leaders in a movement to empower America’s youth to create a healthier future.”
One example given at the GENYOUth website recognizes U.S. Dairy Export Council CEO Tom Vilsack for his accomplishments for dairy farmers while serving as Secretary of Agriculture under President Obama. In his current role, Vilsack’s salary is paid by DAIRY FARMERS via the mandatory promotion checkoff.
Specifically a December GENYOUth gala recognized Vilsack for having “legislated to improve the health of America’s kids. Under Sec. Vilsack, USDA partnered with First Lady Michelle Obama’s Let’s Move! initiative alongside GENYOUth to improve the health of America’s children. Sec. Vilsack helped pass and implement the Healthy, Hunger-Free Kids Act to help combat child hunger and obesity by making the most significant improvements to U.S. school meals in 30 years.”
That is certainly a mouthful, considering that something else occurred in 2010-11. This was the very same year that schools were forced to offer only 1% or fat-free white milk and flavored milk could only be offered as fat-free!
Unfortunately, this did not improve school lunch meal nutrition, and it has cost dairy farmers plenty in lost milk sales.
In fact, Bob Gray for the Northeast Association of Farm Cooperatives stated recently — during a panel of dairy producers and policy folks at a Congressional viewing of the New England documentary Forgotten Farms I attended in Washington D.C. earlier this month — stated the impact of the school milk issue on milk sales, surpluses and pricing.
“For the past six years, we have not been able to sell even 1% (fat) milk in the schools,” said Gray about being forced to sell flavored milk only as fat-free. “In the first four years, alone, we lost 288 million half pints of milk sales that were not consumed by schoolchildren (2012-15) because of this move, alone.”
But maybe this is the point.
If fluid milk consumption erodes as a percentage of milk production, the cost of milk to processors becomes less for the many other products that need to be more competitive globally.
Technology is driving some of these trends. New opportunities and new knowledge are improving efficiencies throughout the supply chain. But marketing direction often leaves more questions than answers when it comes to spending money dairy farmers are forced to pay for it.
Meanwhile, as Dr. David Kohl, Virginia Tech professor emeritus, pointed out as a speaker last week in Lancaster County, Pa., the advances in technology are driving production from an efficiency standpoint. What these advances do for agriculture is to help less productive farms improve yields. “Technology improves the bottom end and that creates surplus, said Kohl. “And that is why we need export markets.”
To my thinking, exports are to be keenly pursued, but pursued with a strategy that does not ignore the market profile of dairy sales here at home, especially when the highest valued product classification under federal price regulation for dairy — fluid milk — is being treated like the Cinderella sister with odds against her, while her sisters get ready for the Prince’s ball.
There are plenty of great innovations in dairy products and distribution — including export markets — that deserve our attention. However, while Cinderella is ignored in plain clothes in the increasingly cluttered dairy case full of fake substitutes, she deserves an invitation to the ball. And a glass slipper or two sure wouldn’t hurt.
Whole milk up, fat-free way down
USDA’s January estimated fluid milk sales report indicates that whole milk sales for the first 11 months of 2017 were up by 2.5% over year ago and November, alone was up 3.5%. Meanwhile lowfat and fat-free losses drove the entire category lower as nearly 12% less fat-free milk was sold compared with year ago, 6.7% less 1% and 2.8% less 2% milk. Similar patterns were revealed among organic milk drinkers with fat-free down almost 20% Jan. through Nov. while whole milk was up 6.2%.
Author’s Note: Re-inventing this Ag Moos blog for the times…. Milk Market Moos is a column I’ve been writing in Farmshine since 2003. Find some of it here, at Ag Moos, along with other dairy and beef market related stories, agriculture news, and, in between, the stories and images of the inspirational people of agriculture… but you can get it first, and you can get it all, in Farmshine Newspaper, just $15/year. Farmshine is a weekly newspaper published in Brownstown, Pennsylvania — now in its 39th year of publishing all-dairy, all-the-time.


 Author’s note: Since Milk Map Math was published April 6, I came across another
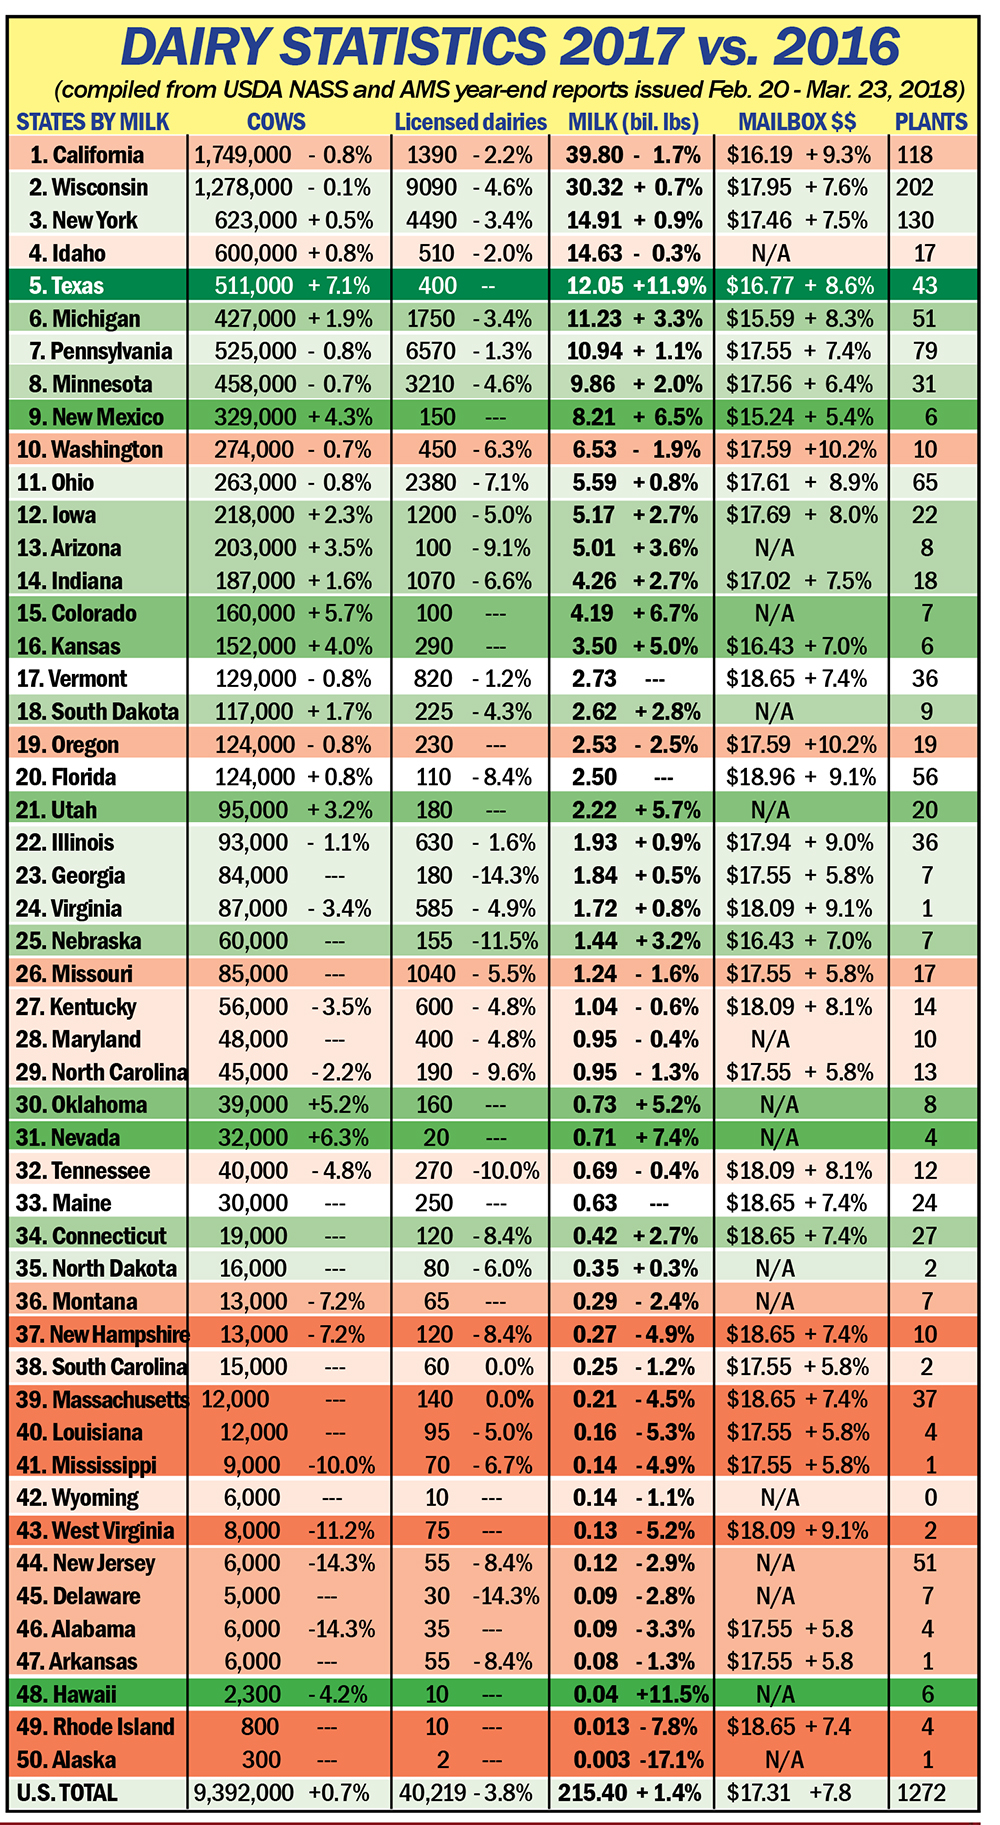 While U.S. production was 215 bil. lbs., up 1.4% over 2016, the traditional Northeast milkshed, at 36.88 bil. lbs. added just 0.6%. Anchored by New York (up 0.9%), Pennsylvania (up 1.1%), Ohio (up 0.8%) and Vermont (unchanged), this milkshed includes other New England states that lost 3 to 5% and Maryland down 0.4%.
 Dairy market fluidity
 That is certainly a mouthful, considering that something else occurred in 2010-11. This was the very same year that schools were forced to offer only 1% or fat-free white milk and flavored milk could only be offered as fat-free!
 “For the past six years, we have not been able to sell even 1% (fat) milk in the schools,” said Gray about being forced to sell flavored milk only as fat-free. “In the first four years, alone, we lost 288 million half pints of milk sales that were not consumed by schoolchildren (2012-15) because of this move, alone.”