Lack of vetting cited as impacts of negative PPDs continue
By Sherry Bunting, republished from Farmshine, April 16, 2021
EAST EARL, Pa. — Federal Milk Marketing Orders have been the subject of discussion at many intervals in Farm Bill history. The last time a major reform occurred was in the 1996 Farm Bill, which became effective in 2000 after going through a four-year period of administrative hearings, widespread opportunity for industry and public comment, a thorough vetting.
Back then, the USDA AMS Dairy Division cited concerns about negative differentials (today we call them PPDs) and massive depooling in 1995-98.
Using the ‘higher of’ Class III or IV advance pricing factors for the skim portion of the Class I ‘mover’ formula was decided to be the way to help mitigate this negative situation and fulfill the purpose of the Federal Orders.
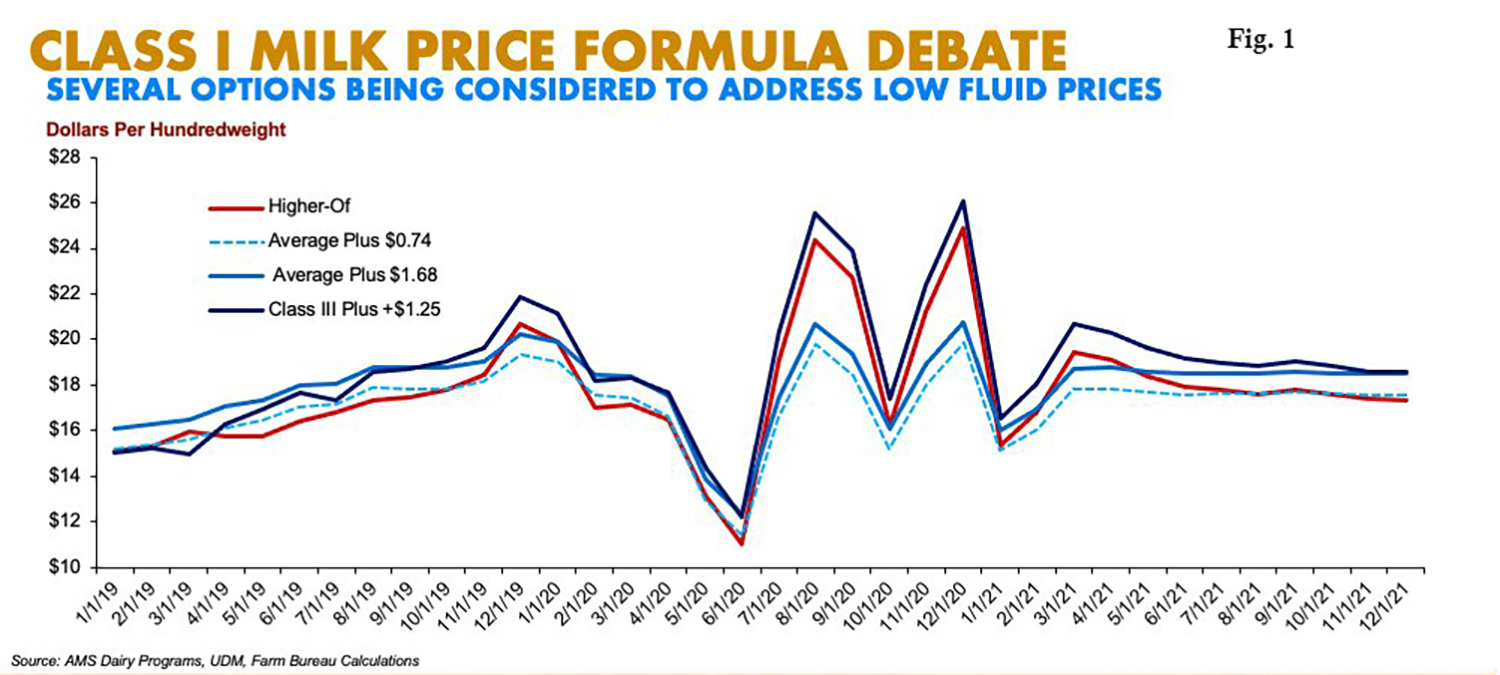
Fast forward to the 2018 Farm Bill: A new Class I pricing method was implemented in May 2019 using the average of Class III and IV advance pricing factors (plus 74 cents) — instead of the ‘higher of’ — as the starting point for the Class I ‘mover’ calculation. This was inserted into the 2018 Farm Bill without hearings, without public comment, with very little industry discussion, and no vetting process
The change was not stress-tested, and producers did not have a seat at the table when National Milk Producers Federation (NMPF) and International Dairy Foods Association (IDFA) agreed to ask Congress to legislatively make this change.
During 23 months of implementation, the result has been disastrous for dairy farmers, and the Farm Bill language calls for the opportunity to amend after the first two years of implementation. We are at that two-year mark right now, and discussions are rippling forward.
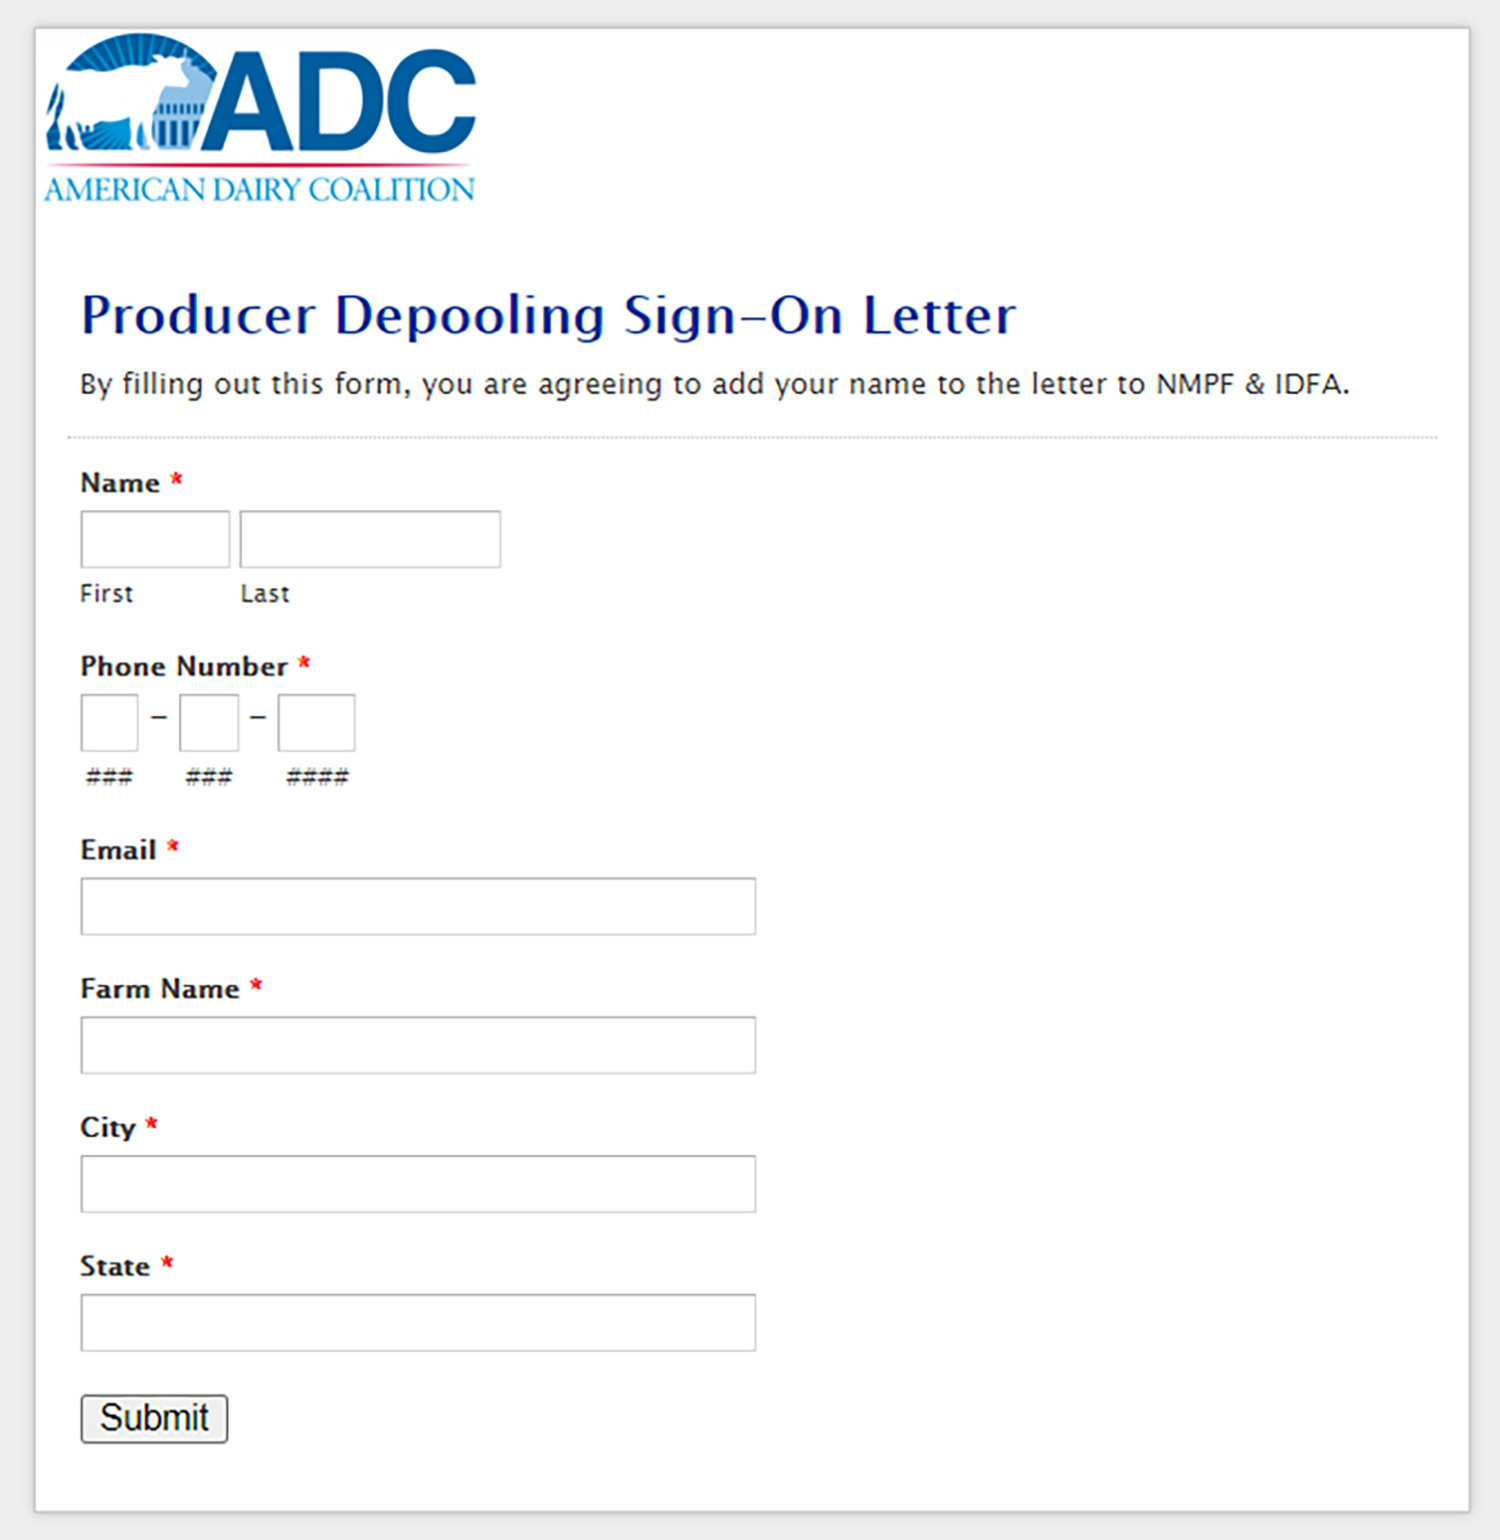
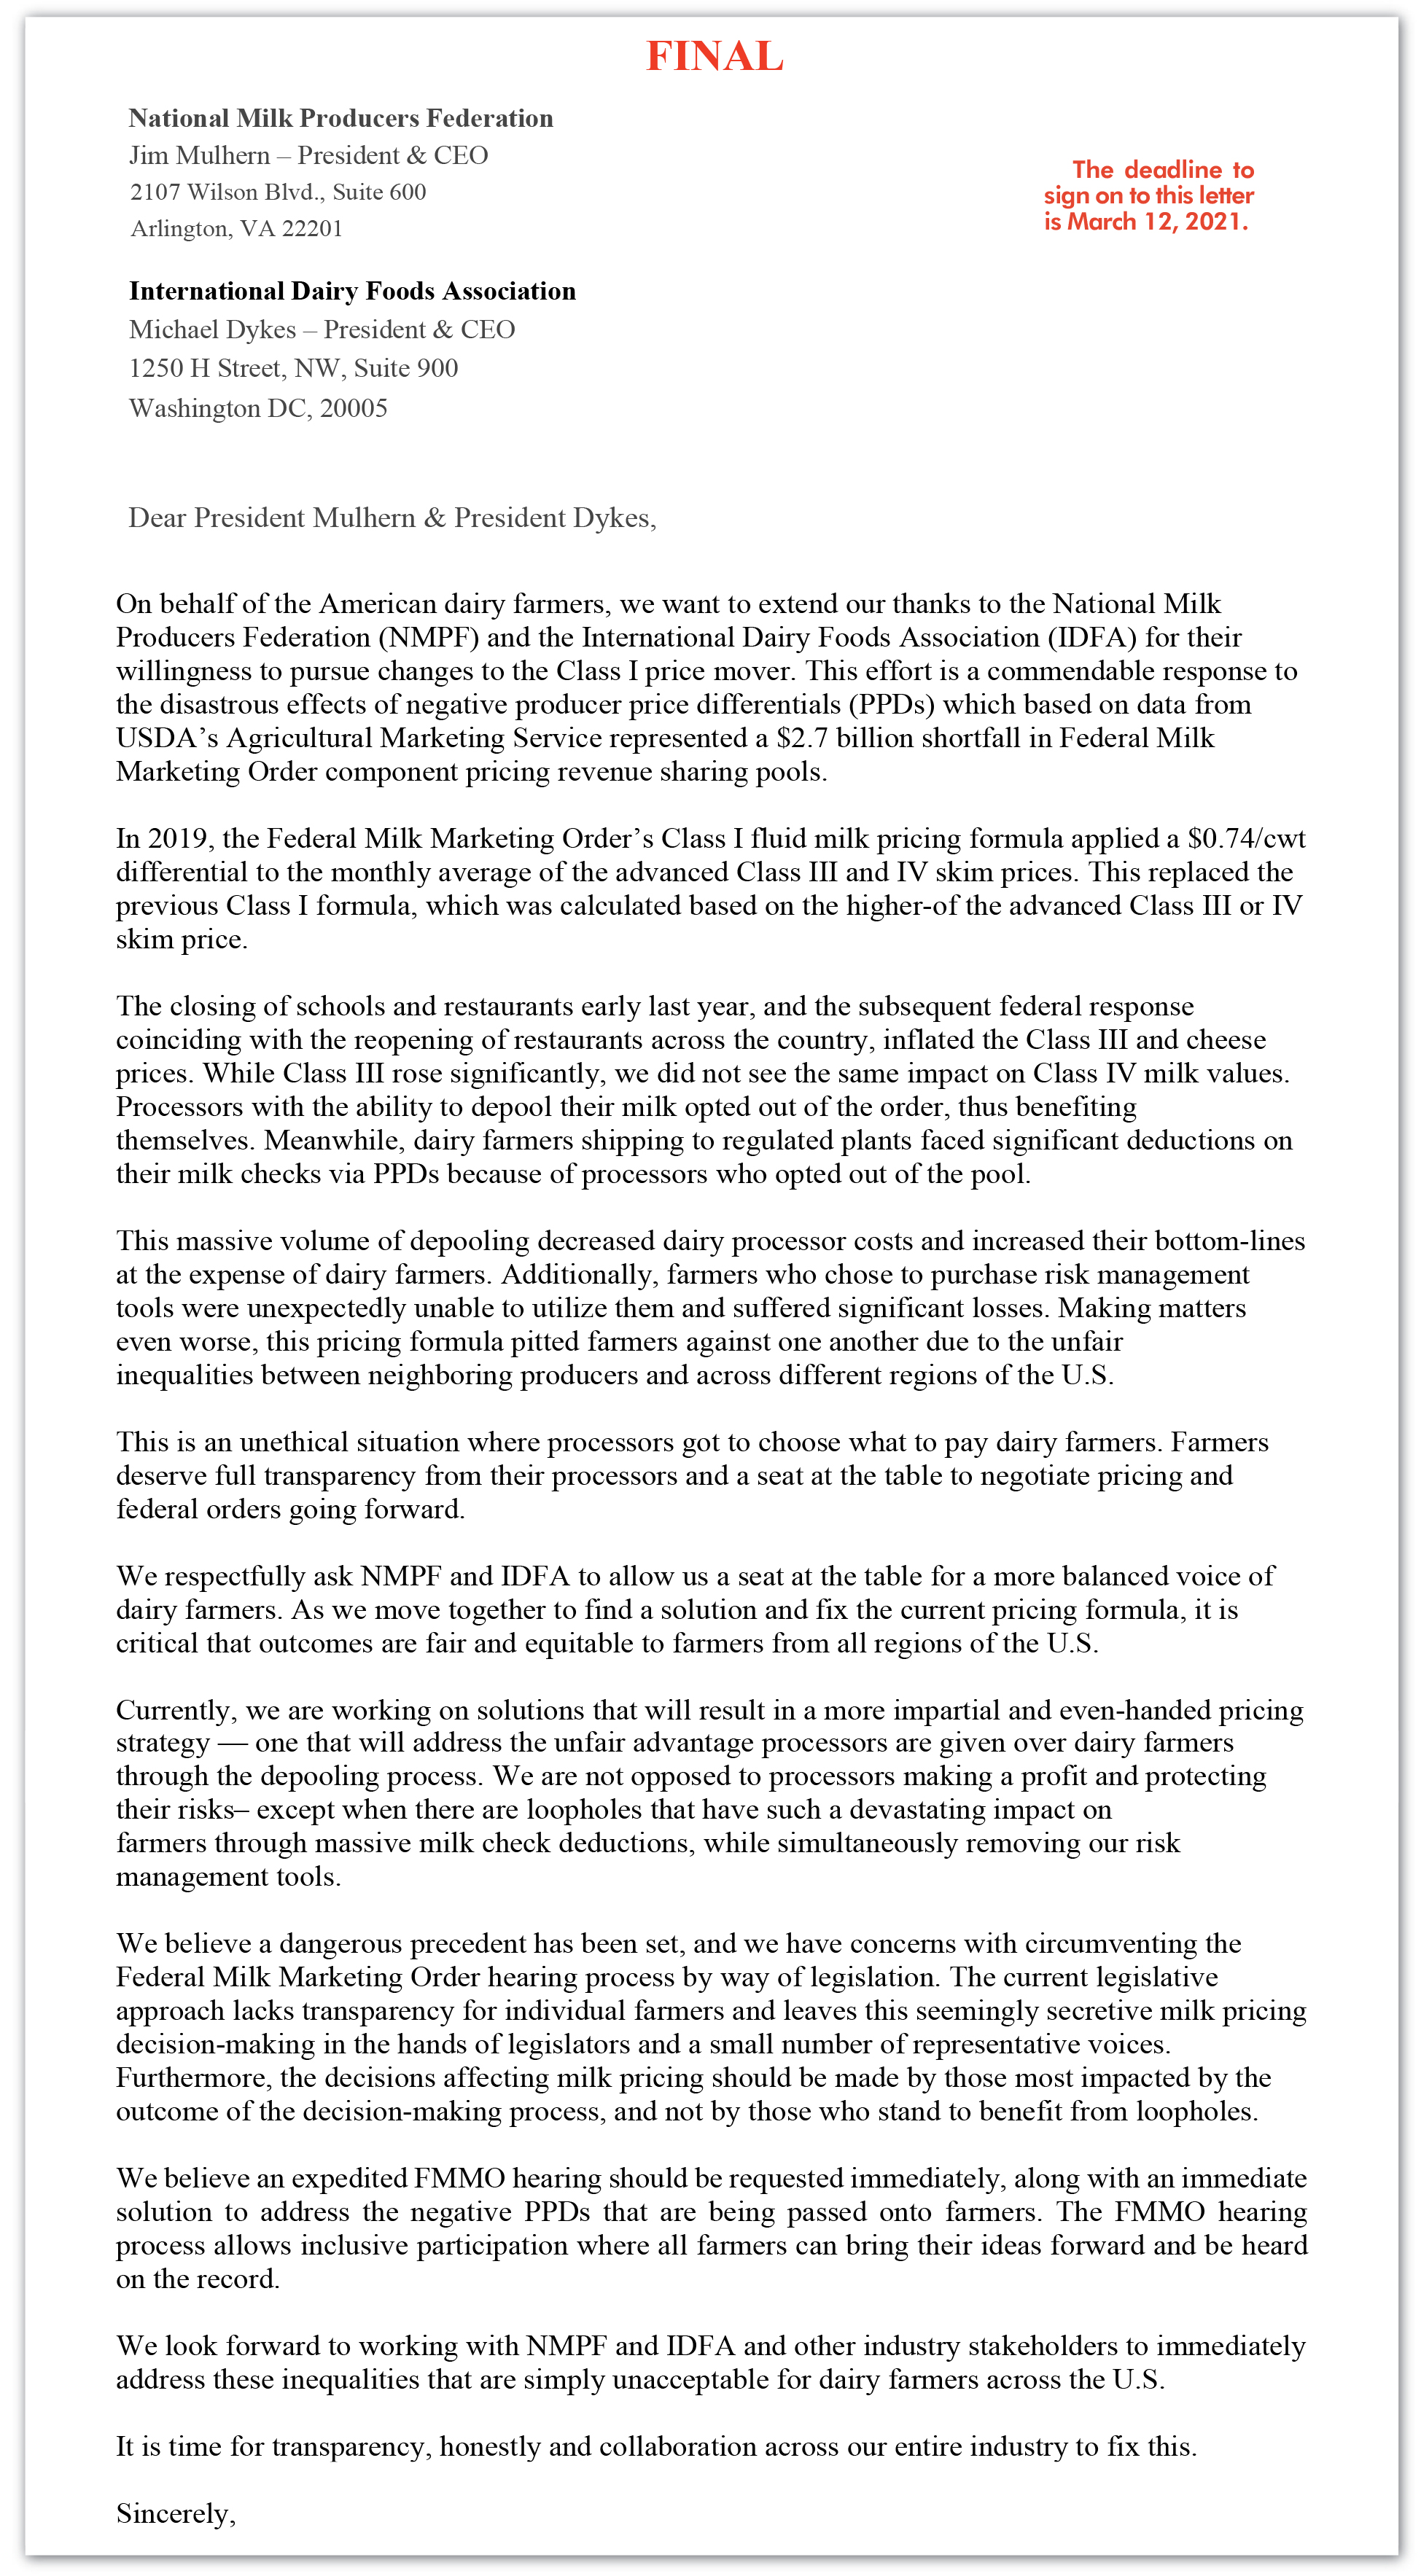
For example, a letter to NMPF and IDFA, organized by American Dairy Coalition (ADC) and signed by hundreds of producers and associations, points out the concerns and seeks a seat at the table for an immediate solution. It also identifies the hearing process as allowing inclusive participation.
In a phone conference call Monday (April 12), after months of discussion, the broad coalition of producers involved in the letter from coast to coast agreed. They are looking for an immediate temporary fix by going back to the vetted method — the ‘higher of’ — at least until a vetted decision can be made for the long-term. On Tuesday (April 13), the ADC board reportedly also took a formal position after listening to farmers from different regions across the U.S. to support an immediate temporary return to the ‘higher of’ while continuing to listen and participate in efforts to reach a vetted, viable solution for the dairy industry.
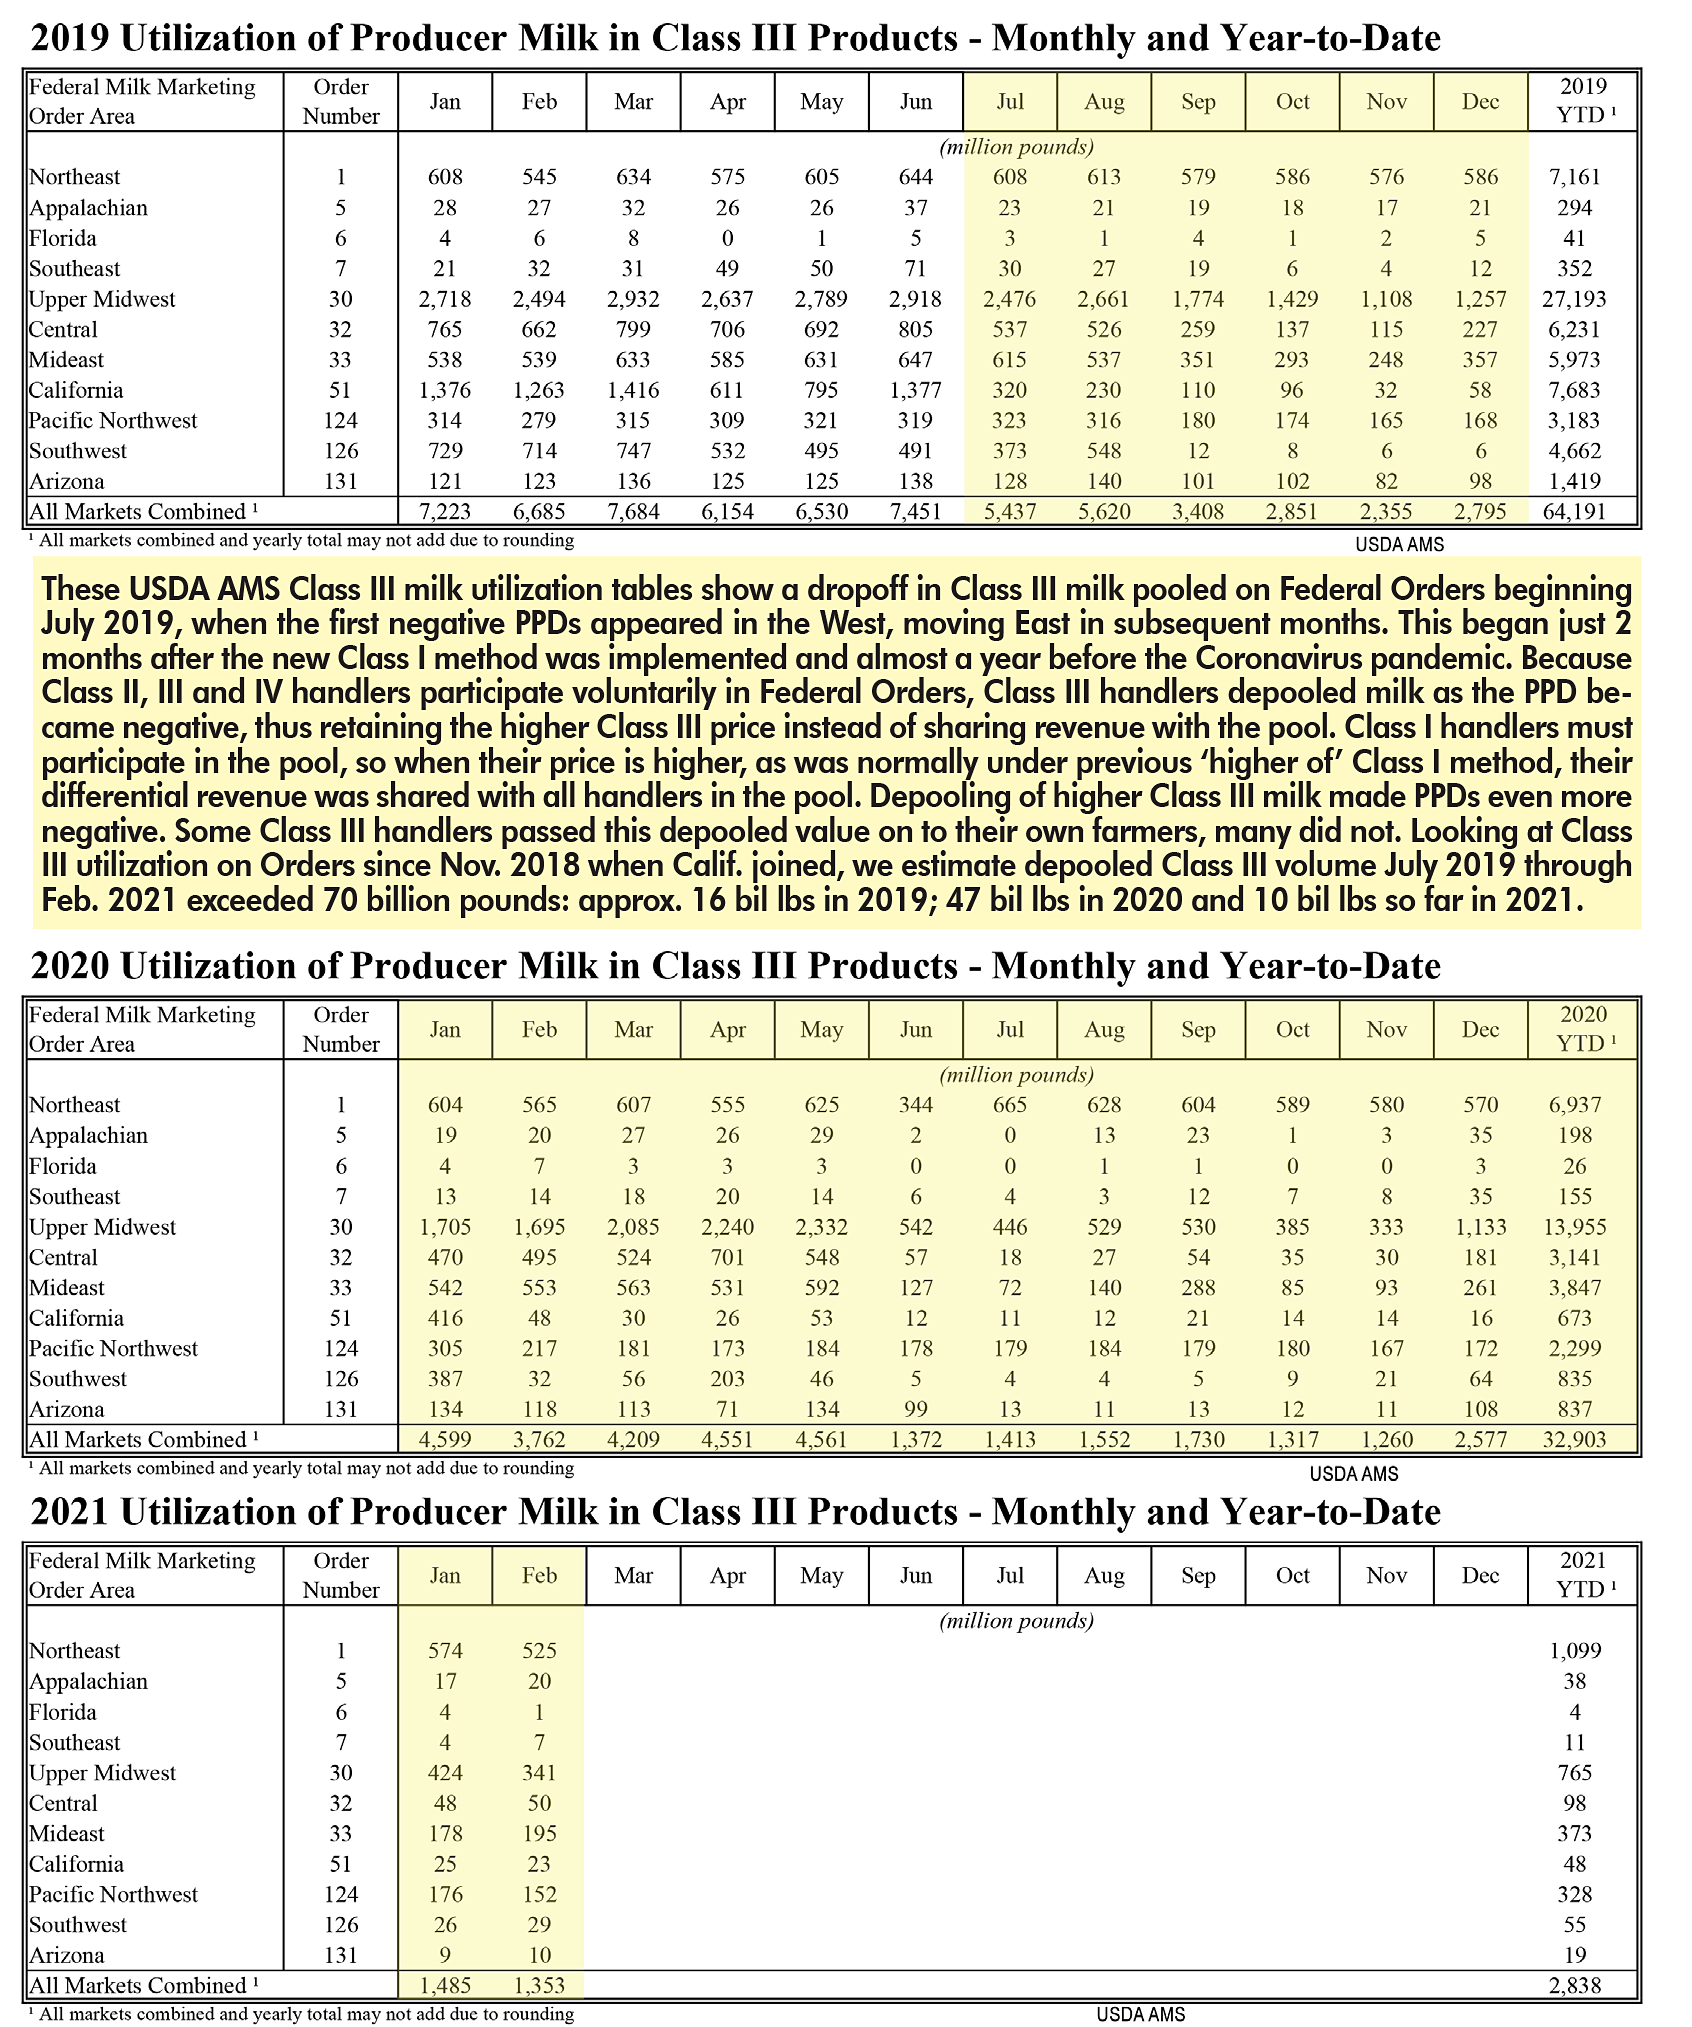
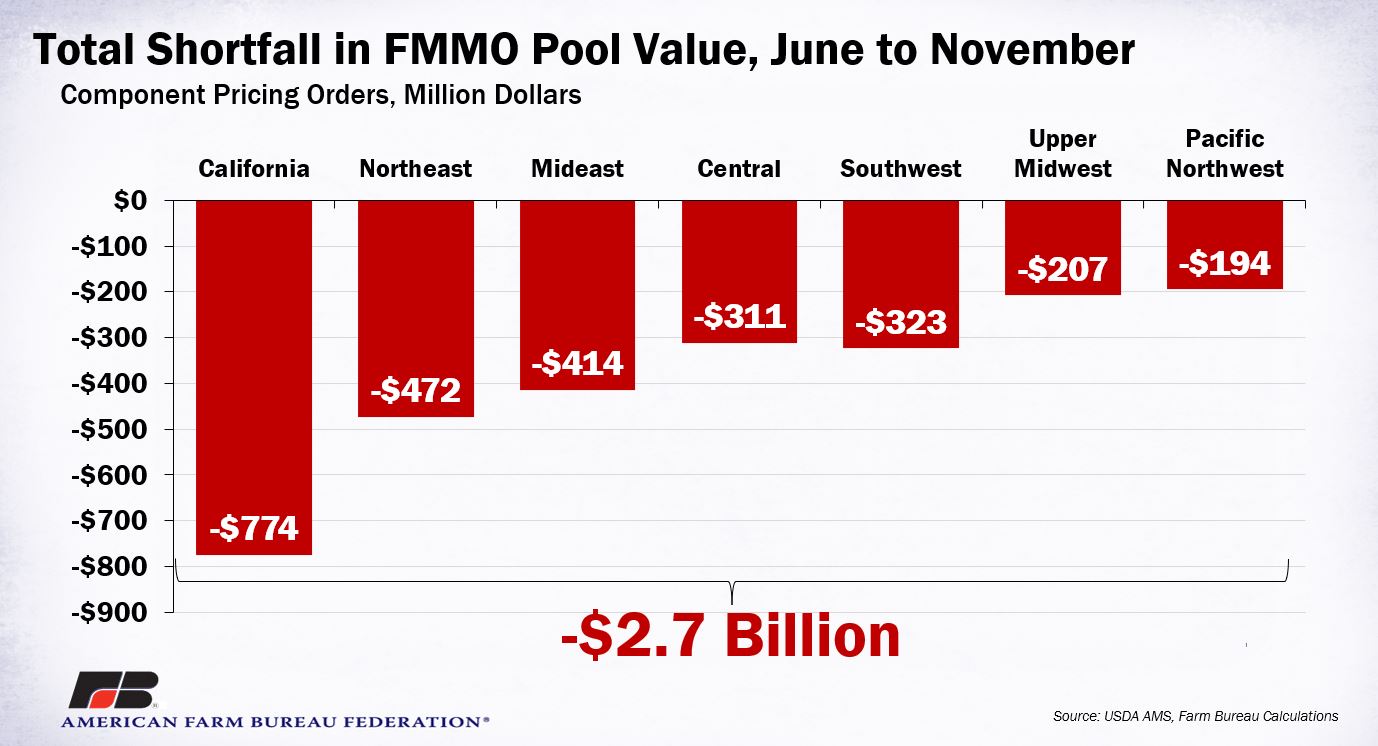
While the Class I change in the 2018 Farm Bill is one aspect contributing to the severely negative PPDs and massive depooling of milk leaving shorfalls in Federal Order revenue sharing in three months of 2019, seven months of 2020 and continuing in 2021, it is an important factor and the only factor that is the result of a change made legislatively without hearings.
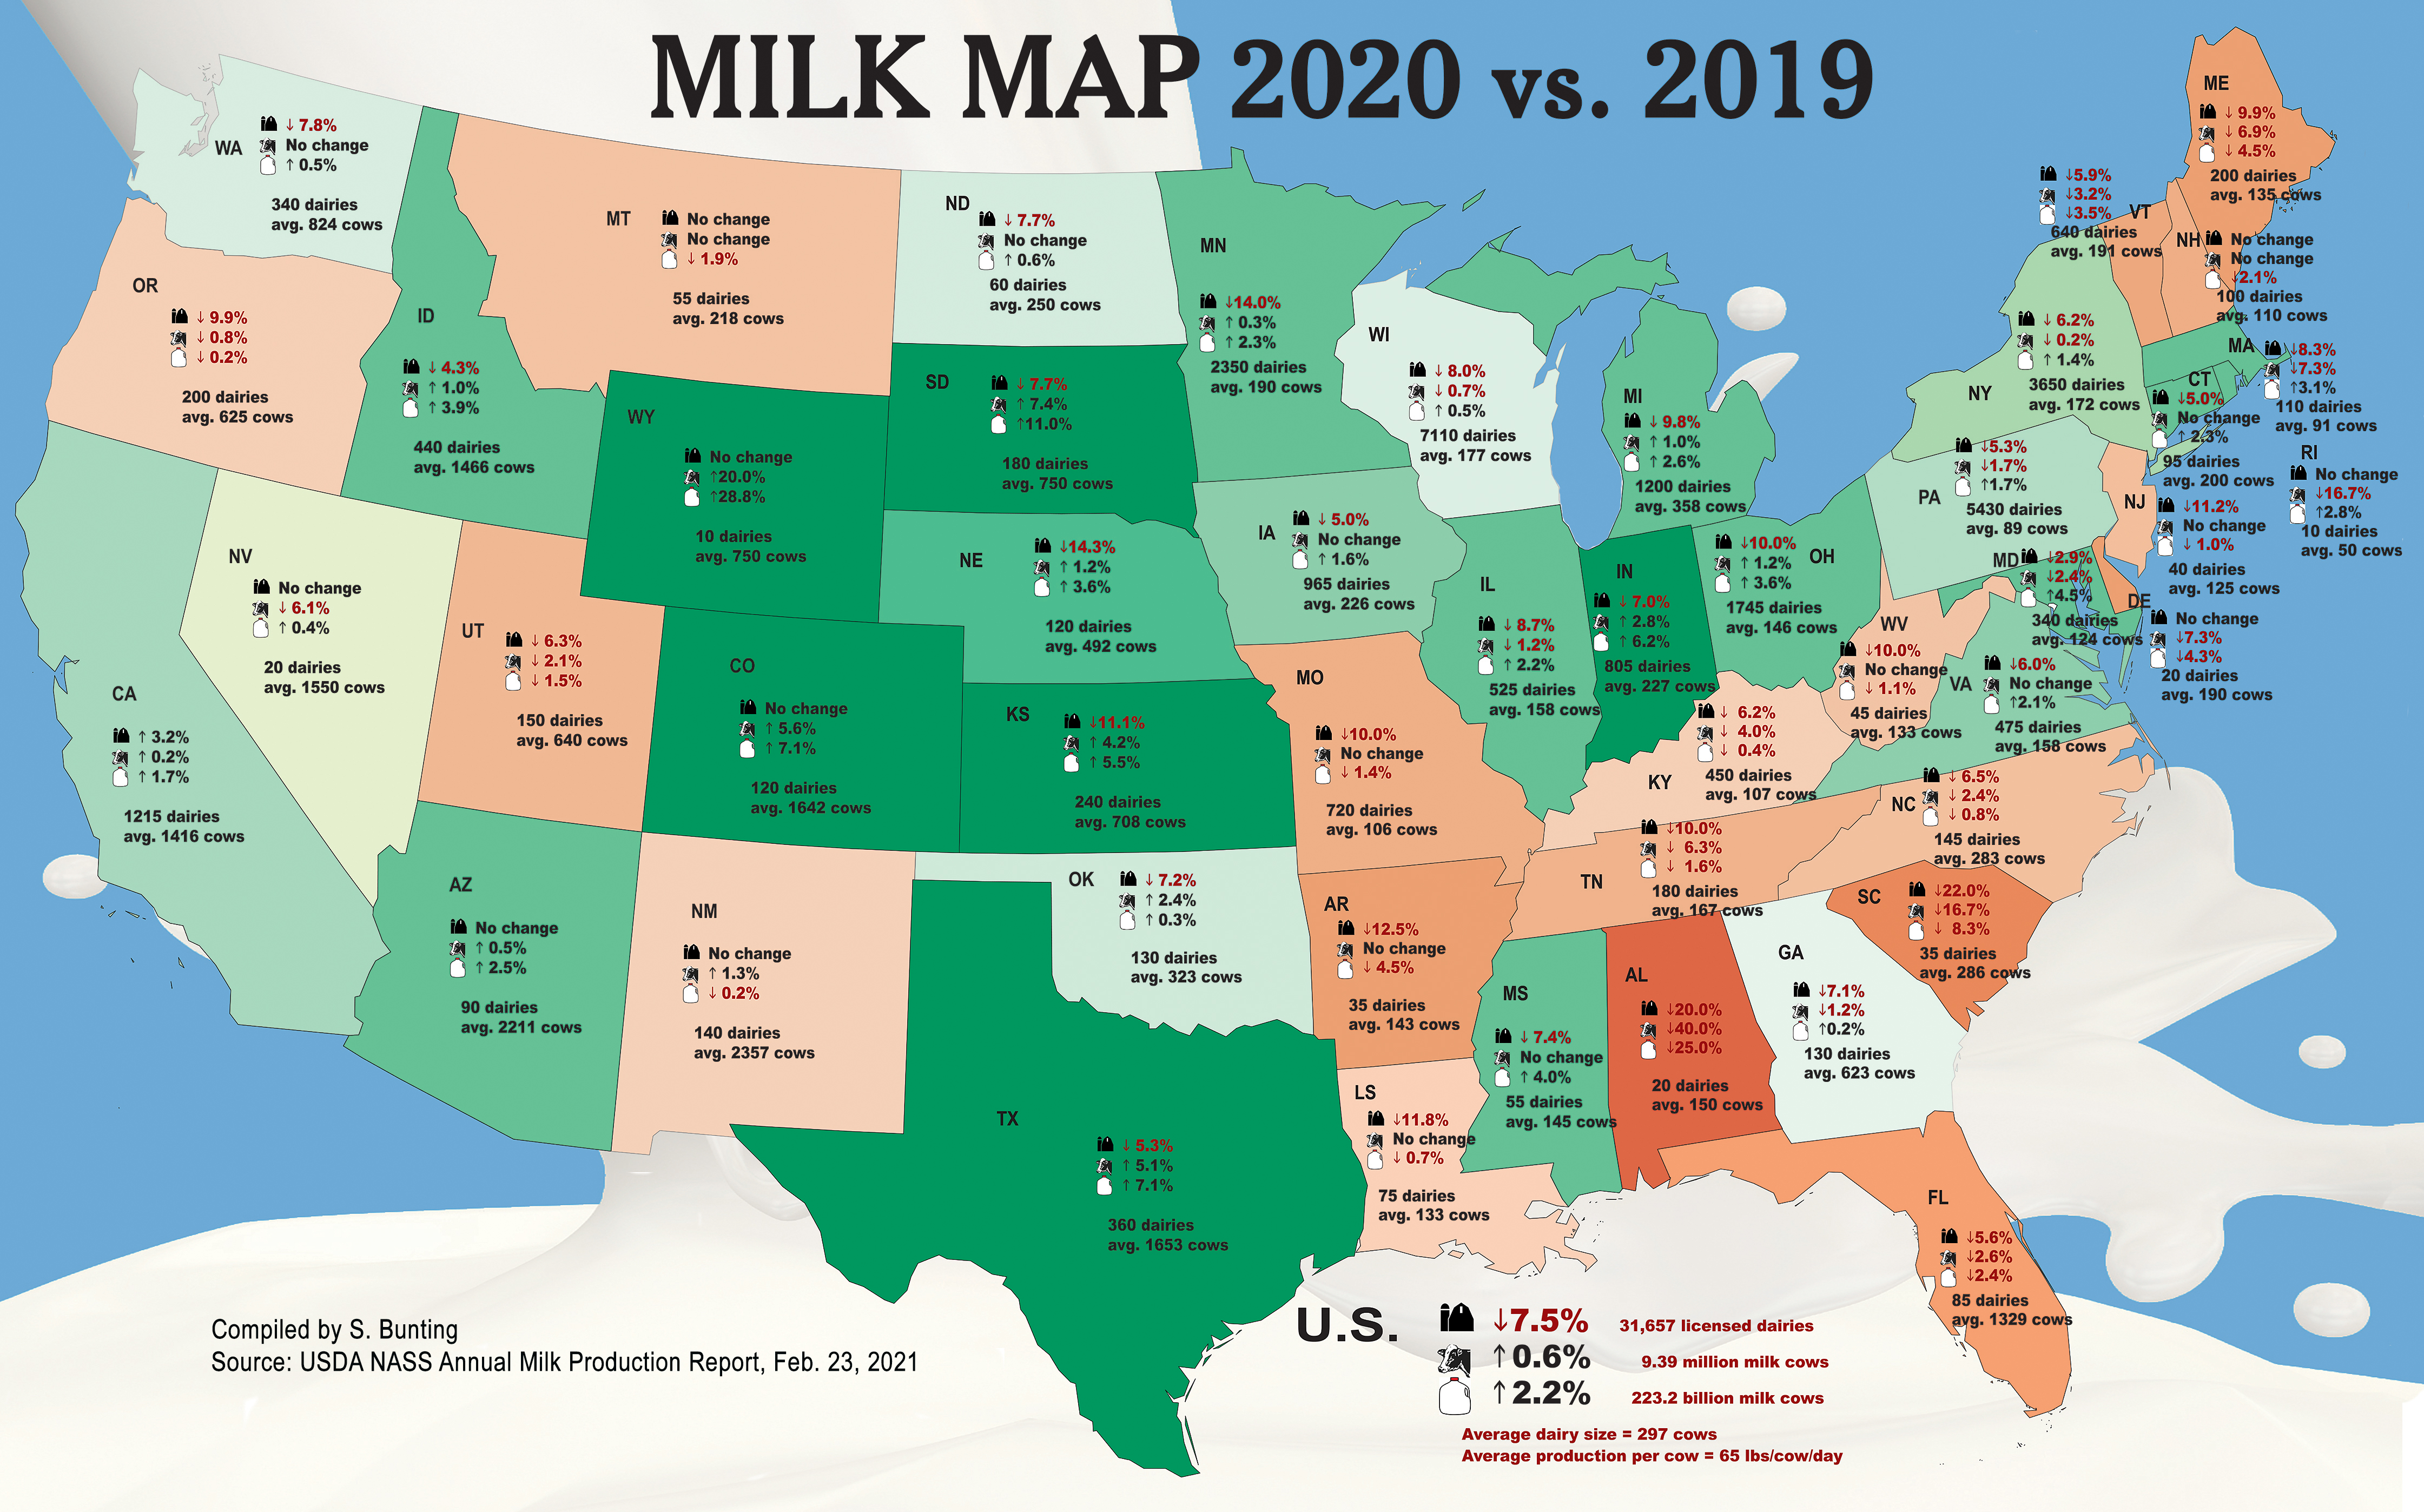
Add to this the predominance of cheese in the government purchase programs throughout the pandemic, and the result has been a huge range in all-milk prices across the country and neighbor to neighbor of $8 to $10 from top to bottom.
Add to this the negative PPDs and depooling creating poor performance of risk management tools and the DMC safety net that dairy farmers pay premiums for. These tools were not designed to function in the inverted pricing situation over 13 of the last 23 months that has led to a NET loss of nearly $750 million in Class I value and over $3 billion in FMMO losses to producers via negative PPDs and depooling.
Calvin Covington has a unique combination of experience and insight into the problem. He was CEO of American Jersey Cattle Association when component pricing was developed and used in the last major reform of Federal Orders. He also spent many years after that as the CEO of a milk cooperative in the fluid milk markets of the Southeast. Retired today, he continues writing dairy market columns and consulting.
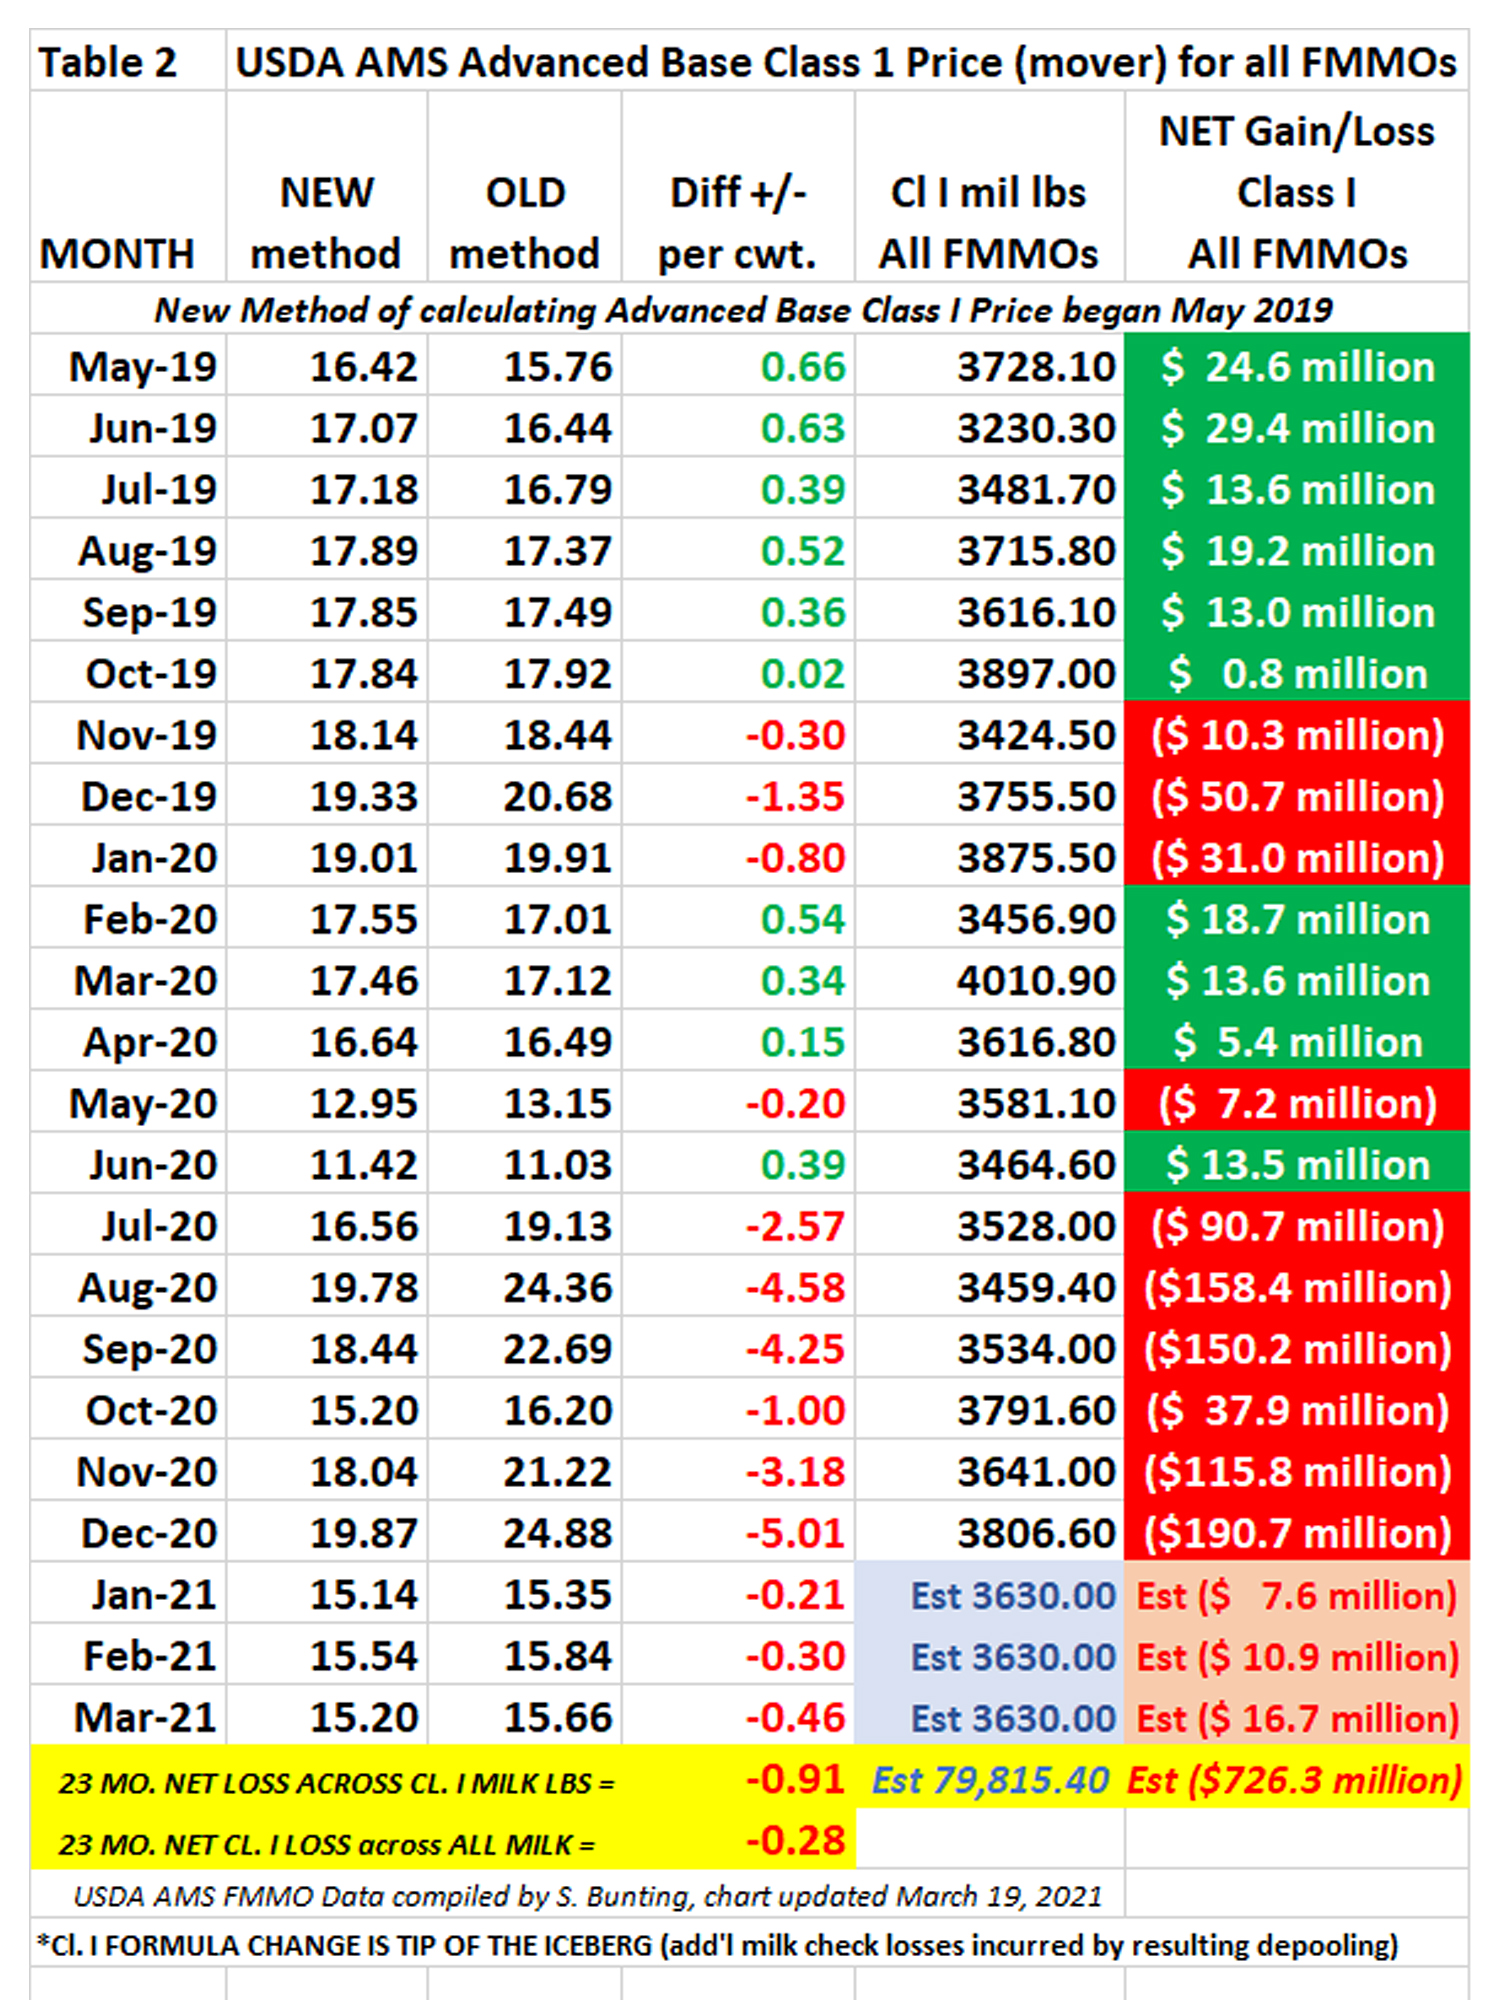
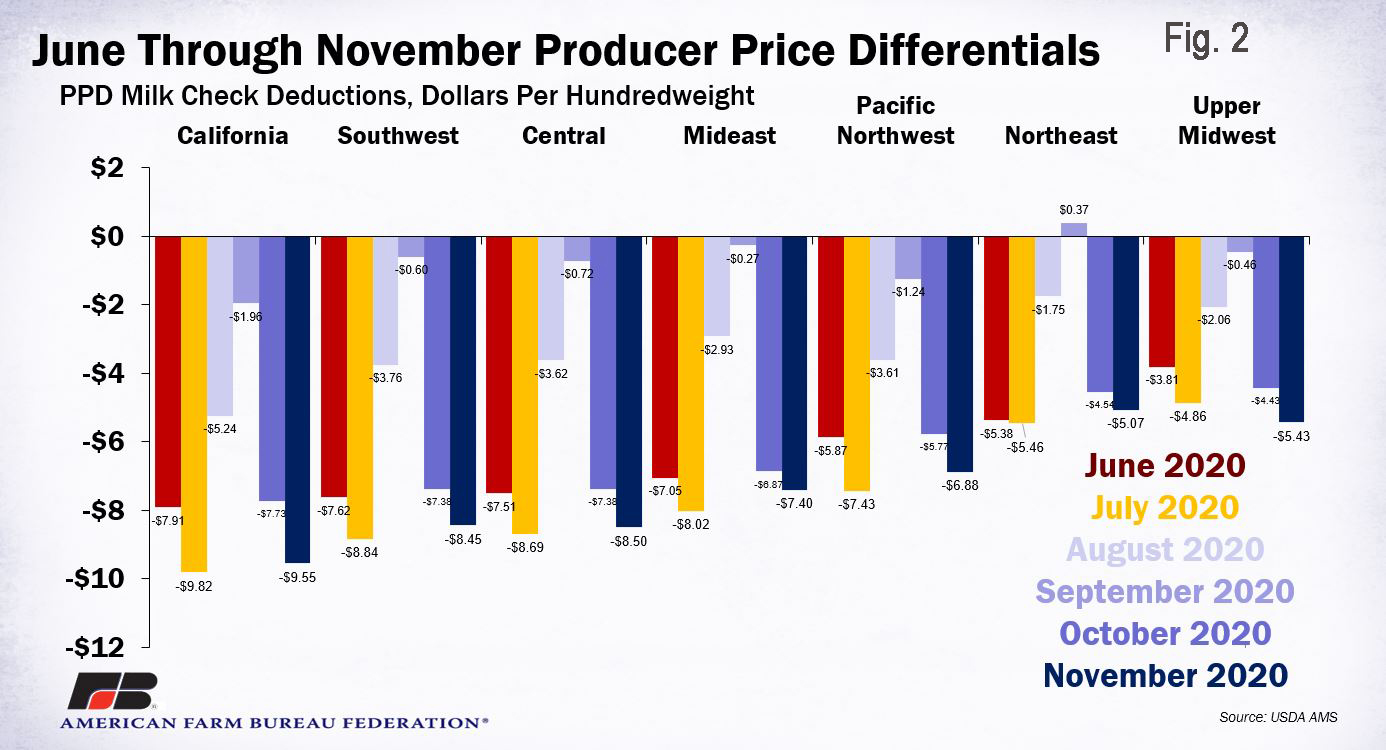
In a Farmshine interview last Friday, Covington shed some light on the Class I pricing change, negative PPDs (Table 2) and depooling.
“What I tell producers in the Southeast: If you took last year, for example, take the three Southeast Federal Orders (5, 6 and 7), this lowered the blend price about $1.00 per hundredweight. That’s real money,” said Covington. “That’s a dollar right out of producers’ pockets.”
That $1 blend price loss he is referring to is the NET loss across all pounds of milk in the Florida, Southeast and Appalachian FMMOs across the 23-month history of the new Class I pricing change.
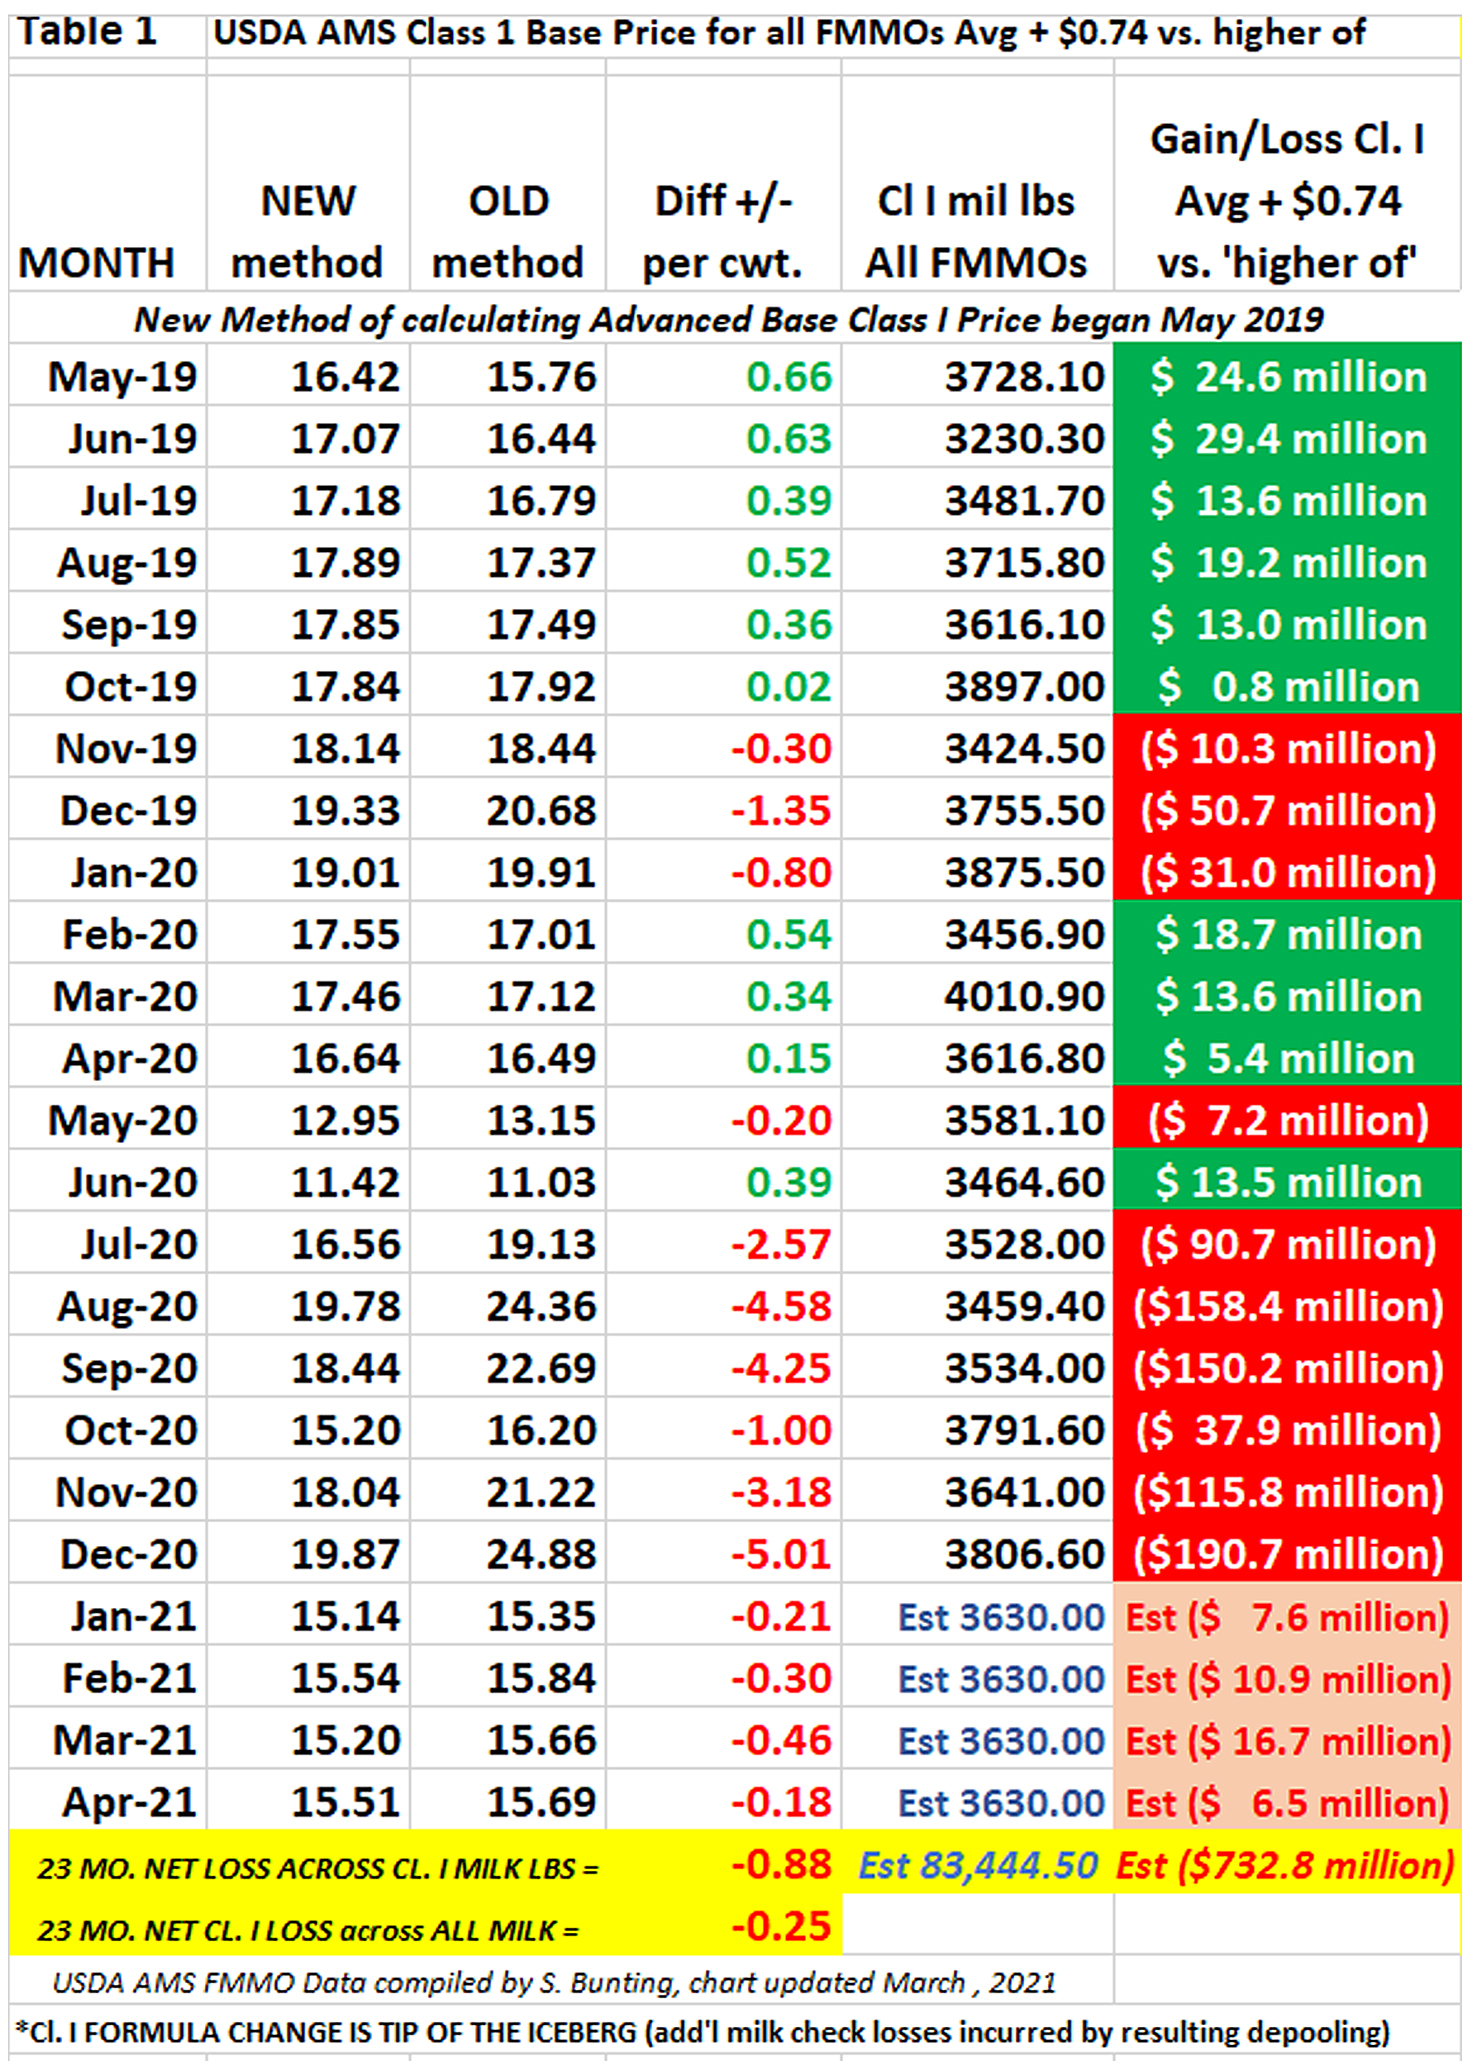
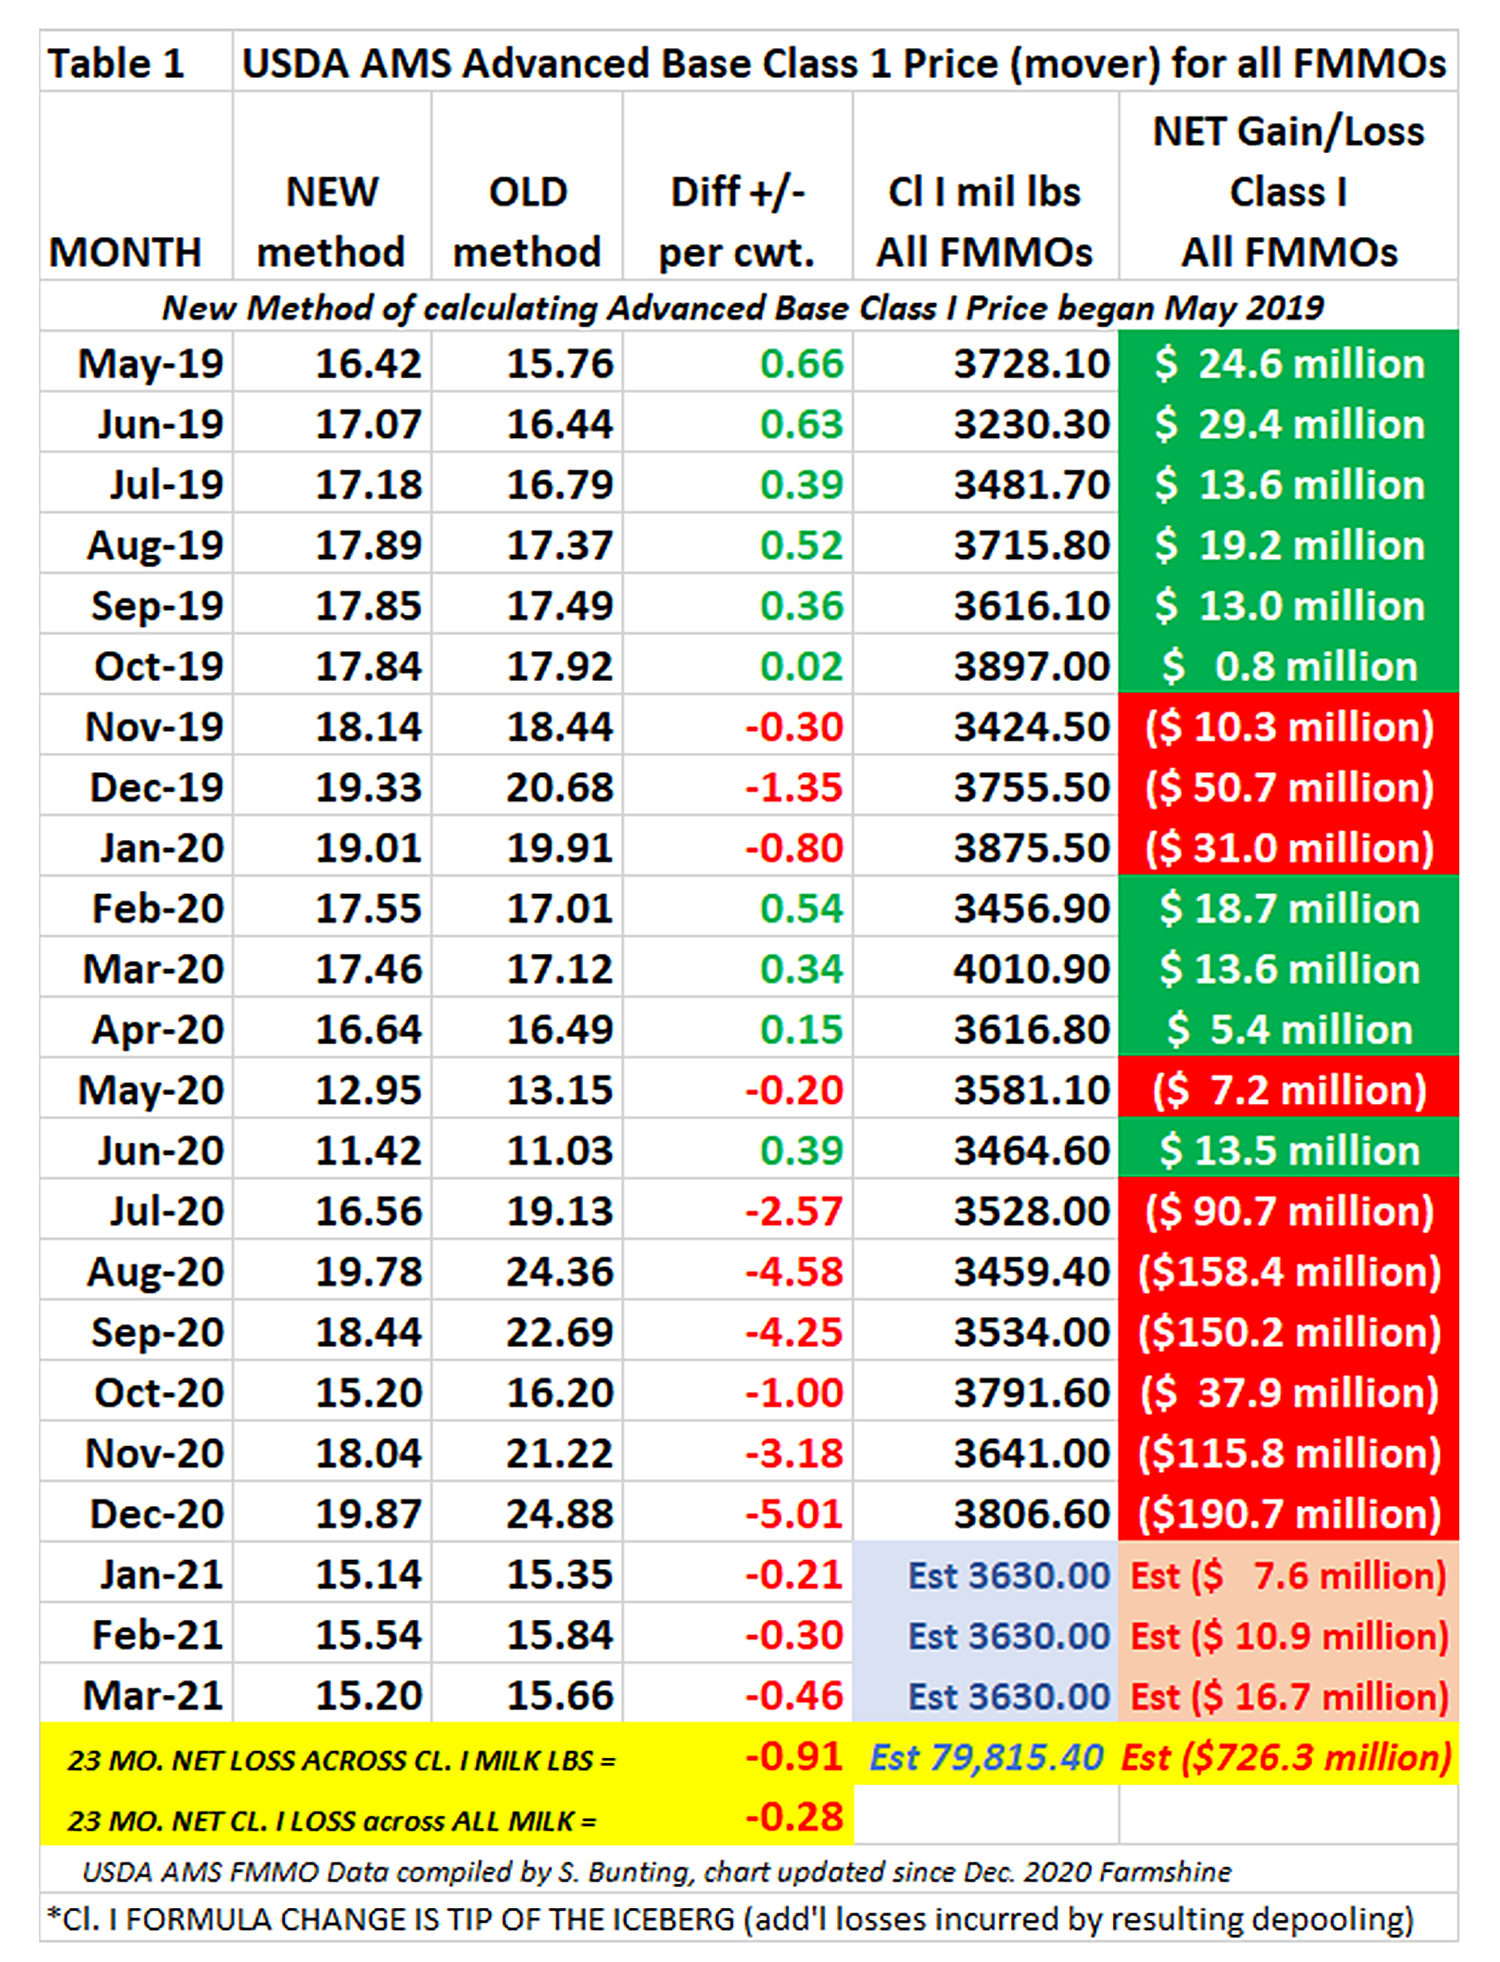
In fact, similar losses were sustained in other Federal Orders as well. Table 1 shows how the Class I change, alone, affected Class I price over the past 23 months, for a net loss of 86 cents per hundredweight on all Class I milk pounds nationwide.
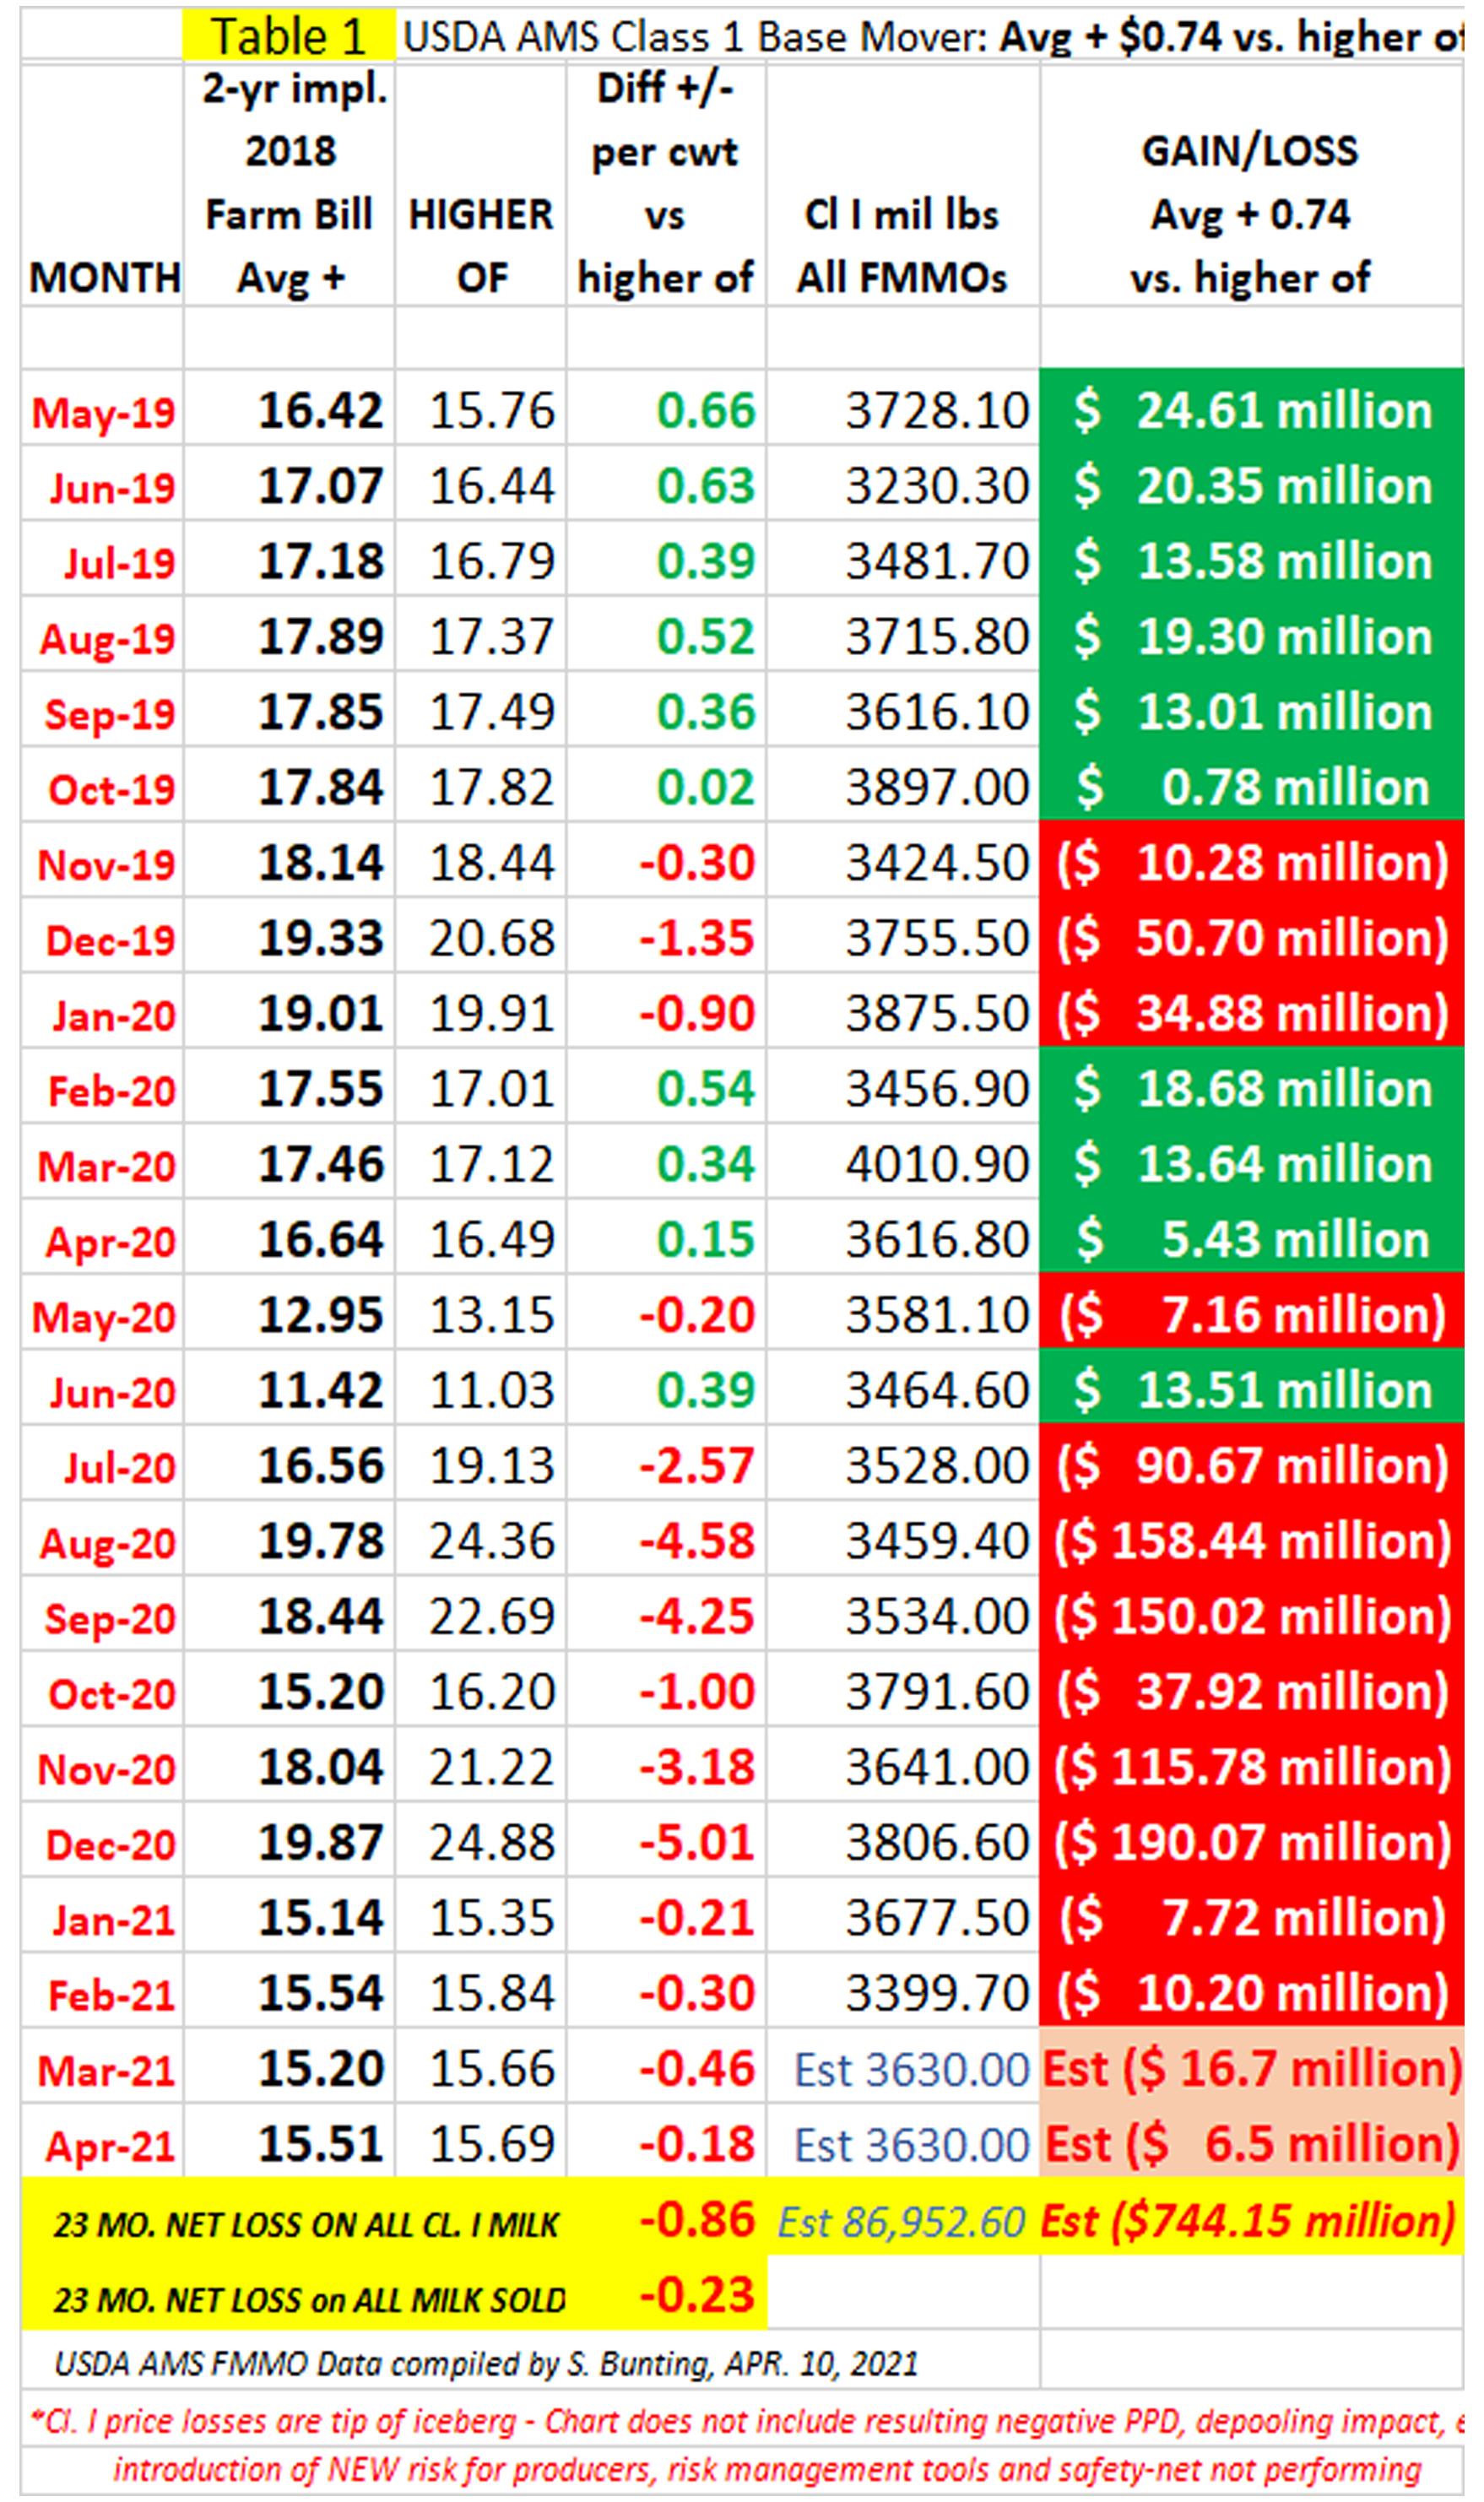
In fact, similar losses were sustained in other Federal Orders as well. Table 1 shows how the Class I change, alone, affected Class I price May 2019 through April 2021, for a net loss of 86 cents per hundredweight on all Class I milk pounds nationwide.
At 28% utilization, this translates to 23 cents per hundredweight across all milk pounds before depooling is factored in. Results vary between FMMOs depending on utilization and depooling. Either way, this net loss means the months where the new method provided any positive impact on the blend price were weighed against the many months where the impact was negative.
Covington and others point to the government cheese purchases as a primary reason for the “big divergence” between Class III and IV. He figures the government purchases during the pandemic represented the equivalent of 1.65% of all milk production in the U.S., and 70% of it, he says, was cheese.
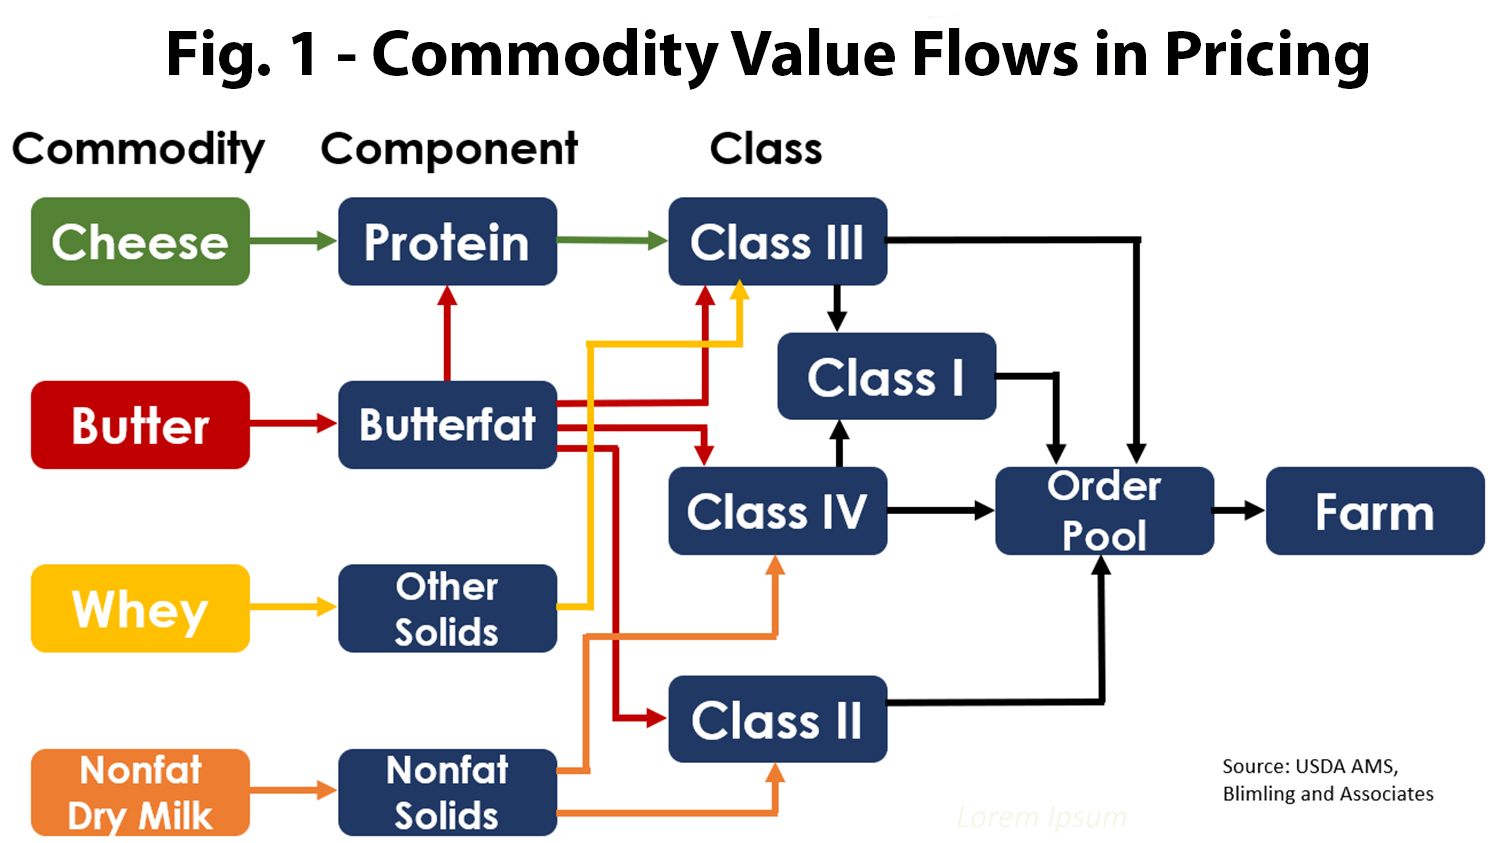
When the divergence in Class III and IV advance pricing factors is larger than $1.48, the impact becomes progressively more negative on the Class I base price, or ‘mover,’ which then impacts the blend price. In the seven multiple component pricing Orders, this contributes to negative PPDs (producer price differentials) by lowering the blend price relative to Class III. If Class IV is already that much lower than Class III, and now the new Class I method averages-in that lower Class IV value, the Uniform Price (blend) minus Class III price becomes a negative number.
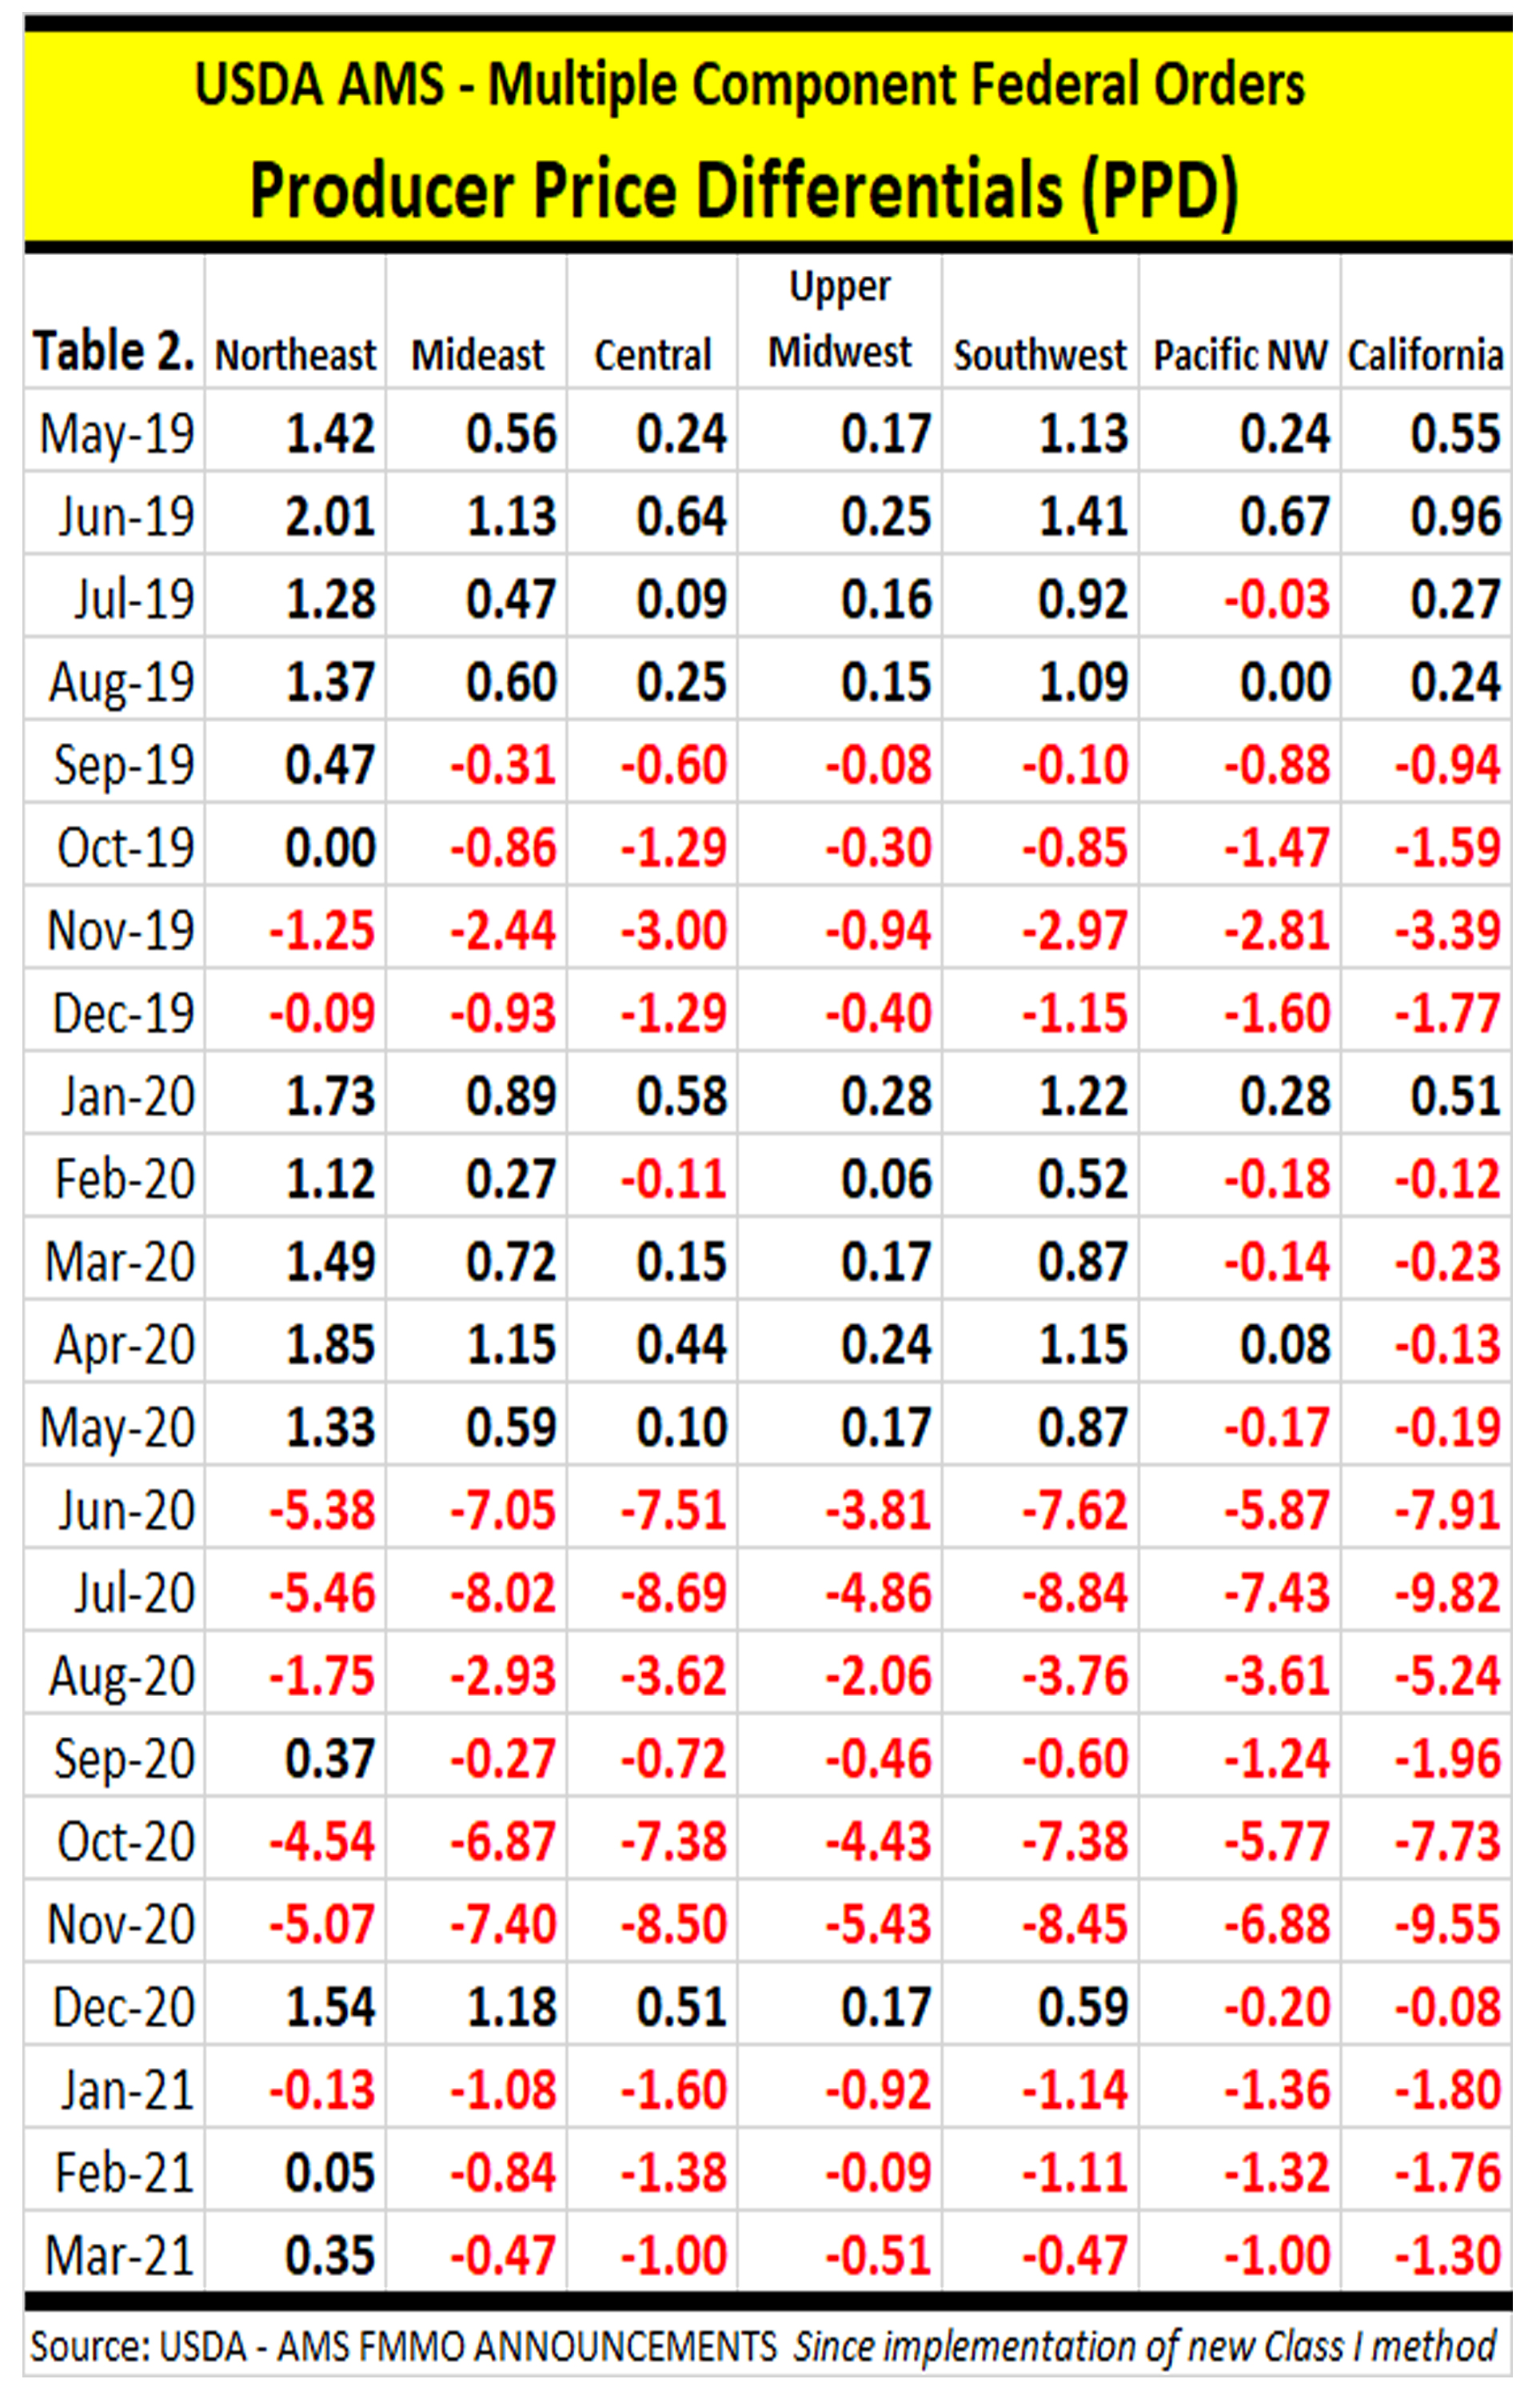
value of producer components exceeds the pool’s classified value, the result is a negative PPD since money out of the pool at producer component values plus the PPD must equal money in the pool’s classified value (pool revenue).
When we have basically 10 months of consecutive negative relationships, then Class III handlers have an easy decision: depool the milk to keep that higher price. Class III handlers are accustomed to receiving a check from the FMMO pool. They voluntarily participate in FMMOs to share in the Class I differential. But writing a check to the pool when Class III is higher? That’s a different story.
So, if Class IV represents largely exported, or clearing, product of nonfat dry milk on the skim side of the Class I averaging equation under this new averaging method, why not just make the Class III advance pricing factor the base skim price for the ‘mover’ formula?
“We’ve got to remember that we have had it the other way around, though not this extreme,” says Covington. (continued)
“In the last half of 2013 and into 2014, we had Class IV higher than Class III.”
Covington makes this observation: “With the kind of volatility we are in now… Exports can be going up or down, who knows. There is the possibility this could happen again (IV over III), and also the possibility if the bottom falls out on the powder exports while cheese is strong (III over IV).”
Either way you flip the what-ifs and wherefores, the point is clear: The USDA AMS Dairy Division vetted the ‘higher of’ to be the way to help assure the Federal Orders function for their primary intended purpose: 1) assuring an adequate supply of milk for Class I fluid use, and 2) orderly marketing.
“I am stubborn on the issue. I admit that right up front,” says Covington. “There is a reason we have the higher of. The Dairy Division did a real good job of explaining this (in 2000). The purpose of the Federal Orders is to get milk to fluid use to make sure consumers have an adequate supply. The ‘higher of’ accomplishes that. Now we are getting away from the purpose.”
So, things have changed, right? People are drinking less milk and eating more cheese than in 2000 when major FMMO reform last took place. That matters if all we are looking at is the revenue sharing function of the Federal Orders — the pouring of revenue from the Class I glass into the receipts of Class II, III and IV handlers.
Covington takes a deeper view into the more basic purpose of the Federal Orders that vets these things in hearings, usually, to play out the scenarios.
“Any time there’s less incentive to move milk to fluid use — and that happens when Class III price gets closer to the blend or Class I price, or like last year Class III was higher than the blend or Class I price — why should the milk move if it is going to receive less money?” he explains. “Likewise, if processors need that milk and go into an area of Class III, they pay a larger give-up number to get that milk (to Class I).”
In short, says Covington, the new ‘average + 74 cents’ method for determining the advance base skim price for the Class I mover “presents the opportunity for this to happen.” In other words, it presents the opportunity for the Federal Orders to become dysfunctional and not fulfill their identified purpose.
Going back to the 2000 decision during Federal Order Reform, the USDA AMS Dairy Division, in their own words, explained why the ‘higher of’ would be used.
Citing this about the situation in 1995-98, the AMS decision stated: “Recent increased volatility in the manufactured product markets has resulted in more instances in which the effective Class I differential has been negative, especially in markets with low minimum Class I differentials. In the past when price inversions have occurred, the industry has contended with them by taking a loss on the milk that had to be pooled because of commitments to the Class I market, and by choosing not to pool large volumes of milk that normally would have been associated with Federal milk order pools. When the effective Class I differential is negative, it places fluid milk processors and dairy farmers or cooperatives who service the Class I market at a competitive disadvantage relative to those who service the manufacturing milk market. Milk used in Class I in Federal order markets must be pooled, but milk for manufacturing is pooled voluntarily and will not be pooled if the returns from manufacturing exceed the blend price of the marketwide pool.”
The USDA AMS vetted decision in 2000 goes on to explain how the situation then was “inequitable … where milk for manufacturing is pooled only when associating it with a marketwide pool increases returns.”
AMS Dairy Division also wrote in the 2000 decision about how the class price inversions were made worse (1995-98) by depooling and cited the tens of billions of pounds of milk involved. The 2000 decision to use the ‘higher of’ was explained in a way that holds relevance for the 2019-21 situation.
USDA AMS stated in 2000: “Because handlers compete for the same milk for different uses, Class I prices should exceed Class III and Class IV prices to assure an adequate supply of milk for fluid use. Federal milk orders traditionally have viewed fluid use as having a higher value than manufacturing use. (This) Class I price mover reflects this philosophy by using the higher of the Class III or Class IV price for computing the Class I price. In some markets the use of a simple or even weighted average of the various manufacturing values may inhibit the ability of Class I handlers to procure milk supplies in competition with those plants that make the higher-valued of the manufactured products. Use of the higher of the Class III or Class IV price will make it more difficult to draw milk away from Class I uses for manufacturing.”
In essence, the new Class I pricing method has shown over the past 23 months that not only is the potential there for FMMOs to be in disarray, there is proof that it is happening.
Covington and others point to the hearing process — the normal vetting process for proposed FMMO changes. In this current situation, Congress made the decision to do what NMPF and IDFA asked, without hearings. Dairy farmers did not have a seat at the table. There was little industry discussion, and other organizations were assured that producers would be “held harmless” because the history showed the new method would be “revenue neutral.”
It became law without vetting, hearing, or comment, and has not been revenue neutral.
Covington is among those who strongly favor the hearing process and was concerned in 2018 that it was not being used to vet this Class I pricing method change.
“IThe administrative hearing avenue lets everyone have a seat at the table, to hear every side, put forth every possibility,” he says. “But this wasn’t done. It went through Congress. It was done quick. A hearing process gives time to study the outcome of a proposal. The things we are talking about now would have come out, and people would have said, ‘oh, we better think twice.’”
Not getting as much attention is what this change has done to risk management tools purchased by dairy farmers, which extension educators, consultants, government, everyone, have been urging producers to adopt.
The irony is that the change from ‘higher of’ to ‘average + 74 cents’ was done because NMPF and IDFA convinced Congress it was necessary so that milk buyers could manage their risk through forward contracting and hedging on the futures markets. But the result for dairy farmers — milk producers — is that their risk management has had a huge monkey wrench thrown into it and no good tools to address a new kind of risk in their blend price equation.
“Look what it did to risk management for dairy farmers,” Covington observes. “There is basically 25% of the milk sold in Class I. That’s 47 billion pounds last year. How much of that even participates in risk management? Is it 1%, 5%, 10%? My guess is a small amount. We need to look at the cost vs. benefit. Maybe some used it, but look at what it has done to dairy farmers and the incentive to move milk to Class I. What’s the trade-off?
“How many things are done to look at one small segment at risk of everyone else?” he asks. “It lowered the Class I price. That’s obvious. How much of that was passed on through at retail? When we look at retail, we get the highest retail milk price in Kansas City and the lowest in Wichita, and they are both in the same Federal Order. So, you can’t make rhyme or reason to it.”
Talking through some of the elements of how Class I sales to retail work, with most milk being sold private label, Covington’s involvement and experience is valued.
“It seems like the industry loses focus. We look at the newest thing out there, or the newest group, and forget about the majority. Most of the milk sold in this country is white milk in gallon jugs sold private label,” he observes.
Covington suggests that future Federal Order reform will come, and that even though the methodology of end-product pricing is sound, some of the factors going into it are at a point where evaluation is beneficial.
He weighs the difference between whether changes in Federal Orders are made through an administrative hearing process or through Congress, or a combination of the two, and suggests that the hearing process be included because it is how proposals are vetted.
“A good example is what is happening right now where the issue was not thoroughly heard and analyzed, and it happened so fast,” Covington relates. “How many people in Congress really knew what they did? If it can happen with something like this, what else can it happen to?” -30-